

Abstract
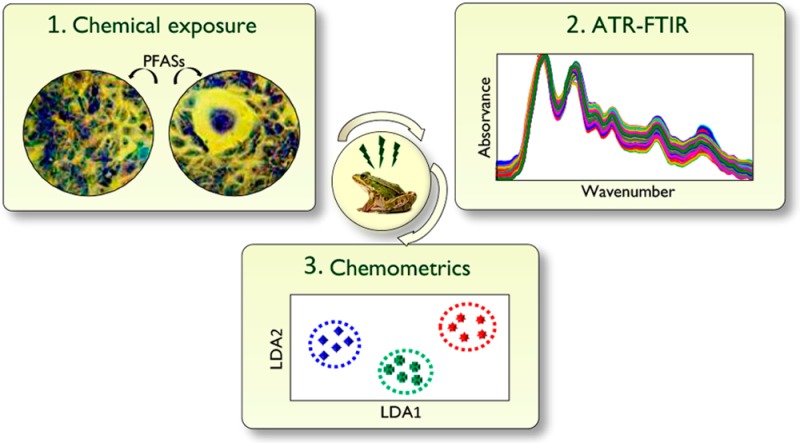
The effects of four perfluoroalkylated substances (PFASs), namely, perfluorobutanesulfonate (PFBS), perfluorooctanoic acid (PFOA), perfluorooctanesulfonate (PFOS), and perfluorononanoic acid (PFNA) were assessed in Xenopus laevis A6 kidney epithelial cells by attenuated total reflection Fourier-transform infrared (ATR-FTIR) spectroscopy and chemometric analysis. Principal component analysis–linear discriminant analysis (PCA-LDA) was used to visualize wavenumber-related alterations and ANOVA-simultaneous component analysis (ASCA) allowed data processing considering the underlying experimental design. Both analyses evidenced a higher impact of low-dose PFAS-treatments (10–9 M) on A6 cells forming monolayers, while there was a larger influence of high-dose PFAS-treatments (10–5 M) on A6 cells differentiated into dome structures. The observed dose–response PFAS-induced effects were to some extent related to their cytotoxicity: the EC50-values of most influential PFAS-treatments increased (PFOS < PFNA < PFOA ≪ PFBS), and higher-doses of these chemicals induced a larger impact. Major spectral alterations were mainly attributed to DNA/RNA, secondary protein structure, lipids, and fatty acids. Finally, PFOS and PFOA caused a decrease in A6 cell numbers compared to controls, whereas PFBS and PFNA did not significantly change cell population levels. Overall, this work highlights the ability of PFASs to alter A6 cells, whether forming monolayers or differentiated into dome structures, and the potential of PFOS and PFOA to induce cell death.
1. Introduction
Omic tools enable simultaneous and large-scale study of molecules of exposed organisms to extract underlying alterations caused by environmental stressors. State-of-the-art omic techniques include microarray-based and sequencing techniques,1 nuclear magnetic resonance spectroscopy,2 and mass spectrometry.3 However, another technique valid for omics, providing rapid and nondestructive analyses, is IR spectroscopy.4 Over the last few decades, IR has become a powerful methodology to study agriculture-related products and plant materials.5−7 Recently, IR has provided excellent results both in clinical research [e.g., discriminating benign from malignant tumors in tissue samples such as the breast,8 colon,9 lung,10 or prostate,11 and examining biofluids, including urine, saliva, serum, or whole blood]12−14 and in the environmental field.15−18 Because of its capacity to interrogate biochemical signals of stressed organisms, attenuated total reflection Fourier-transform IR (ATR-FTIR) spectroscopy shows great potential.
The use of ATR-FTIR spectroscopy to address biological questions is viable since biomolecules with chemical bonds having an electric dipole moment absorb in the mid-IR region through their vibrations, giving rise to a detailed biomolecular fingerprint in the form of an IR spectrum. The acquisition of such fingerprints allows subsequent spectral classification with computational methods and possibly permits biomarker detection.19,20 Various chemometric methods are suitable for IR data sets, both for exploratory or modeling purposes, including principal component analysis (PCA) and linear discriminant analysis (LDA).16,21,22 These methods allow data reduction to facilitate the identification of wavenumber-related spectral alterations associated with glycogen content, lipid content, conformational changes and phosphorylation characteristics in proteins or structural alterations in DNA/RNA.23,24 Another chemometric technique suited for the analysis of IR data sets, especially for those obtained in multifactorial designs, such as that hereby presented, is ANOVA-simultaneous component analysis (ASCA).25
Omic experiments focused on molecules with high environmental persistence [e.g., perfluoroalkylated substances (PFASs)] permit the investigation of unknown effects of xenobiotics in target organisms. Preferred doses of exposure are usually in the nanomolar scale, so as to reproduce real-world low-doses. PFASs represent a large group of compounds highly used in a variety of consumer products, very resistant to degradation and with a high accumulation potential.26,27 Concerns about PFASs have risen due to their widespread distribution and persistence in humans and the environment but also due to their toxicity and ability to act as endocrine-disrupting chemicals (EDCs)28 and obesogens.29 Some recent studies suggest a capacity of PFASs to alter cellular membrane lipids.30−32 Other biosystems might be affected by the presence of PFASs, such as the A6 cell line.
The renal epithelial A6 cell line was produced in 1969 from the renal uriniferous tubule of the adult African clawed frog Xenopus laevis.33 It expresses the properties of tight epithelium, renal distal tubules, and collecting ducts.34 At confluence, A6 cells can form an epithelial monolayer (Figure 1A,C,E) and spontaneously differentiate into a dome structure (Figure 1B,D,F).35 Renal epithelial cells are specialized for absorption or secretion, where the membrane facing the culture media is the apical membrane, the membrane attached to the plastic culture flask is the basement membrane, and the membrane lying along the basement surface is the basolateral membrane (Figure 1A,B). The apical membrane of A6 cells contains the epithelial Na+ channel (ENaC), while Na+/K+-ATPase is in the basolateral membrane.36 The incorporation of Na+ ions by ENaC and their expulsion into the extracellular space by Na+/K+-ATPases causes an accumulation of Na+ ions in the space between A6 cells and the plastic culture flask. Subsequent osmotic water inflow produces an elevation of the cell layer and results in a dome formation (Figure 1B),37 a structure easily seen by the microscope (Figure 1D,F). A6 cells forming domes have distinct physiological and structural properties (e.g., changes in the cytoskeleton)38 than A6 cells forming monolayers. Because it is easy to culture, the A6 cell line is commonly used in space studies, and several studies investigate the effects of gravitational forces on dome formation.35,37,39 However, little research has been conducted into the effects of xenobiotics on A6 cells as a toxicological model to simulate the effects on amphibians.
Figure 1.

Schematic representation of Xenopus laevis A6 kidney epithelial cells forming a monolayer (A) and a dome (B). Direct inversion images of Giemsa-stained A6 cells disposed on a monolayer (C) and forming a dome (D). Phase-contrast images of A6 cells disposed on a monolayer (E) and forming a dome (F). (Scale bars = 150 μm). (G) Experimental design for the study of PFAS-induced effects (refer to section 2.3). (d = day).
Within this context, the aim of this study was to examine the alterations induced in A6 cells, forming monolayers or differentiated into domes, exposed to four PFAS substances [i.e., perfluorobutanesulfonate (PFBS), perfluorooctanesulfonate (PFOS), perfluorooctanoic acid (PFOA), and perfluorononanoic acid (PFNA)], using ATR-FTIR spectroscopy and chemometric analysis [i.e., PCA-LDA and ASCA; see Supporting Information (ESI) for a short description of these methods]. In addition, a growth-curve experiment was developed to determine whether the four distinct PFAS-exposures differentially altered dose- and time-related cell number increases in culture.
2. Materials and Methods
2.1. Chemicals and Reagents
PFBS and PFOS were obtained from Fluka (Austria), whereas PFOA and PFNA were purchased from Sigma-Aldrich (Steinheim, Germany). Stock standard solutions and serially diluted test solutions were prepared in DMSO. Cell culture consumables were obtained from Invitrogen Life Technologies (Paisley, UK), unless otherwise stated.
2.2. Cell Culture and Treatment
Xenopus laevis A6 kidney epithelial cells were obtained from American Type Culture Collection (ATCC CCL-102). They were cultured in modified L15 culture medium consisting of 70% Leibovitz media, 19% Milli-Q water sterile filtered through a 0.2 μM syringe filter, 10% fetal bovine serum (FBS), and 1% penicillin/streptomycin, at 5% CO2 and 26 °C. Cells were trypsinized before the incorporation of cell aliquots for routine culture in T75 polystyrene flasks. Toward experiments, A6 cells were disaggregated, resuspended in complete medium, and then seeded in T25 flasks at a rate of 500,000 cells per flask whereupon they were grown for the time required depending on the experiment (see section 2.3). For PFAS-treatment, 25 μL of stock solutions were added to 5 mL of the culture medium so that final exposure-doses ranged from 0 to 10–5 M [considering 0 M as zero-dose control, in which cells were only exposed to the carrier solvent (DMSO)]. Following treatment, cells were disaggregated into cell suspensions and immediately fixed with 70% EtOH.
2.3. Experimental Design
The effects of the four PFAS substances were studied on A6 cells forming monolayers or domes in three distinct experiments [Figure 1G1,2,3]. In experiment 1 [Figure 1G1], PFAS-induced effects were evaluated in cells forming confluent monolayers. Toward this, cells were seeded for 1-day prior to PFAS-exposure for a further 1-day (2-day experiment) and final fixation. In this experiment, cells were exposed to chemicals at six concentrations (0, 10–9, 10–8, 10–7, 10–6, or 10–5 M). In experiments 2 and 3 [Figure 1G2,3, respectively], PFAS-effects were evaluated in cells forming domes (9-day experiment). However, the introduction of PFAS-treatment differed between them. In experiment 2 [Figure 1G2], following 1-day seeding and 1-day PFAS-exposure, the medium was aspirated and cells were grown for further 7 days in fresh medium, allowing dome formation, before final fixation. In contrast, in experiment 3 [Figure 1G3], cells were grown for 8 days to allow dome formation, followed by 1-day treatment exposure prior to fixation. In experiment 2, cells were PFAS-exposed at four concentrations (0, 10–9, 10–8, or 10–5 M), while in experiment 3, three concentrations (0, 10–8, or 10–5 M) were tested.
Five independent experiments were performed for each treatment at conditions 1 and 2 (i.e., 5 samples per category). Thus, the total number of samples was 120 (i.e., 5 experiments × 4 PFASs × 6 doses) and 80 (i.e., 5 experiments × 4 PFASs × 4 doses) at conditions 1 and 2, respectively. In the third conditions, two independent experiments were performed, giving 2 samples per category. Hence, the total number of samples in the latter case was 24 (i.e., 2 experiments × 4 PFASs × 3 doses). Low number of replicates was performed in experiment 3, as the results obtained are used to extract tentative conclusions about long-term PFAS-induced effects considering the physiological conditions of cells forming domes.
2.4. ATR-FTIR Spectroscopy
Cellular material in 70% EtOH was applied to 1 cm × 1 cm Low-E-reflective glass microscope slides (Kevley Technologies, Chesterland, OH, USA) (Figure 1G) and allowed to air-dry prior to storage in marked 30 mm Petri dishes kept in a desiccated environment until analysis. IR spectra were obtained using a Bruker Vector 22 FTIR spectrometer with a Helios ATR attachment containing an ≈250 μm × 250 μm aperture diamond crystal (Bruker Optics Ltd., Coventry, UK). The ATR crystal was cleaned with sodium dodecyl sulfate (SDS; Sigma Chemical Co.); a new background was taken prior the analysis of each new sample. From each treatment flask (generating one slide), 10 IR spectra were acquired from different locations across each sample. The spectral resolution was 8 cm–1 giving data spacing of 4 cm–1. Spectra were coadded for 32 scans; these were converted into absorbance units by Bruker OPUS software.
2.5. Spectral Preprocessing and Multivariate Data Analysis
Raw IR spectra obtained from exposed and control samples were preprocessed prior to chemometric analysis (see Figure S1). Initially, using OPUS software, IR spectra were individually cut to include only wavelengths between 1,800 and 900 cm–1 (235 wavenumbers at 4 cm–1 data spacing), the area associated with the biological spectral fingerprints. Then, the baseline of the resulting data set was corrected by applying Rubberband correction methods, and spectra were subsequently normalized to Amide I (i.e., 1,650 cm–1). Afterward, spectra were mean-centered, and finally, the class of the sample was defined.
2.5.1. Principal Component Analysis Plus Linear Discriminant Analysis (PCA-LDA)
PCA-LDA15,16,21,22 was applied to the spectral data sets using MATLAB 8.3.0 R2014a (The Math Works, Natick, MA, USA) and the IrootLab toolbox (http://irootlab.googlecode.com).40 As stated in the Theory section, PCA allows for the reduction of the number of variables in the spectral data set, whose small number of principal components (PCs) can capture 95% of the variance present in the original data set. In this study, the first 10 PCs were used. A total of 12 PCA-LDA analyses were performed, considering 4 PFASs and 3 experiments. For each model, the results of the analysis were visualized through one-dimensional (1-D) scores plots (Figure 2) and cluster vectors plots (see Figure S2). Scores plots were used to study dose–response effects of PFASs, by examining the proximity in multivariate distance between exposed and control samples. Primary wavenumbers important for such discrimination were visualized in cluster vectors plots.22,24
Figure 2.

One-D PCA-LDA score plots showing dose–response effects of PFBS, PFOA, PFOS, and PFNA in the three experiments. *Most discriminant PFAS-treatment compared to the control.
2.5.2. ANOVA-Simultaneous Component Analysis (ASCA)
ASCA25 (see ESI) was applied to three well-balanced spectral data sets (see Figure S3) by using PLS Toolbox 7.8 (eigenvector Research Inc., Wenatche, WA, USA) working in a MATLAB 8.3.0 R2014a environment (The Math Works, Natick, MA, USA). In these ASCA models, the effects of two categorical factors [i.e., type of chemical, with four levels (PFBS, PFOS, PFOA, or PFNA), and dose of exposure, with a number of levels differing among experiments (see section 2.3)] and interaction were studied. Statistical significances of the two factors and interaction were evaluated by a permutation test, using 10,000 permutations.41
2.6. Microscopic Images
2.6.1. Cell Fixation
A6 cells coming from 90% confluent T75 flasks were disaggregated, resuspended in complete medium, and seeded in plastic culture tissue coverslips (Sarstedt, USA) in 30 mm Petri dishes at a rate of 200,000 cells per Petri dish and allowed to attach overnight at 26 °C. Then, cells were grown for 2 days, when they formed a confluent monolayer, or for 9 days, when they formed domes. Finally, cells were fixed using 70% EtOH (40 min), washed twice with 70% EtOH, and kept at −4 °C until microscopy visualization.
2.6.2. Cell Staining
Cells fixed in the coverslips were air-dried for 24 h, transferred to new 30 mm Petri dishes containing 3 mL of a solution of 5% Giemsa (Sigma-Aldrich, UK), and left for 20 min. Then, the coverslips were washed twice with distilled water and allowed to air-dry. The coverslips were mounted directly onto the microscope.
2.6.3. Microscopy Instrumentation
A Nikon Coolpix 950 camera, mounted via a Nikon Coolpix MDC lens 0.82–0.29× adapter to a Nikon Eclipse TE300 inverted microscope, fitted with a Nikon Plan Apo 60×/1.20 water immersion objective was used to obtain images of Giemsa-stained cells (Figure 1C,D). Also, a confocal microscope, Leica DMIRE2 inverted microscope connected to a Leica TCS SP2 scan head and phase contrast settings, was used to obtain images of Figure 1E,F.
2.7. Determination of Cell Number
A6 cells were seeded at a ratio of 500,000 in T25 flasks in 5 mL of complete medium containing individual chemicals (PFBS, PFOS, PFOA, or PFNA) at concentrations of 10–9, 10–5, or 0 M (control). This point was taken as time zero (T0), and duplicate cell counts in triplicate flasks were acquired. These T0 cell counts (n = 6 per category) were averaged and normalized to 100%. Cells were washed, trypsinized, resuspended, and the cell number determined at indicated time points employing a hemocytometer. The acquired values for each experimental condition were averaged, and these contributed to the mean ± SD of the three separate experiments. Results were expressed as relative cell number [%; i.e., ratio of the cell number at the indicated time point relative to that determined at T0 (normalized to 100%) × 100].
3. Results
In the present study, IR data sets were first evaluated with 12 PCA-LDA models and further examined with 3 ASCA models. Initial PCA-LDA was performed to explore individual dose–response effects of each PFASs in the three experiments, whereas ASCA allowed data analysis considering the underlying experimental design. Results of both analyses are presented below.
3.1. Dose–Response Effects of Individual PFASs by PCA-LDA
Results of the 12 PCA-LDA (Figure 2) evidenced a distinct dose–response pattern in experiment 1 compared to experiments 2 and 3. In the first experiment, the highest distinction between treated and control cell populations was observed at the lowest concentration tested (10–9 M) in all PFAS-treatments. Conversely, higher PFAS concentrations were responsible for marked effects in experiments 2 and 3, especially in the latter conditions. A similar tendency was observed in the two last experiments: PFOS and PFNA caused in both conditions the highest alterations at 10–5 M, and PFOA produced the highest impact at low doses of 10–9 and 10–8 M in experiments 2 and 3, respectively. Only PFBS behaved inversely in these two experiments, producing major effects at the lowest dose tested (10–9 M) in experiment 2 and at the highest (10–5 M) in experiment 3. Primary wavenumbers important for discrimination of PFAS-treatments at the concentration producing more effects in the three experiments together with the molecular entities associated with them42 are shown in Table S1 and can be visualized in the cluster vectors plots of Figure S2.
3.2. Assessment of the Effects of Experimental Factors by ASCA
3.2.1. Split-Up of Variation
A first impression of the amount of variation related to the design factors can be obtained by separating this variation into contributions from the different factors. In this study, the statistical significances of the two categorical factors (i.e., chemical and dose) and of their interaction were evaluated separately in the three experiments (Table 1). Results of this evaluation were attributed to the dominant part of variation to natural variability (residuals ≥85%) and the minor part to factors and interaction (≤12%), observing higher effects in experiment 3. Results of the permutation test showed larger significances (p-values ≤0.05) of factors in experiments 1 and 2. Despite the observed small PFAS-induced effects on A6 cells, the good reproducibility of the ATR-FTIR technique allows the extraction of reliable conclusions about their impact on A6 cells in the present study.
Table 1. ASCA Modeling: Significance and Partitioning of the Total Variance into the Individual Terms Corresponding to Factors and Interactiona.
| experiment | factor | percentage of variationb | significance (p-value) |
|---|---|---|---|
| 1 | C | 2 | 1 × 10⁻³ |
| D | 3 | 1 × 10⁻³ | |
| C x D | 7 | 1 × 10⁻³ | |
| residuals | 89 | ||
| 2 | C | 2 | 4 × 10⁻³ |
| D | 3 | 1 × 10⁻³ | |
| C x D | 3 | 3 × 10⁻¹ | |
| residuals | 93 | ||
| 3 | C | 8 | 3 × 10⁻¹ |
| D | 8 | 8 × 10⁻² | |
| C x D | 12 | 8 × 10⁻² | |
| residuals | 85 |
C = chemical; D = dose.
Percentage of variation expressed as sums of squared deviations from the overall mean and not variances.
3.2.2. Factor “Chemical”
Scores of the first component of factor “chemical” [Tc values of equation S2] shown in Figure 3 indicate that chemicals producing more effects were PFOS, PFOA, and PFBS in experiments 1, 2, and 3, respectively. For data sets 1, 2, and 3, the first component explains 56%, 82%, and 90% of variation, respectively. Factor “chemical” was significant in experiments 1 and 2 (p-values of 1 × 10⁻³ and 4 × 10⁻³, respectively) but not significant in experiment 3 (p-value = 3 × 10⁻¹), according to the permutation test (Table 1).
Figure 3.

ASCA score plots of the first component for the factors “chemical” and “dose” of the three experiments. *Most discriminant factor levels.
3.2.3. Factor “Dose”
Scores of the first component of factor “dose” are shown in Figure 3 for data sets acquired in experiments 1, 2, and 3, respectively [Td values of equation S2]. For data sets 1, 2, and 3, the first component explains 78%, 93%, and 94% of variation, respectively. Scores of these figures indicate that concentrations of exposure producing more effects were 10–9, 10–9, and 10–5 M in experiments 1, 2, and 3, respectively. The results of the permutation test evidenced that the PFAS-dose was significant in experiments 1 and 2 with p-values of 1 × 10⁻³ and 1 × 10⁻³, respectively, but not significant in experiment 3, with a p-value of 8 × 10⁻² (Table 1).
3.2.4. Interaction “Chemical × Dose”
Scores of the first component of the interaction showed no pattern related to the interaction of factors: there was no increasing or decreasing trend of scores of the different doses of exposure respect to the chemical treatment. For this reason, the plot of these scores is not provided in this study.
3.3. Cell Number with Time in Culture with Exposure to PFASs
The effects of the four PFASs on the increases in A6 cell number are shown in Figure 4. The behavior observed was similar between pairs of chemicals PFBS and PFNA vs PFOS and PFOA. For the first two chemicals, following 24-h or 48-h treatment, no marked differences in cell population were observed with respect to the control. However, 24-h and 48-h treatments with PFOS and PFOA caused a significant decrease in cell number, which became higher with time and gave rise to maximum cell depletion after 48 h of exposure.
Figure 4.

Effects of PFBS, PFNA, PFOS, and PFOA on dose- and time-related cell number increases in culture.
4. Discussion
Our study evidenced a primary effect of low-dose (10–9 M) PFAS-treatment on A6 cells forming monolayers (experiment 1) (Figure 2). Predominant effects of environmental stressors at low-doses of exposure have often been reported in the literature,43−46 especially for EDCs, such as PFASs. A review by Vandenberg et al.47 reported two concepts associated with EDCs: first, “big effects at low doses”, a theory primarily defined by the National Toxicology Program (http://ntp.niehs.nih.gov/), and second, the “nonmonotonicity” (i.e., nonlinear relationship between dose and effect) thus declaring the dogma “the dose makes the poison” open to question. It is important to stress that our findings in experiment 1 (cells forming a monolayer) followed this low-dose theory, while results of experiments 2 and 3 (cells differentiated into dome structures) showed an opposing tendency (major alterations at high doses). Such differences can be explained by the specific physiological status of cells forming monolayers or domes, the latter having enhanced cell excretion function and requiring higher PFAS-doses to produce an effect. Also, the differential dose–response effects of PFAS substances depending on cell differentiation status were to some extent related to the cytotoxicity of most influential chemicals (according to ASCA results) in each experiment. Considering the median effective doses (EC50) of PFASs reported in a previous study on JEG-3 cells30 [i.e., PFOS (107–125 μM) < PFNA (213–220 μM) < PFOA (594–647 μM) ≪ PFBS (n.d.)], it was observed that major effects in experiment 1 (primarily influenced by high-cytotoxic PFOS) occurred at low doses, whereas larger effects in experiments 2 and 3 (primarily influenced by less-cytotoxic PFOA and PFBS, respectively) were observed at higher doses. Considering overall effects, a greater impact of PFAS substances was evident in experiment 3, presenting the treated samples to maximum cluster segregation compared to that of the control in 1-D PCA-LDA score plots (Figure 2). The higher effects of PFAS substances in experiment 3 vs experiment 2 might be attributed to a cellular recuperation after the chemical stress possible in the second conditions since cells were allowed to grow for 7 days in fresh medium after PFAS-exposure, a time that cells might use to eliminate those PFAS substances previously incorporated.48
Interestingly, distinct spectral alterations were induced by PFAS substances in the three experiments, suggesting three mechanisms of action of the chemicals depending on cell differentiation (i.e., monolayer or dome), moment of exposure (i.e., pre- or postdome formation), and cell population. In experiment 1, all PFAS substances produced alterations associated with DNA/RNA (e.g., νsPO2–) (see Figure S2 and Table S1). The observed alterations in DNA/RNA are suggestive of a genotoxic insult. In fact, PFOA and PFNA are suspected genotoxic carcinogens through induction of reactive oxygen species that are responsible for oxidative DNA damage. Recently, Yahia et al.49 demonstrated that PFOA and PFNA induced DNA damage in TK6 cells, observing that PFNA produced high levels of 8-hydroxy-2′-deoxyguanosine (8-OhdG), a biomarker of oxidative DNA damage. In contrast, in experiment 2, all PFAS substances caused alterations associated with secondary structures of proteins (Amide I, Amide II, and Amide III) (see Figure S2 and Table S1). The alteration of proteins observed under conditions 2 (9-day experiment) might be attributed to a direct consequence of the effects produced on DNA in the first conditions (2-day experiment) since effects on DNA are ultimately expressed in the proteins that it encodes. In experiment 3, all PFAS substances produced alterations associated with fatty acids (see Figure S2 and Table S1). In this experiment, one could expect similar effects as in experiment 1 since in both cases cells are analyzed right after PFAS exposure. However, the observed differences might be attributed to the different numbers of cells between both experiments and their dissimilar physiological properties (i.e., monolayer vs domes). Continuing with the study of distinguishing features induced by PFAS treatments, special attention was focused on lipids, due to the reported capacity of PFAS substances to alter lipid species of cellular membranes. A previous study performed on human placental chroriocarcinoma JEG-3 cells exposed to a mixture of eight PFAS substances by LC-MS32 revealed that increased levels of the major components of cell membranes [i.e., phosphatidylcholine (PC), lyso plasmalogen PC, and plasmalogen PC] and a relatively low increase in triacylglicerols (TAG) were induced by PFAS substances. Similarly, our findings showed some effects of PFAS on lipids of A6 cells. As observed in Table S1, in experiment 1 PFOS and PFOA produced effects at 1,736 cm–1 (C=O stretching lipids) and at 1,444 cm–1 (lipids), respectively, and in experiment 2 PFBS induced alterations at 1,750 cm–1, associated with a C=C stretching in lipids, as occurred with cells exposed to PFNA in experiment 3. The findings of this study demonstrate that PFAS substances pose a significant effect on the metabolome and lipidome of Xenopus laevis A6 cells. However, more information is needed in order to detect and identify potential biomarkers of lipid and metabolite disruption and to find most altered biochemical pathways, and future studies should focus on this point. Liquid chromatography coupled to high resolution mass spectrometry (LC-HRMS) techniques, which enable the analysis of compounds at low doses with high accuracy mass determination, are highly suitable for such purposes. Moreover, the fusion of IR data with LC-MS data is also worthy since it can provide a more comprehensive knowledge of the effects of PFAS substances in this amphibian cell model.
Finally, results of the growth-curve experiment showed different responses of A6 cells exposed to PFBS/PFNA compared to PFOS/PFOA (Figure 4). PFBS and PFNA did not induce distinguishable A6 cell proliferation or depletion compared to those of the control. In contrast, PFOS and PFOA induced a decrease in A6 cell number compared to that of the control, in a time- and dose-specific manner: after 48 h of treatment, a time when the two PFAS substances presented maximum effects, high-dose PFOS produced the most profound cell decreases, whereas low-dose PFOA caused the maximum decline in cell population. The capacity of PFOS and PFOA to inhibit cell proliferation has been reported in other studies. Recently, Cui et al.50 found that 80% inhibitory concentration (IC80) of PFOA (150.97 μg/mL) and 50% inhibitory concentration (IC50) of PFOS (27.92 μg/mL) blocked cell cycle and proliferation of Zebrafish (Danio rerio) liver cells (ZFL). Also, other studies showed PFOA capacity to induce apoptosis in hepatoma HepG2 cells.51,52
Overall, this work contributes to the better knowledge of PFAS substance effects on Xenopus laevis A6 kidney epithelial cells indicating an overall interference with DNA/RNA, secondary structures of proteins, lipids, and fatty acids at concentrations well below those associated with other adverse effects, such as cytotoxicity or endocrine disruption. This work also highlights (a) the differential effects of PFAS substances depending on cell-differentiation, presenting a nonmonotonic-behavior on A6 cells forming monolayers and (b) the ability of PFOS and PFOA to induce cell death.
Acknowledgments
We thank Debbie Hurst for support with microscopy instrumentation, Rebecca Strong for cell culture assistance, and Kirsi Liimatainen for her contribution to the discussion.
Glossary
Abbreviations
- ASCA
ANOVA-simultaneous component analysis
- ATCC
American Type Culture Collection
- ATR-FTIR
attenuated total reflection Fourier-transform IR
- EC50
median effective dose
- EDCs
endocrine-disrupting chemicals
- ENaC
epithelial Na+ channel
- FBS
fetal bovine serum
- IC50
50% inhibitory concentration
- IC80
80% inhibitory concentration
- LDA
linear discriminant analysis
- 8-OhdG
8-hydroxy-2′-deoxyguanosine
- PC
phosphatidylcholine
- PCA
principal component analysis
- 1-D PCA-LDA
one-dimensional principal component analysis plus linear discriminant analysis
- PCs
principal components
- PFASs
perfluoroalkylated substances
- PFBS
perfluorobutanesulfonate
- PFNA
perfluorononanoic acid
- PFOA
perfluorooctanoic acid
- PFOS
perfluorooctanesulfonate
- SDS
sodium dodecyl sulfate
- TAG
triacylglicerols
Supporting Information Available
The Supporting Information is available free of charge on the ACS Publications website at DOI: 10.1021/acs.chemrestox.6b00076.
Theory section including a short description of PCA-LDA and ASCA methods, supplementary figures showing spectral preprocessing, PCA-LDA cluster vectors plots, structure of ASCA data sets, and a table containing principal segregating wavenumbers derived from PCA-LDA (PDF)
The research leading to these results has received funding from the European Research Council under the European Union’s Seventh Framework Programme (FP/2007-2013)/ERC Grant Agreement n. 320737. The research of the first author is supported by a predoctoral FPU scholarship (FPU13/04384) from the Spanish Government (Ministerio de Educación, Cultura y Deporte). Research in F.L.M.’s laboratory is supported by Rosemere Cancer Foundation.
The authors declare no competing financial interest.
Supplementary Material
References
- Campos B.; Garcia-Reyero N.; Rivetti C.; Escalon L.; Habib T.; Tauler R.; Tsakovski S.; Piña B.; Barata C. (2013) Identification of metabolic pathways in Daphnia magna explaining hormetic effects of selective serotonin reuptake inhibitors and 4-nonylphenol using transcriptomic and phenotypic responses. Environ. Sci. Technol. 47, 9434–9443. 10.1021/es4012299. [DOI] [PubMed] [Google Scholar]
- Kim H. K.; Choi Y. H.; Verpoorte R. (2011) NMR-based plant metabolomics: where do we stand, where do we go?. Trends Biotechnol. 29, 267–275. 10.1016/j.tibtech.2011.02.001. [DOI] [PubMed] [Google Scholar]
- Griffiths W. J.; Wang Y. (2009) Mass spectrometry: from proteomics to metabolomics and lipidomics. Chem. Soc. Rev. 38, 1882–1896. 10.1039/b618553n. [DOI] [PubMed] [Google Scholar]
- Cozzolino D. (2012) Benefits and Limitations of Infrared Technologies in Omics Research and Development of Natural Drugs and Pharmaceutical Products. Drug Dev. Res. 73, 504–512. 10.1002/ddr.21043. [DOI] [Google Scholar]
- Lobartini J. C.; Tan K. H.; Rema J. A.; Gingle A. R.; Pape C.; Himmelsbach D. S. (1992) The geochemical nature and agricultural importance of commercial humic matter. Sci. Total Environ. 113, 1–15. 10.1016/0048-9697(92)90013-I. [DOI] [Google Scholar]
- Stewart D. (1996) Fourier Transform Infrared Microspectroscopy of Plant Tissues. Appl. Spectrosc. 50, 357–365. 10.1366/0003702963906384. [DOI] [Google Scholar]
- Kacuráková M. (2000) FT-IR study of plant cell wall model compounds: pectic polysaccharides and hemicelluloses. Carbohydr. Polym. 43, 195–203. 10.1016/S0144-8617(00)00151-X. [DOI] [Google Scholar]
- Walsh M. J.; Holton S. E.; Kajdacsy-Balla A.; Bhargava R. (2012) Attenuated total reflectance Fourier-transform infrared spectroscopic imaging for breast histopathology. Vib. Spectrosc. 60, 23–28. 10.1016/j.vibspec.2012.01.010. [DOI] [PMC free article] [PubMed] [Google Scholar]
- Kallenbach-Thieltges A.; Großerüschkamp F.; Mosig A.; Diem M.; Tannapfel A.; Gerwert K. (2013) Immunohistochemistry, histopathology and infrared spectral histopathology of colon cancer tissue sections. J. Biophotonics 6, 88–100. 10.1002/jbio.201200132. [DOI] [PubMed] [Google Scholar]
- Bird B.; Miljković M. S.; Remiszewski S.; Akalin A.; Kon M.; Diem M. (2012) Infrared spectral histopathology (SHP): a novel diagnostic tool for the accurate classification of lung cancer. Lab. Invest. 92, 1358–1373. 10.1038/labinvest.2012.101. [DOI] [PubMed] [Google Scholar]
- Theophilou G.; Lima K. M. G.; Briggs M.; Martin-Hirsch P. L.; Stringfellow H. F.; Martin F. L. (2015) A biospectroscopic analysis of human prostate tissue obtained from different time periods points to a trans-generational alteration in spectral phenotype. Sci. Rep. 5, 13465. 10.1038/srep13465. [DOI] [PMC free article] [PubMed] [Google Scholar]
- Scaglia E.; Sockalingum G. D.; Schmitt J.; Gobinet C.; Schneider N.; Manfait M.; Thiéfin G. (2011) Noninvasive assessment of hepatic fibrosis in patients with chronic hepatitis C using serum Fourier transform infrared spectroscopy. Anal. Bioanal. Chem. 401, 2919–2925. 10.1007/s00216-011-5402-8. [DOI] [PubMed] [Google Scholar]
- Hands J. R.; Abel P.; Ashton K.; Dawson T.; Davis C.; Lea R. W.; McIntosh A. J. S.; Baker M. J. (2013) Investigating the rapid diagnosis of gliomas from serum samples using infrared spectroscopy and cytokine and angiogenesis factors. Anal. Bioanal. Chem. 405, 7347–7355. 10.1007/s00216-013-7163-z. [DOI] [PubMed] [Google Scholar]
- Gajjar K.; Trevisan J.; Owens G.; Keating P. J.; Wood N. J.; Stringfellow H. F.; Martin-Hirsch P. L.; Martin F. L. (2013) Fourier-transform infrared spectroscopy coupled with a classification machine for the analysis of blood plasma or serum: a novel diagnostic approach for ovarian cancer. Analyst 138, 3917–3926. 10.1039/c3an36654e. [DOI] [PubMed] [Google Scholar]
- Llabjani V.; Jones K. C.; Thomas G. O.; Walker L. A.; Shore R. F.; Martin F. L. (2009) Polybrominated Diphenyl Ether-Associated Alterations in Cell Biochemistry as Determined by Attenuated Total Reflection Fourier-Transform Infrared Spectroscopy: a Comparison with DNA-Reactive and/or Endocrine-Disrupting Agents. Environ. Sci. Technol. 43, 3356–3364. 10.1021/es8036127. [DOI] [PubMed] [Google Scholar]
- Llabjani V.; Trevisan J.; Jones K. C.; Shore R. F.; Martin F. L. (2010) Binary mixture effects by PBDE congeners (47, 153, 183, or 209) and PCB congeners (126 or 153) in MCF-7 cells: biochemical alterations assessed by IR spectroscopy and multivariate analysis. Environ. Sci. Technol. 44, 3992–3998. 10.1021/es100206f. [DOI] [PubMed] [Google Scholar]
- Pang W.; Li J.; Ahmadzai A. A.; Heppenstall L. D.; Llabjani V.; Trevisan J.; Qiu X.; Martin F. L. (2012) Identification of benzo[a]pyrene-induced cell cycle-associated alterations in MCF-7 cells using infrared spectroscopy with computational analysis. Toxicology 298, 24–29. 10.1016/j.tox.2012.04.009. [DOI] [PubMed] [Google Scholar]
- Li J.; Strong R.; Trevisan J.; Fogarty S. W.; Fullwood N. J.; Jones K. C.; Martin F. L. (2013) Dose-related alterations of carbon nanoparticles in mammalian cells detected using biospectroscopy: potential for real-world effects. Environ. Sci. Technol. 47, 10005–10011. 10.1021/es4017848. [DOI] [PubMed] [Google Scholar]
- Ollesch J.; Drees S. L.; Heise H. M.; Behrens T.; Brüning T.; Gerwert K. (2013) FTIR spectroscopy of biofluids revisited: an automated approach to spectral biomarker identification. Analyst 138, 4092–4102. 10.1039/c3an00337j. [DOI] [PubMed] [Google Scholar]
- Baker M. J.; Trevisan J.; Bassan P.; Bhargava R.; Butler H. J.; Dorling K. M.; Fielden P. R.; Fogarty S. W.; Fullwood N. J.; Heys K. A.; Hughes C.; Lasch P.; Martin-Hirsch P. L.; Obinaju B.; Sockalingum G. D.; Sulé-Suso J.; Strong R. J.; Walsh M. J.; Wood B. R.; Gardner P.; Martin F. L. (2014) Using Fourier transform IR spectroscopy to analyze biological materials. Nat. Protoc. 9, 1771–1791. 10.1038/nprot.2014.110. [DOI] [PMC free article] [PubMed] [Google Scholar]
- Fearn T. (2006) Discriminant Analysis, in Handbook of Vibrational Spectroscopy (Griffiths J. M. C., Ed.) pp 2086–2093, Springer, New York. 10.1002/0470027320.s4302 [DOI] [Google Scholar]
- Walsh M. J.; Singh M. N.; Pollock H. M.; Cooper L. J.; German M. J.; Stringfellow H. F.; Fullwood N. J.; Paraskevaidis E.; Martin-Hirsch P. L.; Martin F. L. (2007) ATR microspectroscopy with multivariate analysis segregates grades of exfoliative cervical cytology. Biochem. Biophys. Res. Commun. 352, 213–219. 10.1016/j.bbrc.2006.11.005. [DOI] [PubMed] [Google Scholar]
- Martin F. L.; German M. J.; Wit E.; Fearn T.; Ragavan N.; Pollock H. M. (2007) Identifying variables responsible for clustering in discriminant analysis of data from infrared microspectroscopy of a biological sample. J. Comput. Biol. 14, 1176–1184. 10.1089/cmb.2007.0057. [DOI] [PubMed] [Google Scholar]
- Martin F. L.; Kelly J. G.; Llabjani V.; Martin-Hirsch P. L.; Patel I. I.; Trevisan J.; Fullwood N. J.; Walsh M. J. (2010) Distinguishing cell types or populations based on the computational analysis of their infrared spectra. Nat. Protoc. 5, 1748–1760. 10.1038/nprot.2010.133. [DOI] [PubMed] [Google Scholar]
- Smilde A. K.; Jansen J. J.; Hoefsloot H. C. J.; Lamers R.-J. A. N.; van der Greef J.; Timmerman M. E. (2005) ANOVA-simultaneous component analysis (ASCA): a new tool for analyzing designed metabolomics data. Bioinformatics 21, 3043–3048. 10.1093/bioinformatics/bti476. [DOI] [PubMed] [Google Scholar]
- Stahl T.; Mattern D.; Brunn H. (2011) Toxicology of perfluorinated compounds. Environ. Sci. Eur. 23, 38–89. 10.1186/2190-4715-23-38. [DOI] [Google Scholar]
- Manzetti S.; van der Spoel E. R.; van der Spoel D. (2014) Chemical properties, environmental fate, and degradation of seven classes of pollutants. Chem. Res. Toxicol. 27, 713–737. 10.1021/tx500014w. [DOI] [PubMed] [Google Scholar]
- Du G.; Huang H.; Hu J.; Qin Y.; Wu D.; Song L.; Xia Y.; Wang X. (2013) Endocrine-related effects of perfluorooctanoic acid (PFOA) in zebrafish, H295R steroidogenesis and receptor reporter gene assays. Chemosphere 91, 1099–1106. 10.1016/j.chemosphere.2013.01.012. [DOI] [PubMed] [Google Scholar]
- Hines E. P.; White S. S.; Stanko J. P.; Gibbs-Flournoy E. A.; Lau C.; Fenton S. E. (2009) Phenotypic dichotomy following developmental exposure to perfluorooctanoic acid (PFOA) in female CD-1 mice: Low doses induce elevated serum leptin and insulin, and overweight in mid-life. Mol. Cell. Endocrinol. 304, 97–105. 10.1016/j.mce.2009.02.021. [DOI] [PubMed] [Google Scholar]
- Gorrochategui E.; Pérez-Albaladejo E.; Casas J.; Lacorte S.; Porte C. (2014) Perfluorinated chemicals: differential toxicity, inhibition of aromatase activity and alteration of cellular lipids in human placental cells. Toxicol. Appl. Pharmacol. 277, 124–130. 10.1016/j.taap.2014.03.012. [DOI] [PubMed] [Google Scholar]
- Gorrochategui E.; Casas J.; Pérez-Albaladejo E.; Jáuregui O.; Porte C.; Lacorte S. (2014) Characterization of complex lipid mixtures in contaminant exposed JEG-3 cells using liquid chromatography and high-resolution mass spectrometry. Environ. Sci. Pollut. Res. 21, 11907–11916. 10.1007/s11356-014-3172-5. [DOI] [PubMed] [Google Scholar]
- Gorrochategui E.; Casas J.; Porte C.; Lacorte S.; Tauler R. (2015) Chemometric strategy for untargeted lipidomics: biomarker detection and identification in stressed human placental cells. Anal. Chim. Acta 854, 20–33. 10.1016/j.aca.2014.11.010. [DOI] [PubMed] [Google Scholar]
- Rafferty K. A. Jr.; Sherwin R. W. (1969) The length of secondary chromosomal constrictions in normal individuals and in a nucleolar mutant of Xenopus laevis. Cytogenet. Genome Res. 8, 427–438. 10.1159/000130054. [DOI] [PubMed] [Google Scholar]
- Perkins F. M.; Handler J. S. (1981) Transport properties of toad kidney epithelia in culture. Am. J. Physiol.: Cell Physiol. 241, 154–159. [DOI] [PubMed] [Google Scholar]
- Ichigi J.; Asashima M. (2001) Dome formation and tubule morphogenesis by Xenopus kidney A6 cell cultures exposed to microgravity simulated with a 3D-clinostat and to hypergravity. In Vitro Cell. Dev. Biol.: Anim. 37, 31–44. 10.1290/1071-2690(2001)037<0031:DFATMB>2.0.CO;2. [DOI] [PubMed] [Google Scholar]
- Kellenberger S.; Schild L. (2002) Epithelial Sodium Channel/Degenerin Family of Ion Channels: A Variety of Functions for a Shared Structure. Physiol. Rev. 82, 735–767. 10.1152/physrev.00007.2002. [DOI] [PubMed] [Google Scholar]
- Ikuzawa M.; Akiduki S.; Asashima M. (2007) Gene expression profile of Xenopus A6 cells cultured under random positioning machine shows downregulation of ion transporter genes and inhibition of dome formation. Adv. Space Res. 40, 1694–1702. 10.1016/j.asr.2007.08.014. [DOI] [Google Scholar]
- Rehn M.; Weber W. M.; Clauss W. (1998) Role of the cytoskeleton in stimulation of Na+ channels in A6 cells by changes in osmolality. Pfluegers Arch. 436, 270–279. 10.1007/PL00008083. [DOI] [PubMed] [Google Scholar]
- Tanaka M.; Asashima M.; Atomi Y. (2003) Proliferation and differentiation of Xenopus A6 cells under hypergravity as revealed by time-lapse imaging. In Vitro Cell. Dev. Biol.: Anim. 39, 71–79. 10.1290/1543-706X(2003)039<0071:PADOXA>2.0.CO;2. [DOI] [PubMed] [Google Scholar]
- Trevisan J.; Angelov P. P.; Scott A. D.; Carmichael P. L.; Martin F. L. (2013) IRootLab: a free and open-source MATLAB toolbox for vibrational biospectroscopy data analysis. Bioinformatics 29, 1095–1097. 10.1093/bioinformatics/btt084. [DOI] [PubMed] [Google Scholar]
- Vis D. J.; Westerhuis J. A.; Smilde A. K.; van der Greef J. (2007) Statistical validation of megavariate effects in ASCA. BMC Bioinf. 8, 322–329. 10.1186/1471-2105-8-322. [DOI] [PMC free article] [PubMed] [Google Scholar]
- Movasaghi Z.; Rehman S.; ur Rehman D. I. (2008) Fourier Transform Infrared (FTIR) Spectroscopy of Biological Tissues. Appl. Spectrosc. Rev. 43, 134–179. 10.1080/05704920701829043. [DOI] [Google Scholar]
- Lawrence J. E.; Lamm S. H.; Pino S.; Richman K.; Braverman L. E. (2000) The effect of short-term low-dose perchlorate on various aspects of thyroid function. Thyroid 10, 659–663. 10.1089/10507250050137734. [DOI] [PubMed] [Google Scholar]
- Witorsch R. J. (2002) Low-dose in utero effects of xenoestrogens in mice and their relevance to humans: an analytical review of the literature. Food Chem. Toxicol. 40, 905–912. 10.1016/S0278-6915(02)00069-8. [DOI] [PubMed] [Google Scholar]
- vom Saal F. S.; Hughes C. (2005) An extensive new literature concerning low-dose effects of bisphenol A shows the need for a new risk assessment. Environ. Health Perspect. 113, 926–933. 10.1289/ehp.7713. [DOI] [PMC free article] [PubMed] [Google Scholar]
- Kamrin M. A. (2007) The “low dose” hypothesis: validity and implications for human risk. Int. J. Toxicol. 26, 13–23. 10.1080/10915810601117968. [DOI] [PubMed] [Google Scholar]
- Vandenberg L. N.; Colborn T.; Hayes T. B.; Heindel J. J.; Jacobs D. R.; Lee D.-H.; Shioda T.; Soto A. M.; vom Saal F. S.; Welshons W. V.; Zoeller R. T.; Myers J. P. (2012) Hormones and endocrine-disrupting chemicals: low-dose effects and nonmonotonic dose responses. Endocr. Rev. 33, 378–455. 10.1210/er.2011-1050. [DOI] [PMC free article] [PubMed] [Google Scholar]
- Han X.; Nabb D. L.; Russell M. H.; Kennedy G. L.; Rickard R. W. (2012) Renal elimination of perfluorocarboxylates (PFCAs). Chem. Res. Toxicol. 25, 35–46. 10.1021/tx200363w. [DOI] [PubMed] [Google Scholar]
- Yahia D.; Haruka I.; Kagashi Y.; Tsuda S. (2016) 8-Hydroxy-2′-deoxyguanosine as a biomarker of oxidative DNA damage induced by perfluorinated compounds in TK6 cells. Environ. Toxicol. 31, 192–200. 10.1002/tox.22034. [DOI] [PubMed] [Google Scholar]
- Cui Y.; Liu W.; Xie W.; Yu W.; Wang C.; Chen H. (2015) Investigation of the Effects of Perfluorooctanoic Acid (PFOA) and Perfluorooctane Sulfonate (PFOS) on Apoptosis and Cell Cycle in a Zebrafish (Danio rerio) Liver Cell Line. Int. J. Environ. Res. Public Health 12, 15673–15682. 10.3390/ijerph121215012. [DOI] [PMC free article] [PubMed] [Google Scholar]
- Shabalina I. G. (1999) Effects of the rodent peroxisome proliferator and hepatocarcinogen, perfluorooctanoic acid, on apoptosis in human hepatoma HepG2 cells. Carcinogenesis 20, 2237–2246. 10.1093/carcin/20.12.2237. [DOI] [PubMed] [Google Scholar]
- Panaretakis T.; Shabalina I. G.; Grandér D.; Shoshan M. C.; DePierre J. W. (2001) Reactive oxygen species and mitochondria mediate the induction of apoptosis in human hepatoma HepG2 cells by the rodent peroxisome proliferator and hepatocarcinogen, perfluorooctanoic acid. Toxicol. Appl. Pharmacol. 173, 56–64. 10.1006/taap.2001.9159. [DOI] [PubMed] [Google Scholar]
Associated Data
This section collects any data citations, data availability statements, or supplementary materials included in this article.