Abstract
Background and aims
The relationship between dietary macronutrient composition and appetite is controversial. We examined the effects of a yearlong low-carbohydrate diet compared to a low-fat diet on appetite-related hormones and self-reported change in appetite.
Methods and results
A total of 148 adults with a body mass index 30–45 kg/m2, who were free of diabetes, cardiovascular disease and chronic kidney disease at baseline were randomly assigned to either a low-carbohydrate diet (carbohydrate [excluding dietary fiber]<40 g/day; N=75) or a low-fat diet (<30% energy from fat, <7% from saturated fat; N=73). Participants in both groups attended individual and group dietary counseling sessions where they were provided the same behavioral curriculum and advised to maintain baseline levels of physical activity. Appetite and appetite-related hormones were measured at 0, 3, 6 and 12 months of intervention. At 12 months, mean changes (95% CI) in peptide YY were −34.8 pg/mL (−41.0 to −28.6) and in the low-carbohydrate group and −44.2 pg/mL (−50.4 to −38.0) in the low-fat group (net change: 9.4 pg/mL [0.6 to 18.2 pg/mL]; p=0.036). Approximately 99% of dietary effects on peptide YY are explained by differences in dietary macronutrient content. There was no difference in change in ghrelin or self-reported change in appetite between the groups.
Conclusions
A low-fat diet reduced peptide YY more than a low-carbohydrate diet. These findings suggest that satiety may be better preserved on a low-carbohydrate diet, as compared to a low fat diet.
INTRODUCTION
Manipulations of the macronutrient contents of diet, in particular restriction of carbohydrate and fat, have been used extensively for weight loss and weight control in the past several decades. It is unclear whether reduction in body weight due to restrictions in either carbohydrate or fat results from changes in appetite or appetite-related hormones. Appetite is a complex phenomenon influenced by both behavioral and biological characteristics. A variety of peptides synthesized and released from the gastrointestinal tract are important regulators of appetite. For example, ghrelin is secreted from the stomach and functions as an appetite signal that increases hunger, stimulates food intake and decreases fat utilization in adipose tissue [1–3]. In contrast, peptide YY is released from the distal small intestine and colon after meals, and reduces appetite by increasing satiety [4,5]. Weight loss increases appetite stimulating hormones such as ghrelin and decreases satiety hormones such as PYY [6–8]. Measurement of these appetite-related hormones may provide novel and objective insights into the effects of dietary changes on biological markers of appetite [9].
Low-carbohydrate diets have been effective for weight loss and weight management [10–14]. Previous studies of low-carbohydrate diets provide some evidence that these diets may reduce appetite measured by self-report [15–19], while a few small studies (N<50) have shown the opposite [20–22]. A recent meta-analysis on the topic concluded that ketogenic low-carbohydrate diets reduce appetite slightly from baseline measures, but comparison with a non-ketogenic diet as control group was not possible due to the small number of studies with such control groups which met inclusion criteria [23]. The mechanisms of potential reduction in appetite are unclear but may involve appetite-related hormones. To date, data on the effects of carbohydrate restriction on appetite-related hormones are scarce, limited to a few small, short-term studies [24,25]. The purpose of this study is to examine whether macronutrient composition of weight loss diets affects appetite and its regulation as reflected in levels of these appetite hormones, and to what degree these effects are independent of weight loss itself. Therefore, we examined the effects of a 12-month low-carbohydrate diet compared to a low-fat diet on both appetite-related hormones and self-reported change in appetite using data from a parallel, randomized, controlled trial among 148 obese adults.
SUBJECTS AND METHODS
Study Participants
Obese adults were recruited by newspaper and television advertisements, mass mailings and e-mailings in the Greater New Orleans Area. Participants were eligible if they had a body mass index of 30 to 45 kg/m2 and were 22 to 75 years of age. Individuals who were pregnant or who had type-2 diabetes, cardiovascular disease or chronic renal disease at baseline were not enrolled in the study. All procedures were approved by the Institutional Review Board of Tulane University Health Sciences Center and all participants provided written informed consent.
Study Protocol
The study design has been described in detail elsewhere [26]. In brief, this trial was designed to examine the effects of a low-carbohydrate diet on body weight and cardiovascular risk factors. One hundred and forty-eight participants were randomly assigned to follow either a low-carbohydrate diet which restricted intake of digestible carbohydrate (total carbohydrate minus total fiber) to <40 grams/day (N=75), or a low-fat diet which restricted total and saturated fat intake to <30% and <7%of daily energy (N=73), respectively [27,28]. Participants attended individual dietary counseling sessions weekly for the first month, followed by small group sessions every other week for 5 months, and monthly sessions for the remaining 6 months. During counseling sessions, participants met with a study dietitian, obtained optional recipes, and received supportive counseling. The same behavioral curriculum, including information on dietary fiber (recommended intake of 25 g/d) and types of dietary fats, was provided to both groups and was not altered over the course of the intervention. These common instructions emphasized the benefits of monounsaturated fats and recommend limiting or eliminating trans fats. Participants were advised to maintain their baseline levels of physical activity, which was assessed using validated measures at each follow-up visit.
A detailed medical history, and information on medication use and lifestyle risk factors was obtained at baseline by trained study personnel [26]. Body weight and other measures were obtained at baseline and each follow-up visit using standardized methods [26]. Two 24-hour dietary recalls were obtained from each participant by a certified study dietitian at baseline and at each of follow-up examination. One recall was collected on a week day and the other on a weekend day. For the purposes of quality control, 5% of recalls were recorded for review. Dietary nutrient intakes were calculated using the food composition tables included in the Nutrition Data System for Research software [29].
Measurement of outcome variables
Blood samples were collected at baseline and during clinic visits at 3, 6 and 12 months of intervention. Appetite-related hormones, peptide YY and ghrelin, were measured in the Biomarker Core Laboratory of the Irving Institute for Clinical and Translational Research at Columbia University Medical Center. Peptide YY was measured using radioimmunoassay methods and commercially available reagents (Millipore, Billerica, MA). The inter-assay coefficients of variation was 7.1% for peptide YY. Ghrelin was measured using radioimmunoassay methods and commercially available reagent kits (Linco Research, St. Charles, MO). The inter-assay coefficient of variation was 17.8% for ghrelin. At each follow-up visit, participants were also asked to report whether they experienced a change in appetite (Yes or No).
Statistical Analysis
Baseline characteristics including appetite-related hormones were normally distributed, expressed as Mean (SD) or N (%) by assigned dietary groups, and were compared between groups using t tests or chi-square tests. Data on dietary composition were presented as means (SDs) and compared using t tests at baseline and each follow-up visit. To examine the change in appetite-related hormones, we used a random-effects linear model which included a random intercept and random slope to adjust for within participant correlation among the repeated measurements, an indicator variable for time (3, 6, and 12 months), diet group, an interaction term for diet group by time, and baseline level of the corresponding appetite hormone. This modeling technique allows missing data under the assumption of missing-at-random. To test the robustness of our conclusions in the presence of missing data, we performed sensitivity analyses using multiple imputation techniques, including additional covariates (age, sex, race, marital status, education, and employment status) in the model [30]. To assess self-reported change in appetite (binary), we used generalized estimating equations (GEE) models with logit link function to account for the correlation of repeated measurements within individuals. To separate the effects of macronutrient composition from the effects of weight loss itself on changes in appetite-related hormones, we performed a mediation analysis [31,32]. This type of statistical analysis estimates the effect of the macronutrient composition of the diet with the appetite measures. As a second step, the effect of the weight loss on the appetite measures is estimated. In the third and final step, the effect of weight loss on appetite measures is subtracted from the effect of macronutrient composition of diet on appetite measures [33]. In this way, it is possible to tease out the effect of macronutrient composition of diet on appetite measures, removing the effect of weight loss itself. We plotted individual level data to further examine the relationship between carbohydrate intake, appetite hormones and weight loss. All analyses were conducted using the intention-to-treat principle. All P values were two-sided and statistical significance was defined as P <0.05. We used SAS (version 9.3; SAS Institute Inc, Cary, North Carolina) for all analyses.
RESULTS
Of this study sample, mean age was 46.8 (SD 10.2) years, 11.5% were men, and 51% were African-Americans. At 3, 6, and 12 months, 93%, 88%, and 82% of participants in the low-fat group and 92%, 83%, and 79% of participants in the low-carbohydrate group, respectively, completed assessments. Demographic characteristics, cardiovascular risk factors, and appetite-related hormones at baseline are shown in Table 1. As previously reported, on average, participants in the low-fat group lost 1.5 kg and those in the low-carbohydrate group lost 5.3 kg at 12 months [26]
Table 1.
Baseline characteristics of trial participants
| Charateristics1 | Low-fat diet (N=73) | Low-carbohydrate diet (N=75) |
|---|---|---|
| Age, year | 47.8 (10.4) | 45.8 (9.9) |
| Female | 65 (89) | 66 (88) |
| Race/Ethnicity | ||
| White | 33 (45) | 34 (45) |
| Black | 36 (49) | 40 (53) |
| Others | 4 (5) | 1 (1) |
| Weight, kg | 97.9 (13.5) | 96.3 (12.7) |
| Body mass index, kg/m2 | 35.6 (4.5) | 35.2 (3.8) |
| Waist circumference, cm | 111.0 (10.7) | 108.4 (9.3) |
| LDL cholesterol, mg/dL | 122.7 (38.6) | 122.5 (34.6) |
| HDL cholesterol, mg/dL | 56.5 (12.8) | 53.8 (13.3) |
| Plasma glucose, mg/dL | 93.4 (9.2) | 94.5 (10.9) |
| Anti-hypertensive medication use | 24 (32.9) | 21 (28.0) |
| Lipid-lowering medication use | 9 (12.3) | 12 (16.0) |
| Physical activity, MET-hour/week2 | 19.6 (35.5) | 16.3 (26.0) |
| Total Ghrelin, pg/mL | 814.9 (298.3) | 830.6 (261.2) |
| Total Peptide YY, pg/mL | 113.9 (22.5) | 114.8 (29.5) |
HDL: high-density lipoprotein; LDL: low-density lipoprotein; MET: metabolic equivalent.
All data were expressed as N (%) or Mean (SD) when appropriate.
Physical activity was calculated as the sum of hours per week of moderate to vigorous activities (walking, sports, dance and conditioning) multiplied by the activity’s individual metabolic equivalent value.
Data on daily dietary composition for participants who remained on each diet and also provided 24-h dietary recalls is presented in Table 2. Baseline data showed no significant differences in total energy, carbohydrate, fat, or protein intakes between the two groups. The intake of carbohydrate was significantly lower and intakes of protein or fats (total, saturated, and unsaturated fats) were significantly higher in the low-carbohydrate group compared to the low-fat group at 12 months.
Table 2.
Daily dietary composition in low-fat and low-carbohydrate diet groups over the course of the study1
| Baseline | 3 month | 6 month | 12 month | |||||
|---|---|---|---|---|---|---|---|---|
|
| ||||||||
| LFD | LCD | LFD | LCD | LFD | LCD | LFD | LCD | |
| Energy, kcal | 2,034 (702) | 1,998 (740) | 1,418 (468) | 1,258 (409) 2 | 1,481 (483) | 1,324 (537) | 1,527 (522) | 1,448 (610) |
| Carbohydrate, g | 242 (100) | 242 (92) | 193 (75) | 97 (45)2 | 202 (79) | 93 (46) 2 | 198 (78) | 127 (69) 2 |
| Total Fiber, g | 16.7 (6.6) | 18.5 (8.7) | 16.9 (8.9) | 16.2 (8.9) | 16.4 (8.1) | 15.1 (7.5) | 15.6 (7.7) | 15.1 (8.7) |
| Protein, % kcal | 17.6 (5.2) | 17.3 (5.0) | 19.0 (5.7) | 25.6 (7.7) 2 | 18.3 (5.0) | 26.3 (5.6) 2 | 18.6 (5.8) | 23.6 (7.4) 2 |
| Fat, % kcal | 34.7 (6.6) | 32.5 (7.2) | 27.5 (8.8) | 42.7 (10.0) 2 | 27.9 (7.3) | 43.4 (11.8) 2 | 29.8 (8.8) | 40.7 (10.6) 2 |
| SFA, % kcal | 11.6 (2.9) | 10.5 (3.4)† | 8.1 (3.0) | 13.6 (4.2) 2 | 8.4 (2.9) | 13.4 (4.5) 2 | 9.0 (3.2) | 13.4 (4.8) 2 |
| MUFA, % kcal | 12.7 (3.0) | 12.0 (3.1) | 10.3 (4.2) | 16.3 (4.4) 2 | 10.3 (3.1) | 16.3 (4.9) 2 | 11.3 (3.7) | 15.3 (4.7) 2 |
| PUFA, % kcal | 7.5 (2.7) | 7.3 (2.7) | 6.7 (3.1) | 9.1 (3.1) 2 | 6.7 (2.2) | 9.8 (4.3) 2 | 6.9 (3.5) | 8.6 (3.3) 2 |
LCD: low-carbohydrate diet; LFD: low-fat diet; MUFA: monounsaturated fatty acid; PUFA: polyunsaturated fatty acid; SFA: saturated fatty acid
Data were expressed as Mean (SD)
P<0.05, for the difference between the two groups at time point
Predicted mean differences (95% CIs) in changes in total ghrelin and total peptide YY from baseline are shown by assigned dietary group in Table 3. At 12 months, peptide YY levels decreased in both the low-fat and low-carbohydrate groups, but to a lesser extent in the low-carbohydrate group than seen in the low-fat group(mean difference in change at 12 months, 9.4 pg/mL [95% CI, 0.6 to 18.2 pg/mL]; P=0.036). Mean differences in changes in ghrelin between the two groups were not statistically significant throughout the study. Self-reported changes in appetite were not different between the groups (data not shown).
Table 3.
Predicted mean difference in changes in appetite hormones from baseline by assigned dietary group1
| Low-fat diet (N=73) | Low-carbohydrate diet (N=75) | Mean difference in changes | P value2 | |
|---|---|---|---|---|
| Total Ghrelin (pg/mL) | ||||
| 3 month | 18.8 (−21.8, 59.4) | 29.8 (−10.0, 69.7) | 11.0 (−45.9, 68.0) | 0.70 |
| 6 month | 4.2 (−31.6, 40.0) | 10.9 (−24.3, 46.2) | 6.7 (−43.6, 57.0) | 0.79 |
| 12 month | −24.9 (−64.4, 14.6) | −26.9 (−66.2, 12.5) | −2.0 (−57.8, 53.8) | 0.94 |
| Total Peptide YY (pg/mL) | ||||
| 3 month | −8.4 (−14.2, −2.5) | −3.8 (−9.5, 1.9) | 5.0 (−3.6, 12.7) | 0.27 |
| 6 month | −20.3 (−24.8, −15.8) | −14.1 (−18.5, −9.7) | 6.8 (−0.1, 12.5) | 0.055 |
| 12 month | −44.2 (−50.4, −38.0) | −34.8 (−41.0, −28.6) | 9.4 (0.6, 18.2) | 0.036 |
The predicted mean difference in changes in appetite hormones are from the random effects models (including diet and time) and expressed as mean (95% confidence interval).
P values for the difference between the two groups at each time point
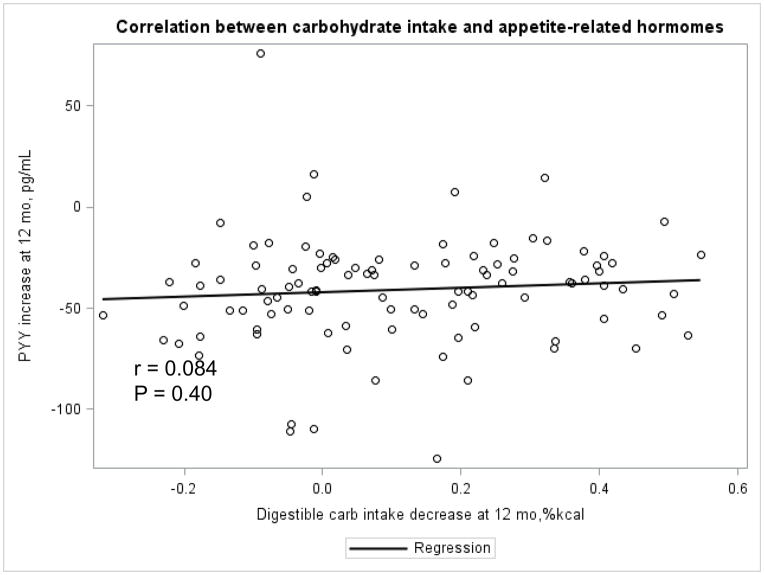
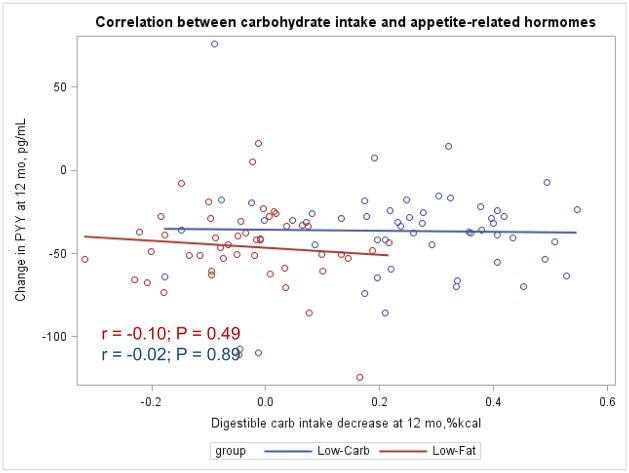
Mediation analysis showed that 99.6% of the difference in peptide YY was explained by the difference in macronutrient content of the two diets, not weight loss. We also examined differences in changes in appetite-related hormones among Black and White participants separately and found similar trends (Appendix Tables 1 and 2). Results of sensitivity analyses accounting for missing data with imputation were consistent with those presented in our primary analyses.
Appendix Table 1.
Predicted mean difference in changes in appetite hormones from baseline by assigned dietary group among whites1
| Low-fat diet (N=73) | Low-carbohydrate diet (N=75) | Net changes | P value2 | |
|---|---|---|---|---|
| Total Ghrelin (pg/mL) | ||||
| 3 month | 31.0 (−42.1, 104.1) | 31.8 (−41.0, 104.6) | 0.8 (−102.5, 104.1) | 0.98 |
| 6 month | 24.4 (−40.4, 89.3) | 21.9 (−42.6, 86.4) | −2.5 (−94.2, 89.1) | 0.96 |
| 12 month | 11.4 (−65.5, 88.3) | 2.1 (−74.8, 79.0) | −9.3 (−118.2, 99.6) | 0.86 |
| Total Peptide YY (pg/mL) | ||||
| 3 month | −15.8 (−24.8, −6.8) | 0.7 (−8.3, 9.8) | 16.5 (3.8, 29.3) | 0.012 |
| 6 month | −29.3 (−37.3, −21.3) | −13.0 (−21.0, −5.0) | 16.3 (4.9, 27.7) | 0.006 |
| 12 month | −56.4 (−68.9, −43.9) | −40.5 (−53.1, −27.9) | 15.9 (−1.8, 33.6) | 0.078 |
The predicted mean difference in changes in appetite hormones are from the random effects models (including diet and time) and expressed as mean (95% confidence interval).
P values for the difference between the two groups at each time point
Appendix Table 2.
Predicted mean difference in changes in appetite hormones from baseline by assigned dietary group among blacks1
| Low-fat diet (N=73) | Low-carbohydrate diet (N=75) | Net changes | P value2 | |
|---|---|---|---|---|
| Total Ghrelin (pg/mL) | ||||
| 3 month | 5.5 (−38.1, 49.1) | 31.5 (−9.4, 72.4) | 26.0 (−33.8, 85.8) | 0.39 |
| 6 month | −11.5 (−50.3, 27.2) | 5.0 (−31.8, 41.8) | 16.5 (−37.0, 70.0) | 0.54 |
| 12 month | −45.6 (−93.2, 2.0) | −48.0 (−94.4, −1.6) | −2.4 (−68.9, 64.0) | 0.94 |
| Total Peptide YY (pg/mL) | ||||
| 3 month | −5.9 (−13.7, 1.9) | −7.7 (−15.0, −0.4) | −1.8 (−12.5, 8.9) | 0.74 |
| 6 month | −16.7 (−22.2, −11.2) | −14.8 (−20.0, −9.7) | 1.8 (−5.7, 9.4) | 0.63 |
| 12 month | −38.2 (−44.7, −31.6) | −29.1 (−35.5, −22.7) | 9.1 (−0.2, 18.3) | 0.055 |
The predicted mean changes in appetite hormones are from the random effects models (including diet and time) and expressed as mean (95% confidence interval).
P values for the difference between the two groups at each time point
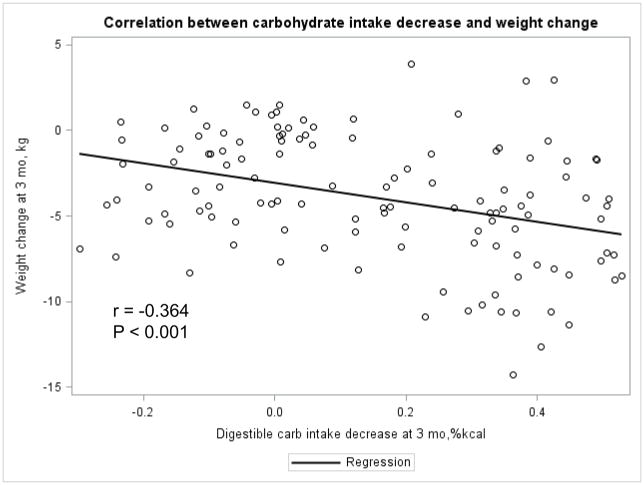
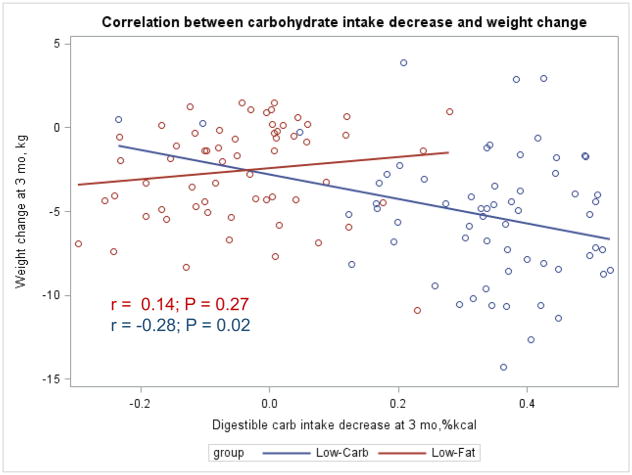
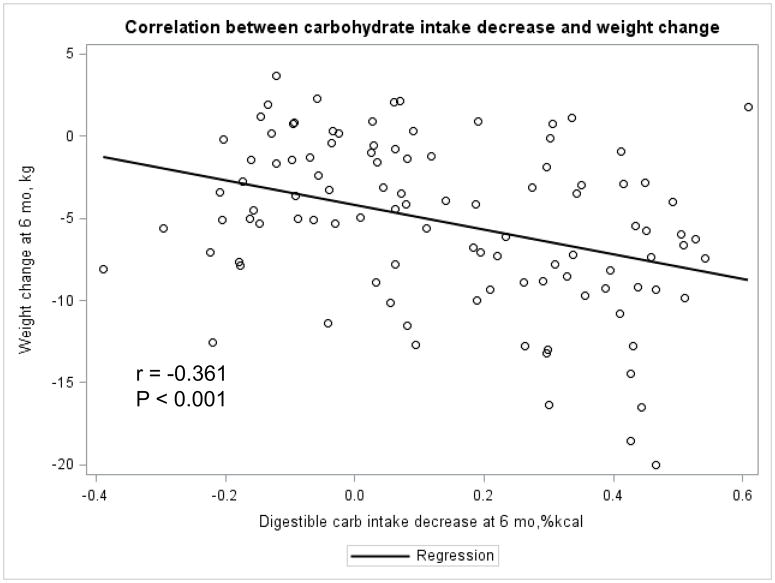
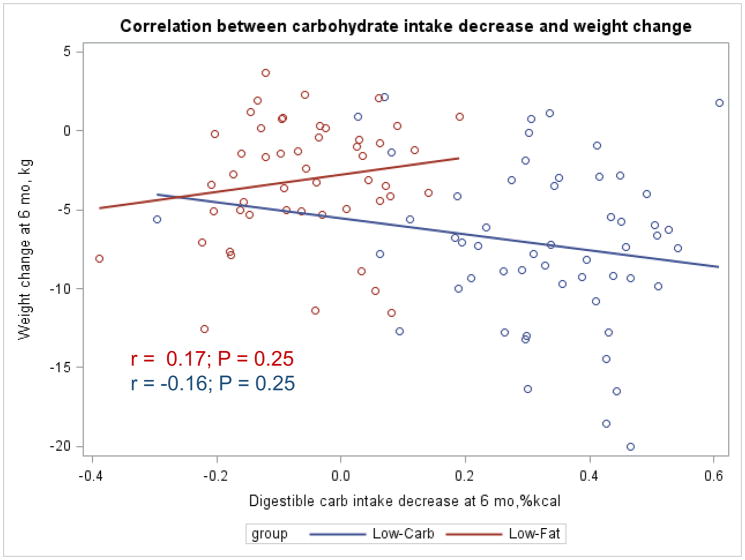
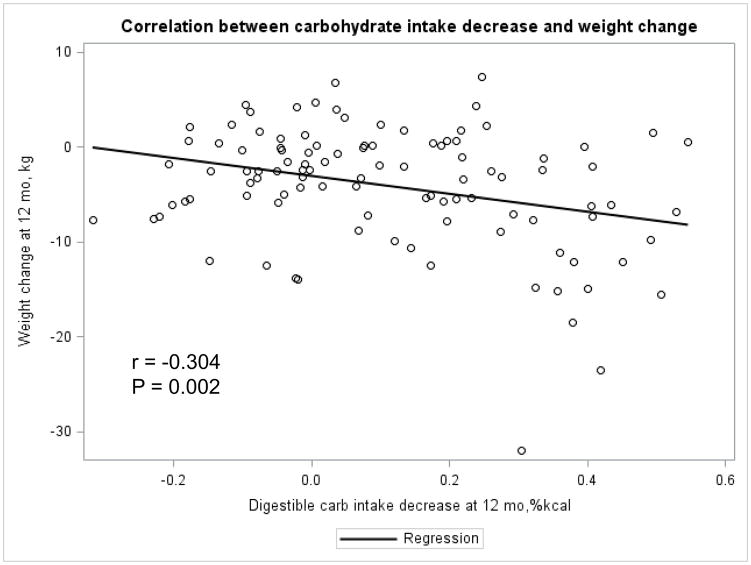
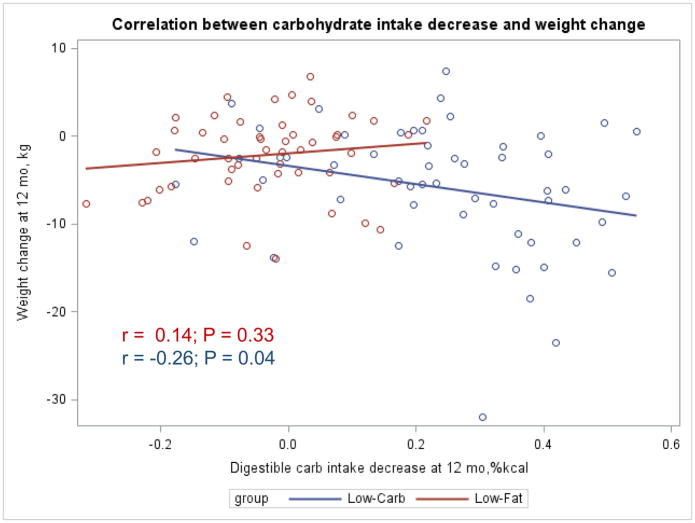
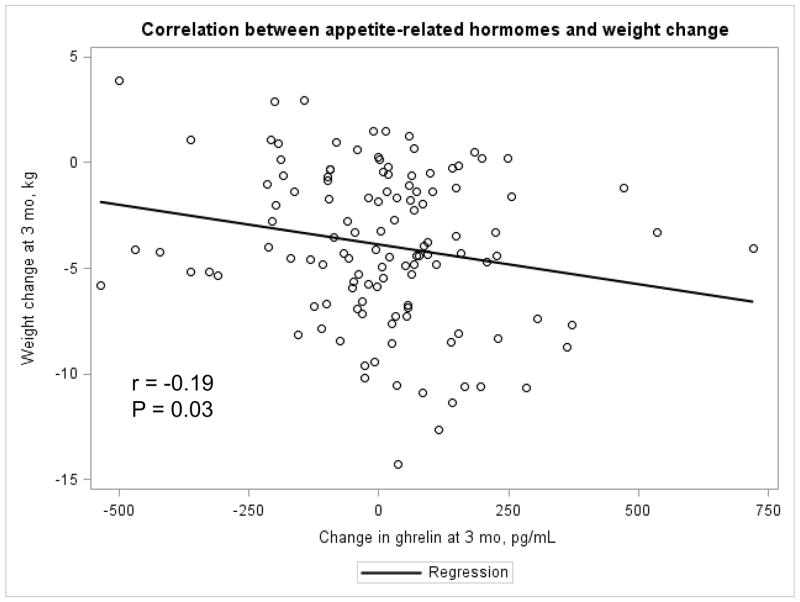
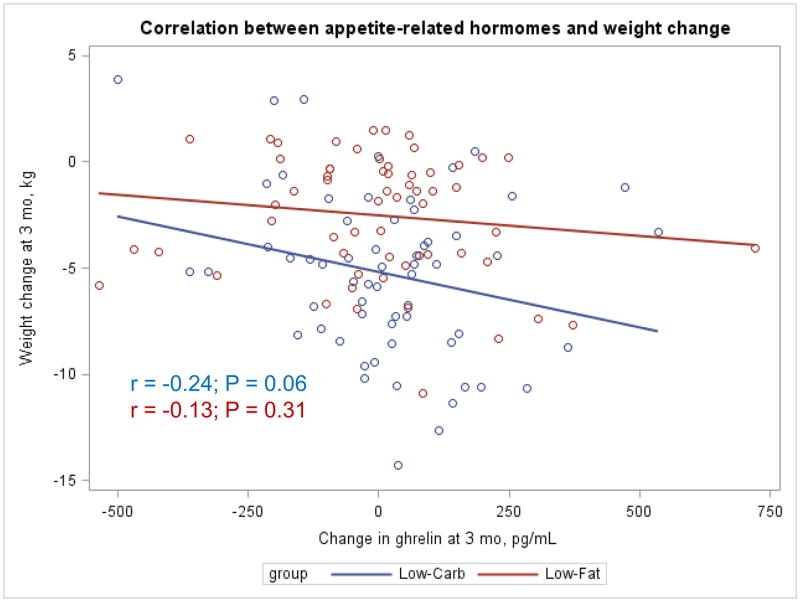
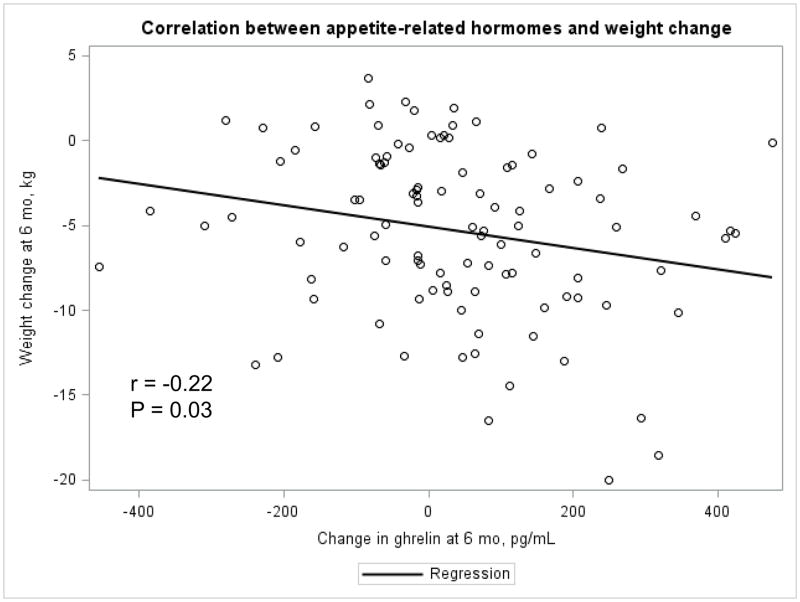
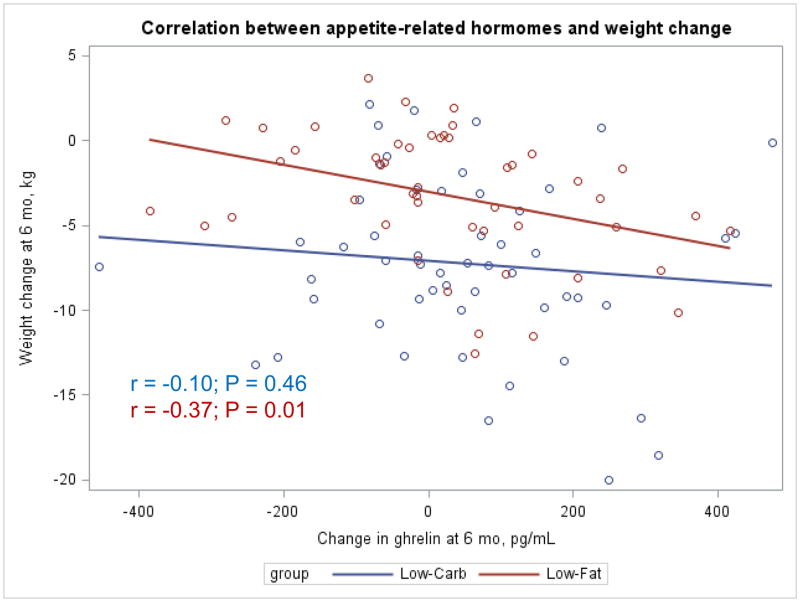
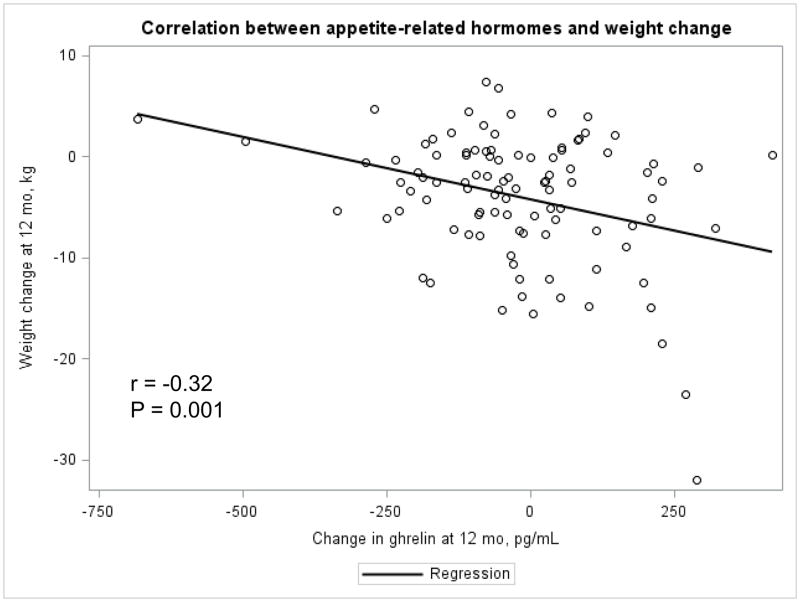
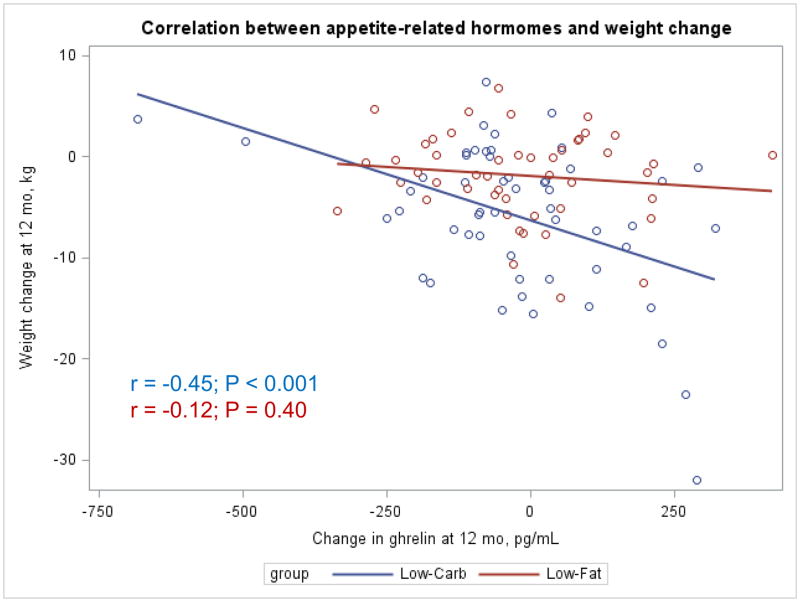
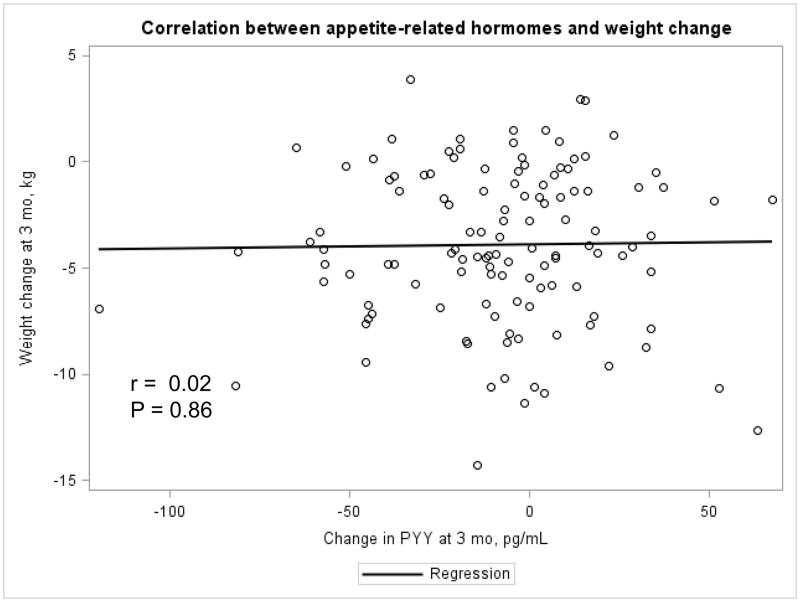
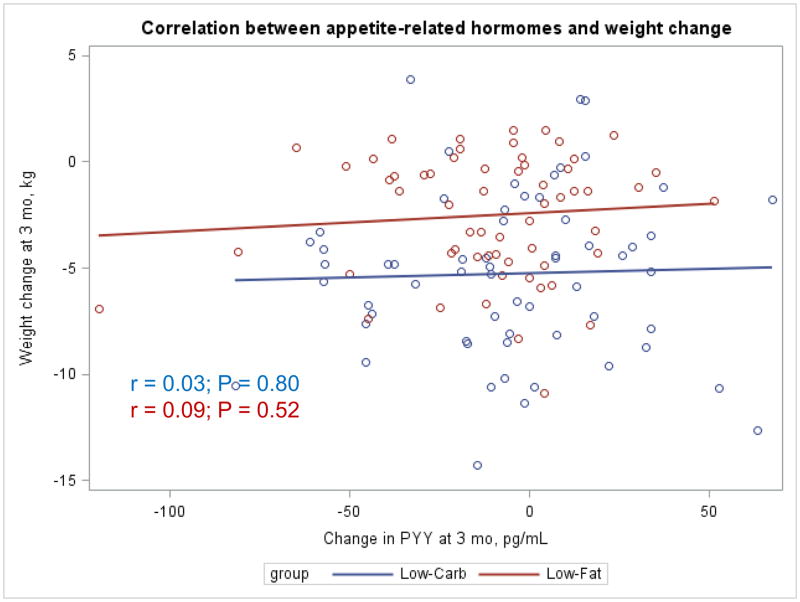
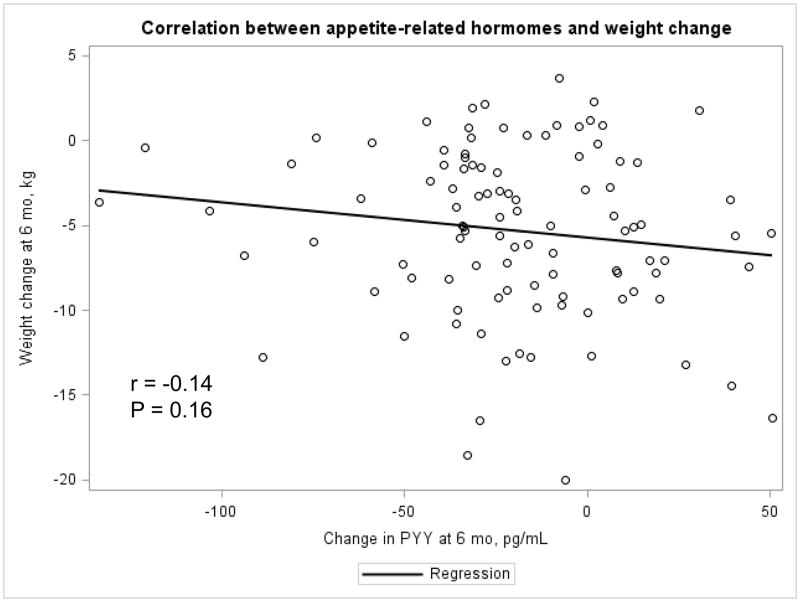
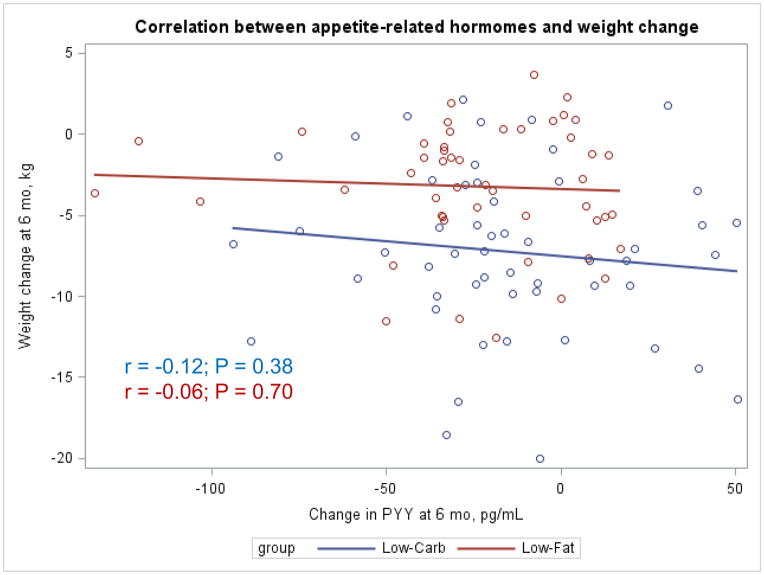
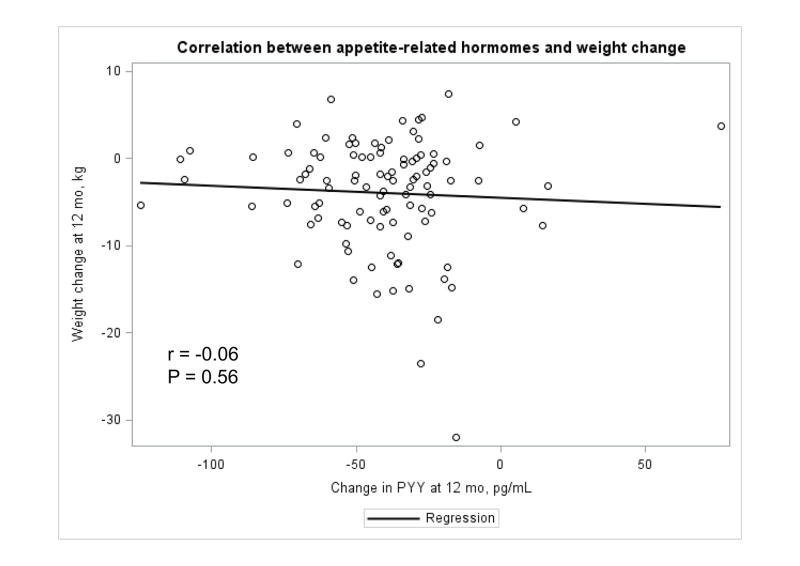
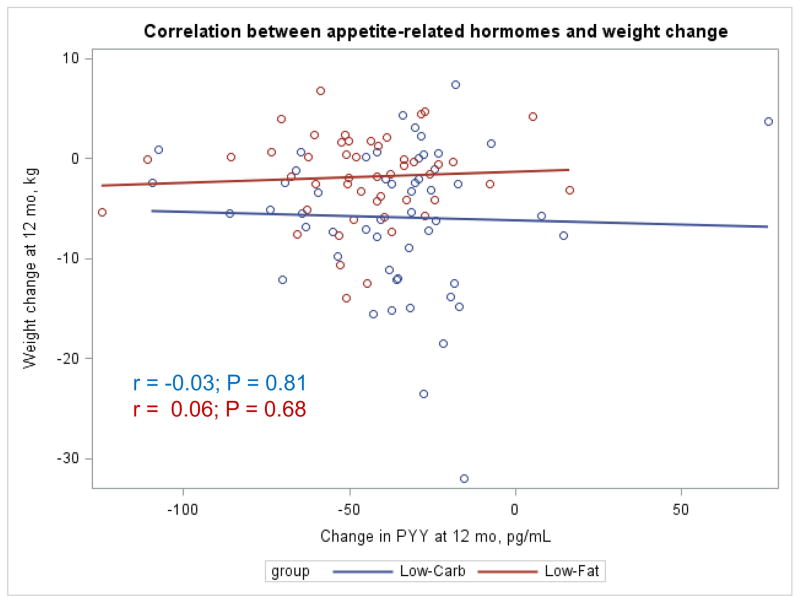
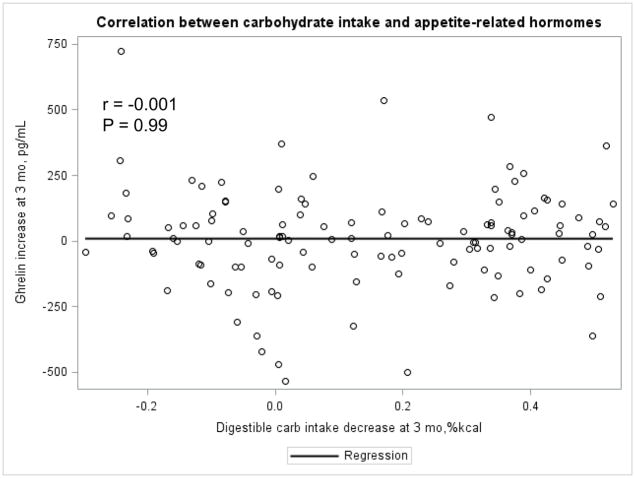
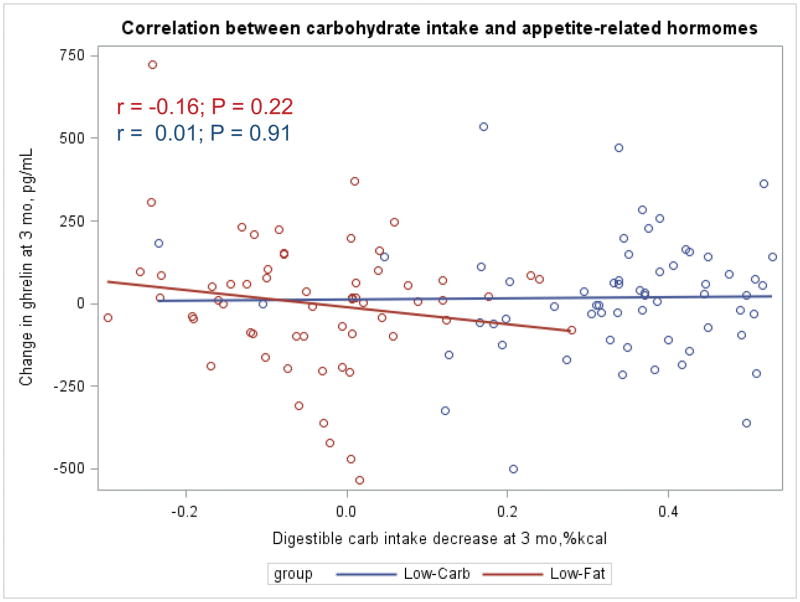
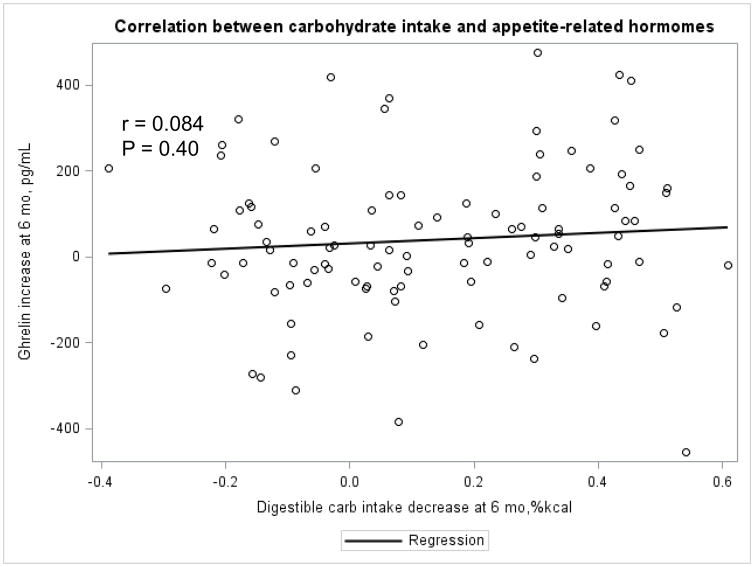
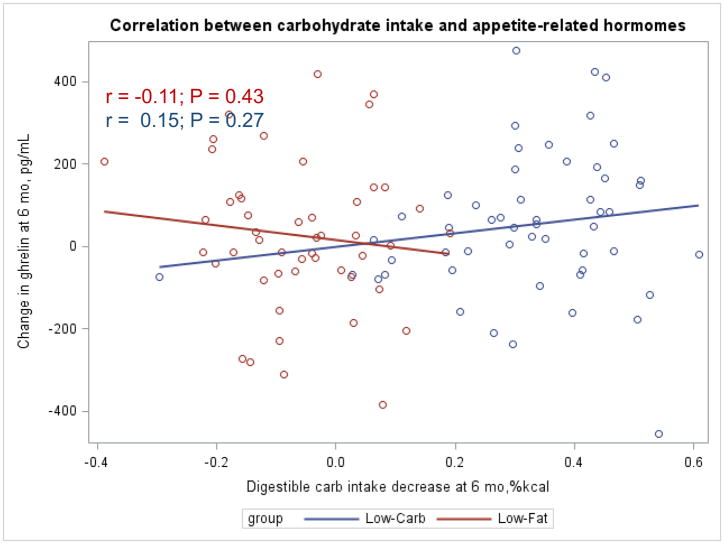
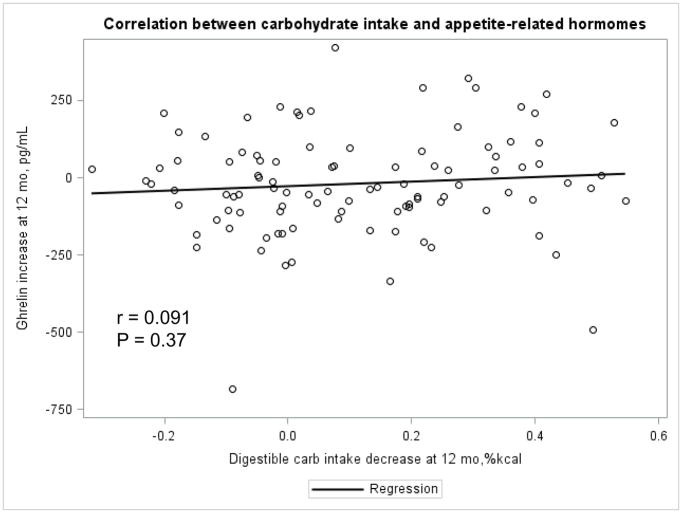
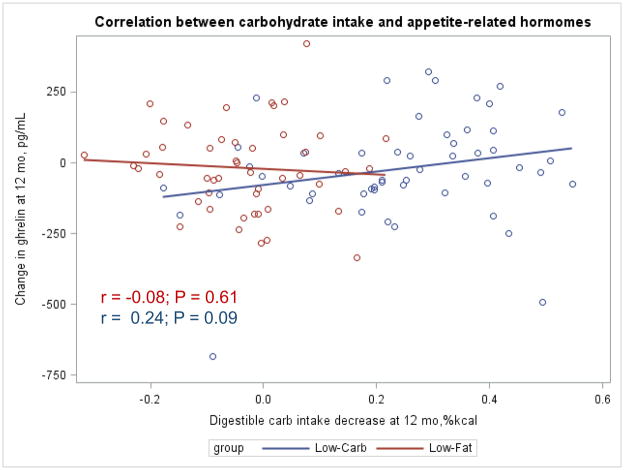
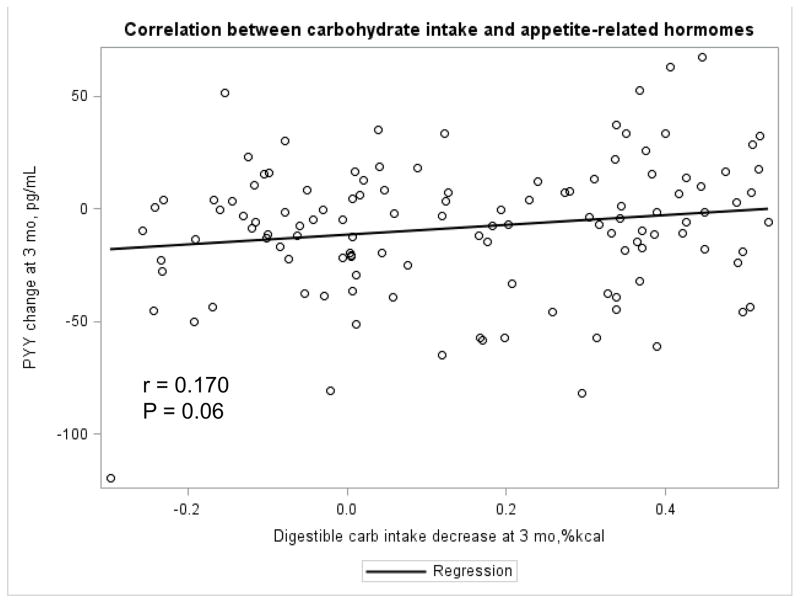
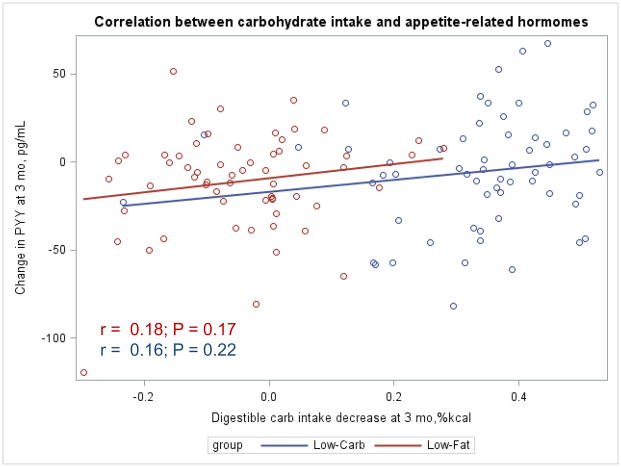
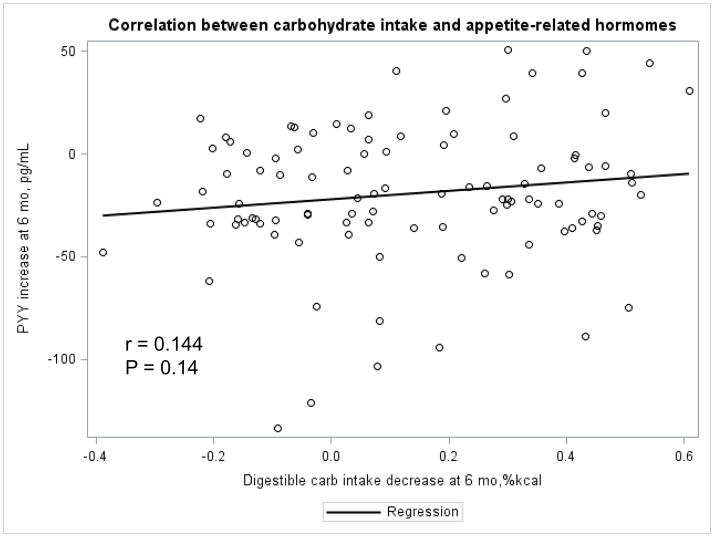
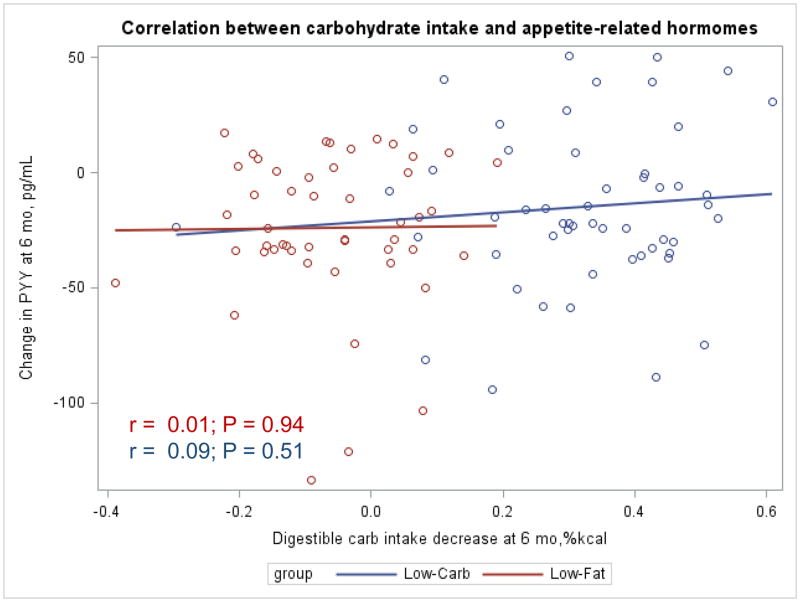
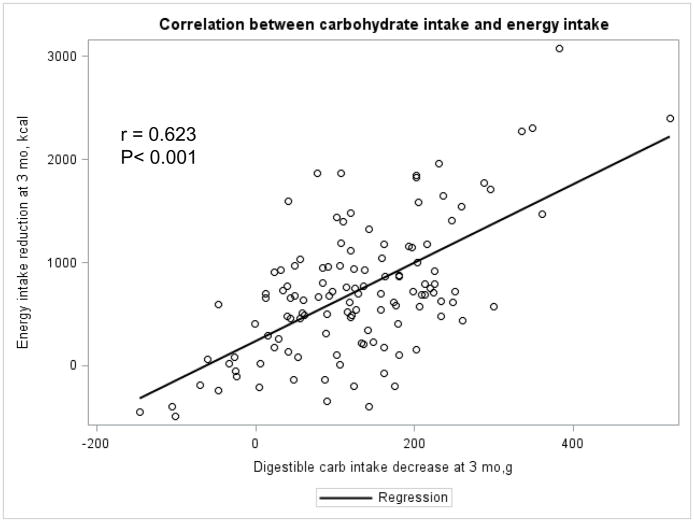
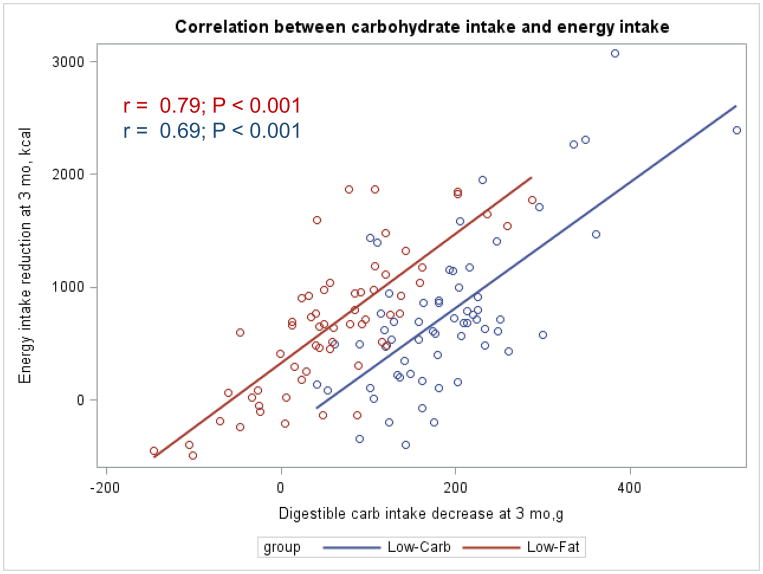
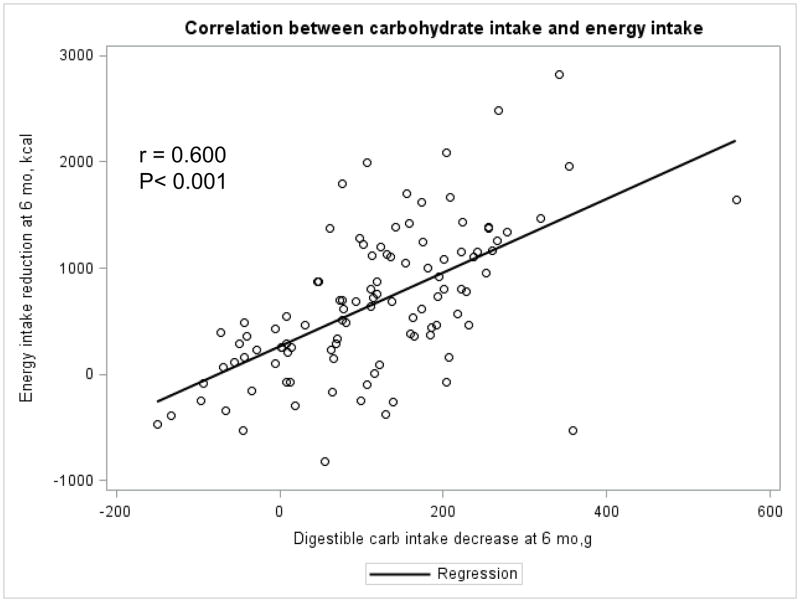
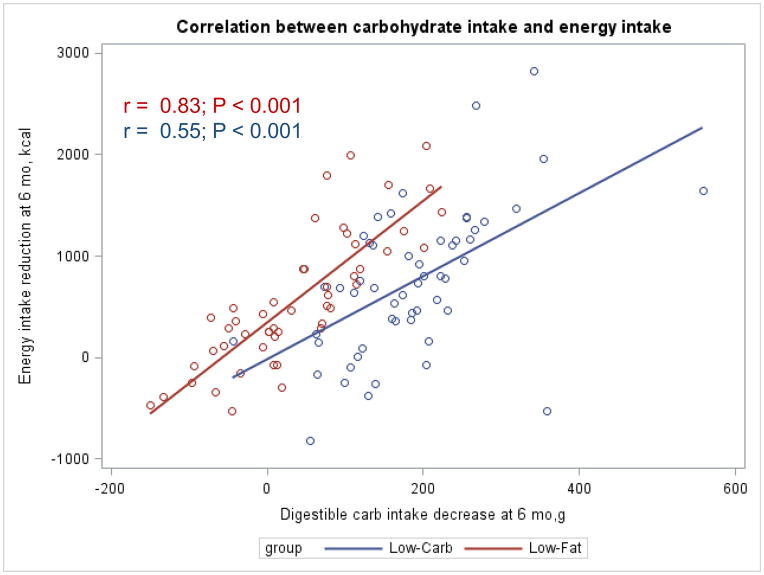
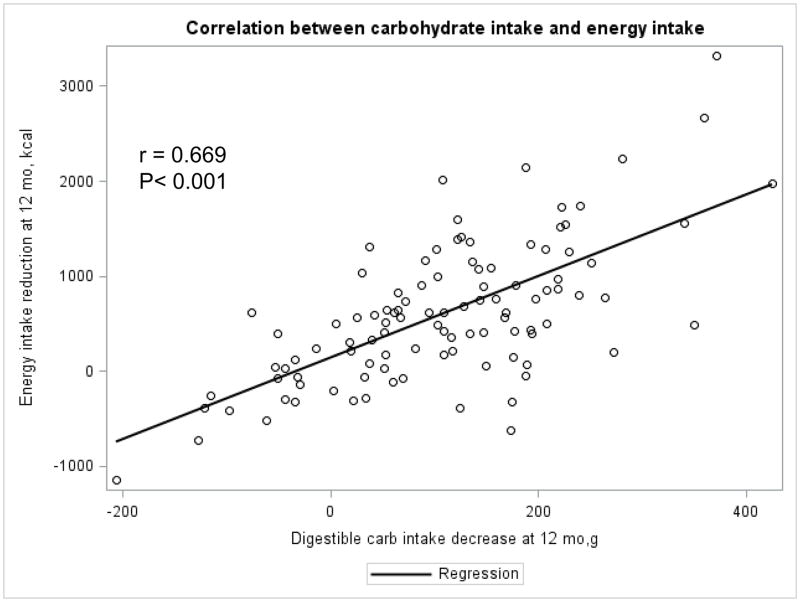
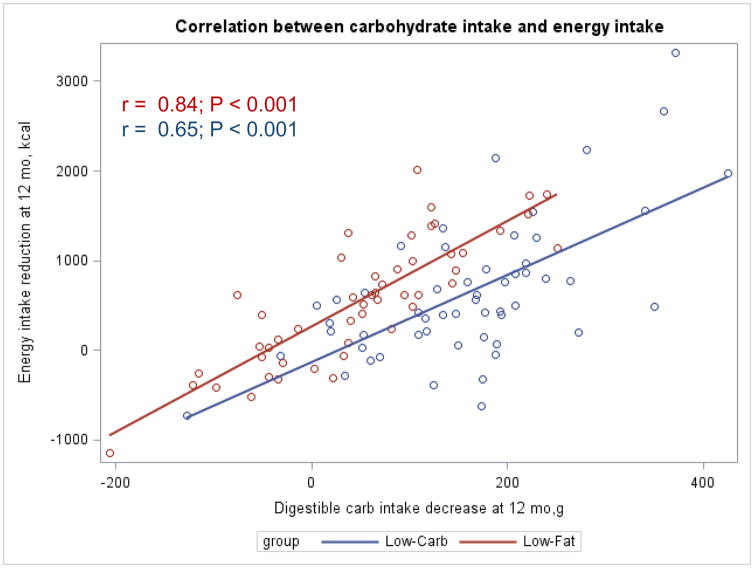
The Appendix Figures 1–4 show relationships between macronutrient composition, energy intake, weight loss and appetite hormones by randomly assigned diet group. Decrease in carbohydrate intake (% daily energy intake) was significantly associated with weight loss throughout the study (Appendix Figure 1).
Appendix Figure 1.
Appendix Figure 4.
DISCUSSION
In this 12-month randomized controlled trial, a low-fat diet reduced peptide YY, a satiety signal, more than a low-carbohydrate diet. These findings suggest that satiety may be better preserved on a low-carbohydrate diet, as compared to a low fat diet. While our study did not identify differences in change in self-reported appetite between the diet groups using a single question assessment, we have previously reported that a low-carbohydrate diet did reduce overall body weight more than a low-fat diet [26]. Notably, approximately 99% of dietary effects on peptide YY are explained by differences in the macronutrient content of the diet, not weight loss. Our study is the largest randomized controlled trial of a low-carbohydrate diet for weight loss to examine changes in appetite-related hormones, and the first to do so in comparison with a low-fat diet which is more commonly recommended for weight loss and improving heart disease risk factors.
A few small studies have examined the effects of low-carbohydrate diets on appetite-related hormones. Data from 9 obese diabetic patients observed during 7 days of a typical Western diet followed by 14 days of a low-carbohydrate diet (21 g of carbohydrates per day), showed a marginal increase (p=0.044) in levels of ghrelin on the low-carbohydrate diet [24]. In a randomized, two-period, cross-over study among 18 obese men and women who consumed both a low-fat (<20% of energy from fat) and a low-carbohydrate (<15% of energy from carbohydrate) diet for 1 week each, there were no significant differences between the diet groups in changes in fasting peptide YY [25]. Both of these trials had very small sample sizes and relatively short follow-up periods [24,25]. In contrast, our trial included 148 men and women who did not have diabetes and tested dietary effects on appetite-related hormones over 12 months of follow-up.
Other studies have attempted to differentiate the effects of each dietary macronutrient on appetite. For example, data from the Optional Macronutrient Intake Trial to Prevent Heart Disease (OMNI-Heart) examined the effects of 3 diets, each rich in a different macronutrient, but did not test a typical low-carbohydrate diet for weight loss [34]. In OMNI-Heart, participants were fed diets which were designed to maintain their current weight [34]. In contrast, our trial tested the effects of a typical low-carbohydrate diet for weight loss which limits intake of carbohydrates to less than 40 grams per day, without setting specific energy goals for consumption of protein and fats. We compared the low-carbohydrate diet to a widely recommended low-fat diet which restricted intake of total fat to <30% of energy and saturated fat to <7% of energy. In doing so, we identify the effects of dietary patterns which are commonly used for weight loss on appetite-related hormones in a diverse population.
Differential patterns in appetite-related hormones may account for the difference in weight loss and maintenance we observed between the two diets. Weight loss is accompanied by a variety of compensatory physiological changes, including adaptations in appetite-related hormones [6,7]. Thus, our study findings that at 12 months a low-carbohydrate diet better preserved levels of peptide YY, a satiety hormone, as compared to a low-fat diet, suggests a more favorable physiologic milieu for weight loss.
Our conclusions are subject to some limitations. We assessed appetite in a single question and lacked details on a variety of aspects such as hunger and satiety. Ghrelin and peptide YY, but not other appetite-related hormones, were assessed. This clinical trial was not powered to test appetite-related hormones. However, there is excellent statistical power to detect the effects of low-carbohydrate and low-fat dietary interventions on appetite-related hormones, and statistically significant comparisons were detected. Self-reported dietary information may be subject to recall issues; however, we collected dietary data within 24 hours of intake. Dietitians were not blinded to the study hypothesis. To avoid potential differences in dietary counseling due to this, we used specific and detailed scripts for all counseling sessions and trained staff to deliver the scripts without deviation. Dietary sessions for both groups were intermittently observed for consistency by an independent registered dietitian who was not a regular part of the study staff, and all outcome assessors were blinded to the diet group assignment.
There are also several strengths in the present study that lend confidence to these findings. This study includes both appetite-related hormones and a self-reported measurement for appetite. All data were collected by trained and certified staff using rigorous quality control protocols. Also, a substantial proportion of black participants, a group underrepresented in previous trials, were included in the study, which makes the examination of race differences possible. Finally, the completion rate was approximately 80% in both intervention groups.
In summary, this 12-month randomized controlled trial suggests that a low-carbohydrate diet may preserve satiety more than a low-fat diet when undertaken for the purpose of weight loss. Limited evidence from previous studies suggests that low-carbohydrate diets, which tend to be high in both fat and protein, may reduce appetite [23]. The differential patterns noted for appetite-related hormones in our study may in part account for such a potential effect on appetite.
Appendix Figure 2.
Appendix Figure 3.
We examine the effects of a 12-month low-carb diet on appetite.
A low-carb diet led to lesser decreases in peptide YY levels than a low-fat diet.
Less than 1% of dietary effects on peptide YY can be explained by weight loss.
Acknowledgments
The authors thank the study participants for their cooperation
The study was funded by the National Center for Research Resources of the U.S. National Institutes of Health (NIH/NCRR P20-RR017659)
Footnotes
Trial Registration: clinicaltrials.gov Identifier: NCT00609271 Data: Jan 24, 2008
CONFLICT OF INTEREST: The authors have nothing to disclose
Publisher's Disclaimer: This is a PDF file of an unedited manuscript that has been accepted for publication. As a service to our customers we are providing this early version of the manuscript. The manuscript will undergo copyediting, typesetting, and review of the resulting proof before it is published in its final citable form. Please note that during the production process errors may be discovered which could affect the content, and all legal disclaimers that apply to the journal pertain.
References
- 1.Howard AD, Feighner SD, Cully DF, Arena JP, Liberator PA, Rosenblum CI, Hamelin M, Hreniuk DL, Palyha OC, Anderson J, Paress PS, Diaz C, Chou M, Liu KK, McKee KK, Pong SS, Chaung LY, Elbrecht A, Dashkevicz M, Heavens R, Rigby M, Sirinathsinghji DJ, Dean DC, Melillo DG, Patchett AA, Nargund R, Griffin PR, DeMartino JA, Gupta SK, Schaeffer JM, Smith RG, Van der Ploeg LH. A receptor in pituitary and hypothalamus that functions in growth hormone release. Science. 1996;273:974–977. doi: 10.1126/science.273.5277.974. [DOI] [PubMed] [Google Scholar]
- 2.Kojima M, Hosoda H, Date Y, Nakazato M, Matsuo H, Kangawa K. Ghrelin is a growth-hormone-releasing acylated peptide from stomach. Nature. 1999;402:656–660. doi: 10.1038/45230. [DOI] [PubMed] [Google Scholar]
- 3.Pinkney J, Williams G. Ghrelin gets hungry. Lancet. 2002;359:1360–1361. doi: 10.1016/S0140-6736(02)08387-3. [DOI] [PubMed] [Google Scholar]
- 4.Adrian TE, Ferri GL, Bacarese-Hamilton AJ, Fuessl HS, Polak JM, Bloom SR. Human distribution and release of a putative new gut hormone, peptide YY. Gastroenterology. 1985;89:1070–1077. doi: 10.1016/0016-5085(85)90211-2. [DOI] [PubMed] [Google Scholar]
- 5.Adrian TE, Savage AP, Sagor GR, Allen JM, Bacarese-Hamilton AJ, Tatemoto K, Polak JM, Bloom SR. Effect of peptide YY on gastric, pancreatic, and biliary function in humans. Gastroenterology. 1985;89:494–499. doi: 10.1016/0016-5085(85)90442-1. [DOI] [PubMed] [Google Scholar]
- 6.Sumithran P, Proietto J. The defence of body weight: a physiological basis for weight regain after weight loss. Clin Sci (Lond) 2013;124:231–241. doi: 10.1042/CS20120223. [DOI] [PubMed] [Google Scholar]
- 7.Cummings DE, Weigle DS, Frayo RS, Breen PA, Ma MK, Dellinger EP, Purnell JQ. Plasma ghrelin levels after diet-induced weight loss or gastric bypass surgery. N Engl J Med. 2002;346:1623–1630. doi: 10.1056/NEJMoa012908. [DOI] [PubMed] [Google Scholar]
- 8.Essah PA, Levy JR, Sistrun SN, Kelly SM, Nestler JE. Effect of weight loss by a low-fat diet and a low-carbohydrate diet on peptide YY levels. Int J Obes (Lond) 2010;34:1239–1242. doi: 10.1038/ijo.2010.48. [DOI] [PMC free article] [PubMed] [Google Scholar]
- 9.Brubaker PL. Regulation of intestinal proglucagon-derived peptide secretion by intestinal regulatory peptides. Endocrinology. 1991;128:3175–3182. doi: 10.1210/endo-128-6-3175. [DOI] [PubMed] [Google Scholar]
- 10.Hu T, Mills KT, Yao L, Demanelis K, Eloustaz M, Yancy WS, Jr, Kelly TN, He J, Bazzano LA. Effects of low-carbohydrate diets versus low-fat diets on metabolic risk factors: a meta-analysis of randomized controlled clinical trials. Am J Epidemiol. 2012;176(Suppl 7):S44–54. doi: 10.1093/aje/kws264. [DOI] [PMC free article] [PubMed] [Google Scholar]
- 11.Hu T, Bazzano LA. The low-carbohydrate diet and cardiovascular risk factors: Evidence from epidemiologic studies. Nutr Metab Cardiovasc Dis. 2014;24:337–343. doi: 10.1016/j.numecd.2013.12.008. [DOI] [PMC free article] [PubMed] [Google Scholar]
- 12.Feinman RD, Pogozelski WK, Astrup A, Bernstein RK, Fine EJ, Westman EC, Accurso A, Frassetto L, Gower BA, McFarlane SI, Nielsen JV, Krarup T, Saslow L, Roth KS, Vernon MC, Volek JS, Wilshire GB, Dahlqvist A, Sundberg R, Childers A, Morrison K, Manninen AH, Dashti HM, Wood RJ, Wortman J, Worm N. Dietary carbohydrate restriction as the first approach in diabetes management: critical review and evidence base. Nutrition. 2015;31:1–13. doi: 10.1016/j.nut.2014.06.011. [DOI] [PubMed] [Google Scholar]
- 13.Westman EC, Feinman RD, Mavropoulos JC, Vernon MC, Volek JS, Wortman JA, Yancy WS, Phinney SD. Low-carbohydrate nutrition and metabolism. Am J Clin Nutr. 2007;86:276–284. doi: 10.1093/ajcn/86.2.276. [DOI] [PubMed] [Google Scholar]
- 14.Paoli A, Rubini A, Volek JS, Grimaldi KA. Beyond weight loss: a review of the therapeutic uses of very-low-carbohydrate (ketogenic) diets. Eur J Clin Nutr. 2013;67:789–796. doi: 10.1038/ejcn.2013.116. [DOI] [PMC free article] [PubMed] [Google Scholar]
- 15.Johnstone AM, Horgan GW, Murison SD, Bremner DM, Lobley GE. Effects of a high-protein ketogenic diet on hunger, appetite, and weight loss in obese men feeding ad libitum. Am J Clin Nutr. 2008;87:44–55. doi: 10.1093/ajcn/87.1.44. [DOI] [PubMed] [Google Scholar]
- 16.Lobley GE, Johnstone AM, Fyfe C, Horgan GW, Holtrop G, Bremner DM, Broom I, Schweiger L, Welch A. Glucose uptake by the brain on chronic high-protein weight-loss diets with either moderate or low amounts of carbohydrate. Br J Nutr. 2014;111:586–597. doi: 10.1017/S0007114513002900. [DOI] [PubMed] [Google Scholar]
- 17.McClernon FJ, Yancy WS, Jr, Eberstein JA, Atkins RC, Westman EC. The effects of a low-carbohydrate ketogenic diet and a low-fat diet on mood, hunger, and other self-reported symptoms. Obesity (Silver Spring) 2007;15:182–187. doi: 10.1038/oby.2007.516. [DOI] [PubMed] [Google Scholar]
- 18.Martin CK, Rosenbaum D, Han H, Geiselman PJ, Wyatt HR, Hill JO, Brill C, Bailer B, Miller BV, 3rd, Stein R, Klein S, Foster GD. Change in food cravings, food preferences, and appetite during a low-carbohydrate and low-fat diet. Obesity (Silver Spring) 2011;19:1963–1970. doi: 10.1038/oby.2011.62. [DOI] [PMC free article] [PubMed] [Google Scholar]
- 19.Nickols-Richardson SM, Coleman MD, Volpe JJ, Hosig KW. Perceived hunger is lower and weight loss is greater in overweight premenopausal women consuming a low-carbohydrate/high-protein vs high-carbohydrate/low-fat diet. J Am Diet Assoc. 2005;105:1433–1437. doi: 10.1016/j.jada.2005.06.025. [DOI] [PubMed] [Google Scholar]
- 20.Holt SH, Delargy HJ, Lawton CL, Blundell JE. The effects of high-carbohydrate vs high-fat breakfasts on feelings of fullness and alertness, and subsequent food intake. Int J Food Sci Nutr. 1999;50:13–28. doi: 10.1080/096374899101382. [DOI] [PubMed] [Google Scholar]
- 21.Isaksson H, Rakha A, Andersson R, Fredriksson H, Olsson J, Aman P. Rye kernel breakfast increases satiety in the afternoon - an effect of food structure. Nutr J. 2011;10 doi: 10.1186/1475-2891-10-31. 31-2891-10-31. [DOI] [PMC free article] [PubMed] [Google Scholar]
- 22.Astbury NM, Taylor MA, Macdonald IA. Breakfast consumption affects appetite, energy intake, and the metabolic and endocrine responses to foods consumed later in the day in male habitual breakfast eaters. J Nutr. 2011;141:1381–1389. doi: 10.3945/jn.110.128645. [DOI] [PubMed] [Google Scholar]
- 23.Gibson AA, Seimon RV, Lee CM, Ayre J, Franklin J, Markovic TP, Caterson ID, Sainsbury A. Do ketogenic diets really suppress appetite? A systematic review and meta-analysis. Obes Rev. 2015;16:64–76. doi: 10.1111/obr.12230. [DOI] [PubMed] [Google Scholar]
- 24.Boden G, Sargrad K, Homko C, Mozzoli M, Stein TP. Effect of a low-carbohydrate diet on appetite, blood glucose levels, and insulin resistance in obese patients with type 2 diabetes. Ann Intern Med. 2005;142:403–411. doi: 10.7326/0003-4819-142-6-200503150-00006. [DOI] [PubMed] [Google Scholar]
- 25.Essah PA, Levy JR, Sistrun SN, Kelly SM, Nestler JE. Effect of macronutrient composition on postprandial peptide YY levels. J Clin Endocrinol Metab. 2007;92:4052–4055. doi: 10.1210/jc.2006-2273. [DOI] [PubMed] [Google Scholar]
- 26.Bazzano LA, Hu T, Reynolds K, Yao L, Bunol C, Liu Y, Chen CS, Klag MJ, Whelton PK, He J. Effects of low-carbohydrate and low-fat diets: a randomized trial. Ann Intern Med. 2014;161:309–318. doi: 10.7326/M14-0180. [DOI] [PMC free article] [PubMed] [Google Scholar]
- 27.National Cholesterol Education Program (NCEP) Expert Panel on Detection, Evaluation, and Treatment of High Blood Cholesterol in Adults (Adult Treatment Panel III) Third Report of the NCEP Expert Panel on Detection, Evaluation, and Treatment of High Blood Cholesterol in Adults (Adult Treatment Panel III) final report. Circulation. 2002;106:3143–3421. [PubMed] [Google Scholar]
- 28.American Heart Association (AHA) AHA Dietary Guidelines Revision 2000: A Statement for Healthcare Professionals From the Nutrition Committee of the AHA. 2000;102:2284–2299. doi: 10.1161/01.cir.102.18.2284. [DOI] [PubMed] [Google Scholar]
- 29.Nutrition Data System for Research. The Minnesota Nutrition Data System. University of Minnesota; 2005. [Google Scholar]
- 30.Molenberghs G, Kenward M. Missing Data in Clinical Studies. Wiley; 2007. [Google Scholar]
- 31.Lange T, Vansteelandt S, Bekaert M. A simple unified approach for estimating natural direct and indirect effects. Am J Epidemiol. 2012;176:190–195. doi: 10.1093/aje/kwr525. [DOI] [PubMed] [Google Scholar]
- 32.Cole SR, Hernan MA. Fallibility in estimating direct effects. Int J Epidemiol. 2002;31:163–165. doi: 10.1093/ije/31.1.163. [DOI] [PubMed] [Google Scholar]
- 33.Baron RM, Kenny DA. The moderator-mediator variable distinction in social psychological research: conceptual, strategic, and statistical considerations. J Pers Soc Psychol. 1986;51:1173–1182. doi: 10.1037//0022-3514.51.6.1173. [DOI] [PubMed] [Google Scholar]
- 34.Beasley JM, Ange BA, Anderson CA, Miller ER, 3rd, Erlinger TP, Holbrook JT, Sacks FM, Appel LJ. Associations between macronutrient intake and self-reported appetite and fasting levels of appetite hormones: results from the Optimal Macronutrient Intake Trial to Prevent Heart Disease. Am J Epidemiol. 2009;169:893–900. doi: 10.1093/aje/kwn415. [DOI] [PMC free article] [PubMed] [Google Scholar]


