Abstract
Objective
The objective of this research was to develop a bioimpedance platform for monitoring fluid volume in residual limbs of people with trans-tibial limb loss using prostheses.
Methods
A customized multi-frequency current stimulus profile was sent to thin flat electrodes positioned on the thigh and distal residual limb. The applied current signal and sensed voltage signals from four pairs of electrodes located on the anterior and posterior surfaces were demodulated into resistive and reactive components. An established electrical model (Cole) and segmental limb geometry model were used to convert results to extracellular and intracellular fluid volumes. Bench tests and testing on amputee participants were conducted to optimize the stimulus profile and electrode design and layout.
Results
The proximal current injection electrode needed to be at least 25 cm from the proximal voltage sensing electrode. A thin layer of hydrogel needed to be present during testing to ensure good electrical coupling. Using a burst duration of 2.0 ms, intermission interval of 100 μs, and sampling delay of 10 μs at each of 24 frequencies except 5 kHz which required a 200 μs sampling delay, the system achieved a sampling rate of 19.7 Hz.
Conclusion
The designed bioimpedance platform allowed system settings and electrode layouts and positions to be optimized for amputee limb fluid volume measurement.
Significance
The system will be useful towards identifying and ranking prosthetic design features and participant characteristics that impact residual limb fluid volume.
Keywords: Prosthetic limb, trans-tibial amputee, volume management, extracellular fluid, socket fit, accommodation
I. Introduction
People with limb loss typically experience residual limb volume changes that affect the fit of their prosthesis [1-4]. When a person loses residual limb volume over the course of a day, for example, the socket may become loose and the limb “pistons” up and down in the socket. If no accommodation is performed, excessive pistoning may irritate soft tissues or cause the person to be unstable and fall. If the residual limb increases in volume then the tight socket may occlude blood flow, causing pain and promoting soft tissue necrosis.
Socket fit is highly sensitive to residual limb volume change. In a study investigating computer-manufactured socket fabrication error, an experienced prosthetist consistently detected errors in socket oversizing if they were more than 1.0% of the original socket volume [5]. On an average-sized residual limb a 1.0% volume change corresponds to a radial thickness change of 0.25 mm over the entire limb and a volume change of 18 mL [4]. Thus to quantify limb volume change, a highly sensitive measurement modality is needed.
Though a number of techniques have been developed to measure volume of the residual limb, few of them measure while the residual limb is within the prosthetic socket, the configuration of primary clinical interest. To date only radiological imaging methods and bioimpedance analysis allow in-socket monitoring [6]. The flexibility of bioimpedance analysis to monitor while the person conducts routine daily activities makes it more attractive for prosthetic fit evaluation than radiological techniques.
Several limitations of commercially available bioimpedance instruments prevented their application to limb prosthetics in the present research, even if supplemented with active front-ends. The primary limitation was sample rate. To resolve fluid changes occurring during ambulation requires a sampling rate of 20 Hz or more [7]. Most commercial impedance analyzers were not designed for continuous, accurate monitoring of changing impedances, and had readout rates of 1 to 5 Hz. Additionally, to make measurements of anterior and posterior compartments of the limb, a minimum of two simultaneous channels of impedance data are required. Other instruments suffered from a limited number of applied frequencies; a current-injection profile inappropriately tuned for limb spectroscopy; and electrode designs incompatible with prosthetic sockets. No commercially available system was capable of meeting all of these requirements.
The purpose of this research was to design a custom bioimpedance spectroscopy research platform for lower-limb assessment to be used on people with limb amputation. Our intent was to create a versatile system so that performance sensitivity to design variables could be investigated. As an investigational device, the key goals for this platform were accuracy of measured data and the versatility to investigate all aspects of bioimpedance spectroscopy on residual limbs. Power use, size, and cost considerations were secondary at this time and not considered important here. Results from use of this platform system informed the design and established specifications for a more compact, portable clinical device to be used outside of the laboratory. We present below the design, bench test results, and preliminary human participant study findings.
II. Methods
We used an embedded PC (Innovative Integration, Simi Valley, California) with peripherals (X3-25M and X3-10M XMC IO modules with Xilinx Spartan-3A FPGAs) to create a multi-frequency bioimpedance platform. We considered basing the developed system on a high-quality commercial impedance analyzer (e.g., Solartron, Keysight) and designing an active isolated front-end, but that solution did not offer sufficient flexibility and was not compatible with the longer-term goal of developing a portable system. The system generated and applied an alternating current stimulus to the limb, received voltage-sense signals from the limb, demodulated the voltage and current signals, processed and stored the results, and displayed the data. A key aspect of the design was to allow the injected alternating current sweeps to be tuned specifically for measurements of residual limbs. This customization was important towards optimizing sampling rate and data quality in this application. The customization allowed investigation of how different stimulus profiles, defined using terms listed in Table 1, affected measurement error. The applied frequency range was 5 kHz to 1 MHz.
Table 1.
Stimulus profile terms and meanings
| Term | Meaning |
|---|---|
| Burst | A continuous sinusoidal signal of constant amplitude and frequency |
| Intermission interval | Segments of zero current between bursts |
| Sweep | A collection of bursts |
| Tone | Analog version of a burst |
| Sampling delay | Start of the time window within a burst for demodulation calculation |
A. Stimulus & Acquisition
The stimulus was a continuous series of frequency sweeps. Each sweep consisted of bursts of continuous sinusoidal signal separated by intermission intervals of no signal. The user specified a different number of cycles for each frequency so as to achieve a result of acceptably low error while avoiding oversampling. Oversampling would have reduced the frequency content of the fluid volume signal of interest during ambulation. To create a stimulus pattern, the user generated a file listing the applied frequencies for each sweep and their characteristics, including signal amplitude, number of cycles, intermission interval, and sampling delay.
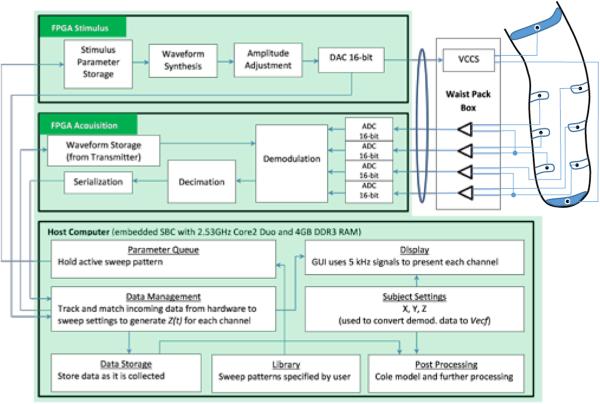
Upon initiating the data collection program, the parameters for the stimulus pattern were sent to a stimulus board within the embedded PC (Figure 1). The stimulus board used the information to digitally synthesize a voltage sweep with bursts of appropriate amplitude and frequency separated by an s intermission interval of zero voltage. The waveform was then converted via a DAC to a series of voltage tones from 5 kHz to 1 MHz. The series of tones was sent through a 3.0-m long, 11-mm diameter, shielded cable (RG-178B/U 50-ohm, Belden Inc., Indianapolis, Indiana) to a custom voltage controlled current source (VCCS) housed within a small waist belt box worn by the participant (330 g). The VCCS design was based off of the standard Improved Howland configuration [8]. The VCCS converted the voltage tones and injected the current (~300μA peak-to-peak) across current-injection electrodes placed on the proximal and distal aspects of the limb (Figure 2A). The system repeated transmission of the sweep until a predetermined number of cycles set by the user was completed or data collection was terminated by the user.
Figure 1.
Instrument block diagram.
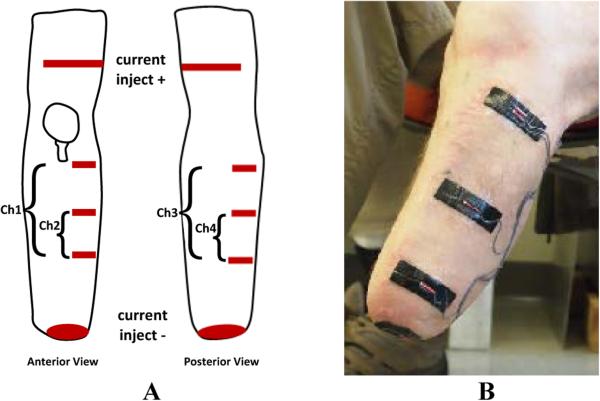
Figure 2A,B. Layout of electrodes on a residual limb.
(A) One current injection electrode, made from two electrode strips (one anterior, one posterior), was placed on the thigh. The other current injection electrode was round and was placed on the distal inferior residual limb. Three voltage sensing electrodes were places on the anterior side (for Channels 1 and 2) and three on the posterior side (for Channels 3 and 4). (B) Voltage sensing electrodes on the anterior-lateral aspect of the residual limb. The round distal electrode is current injecting. The proximal current injection electrode is not visible.
Voltage was sensed by four differential pairs of voltage sensing electrodes placed between the two current injection electrodes on the residual limb (Figure 2A,B). We used differential pairs instead of single-ended inputs so that we did not need to reference all signals to one electrode. Data could be collected from separate anatomical regions of the residual limb, for example from anterior sections and from posterior sections. Voltage signals from the electrode pairs were sent to signal conditioning amplifiers within the waist belt box worn by the participant and then through the 3.0-m long cable to the PC. The acquisition board within the PC digitized the signals, and then, using the current stimulus sent to the current-injection electrodes for comparison, demodulated the signals into Real (Re) and Imaginary (Im) components. The embedded PC had the capability to sample the stimulus output at a rate up to 50 MS/s, and the acquisition input at a rate up to 25 MS/s. The analog-to-digital conversion produced 16-bit fixed point values. Subsequent processing used double-precision floating point values to avoid loss of precision. The clocks on the PC, stimulus board, and acquisition board were carefully managed and tested to ensure that no timing errors were introduced. The demodulation coefficients were sent to a decimation filter that averaged results for each stimulus burst. Data were then serialized and sent to the host computer for display and storage. The average demodulation coefficients were stored for each frequency burst instead of storing raw data since the stored data would have been excessive.
Because the initiation of each new burst within a tone was a potential source of noise that could reduce quality of the data, within the decimation filter we averaged the demodulation coefficients for each burst over only a specific time window. The start of the time window was specified by the user as a parameter setting (sampling delay) within the stimulus pattern file generated on the PC.
B. Processing, Display, and Storage
An important component of this system was a means for immediate display of bioimpedance data so as to allow the user to determine if there were setup problems on the amputee test participant that caused improper performance of the system. Data from only the 5 kHz stimulus frequency was used for display since fitting the Cole model (described below) to convert data from all frequencies would have been too time-consuming. The 5 kHz signal was used since data at low frequencies best represented extracellular fluid resistance. Extracellular fluid resistance was of primary interest during short-term testing (<5 h).
For the display, the Real part of the complex demodulation product for the 5 kHz stimulus frequency along with participant/electrode characteristics input by the user (distances between electrodes, limb circumferences) were used in a limb model [9,10] to convert extracellular fluid resistance to extracellular fluid volume. Extracellular fluid volume was expressed as a percentage of initial fluid volume measured 90 s after the outset of data collection. A 90 s time interval was used so as to allow the participant to settle into the socket. Percentage extracellular fluid volume change was then plotted in approximately real time.
MATLAB (Mathworks, Natick, Massachusetts) was used as the host numerical processing environment since it allowed flexibility in algorithm construction although at the expense of time of performance. We constructed a graphical user interface sectioned into four parallel strips for illustration of extracellular fluid volume changes measured from each of the four voltage sensing electrode pairs.
Calibration, obtained as described below, was applied to convert the rectilinear complex products from demodulation into units of impedance. Those data were stored to a buffer and subsequently returned in data packets to the control program, which then wrote the packets to the hard drive of the host PC.
C. Electrodes
Because the electrodes needed to tolerate well the mechanical normal and shear stresses experienced at the residual limb/prosthetic socket interface and because they needed to be thin and flat so as not to disrupt the person's normal socket configuration, commercially available electrodes could not be used. We constructed our own electrodes (Figure 2B) using a conductive adhesive tape (ARCare 8881, Adhesives Research Inc., Glen Rock, Pennsylvania) (0.09mm thickness) and an underlying hydrogel (KM10B, Katecho, Des Moines, Iowa) (0.76 mm thickness). We used a hydrogel because ARCare 8881 contained nickel, a material linked to dermatitis [11]. A hydrogel layer served as a skin contact barrier. KM10B meets International Standards Organization (ISO) 10993 criteria, “Biological Evaluation of Medical Devices Part 1: Evaluation and Testing,” thus met standards requirements for biocompatibility. We evaluated its influence on signal quality by testing on residual limbs of people with limb loss. Custom multi-stranded silver-plated copper wire with an aramid core and polyvinyl chloride insulation (32 AWG, New England Wire, Lisbon, New Hampshire) (thickness 0.76 mm; maximum length 122 cm) and a flattened gold crimp at the wire-insulation boundary were used for the electrode lead. The leads were carefully configured against the conductive tape so as to minimize shear bending load application to the bare lead wire where it exited its insulation. This method minimized mechanical failure problems of the electrodes. When queried, amputee participants reported that the electrodes felt comfortable and wore them for hours during testing. The outside of the conductive tape was covered with Tegaderm™ Transparent Film Dressing (3M, St. Paul, Minnesota) (thickness 0.03 mm) that overlapped the edge of each electrode. Tegaderm meets ISO 10993 standards.
D. Calibration & Optimization
We used a procedure described by Bao et al. [12] to calibrate the bioimpedance system. Data were collected using three reactive test circuits. We selected resistor and capacitor values using data collected previously on amputee participants with a modified commercial bioimpedance device [13]; values were refined based on experience [14] to arrive at the component values listed in Table 2A,B.
Table 2A,B.
Reactive test circuit Re, Ri, Cm values
| A. Measurements from amputee participant testing | ||||||
|---|---|---|---|---|---|---|
| Re (Ω) measured | Ri (Ω) measured | Cm (μF) measured | ||||
| Measured | Range | Median | Range | Median | Range | Median |
| From reference [13] | 10.0 - 90.0 | 34.2 | 20.0 - 330.0 | 123.2 | 1.0 - 27.0 | 9.9 |
| B. Calibration and test circuits (Cal = calibration circuit; Tst = test circuit) | |||
|---|---|---|---|
| Circuit | Re (Ω) value | Ri (Ω) value | Cm (nF) value |
| Cal 1 | 10.06 | 30.13 | 20.70 |
| Cal 2 | 40.13 | 100.18 | 11.10 |
| Cal 3 | 81.97 | 391.40 | 1.00 |
| Tst 4 | 36.52 | 83.14 | 15.00 |
| Tst 5 | 48.52 | 166.21 | 8.50 |
| Tst 6 | 67.83 | 281.27 | 4.23 |
A systematic procedure was conducted to optimize the number of cycles, intermission interval, and sampling delay in the stimulus profile for use on people with limb loss ambulating with a prosthesis. We sought minimal values for these variables so as to allow a high sampling rate to be accomplished while still maintaining low error from the instrument. Error was defined relative to data achieved using the highest numbers of cycles, intermission intervals, and sampling delays tested. The three test circuits listed in Table 2B were used for testing. First, sensitivity to burst duration (up to 8.0 ms) was tested at 24 frequencies logarithmically distributed between 5 kHz and 1 MHz. The basis for using 24 frequencies was preliminary data we collected on amputee participants using a commercial bioimpedance instrument (Hydra 4200, XiTRON), showing no systematic change in extracellular fluid resistance results when more than 24 frequencies were used, provided the frequencies were relatively uniformly distributed on a log scale over the 5 kHz to 1 MHz frequency range.
The burst duration that produced a result within 0.2% of the value achieved at 8.0 ms, an excessive duration, was selected. Using that burst duration, we then evaluated sensitivity to intermission interval duration (ranging from 5 μs to 200 μs), selecting minimal values at each frequency so as to accomplish less than 0.025% error. A maximum of 200 μs was tested since that was considered an excessive duration. Sampling delay was tested in a similar manner, ranging from 0 μs to 200 μs. From these results a stimulus profile for use on amputee participants was created (Table 3). The intermission interval for all applied frequencies was 100 μs. The sampling delay was 200 μs for 5 kHz and 10 μs for all remaining frequencies.
Table 3.
Stimulus profile established through optimization process.
| Applied Frequency (kHz) | Number of Cycles | Applied Frequency (kHz) | Number of Cycles |
|---|---|---|---|
| 5 | 10 | 79 | 158 |
| 6 | 12 | 100 | 200 |
| 8 | 16 | 126 | 252 |
| 10 | 20 | 159 | 318 |
| 13 | 26 | 199 | 398 |
| 16 | 32 | 251 | 502 |
| 20 | 40 | 316 | 632 |
| 25 | 50 | 398 | 796 |
| 32 | 64 | 501 | 1002 |
| 40 | 80 | 631 | 1262 |
| 50 | 100 | 794 | 1588 |
| 63 | 126 | 1000 | 2000 |
A modeling strategy for impedance spectroscopy of biological materials was first developed by Cole et al. [15]. The model used in the current instrument was a revision to the Cole model performed by De Lorenzo et al. [16]. Further advancements have been proposed [17] but the increased model complexity did not correlate with increasing physiologic relevance of the measured data. De Lorenzo's formulation is a five-parameter model that included an equivalent RC circuit, made up of Rextracellular (Re), Rintracellular (Ri), and Cmembrane (Cm) terms, as well as a dispersion term (α) and a time delay term (Td). We used De Lorenzo's formulation because it included the Td term to account for delays to the current injection signal resulting, in part, from the long length of the lead wires to the electrodes [16]. In implementing De Lorenzo's formulation, we performed a multidimensional chi-squared fit to extract the best-fit parameters for each sweep of impedance measurements. The Minuit2 package (CERN, Geneva) minimized the chi-squared objective function, with parameter limiting to constrain the search to the physiologically valid region. The results of the prior data point were used as the starting parameters for the subsequent point's fit optimization.
E. Bench Testing
We conducted a series of bench tests to characterize noise in the instrument. First, bench tests were conducted to evaluate frequency distortion when the stimulus output to the VCCS was looped back into the system as a sensed signal. We tested the frequency profile listed in Table 3 in the order listed and then in reverse order.
When evaluating reactive test circuits serving as tissue models, we attached all components and test fixtures in the bench test system to a common ground and kept them connected at all times during the tests. A 46 cm × 152 cm aluminum sheet provided a floating ground above the bench. To minimize inductive and capacitive interference, we made lead wires short and routed them through space so as not to be close to or contact each other. Any mechanical fixture that shared a common contact with multiple wires was attached to ground.
We characterized drift, RMS noise, and accuracy using the reactive test circuits listed in Table 2B. All data were collected after the system had warmed up for at least 30 min. To evaluate drift we ran the system for 30 min, executed a linear fit to the data, and expressed results in units of %/h by dividing the slope by the mean impedance. RMS error was defined as the standard deviation divided by the mean of data collected for a 15 min trial, corrected for drift, if it was present, before calculation.
Accuracy was assessed by evaluating the bioimpedance system against an LCR meter (4284A Precision LCR Meter, Hewlett Packard, Palo Alto, California) as a gold standard. Data were collected at frequencies ranging from 5 kHz to 1 MHz. Resistance-reactance plots were created, and Re and Ri values were determined using De Lorenzo's form of the Cole model as described above.
We tested influence of presence of lead wires (122 cm length), electrodes (5.0 cm × 1.5 cm), and hydrogel on bioimpedance results by comparing data with these components present versus not present. The electrodes and hydrogel were affixed to a Garolite plate for testing. The tests were conducted three times on each of the three test circuits (Table 2B) and mean amplitude-frequency and phase-frequency plots created.
F. Human Participant Testing
We first conducted a venous occlusion study on an able-bodied participant to determine if the bioimpedance system provided experimental results that could be interpreted as fluid changes. All test procedures were approved by an institutional review board. The leg was instrumented with bioimpedance electrodes as illustrated in Figure 2A except that the distal current injection electrode was rectangular and positioned around the ankle. The participant was asked to lie supine with one ankle supported and slightly raised (~10 degrees) off the bed to facilitate venous outflow and remove pressure on the posterior compartment. An 18cm wide pressure cuff (Hokanson CC17, Bellevue, Washington) was placed on the leg above the knee, and connected to a rapid cuff inflator (Hokanson E20). After 90s, the thigh cuff was inflated to 110 mmHg which was between systolic and diastolic pressure. After a further 180s, the cuff was deflated.
We conducted tests on amputee participants to evaluate impact of electrode position and size as well as presence of the hydrogel on bioimpedance results. All testing procedures were approved by an institutional review board, and informed consent was obtained before any human participant testing was initiated. Participant inclusion criteria were consistent with the intended group for which the system was to be used for clinical evaluation. Participants were required to have had a trans-tibial amputation at least 18 months prior, to not be experiencing skin breakdown currently, to not use an assistive device for ambulation (e.g., cane), and to not have metal implants within their residual limb.
To test influence of proximal current injection electrode position, we collected bioimpedance data with electrodes at different positions. Electrodes were positioned at 1 cm intervals along the thigh length while the participant sat in a chair. To minimize impact of physiologic changes over time on the results, we applied all electrodes to the thigh and then connected to them sequentially via alligator clips, using the most proximal electrode first and the most distal electrode last, and then in the reverse order. Voltage sensing electrodes were positioned as shown in Figure 2A. The entire test was completed in approximately 6 min. Then we evaluated influence of distal current injection electrode size on bioimpedance results. Diameters of 1.0, 2.0, 3.5, 4.3, and 5.0 cm were evaluated. We increased electrode size by applying a larger diameter piece of conductive polymer over the previous electrode in each test, taking care to minimize mechanical pressure applied to the limb. The entire test was completed in approximately 5 min. Voltage sensing electrodes were maintained at consistent dimensions and locations.
We then evaluated influence of voltage sensing electrode length on bioimpedance results. Electrodes of length 1.0, 3.0, 5.0, 7.0, and 9.0 cm were tested on the posterior aspect of the residual limb. To ensure results were not sensitive to electrode repositioning from one test to the next, we started with electrodes of length 1.0 cm and then successively added length in each test. Current injection electrodes were maintained at consistent positions and dimensions. The proximal current injection electrode was at least 25 cm from the proximal voltage sensing electrode. The entire test was completed in approximately 6 min.
We tested if the sum of measurements from two adjacent voltage sensing electrode pairs were the same as that across the outer two electrodes. The purpose of this test was to determine if electrode presence affected the measurement. Three electrodes were positioned as shown in Figure 2B. The signal across the proximal two electrodes was termed channel A, that across the distal two electrodes channel B, and that across the proximal and distal electrodes channel C. We tested if the signal from channel C was the sum of the signals from channel A and channel B. Both anterior and posterior regions were tested.
To evaluate electrical impact of the hydrogel on bioimpedance results, we compared electrodes with and without hydrogel on a worst case (hairy) able-bodied subject using electrode positions as shown in Figure 2B. Electrodes sets were placed on opposing limbs such that anatomical placement could be exactly duplicated. Alternating measurements were then taken on the side with and the side without hydrogel.
To evaluate if limb fluid volume changed in response to mechanical pressure, we applied pressures to limbs of both amputee and able-bodied participants while they were lying supine. Pressures were applied first using a blood pressure cuff inflated to approximately 100 mmHg. In a separate test we gently pushed an indenter (a wooden dowel of diameter 1.0 cm) into the limb with its axis perpendicular to the skin surface. We evaluated if changes in fluid volume measured in different regions reduced when pressure was applied and if relative magnitudes were consistent with expectation.
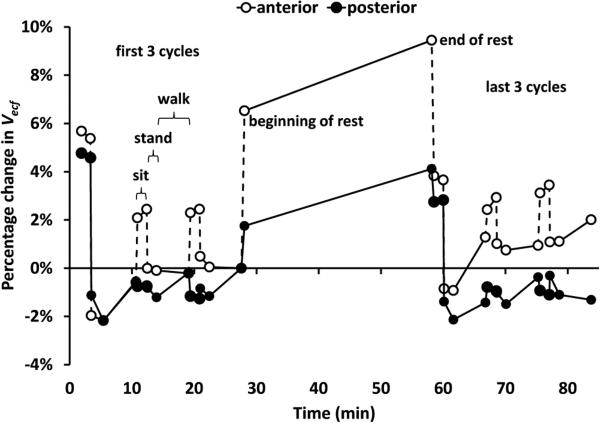
We then collected data from a unilateral trans-tibial amputee participant during sitting, standing, walking, and “socket release” activities. The intent was to investigate if socket release, doffing the socket for 30 min in between periods of activity, affected bioimpedance measurements from both the anterior region of the residual limb and the posterior region. Results from human participant tests were converted from impedance to fluid volume using a standard lower-leg model [9,10]:
where VECF was extracellular fluid volume, ρECF was specific resistivity of the extracellular fluid [10], C was mid-limb circumference, RECF was extracellular fluid resistance, and L was length between the electrodes. Only extracellular fluid volume was reported since it was of primary interest in these the ground for 90 s; standing with equal weight bearing for 90 s; walking on a treadmill at a self-selected walking speed for 5 min; and standing with equal weight-bearing for 5 to 10 s. In between cycle #3 and cycle #4 the participant doffed the prosthesis but not the elastomeric liner for 30 min. Results from the anterior and posterior regions were analyzed.
III. Results
A. Stimulus & Acquisition
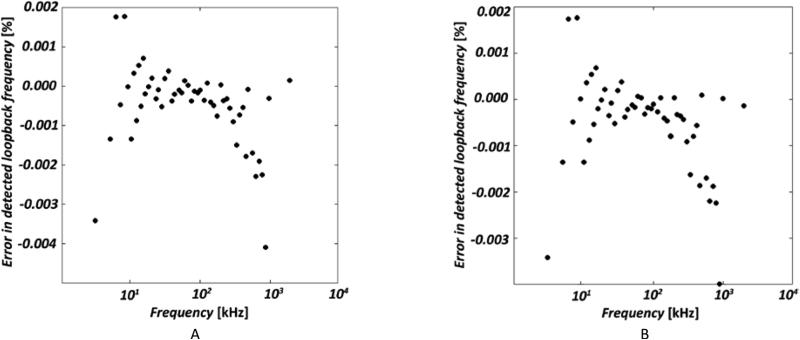
When the stimulus output to the VCCS was looped back into the system as a sensed signal, error in the detected loop-back frequency compared to the transmitted frequency ranged from −0.004% to +0.002% across the frequency range (5 kHz to 1 MHz) Results were comparable for forward and reverse ordering (Figure 3A,B).
Figure 3A,B. Frequency ordering dependence.
(A) Error in detected lookback frequency, with a transmit sweep built from ascending frequencies. (B) Same as (A) but with descending frequencies.
B. Calibration & Optimization
The stimulus pattern optimization tests showed that a burst duration of 2.0 ms achieved an error of 0.2% or less across the frequency range. The numbers of cycles corresponding to a 2.0 ms burst duration for each frequency are listed in Table 3.
At all frequencies except 5 kHz a sampling delay of 10 μs accomplished less than a 0.025% error. At 5 kHz a 200 μs sampling delay needed to be used.
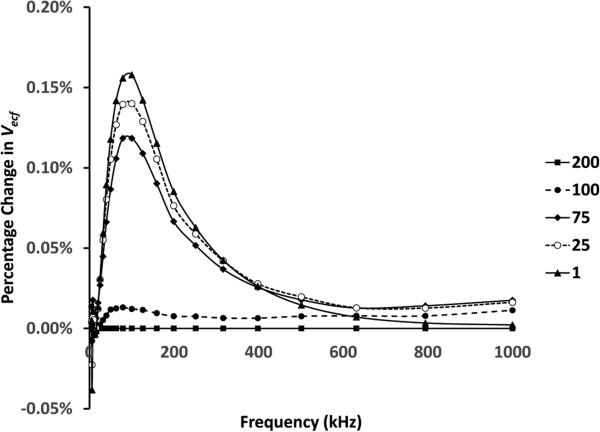
Error reduced as intermission interval length was increased (Figure 4). A 100 μs intermission interval accomplished less than a 0.025% error relative to that at 200 μs, the maximum possible interval, for all frequencies. Using the optimized stimulus pattern values (Table 3), an instrument sampling rate of 19.7 Hz was achieved.
Figure 4. Influence of intermission interval on extracellular fluid volume.
Tested values ranged from 1 to 200 μs. Results for each of the intermission intervals tested, shown in the legend in μs, are plotted as a percentage change relative to results at an intermission interval of 200 μs.
C. Bench Testing
The test circuits of Table 2B were used to evaluate the performance of the bioimpedance system. These tests showed short-term tests.
The participant conducted six cycles of activities. Each cycle included sitting in a chair with the knees flexed and the feet on strong agreement between bioimpedance system measurements and the actual component values (Table 4). The test circuits were built to have one component corresponding to each parameter in the Cole model of cell impedance spectra. Data collected from the bioimpedance instrument was fit using the modelling procedure of Section II-D to determine measured values of the Cole parameters for each test circuit. These were compared with direct measurements of the test circuit components using the HP 4284A Precision LCR Meter. Differences in measured extracellular fluid impedance (Re) were small, averaging −0.4% for the three test circuits of Table 4. Differences in intracellular fluid impedance (Ri) were larger, averaging 4.6% for the test circuits. Drift and RMS noise were consistent across all three test circuits thus were independent of impedance. They averaged 0.02%/h and 0.026%, respectively.
Table 4.
Bioimpedance system evaluations using test circuits.
| Tst 4 | Tst 5 | Tst 6 | ||||
|---|---|---|---|---|---|---|
| Re | Ri | Re | Ri | Re | Ri | |
| Bioimpedance system (Ω) | 36.51 | 83.65 | 48.24 | 175.88 | 67.39 | 301.72 |
| Actual Value (Ω) | 36.52 | 83.14 | 48.52 | 166.21 | 67.83 | 281.27 |
| Difference | 0.0% | 0.6% | −0.6% | 5.8% | −0.7% | 7.3% |
The addition of lead wires, electrodes, and hydrogel had minimal effect on the resistive component of impedance but did distort reactive component results at high frequencies (Figure 5A-C). The increase in measured reactance at frequencies above 100 kHz shown in Figure 5A-C is attributed to leakage associated with stray capacitances [18,19] and parallel conductance [20]. These effects are common artifacts found in bioimpedance spectra in this frequency range [18]. As limb volume is determined by the low-frequency impedances associated with the Re parameter [10], optimization in the high-frequency range was not pursued. These differences, however, were reasonably consistent across test circuits thus were accounted for by having the components in place during calibration.
Figure 5A-C. Bioimpedance dependence on electrode and wire configuration.
Resistance and reactance components of bioimpedance are plotted vs. current injection frequency for three configurations: no components; with electrode lead wires (122 cm); and (3) with lead wires, electrodes, and hydrogel. A: From test circuit Tst4 (Table 2B). B: From test circuit Tst5. C: From test circuit Tst6.
D. Human Participant Testing
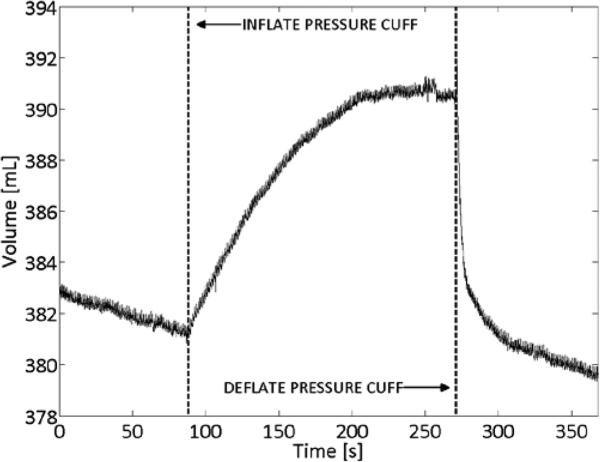
Venous occlusion studies were conducted on eight able-bodied participants. An exemplary result is shown in Figure 6. During periods with no cuff pressure, VECF decreased, corresponding to venous outflow from raising the leg. When venous outflow was occluded by the pressure cuff, VECF increased before reaching steady state at venous capacity. When the cuff was subsequently deflated, VECF immediately decreased, corresponding to venous emptying through the now non-occluded veins. Following this rapid emptying, VECF resumed its initial decreasing trend, corresponding to normal venous outflow from raising the leg.
Figure 6. Venous occlusion study results.
VECF in able-bodied subject showing venous response to thigh pressure cuff inflation and deflation.
Three participants (#1, #2, and #3) with mid-limb residual limb circumferences of 31.8, 25.5, and 31.4 cm and proximal voltage sensing to distal voltage sensing electrode distances of 12.0, 9.5, and 13.0 cm (averages of anterior and posterior channels for each participant), respectively, were tested.
Test results were sensitive to the distance of the proximal current injection electrode to the proximal voltage sensing electrode and to the distal current injection electrode size (Figure 7A,B). Consistent results were achieved for all three participants with proximal current injection to proximal voltage sensing distances of 25 cm or greater, and a distal current injection electrode size of 3.5 cm diameter or greater. Thus in subsequent human participant testing proximal current injection to proximal voltage sensing electrode distance was at least 25 cm. A distal electrode diameter of 3.5 cm was used. Increasing voltage sensing electrode length did not induce a consistently higher or lower limb fluid volume for any test participant but instead a varied result (Figure 7C).
Figure 7A-C. Percentage change in extracellular fluid volume for electrode variables.
(A) Current injection electrodes. Dependence on position of the proximal current injection electrode. (B) Dependence on distal current injection electrode size. Results in (A) and (B) from Participant #2 are exemplary of all three participants. (C) Voltage sensing electrodes. Dependence on electrode length for all three test participants (anterior region).
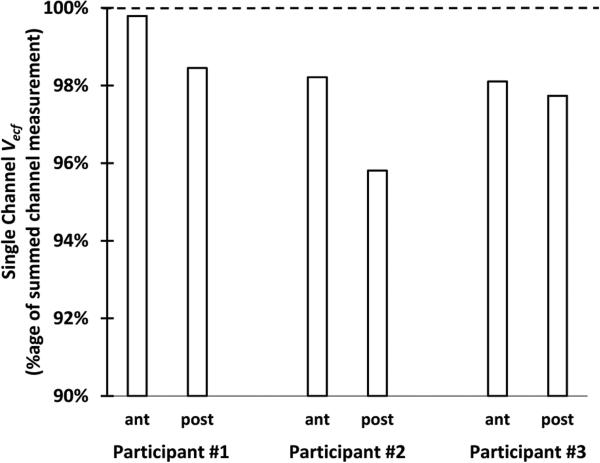
Limb fluid volume measured from the outer electrode pair was less than that from adjacent electrode pairs for all three test participants for both anterior and posterior locations (Figure 8). On average, differences were 2.0% (±1.3%).
Figure 8. Comparison of summed channel and single channel data.
The single channel spanned the length of the two summed channels. Extracellular fluid volume measurements were consistently less for the single channel measurement than the summed channel measurement.
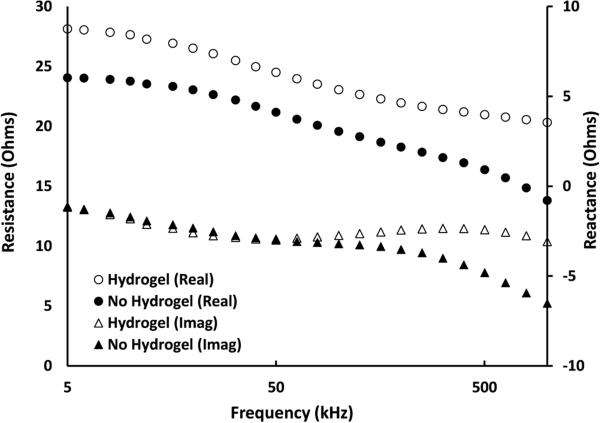
Signal quality improved when the hydrogel was present compared with not present (Figure 9). Electrodes without hydrogel showed a drop at high frequencies compared to the electrodes with hydrogel. Resistance started to drop at approximately 200 kHz, while the drop in reactance started at approximately 50 kHz. Both of these results indicate that no hydrogel correlated to decreased electrical coupling and degraded quality of the Cole-De Lorenzo model fit.
Figure 9. Influence of hydrogel presence on human participant test results.
Electrodes without hydrogel experienced a drop in resistance and reactance at frequencies above 50kHz that degraded quality of the Cole-De Lorenzo model fit.
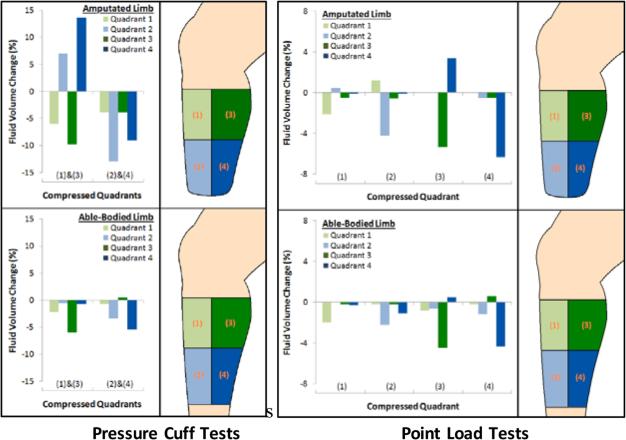
When a blood pressure cuff was inflated to apply pressure to distal locations (quadrants 2 and 4), the pattern of magnitude change was similar for the amputee participant and able-bodied participant. Limb fluid volume decreased appreciably in quadrants 2 and 4 and less in quadrants 1 and 3 (Figure 10). When the blood pressure cuff was applied over the proximal location, quadrants 1 and 3, however, results from the amputee participant were different than those from the able-bodied participant. Fluid volume decreased in quadrants 1 and 3 for both amputee and able-bodied participants; fluid volumes in quadrants 2 and 4 increased appreciably for the amputee participant yet showed minimal change for the able-bodied participant.
Figure 10. Point load and pressure cuff tests.
Tests were conducted on an amputee participant (upper panels) and an able-bodied participant (lower panels). Pressure cuff tests were conducted using a blood pressure cuff with an inflation pump. Point load tests were conducted using a wooden dowel gently pushed into the skin.
Indenter test results were similar between amputee and able-bodied participants. Fluid volume tended to decrease in the quadrant to which indenter pressure was applied (Figure 10).
Results from testing effects of a 30-min doffing interval on an amputee participant's limb fluid volume showed strong recovery and retention for the anterior region, but less for the posterior region (Figure 11). The anterior region's ending percentage fluid volume change was greater than that for the posterior region.
Figure 11. Percentage change in extracellular fluid volume from the anterior and posterior regions of a residual limb.
Results from Channels 1 and 3 (see Figure 2A) are shown. During the 30-min rest period the participant doffed the prosthesis. The anterior region recovered and maintained fluid volume after rest better than the posterior region. Data from the beginning and end of each sit, stand, and walk phase are shown.
IV. Discussion
The purpose of this research was to create a multi-channel bioimpedance platform useful for testing limb fluid volume changes on people with limb amputation. The system provided the needed versatility so as to establish design settings necessary for residual limb fluid volume monitoring. The developed system provided the user control over the current injection stimulus frequencies, durations, and intermission intervals and control over the sampling delays and demodulation average schemes for each of four sensing channels so that they could be optimized for the application at hand. In addition data were immediately displayed to allow the user to quickly identify any setup problems on the amputee test participant. Surface electrodes were designed with a low profile so that they were comfortable and durable when positioned at the limb-socket interface.
There was no gold standard with sufficient sensitivity with which to compare bioimpedance test results on people with limb loss. However, studies in related fields have used deuterium oxide and bromide dilution techniques as well as magnetic resonance imaging to validate bioimpedance measurements [21-26].
In our prosthetics application it was desirable to maximize the sampling rate while maintaining sufficiently low error across all frequencies. Because the embedded PC's acquisition rate was constant, fewer points per cycle were sampled at high frequencies compared with low frequencies, thus a greater numbers of cycles were required at high frequencies than at low frequencies to maintain low error (1002 at 501 kHz compared with 20 at 10 kHz). The system sampling rate of 19.7 Hz, was considered acceptable by Nyquist standards for monitoring human walking since it has been demonstrated that 99.7% of the signal power in human walking is contained within the 0 to 6 Hz bandwidth [27]. For other activities such as running, a higher sampling rate would be needed.
A long sampling delay (200 μs) was required only for the first low frequency (5 kHz) due to system relaxation effects during periods of no stimulus. For all other transitions between adjacent bursts a short sampling delay (10 μs) was sufficient.
The intermission interval duration necessary to accomplish less than a 0.025% error was consistent across frequencies at 100 μs. In future studies, however, a varied interval may prove appropriate under certain participant conditions or disease states with high tissue latency [28]. Applications that require multiple current injection channels be stimulated with different stimulus profiles may require longer intermission intervals so as to reduce interaction.
RMS signal error in the developed instrument was less than half of that reported for a commercial system used for amputee participant testing (Hydra 4200, XiTRON) [6]. This improvement was a result in part of the timing control achievable using the FPGA-based system, as evidenced by the low error in the loop-back test results shown in Figure 3A,B.
Introduction of lead wires and electrodes did not appreciably affect the resistive component of demodulation but did affect the reactive component at high frequencies. However, the impact was reasonably consistent across test circuits (Figure 5A-C). Clearly, the lead wires and electrodes needed to be in place during calibration.
Position of the proximal current injection electrode likely affected impedance measurements because of a constrictional zone effect in the proximal thigh [17]. The current was more uniformly distributed across the cross-section of the limb with a greater distance between current injection and voltage sensing electrodes. A proximal current injection to proximal voltage sensing electrode distance of at least 25 cm was deemed appropriate for subsequent amputee participant studies.
Because the distal surface of the residual limb was in a plane parallel with the limb cross-section, the constrictional zone there may be minimal. Current traveled outward from the entire electrode surface perpendicular to the limb cross section. There was little benefit to an electrode diameter greater than 3.5 cm since the cross-section was well covered. Further, in subsequent amputee participant testing, we found that an electrode diameter greater than 3.5 cm tended to be uncomfortable to some amputee test participants. In addition, a larger size on participants with small residual limbs would create a short spacing between the distal current injection and distal voltage sensing electrodes, which could affect performance. In subsequent studies to ensure the electrode was well-centered on the distal residual limb surface, we referenced distal electrode position relative to anatomical landmarks.
A long voltage sensing electrode length was desirable because it provided a better spatial average measurement of impedance than a short length [17]. The inconsistent direction of impedance change beyond 3.0 cm (Figure 7C) suggests that error from misaligning the electrode with the limb cross-section was comparable to the impedance change from a greater spatial average. We noted that some participants found a long electrode length uncomfortable due to the skin strains they induced during ambulation. A length of 5.0 cm was found to be a good compromise between these two factors.
It is reasonable that the sum of adjacent electrode pairs produced a larger VECF (lower impedance) than the single outside pair (Figure 8) because of the shorter distance between electrode edges. The two-channel configuration essentially shortened the distance between electrodes, reducing the measured impedance and increasing the extracellular fluid volume measurement. It is also possible that presence of the intermediate electrodes drew current towards them and thus distorted the measurement [17] but we were not able to isolate impact of this influence.
We would expect an increase in distal quadrant (2 and 4) fluid volume for the amputee residual limb compared with the able-bodied participant limb when a blood pressure cuff is applied to the proximal quadrants (1 and 3). There was nowhere else for the fluid to travel in the amputee limb except within the confined distal section.
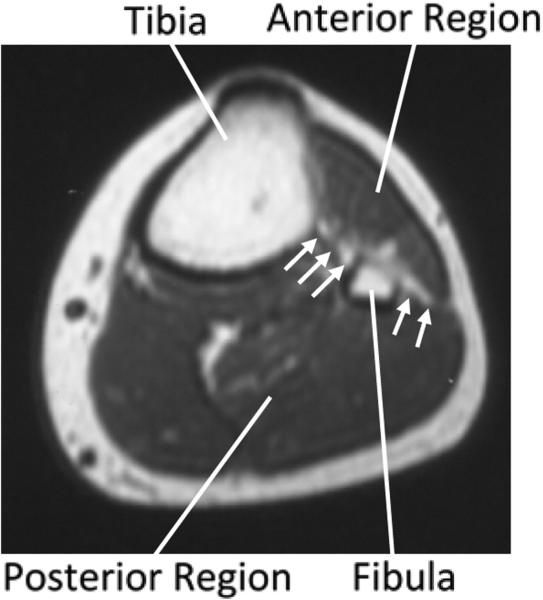
The indenter affecting only local impedance measurement supports interpretation that the anterior and posterior regions of the limb were separate. Fascial layers and the interosseous membrane, a bony structure, anatomically divide the two regions (Figure 12). Ambulatory data showing anterior and posterior regional differences substantiate that the two regions experienced different fluid volume changes in response to activity. The reduced fluid volume retention for the posterior region compared with the anterior region shown in Figure 11 may reflect socket pressures applied posteriorly during sitting. The anterior socket was unloaded during sitting since the socket tended to pull away from the surface, thus fluid volume recovery and retention during subsequent activity were stronger in the anterior region.
Figure 12. Cross-section of a lower limb.
The interosseous membrane and fascia layer that separate the anterior and posterior regions are indicated with arrows.
A next step in using bioimpedance towards prosthetics research and clinical care is to investigate and rank how variables under prosthetist and participant control affect limb fluid volume and to characterize their dependence. For example, it is likely that there is a dependence on amputee participant vascular health, thus an investigation of presence of peripheral arterial disease on limb fluid volume changes during walking and during socket release would be warranted. Insight from such studies should help practitioners and people with limb loss to better manage residual limb fluid volume fluctuations.
A portable bioimpedance system would allow field testing outside the laboratory and generate insight into the time course of limb fluid volume change. Information gained in the present study about appropriate stimulus profiles, sampling delays, and electrode design and layout informs design of the portable system.
V. Conclusion
A bioimpedance platform for use in residual limb fluid volume monitoring was developed. Results from the present research demonstrated that the proximal current injection electrode needed to be at least 25 cm from the proximal voltage sensing electrode. A thin layer of hydrogel needed to be present during testing to ensure good electrical coupling. Using a burst duration of 2.0 ms, intermission interval of 100 μs, and sampling delay of 10 μs at each of 24 frequencies between 5 kHz and 1 MHz (uniformly distributed on a log scale) except 5 kHz which required a 200 μs sampling delay, the system achieved a sampling rate of 19.7 Hz.
The instrument has use towards the identification and ranking of how participant qualities and prosthesis characteristics affect residual limb fluid volume, a key measure affecting quality of prosthetic fit. The instrument is uniquely specialized to meeting the needs of residual limb bioimpedance spectroscopy. Its multichannel design, fast readout rate, tunable frequency profile, and versatile electrode scheme make it superior to commercially available instruments for investigating fluid volume changes in amputee residual limbs.
Acknowledgments
This work was supported by the Department of Defense under CDMRP Grant W81XWH-10-1-1035, and by the National Institutes of Health under American Reinvestment and Recovery Act Grant R01HD060585.
Contributor Information
JE Sanders, Department of Bioengineering at the University of Washington, Seattle WA 98195 USA..
MM Moehring, Spencer Technologies, Redmond WA 98052 USA.; Broadview Labs, Seattle WA 98177 USA.
TM Rothlisberger, Spencer Technologies, Redmond WA 98052 USA.; Cerevast Therapeutics, Redmond WA 98052 USA.
RH Phillips, Department of Bioengineering at the University of Washington.; Jefferson University, Philadelphia PA 19107; C-SATS Inc., Seattle WA 98105 USA; Joint Institute for the Study of the Atmosphere and Ocean at the University of Washington 98105 USA; and Recreational Equipment Inc., Seattle WA 98032 USA, respectively.
T Hartley, Department of Bioengineering at the University of Washington.; Jefferson University, Philadelphia PA 19107; C-SATS Inc., Seattle WA 98105 USA; Joint Institute for the Study of the Atmosphere and Ocean at the University of Washington 98105 USA; and Recreational Equipment Inc., Seattle WA 98032 USA, respectively.
CR Dietrich, Department of Bioengineering at the University of Washington.; Jefferson University, Philadelphia PA 19107; C-SATS Inc., Seattle WA 98105 USA; Joint Institute for the Study of the Atmosphere and Ocean at the University of Washington 98105 USA; and Recreational Equipment Inc., Seattle WA 98032 USA, respectively.
CB Redd, Department of Bioengineering at the University of Washington, Seattle WA 98195 USA..
DW Gardner, Department of Bioengineering at the University of Washington.; Jefferson University, Philadelphia PA 19107; C-SATS Inc., Seattle WA 98105 USA; Joint Institute for the Study of the Atmosphere and Ocean at the University of Washington 98105 USA; and Recreational Equipment Inc., Seattle WA 98032 USA, respectively.
JC Cagle, Department of Bioengineering at the University of Washington, Seattle WA 98195 USA..
REFERENCES
- 1.Berke G. Post-operative management of the lower extremity amputee: Standards of care. Official findings of the state-of-the-science conferences #2. J Prosthet Orthot. 2004;16(3S):6–12. [Google Scholar]
- 2.Golbranson FL, Wirta RW, Kuncir EJ, Lieber RL, Oishi C. Volume changes occurring in postoperative below-knee residual limbs. J Rehabil Res Dev. 1988;25(2):11–18. [PubMed] [Google Scholar]
- 3.Fernie GR, Holliday PJ. Volume fluctuations in the residual limb of lower limb amputees. Arch Phys Med Rehabil. 1982;63(4):162–165. [PubMed] [Google Scholar]
- 4.Lilja M, Oberg T. International forum: proper time for definitive prosthetic fitting. J Prosthet Orthot. 1997;9(2):90–95. [Google Scholar]
- 5.Sanders JE, Severance MR, Allyn KJ. Computer-socket manufacturing error: How much before it is clinically apparent? J Rehabil Res Dev. 2012;49(4):567–582. doi: 10.1682/jrrd.2011.05.0097. [DOI] [PMC free article] [PubMed] [Google Scholar]
- 6.Sanders JE, Fatone S. Residual limb volume change: Systematic review of measurement and management. J Rehabil Res Dev. 2011;48(8):949–986. doi: 10.1682/jrrd.2010.09.0189. [DOI] [PMC free article] [PubMed] [Google Scholar]
- 7.Antonnsson EK, Mann RW. The Frequency Content of Gait. J Biomech. 1985;18(1):39–47. doi: 10.1016/0021-9290(85)90043-0. [DOI] [PubMed] [Google Scholar]
- 8.Pease RA. A Comprehensive Study of the Howland Current Pump. National Semiconductor Corporation Application Note. 2008;AN-1515 [Google Scholar]
- 9.Hanai T. Emulsion Science. Academic Press; London, England: 1968. Electrical properties of emulsions; pp. 354–477. [Google Scholar]
- 10.Fenech M, Jaffrin MY. Extracellular and intracellular volume variations during postural change measured by segmental and wrist-ankle bioimpedance spectroscopy. IEEE Trans Biomed Eng. 2004;51(1):166–175. doi: 10.1109/TBME.2003.820338. [DOI] [PubMed] [Google Scholar]
- 11.Calnan C. Nickel Dermatitis. Brit J Dermatol. 1956;68(7):229–36. doi: 10.1111/j.1365-2133.1956.tb12808.x. [DOI] [PubMed] [Google Scholar]
- 12.Bao J-Z, Davis CC, Schmukler RE. Impedance spectroscopy of human erythrocytes: System calibration and nonlinear modeling. IEEE Trans Biomed Engi. 1993;40(4):364–378. doi: 10.1109/10.222329. [DOI] [PubMed] [Google Scholar]
- 13.Sanders JE, Cagle JC, Allyn KJ, Harrison DS, Ciol MA. How do walking, standing, and resting influence transtibial amputee residual limb fluid volume? J Rehabil Res Dev. 2014;51(2):201–212. doi: 10.1682/JRRD.2013.04.0085. [DOI] [PMC free article] [PubMed] [Google Scholar]
- 14.Sanders JE, Hartley TL, Phillips RH, Ciol MA, Hafner BJ, Allyn KJ, Harrison DS. Does temporary socket removal affect residual limb fluid volume of trans-tibial amputees? Prosthet Orthot Int. 2015 doi: 10.1177/0309364614568413. in press. [DOI] [PMC free article] [PubMed] [Google Scholar]
- 15.Cole KS, Li CL, Bak AF. Electrical analogues for tissues. Exp Neurol. 1969;24(3):459–473. doi: 10.1016/0014-4886(69)90149-6. [DOI] [PubMed] [Google Scholar]
- 16.De Lorenzo A, Andreoli A, Matthie J, Withers P. Predicting body cell mass with bioimpedance by using theoretical methods: A technological review. J Appl Physiol. 1997;82(5):1542–1558. doi: 10.1152/jappl.1997.82.5.1542. [DOI] [PubMed] [Google Scholar]
- 17.Grimnes S, Martinsen OG. Bioimpedance and Bioelectricity Basics. 2nd ed. Academic Press; London, England: 2008. [Google Scholar]
- 18.Scharfetter H, Hartinger P, Hinghofer-Szalkay H, Hutten H. A model of artefacts produced by stray capacitance during whole body or segmental bioimpedance spectroscopy. Physiol. Meas. 1998;19:246–261. doi: 10.1088/0967-3334/19/2/012. [DOI] [PubMed] [Google Scholar]
- 19.Aliau-Bonet C, Pallas-Areny R. On the Effect of Body Capacitance to Ground in Tetrapolar Bioimpedance Measurements. IEEE Trans Biomed Eng. 2012;59(12):3405–3411. doi: 10.1109/TBME.2012.2216880. [DOI] [PubMed] [Google Scholar]
- 20.Grimnes S, Martinsen ØG. Sources of error in tetrapolar impedance measurements on biomaterials and other ionic conductors. J. Phys. D: Appl. Phys. 2007;40:9–14. [Google Scholar]
- 21.Organ LW, Bradham GB, Gore DT, Lozier SL. Segmental bioelectrical impedance analysis: Theory and application of a new technique. J Appl Physiol. 1994;77(1):98–112. doi: 10.1152/jappl.1994.77.1.98. [DOI] [PubMed] [Google Scholar]
- 22.Segal KR, Burastero S, Chun A, Coronel P, Pierson RN, Wang J. Estimation of extracellular and total body water by multiple-frequency bioelectrical-impedance measurement. Am J Clin Nutr. 1991;54(1):26–29. doi: 10.1093/ajcn/54.1.26. [DOI] [PubMed] [Google Scholar]
- 23.Wotton MJ, Thomas BJ, Cornish BH, Ward LC. Comparison of whole body and segmental bioimpedance methodologies for estimating total body water. Ann N Y Acad Sci. 2000;904:181–186. doi: 10.1111/j.1749-6632.2000.tb06444.x. [DOI] [PubMed] [Google Scholar]
- 24.Armstrong LE, Kenefick RW, Castellani JW, Riebe D, Kavouras SA, Kuznicki JT, Maresh CM. Bioimpedance spectroscopy technique: Intra-, extracellular, and total body water. Med Scsi Sports Exerc. 1997;29(12) doi: 10.1097/00005768-199712000-00017. [DOI] [PubMed] [Google Scholar]
- 25.Siconolfi SF, Gretebeck RJ, Wong WW, Pietrzyk RA, Suire SS. Assessing total body and extracellular water from bioelectrical response spectroscopy. J Appl Physiol. 1997;82(2):704–710. doi: 10.1152/jappl.1997.82.2.704. [DOI] [PubMed] [Google Scholar]
- 26.Miyatani M, Kanehisa H, Masuo Y, Ito M, Fukunaga T. Validity of estimating limb muscle volume by bioelectrical impedance. J Appl Physiol. 2001;91(1):386–394. doi: 10.1152/jappl.2001.91.1.386. [DOI] [PubMed] [Google Scholar]
- 27.Winter DA, Sidwall HG, Hobson DA. Measurement and reduction of noise in kinematics of locomotion. J Biomech. 1974;7(2):157–159. doi: 10.1016/0021-9290(74)90056-6. [DOI] [PubMed] [Google Scholar]
- 28.Blad B, Baldetorp B. Impedance spectra of tumor tissue in comparison with normal tissue; a possible clinical application for electrical impedance tomography. Physiol Meas. 1996;17S4A:A105–A115. doi: 10.1088/0967-3334/17/4a/015. [DOI] [PubMed] [Google Scholar]


