

Abstract
Little is known about the molecules mediating the cross‐talk between post‐traumatic axons and scar‐forming cells after spinal cord injury. We found that a sustained NB‐3 induction was simultaneously present in the terminations of post‐traumatic corticospinal axons and scar‐forming cells at the spinal lesion site, where they were in direct contact when axons tried to penetrate the glial scar. The regrowth of corticospinal axons was enhanced in vivo with NB‐3 deficiency or interruption of NB‐3 trans‐homophilic interactions. Biochemical, in vitro and in vivo evidence demonstrated that NB‐3 homophilically interacted in trans to initiate a growth inhibitory signal transduction from scar‐forming cells to neurons by modulating mTOR activity via CHL1 and PTPσ. NB‐3 deficiency promoted BMS scores, electrophysiological transmission, and synapse reformation between regenerative axons and neurons. Our findings demonstrate that NB‐3 trans‐homophilic interactions mediate the cross‐talk between post‐traumatic axons and scar‐forming cells and impair the intrinsic growth ability of injured axons.
Keywords: NB‐3, axonal regeneration, spinal cord injury
Subject Categories: Neuroscience
Introduction
Axonal regeneration of the corticospinal tract (CST), which controls voluntary movements, has been intensively studied in spinal cord injury (SCI). After injury, the glial scar is formed by reactive astrocytes, microglia, fibroblasts, macrophages, and pericytes. In the context of axonal regeneration, formation of the glial scar has been shown to have both beneficial and detrimental effects (Bradbury et al, 2002; Faulkner et al, 2004; Silver & Miller, 2004; Okada et al, 2006; Herrmann et al, 2008; Sofroniew, 2009; Goritz et al, 2011; Sabelstrom et al, 2013; Wanner et al, 2013). Removal of inhibitory factors at the lesion site allows sprouting of spared axons but is insufficient for axonal regeneration (Hill et al, 2001; Barritt et al, 2006; Giger et al, 2010). Neuronal intrinsic mechanisms have important roles in regulating axonal regeneration in the central nervous system (CNS). Phosphatase and tensin homolog (PTEN) inactivation in retinal ganglion cells (RGCs) and corticospinal neurons or co‐deletion of PTEN and suppressor of cytokine signaling 3 (SOCS3) in RGCs leads to robust axonal regeneration after injury (Park et al, 2008; Liu et al, 2010; Sun et al, 2011). Sustained enhanced STAT3 expression promotes corticospinal remodeling and functional recovery after SCI (Lang et al, 2013). However, the molecular mechanisms underlying how scar‐forming cells modulate the neuronal intrinsic growth ability have not been well elucidated.
Contactins are a subgroup of neural recognition molecules belonging to the immunoglobulin (Ig) superfamily that are expressed exclusively in the nervous system. Six membrane proteins of this subgroup have been identified: contactin‐1 (F3), contactin‐2 (TAG‐1), contactin‐3 (BIG‐1), contactin‐4 (BIG‐2), contactin‐5 (NB‐2), and contactin‐6 (NB‐3). NB‐3 has a wide range of roles in neural development (Takeda et al, 2003; Sakurai et al, 2009, 2010; Huang et al, 2012). NB‐3 interacts with close homolog of L1 (CHL1) and protein tyrosine phosphatase α (PTPα) and mediates signaling via PTPα to regulate apical dendrite projections in the developing caudal visual cortex (Ye et al, 2008). These data strongly indicate that NB‐3, CHL1, and PTP may form a signaling complex for modulating neural development.
NB‐3 is involved in brain damage after cerebral ischemia (Huang et al, 2011). Sustained upregulation of CHL1 expression is induced in glial fibrillary acidic protein (GFAP)‐positive astrocytes and fibroblasts that form the glial scar in wild‐type (WT) mice and inhibits locomotion recovery after SCI (Jakovcevski et al, 2007). PTPσ, a homolog of PTPα, is a type IIa receptor PTP and acts as a receptor for both heparan sulfate proteoglycans (HSPGs) and chondroitin sulfate proteoglycans (CSPGs) (Johnson & Van Vactor, 2003; Coles et al, 2011). Loss of PTPσ enhances regeneration in sciatic, facial, optic, and corticospinal axons after injury (McLean et al, 2002; Thompson et al, 2003; Sapieha et al, 2005; Shen et al, 2009; Fry et al, 2010), although the mechanism remains unclear.
We describe here that a novel molecular mechanism is responsible for the effect of the neural recognition molecule NB‐3 in the regulation of axonal regeneration after SCI that mediates the cross‐talk between post‐traumatic axons and scar‐forming cells by modulating mammalian target of rapamycin (mTOR) activity in neurons via CHL1 and PTPσ.
Results
NB‐3 induction in scar‐forming cells at the lesion site after SCI
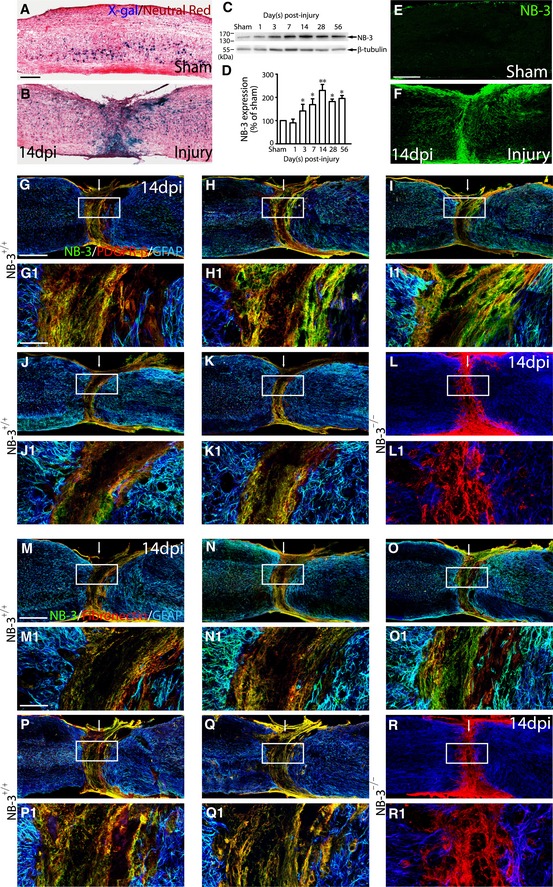
Spinal T10 complete transection was performed by modifying previously described methods (Liu et al, 2008). To assess how NB‐3 is involved in SCI, NB‐3 expression was first examined in sagittal sections of intact and injured mouse spinal cords. Because NB‐3‐deficient (NB‐3−/−) mice were generated by substituting the genomic region of NB‐3 that encodes the secretion signal and part of the first Ig domain with LacZ and Neo genes (Takeda et al, 2003), we initially assessed the expression pattern of NB‐3 using X‐gal staining in NB‐3+/− mice. In the intact NB‐3+/− mouse spinal cord, NB‐3 was expressed weakly in scattered cells along the spinal cord (Fig 1A). In the injured spinal cord, NB‐3 expression was strongly upregulated and was particularly concentrated in the lesion area (Fig 1B). Upregulation of NB‐3 in the lesion area was also detected with Western blot analysis beginning 3 days post‐injury. This upregulation reached a peak 14 days post‐injury and was sustained at a high level until at least 56 days post‐injury (Fig 1C and D). The sustained increase in NB‐3 in the injured spinal cord suggested that a large amount of NB‐3 was induced after injury, most likely in the scar‐forming cells at the lesion site (Fig 1E and F).
Figure 1. Induced expression of NB‐3 in the lesion area after SCI .
-
A, BX‐gal staining showed NB‐3/LacZ expression in the sham‐operated (A) and injured (B) spinal cords from adult NB‐3+/− mice.
-
C, DWestern blot analysis (C) and quantification (D) of NB‐3 expression in the lesion area post‐injury. NB‐3 expression levels were normalized by β‐tubulin. Data are presented as mean ± SEM. *P < 0.05 and **P < 0.01; one‐way ANOVA followed by Bonferroni's post‐test. Data were analyzed from 10 independent experiments each including two mice per group.
-
E, FSingle‐labeling immunostaining showed NB‐3 expression in the sham‐operated (E) and injured (F) spinal cords from adult NB‐3+/+ mice.
-
G–KCo‐immunostaining of NB‐3 (green), PDGFR‐β (red), and GFAP (blue) on serial sagittal sections from the same NB‐3+/+ spinal cord 14 days post‐injury. (G1–K1) High‐magnification images of boxed areas in (G–K), respectively.
-
LCo‐immunostaining of NB‐3 (green), PDGFR‐β (red), and GFAP (blue) on sagittal sections from the NB‐3−/− spinal cord 14 days post‐injury. (L1) High‐magnification image of the boxed area in (L). The arrows indicate the lesion sites.
-
M–QCo‐immunostaining of NB‐3 (green), fibronectin (red), and GFAP (blue) on serial sagittal sections from the same NB‐3+/+ spinal cord 14 days post‐injury. (M1–Q1) High‐magnification images of boxed areas in (M–Q), respectively.
-
RCo‐immunostaining of NB‐3 (green), fibronectin (red), and GFAP (blue) on sagittal sections from the NB‐3−/− spinal cord 14 days post‐injury. (R1) High‐magnification image of the boxed area in (R).
To further identify the types of cells that expressed NB‐3 in the injured NB‐3+/+ mouse spinal cord, co‐immunostaining was performed with NB‐3 antibody and GFAP antibody to label astrocytes, fibronectin antibody to label fibroblasts, or platelet‐derived growth factor receptor (PDGFR)‐β antibody to label pericytes. NB‐3 protein was strongly expressed in GFAP‐positive astrocytes along the lesion border (Fig 1G–K1 and M–Q1), which represent reactive astrocytes forming the glial scar after SCI. In addition, PDGFR‐β‐positive pericytes (Fig 1G–K1) and fibronectin‐positive fibroblasts (Fig 1M–Q1) that were located at the epicenter of the scar also strongly expressed NB‐3 protein. In the injured NB‐3−/− mouse spinal cord, NB‐3 protein was undetectable in GFAP‐positive astrocytes, PDGFR‐β‐positive pericytes, and fibronectin‐positive fibroblasts at the spinal lesion site (Fig 1L, L1, R and R1).
Induction of NB‐3 protein at the distal terminations of post‐traumatic corticospinal axons and neurons
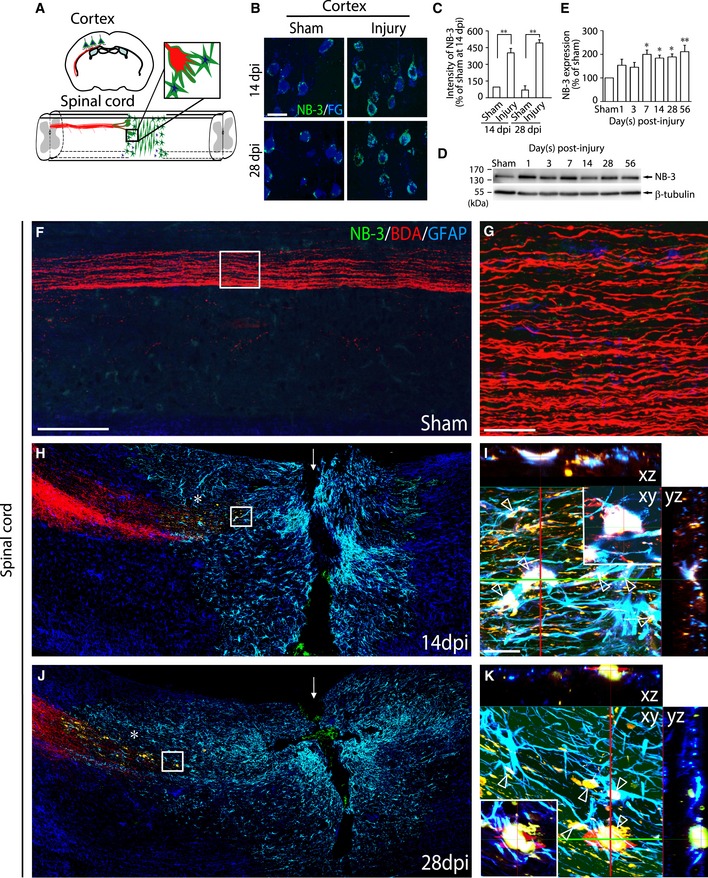
Next, we examined the pattern of induced expression of NB‐3 protein in post‐traumatic CST. Corticospinal axons originate from pyramidal neurons in layer V of the sensorimotor cortex (Fig 2A). Fluorogold (FG) was injected into the lesion area in the sham‐injured and injured spinal cords to retrogradely trace these corticospinal neurons. Immunohistochemistry revealed that NB‐3 expression was induced in FG‐labeled corticospinal neurons 14 and 28 days post‐injury (Fig 2B and C). Western blotting showed that the expression of NB‐3 protein was upregulated in the sensorimotor cortex for at least 8 weeks after SCI (Fig 2D and E). Biotinylated dextran amine (BDA) was injected into the sensorimotor cortex for anterograde tracing of the corticospinal axons. Sagittal sections of sham‐operated spinal cord showed that NB‐3 was undetectable in intact corticospinal axons (Fig 2F and G). In contrast, at 14 and 28 days post‐injury, induced expression of NB‐3 was detected mainly at the terminations of post‐traumatic axons (Fig 2H and J, asterisks and boxed areas; Fig 2I and K), which formed typical retraction bulbs (Fig 2I and K, arrowheads).
Figure 2. Induced expression of NB‐3 in corticospinal neurons and axons after SCI .
-
ADiagram of the NB‐3 induction (green) after SCI.
-
BNB‐3 expression in corticospinal neurons 14 and 28 days post‐injury (dpi). FG (blue) was applied to retrogradely label corticospinal neurons.
-
CQuantification of the fluorescence intensity of NB‐3 in (B). **P < 0.01; one‐way ANOVA followed by Bonferroni's post‐test. The intensities of more than 300 corticospinal neurons from three mice in each group were quantified.
-
D, EWestern blot analysis (D) and quantification (E) of NB‐3 expression in the sensorimotor cortex after SCI. NB‐3 expression levels were normalized by β‐tubulin. *P < 0.05 and **P < 0.01; one‐way ANOVA followed by Bonferroni's post‐test. Data were analyzed from three independent experiments each including three mice per group.
-
F–KInduced NB‐3 expression at the distal terminations of post‐traumatic corticospinal axons and in reactive astrocytes at the lesion border 14 (H and I) and 28 days post‐injury (dpi) (J and K). BDA (red) was applied to anterogradely label corticospinal axons. GFAP (blue) was used to label reactive astrocytes. (G) High‐magnification image of the boxed area in (F). (I and K) High‐magnification and x‐y‐z reconstruction images of boxed areas in (H and J), respectively, show co‐localization of NB‐3 and GFAP in astrocytes at the lesion border and co‐localization of NB‐3 in BDA‐labeled axons and GFAP‐positive astrocytes at the contact surface of corticospinal axons and astrocytes (arrowheads). The arrows in (H and J) indicate the lesion sites. The asterisks in (H and J) indicate the terminations of the BDA‐labeled projecting axons.
Thus, after SCI, NB‐3 that was induced in the somas of corticospinal neurons was transported to and accumulated at the terminations of injured corticospinal axons, and, simultaneously, induced NB‐3 accumulated in the scar‐forming cells. At the lesion site, the terminations of NB‐3‐positive post‐traumatic axons directly contacted these NB‐3‐positive scar‐forming cells.
Axonal regrowth in NB‐3‐deficient mice after SCI
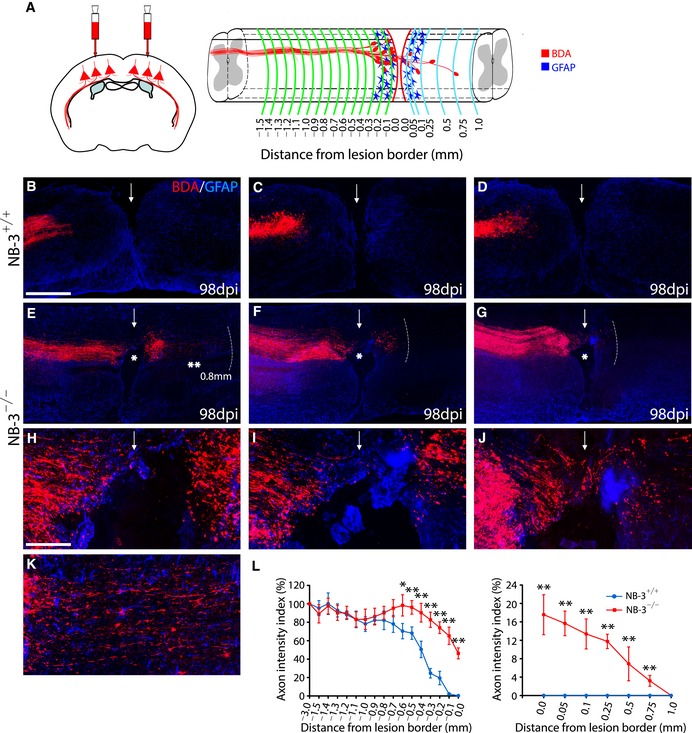
To investigate the effect of NB‐3 induction in both transected axonal terminations and scar‐forming cells at the spinal lesion site, we assessed whether a deficiency in NB‐3 affected the intrinsic growth ability of severed corticospinal axons. NB‐3+/+ and NB‐3−/− mice underwent complete spinal transection at the T10 segment. BDA was injected into the sensorimotor cortex to trace the corticospinal axons 2 weeks before the mice were sacrificed, and GFAP immunostaining outlined the borders of the lesion (Fig 3A). In NB‐3+/+ mice, most post‐traumatic corticospinal axons retracted from the lesion border and adhered rostrally to the glial scar, which did not extend to the lesion site at all, even 14 weeks after complete transection (Fig 3B–D). In contrast, the serial sections that encompassed the main CST showing the completely transected corticospinal axons in NB‐3−/− mice displayed vigorous regrowth (Fig 3E–K), with many more continuous BDA‐labeled axons penetrating into the rostral lesion border, and some axons even traversed the lesion epicenter (Fig 3E–K; Fig 3E–G, single asterisks) and grew into the distal spinal cord 0.8 mm to the caudal lesion border (Fig 3E and K, double asterisks). Quantification of the axon intensity index at various distances relative to the lesion border revealed significantly enhanced numbers of axons in the injured spinal cords of NB‐3−/− mice from −0.6 to 0 mm to the rostral lesion border, and from 0 to 0.75 mm to the caudal lesion border as compared with NB‐3+/+ mice (Fig 3L), suggesting that NB‐3‐deficient corticospinal axons had an enhanced regrowth capability.
Figure 3. Deficiency in NB‐3 leads to enhanced regrowth of post‐traumatic corticospinal axons.
-
ADiagram showing BDA‐labeled corticospinal axons at certain distances from the spinal lesion border after SCI. BDA (red) was applied into sensorimotor cortex to anterogradely label corticospinal axons. GFAP (blue) was used to label reactive astrocytes and outline the lesion border in the injured spinal cord. The red dashed lines indicate the rostral and caudal borders of the lesion; the green dashed lines indicate various distances from the rostral lesion border (0 mm); the blue dashed lines indicate various distances from the caudal lesion border (0 mm).
-
B–KRepresentative images of serial sagittal sections showing the main BDA‐labeled corticospinal axons in NB‐3+/+ (B–D) and NB‐3−/− (E–G) mice 14 weeks after complete spinal transection. (H–J) High‐magnification images of the areas in (E–G) (single asterisks), respectively. (K) High‐magnification image of the area in (E) (double asterisks). The arrows indicate the lesion sites; the white dashed lines indicate the regenerative corticospinal axons extending into the distal spinal cord; the single asterisks in (E–G) indicate the lesion epicenters; the double asterisks in (E) indicate the axons extending from the caudal lesion border. Scale bars, 400 μm (B–G) and 100 μm (H–K).
-
LQuantification of the intensity index of BDA‐labeled axons at certain distances from the lesion border in (B–G). Data are presented as mean ± SEM. *P < 0.05 and **P < 0.01; two‐way ANOVA followed by Fisher's LSD. n = 25 mice per group.
We noticed some regrowing axons extended along the GFAP‐positive astrocytes (Fig 3E–K and Appendix Fig S1A–I). Quantification revealed the percentage of regenerative corticospinal axons associated with astrocytes in NB‐3−/− mice. In the injured spinal cords of NB‐3−/− mice, 55% of regenerative axons were associated with astrocytes from −0.5 to 0 mm to the rostral lesion border, 66% of regenerative axons were associated with astrocytes at the lesion epicenter, and 57% of regenerative axons were associated with astrocytes from 0 to 0.5 mm to the caudal lesion border (Appendix Fig S1J). Otherwise, in all the NB‐3−/− mice that underwent complete spinal transection and the spinal lesion epicenter had GFAP‐positive tissue bridges, 66% of regenerative axons were associated with GFAP‐positive tissue bridges (Appendix Fig S1K, K1, and L). These results indicated the supportive role of astrocytes for axonal extension, which was similar to findings in PTEN‐deletion mice that regenerating axons crossed the lesion in association with astrocytes (Liu et al, 2010; Zukor et al, 2013).
In addition, analysis of scar‐forming cells at the lesion sites in both NB‐3+/+ and NB‐3−/− mice showed the normal distribution and appearance of astrocytes (Appendix Fig S2), pericytes (Appendix Fig S3A–E), and fibroblasts (Appendix Fig S3F–J) in NB‐3−/− mice after SCI, indicating that the enhanced regrowth capability of corticospinal axons was not due to the changes of glial scar formation in NB‐3−/− mice.
NB‐3‐deficient mice exhibited the increase in BMS scores, electrophysiological improvement, and synapse reformation after SCI
NB‐3+/+ and NB‐3−/− mice underwent T10 complete transection injury, and open‐field locomotor function was measured with BMS scores. In both NB‐3+/+ and NB‐3−/− mice, hindlimb locomotion was severely impaired for the first week after injury, slightly improved over time, and reached a plateau 42 days later. NB‐3−/− mice showed higher BMS scores than did NB‐3+/+ mice between 21 and 56 days post‐injury (Fig 4A).
Figure 4. Increase in BMS scores, electrophysiological improvement, and synapse reformation of NB‐3‐deficient mice after SCI .
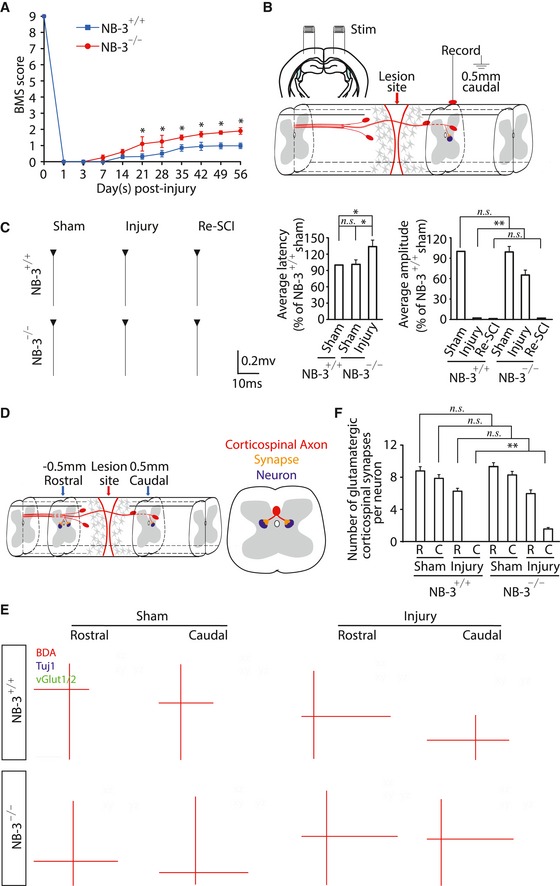
- Time course of the change in BMS scores in NB‐3+/+ and NB‐3−/− mice as measured with the BMS rating scale after spinal cord complete transection. *P < 0.05; two‐way ANOVA followed by Bonferroni's post‐test. n = 25 mice per group.
- Diagram showing electrophysiological analysis of transmission across the spinal lesion site.
- Electrophysiological transmission across the spinal lesion site. In each group of NB‐3+/+ and NB‐3−/− mice, the electrophysiological responses in the caudal spinal cord were recorded in the condition of sham‐operated or 12 weeks post‐injury. The latencies and amplitudes of responses were analyzed and quantified in each group. n.s., not significant, *P < 0.05 and **P < 0.01; two‐way ANOVA followed by Bonferroni's post‐test. n = 10 mice per group.
- Diagram showing analysis of synapse reformation between regenerative axons and neurons in the injured spinal cord 0.5 mm rostral to the lesion site or 0.5 mm caudal to the lesion site.
- Representative images of coronal sections showing synapse formation between the glutamatergic corticospinal terminals and spinal neurons in NB‐3+/+ and NB‐3−/− mice. Corticospinal axons, neurons, and glutamatergic terminals of corticospinal axons were labeled with BDA (red), Tuj1 (blue), and vGlut1/2 (green), respectively. Each group showed the data from the rostral and caudal spinal cord in the condition of sham‐operated or 12 weeks post‐injury. Scale bar, 20 μm.
- Quantification of the number of glutamatergic corticospinal synapses per neuron in each group. n.s., not significant, **P < 0.01; two‐way ANOVA followed by Fisher's LSD. n = 15 mice per group.
To verify the dependence of higher BMS scores on axonal regeneration, electrophysiological transmission was measured. A pair of stimulating electrodes were placed in the sensorimotor cortex, and recordings were made at 0.5 mm caudal to the lesion site (Fig 4B). Stimulation at sensorimotor cortex evoked a short latency (3.61 ± 0.29 ms) response that was entirely abolished in NB‐3+/+ mice by T10 complete transection (Fig 4C). In contrast, evoked responses were restored in injured NB‐3−/− mice 12 weeks after SCI. However, response latencies (5.42 ± 0.18 ms) were prolonged and response amplitudes were smaller (40% reduction) in the injured NB‐3−/− mice, as compared with that in sham‐operated NB‐3+/+ mice (Fig 4C). Notably, retransection of the spinal cord at T10 completely abolished detectable activity upon sensorimotor cortex stimulation in NB‐3−/− mice (Fig 4C). These results strongly demonstrated that the absence of NB‐3 led to axonal regeneration of corticospinal tract and electrophysiological transmission across the spinal lesion site. The increase in BMS scores and electrophysiological activation supported the morphological evidence of increased axon regrowth in the injured spinal cords of NB‐3−/− mice.
Immunohistochemistry was carried out to detect the synapse reformation in the spinal cords of NB‐3−/− mice 12 weeks post‐injury (Fig 4D). Glutamatergic synapses were normally formed between corticospinal axons and interneurons in rostral and caudal spinal cord of sham‐operated NB‐3+/+ and NB‐3−/− mice (Fig 4E). Similarly normal glutamatergic synapses were also detected in the spinal cord 0.5 mm rostral to the lesion site, either in NB‐3+/+ or in NB‐3−/− mice (Fig 4E). However, glutamatergic synapses entirely disappeared in the distal spinal cord of the NB‐3+/+ mice with T10 complete transection (Fig 4E). In contrast, glutamatergic synapses were reformed between regenerative corticospinal axons and interneurons in the distal spinal cord of the NB‐3−/− mice 12 weeks post‐injury (Fig 4E). Quantification of the number of glutamatergic synapses per neuron confirmed the reformation of glutamatergic synapses between regenerative corticospinal axons and interneurons in the distal spinal cord of the NB‐3−/− mice (Fig 4F). These evidence strongly demonstrated that the regenerative corticospinal axons retargeted neurons and reformed glutamatergic synapses, suggesting reformation of glutamatergic synapses could contribute to re‐establishment of spinal neural circuitry in NB‐3−/− mice after SCI.
Interruption of NB‐3 homophilic binding enhances regrowth of post‐traumatic corticospinal axons
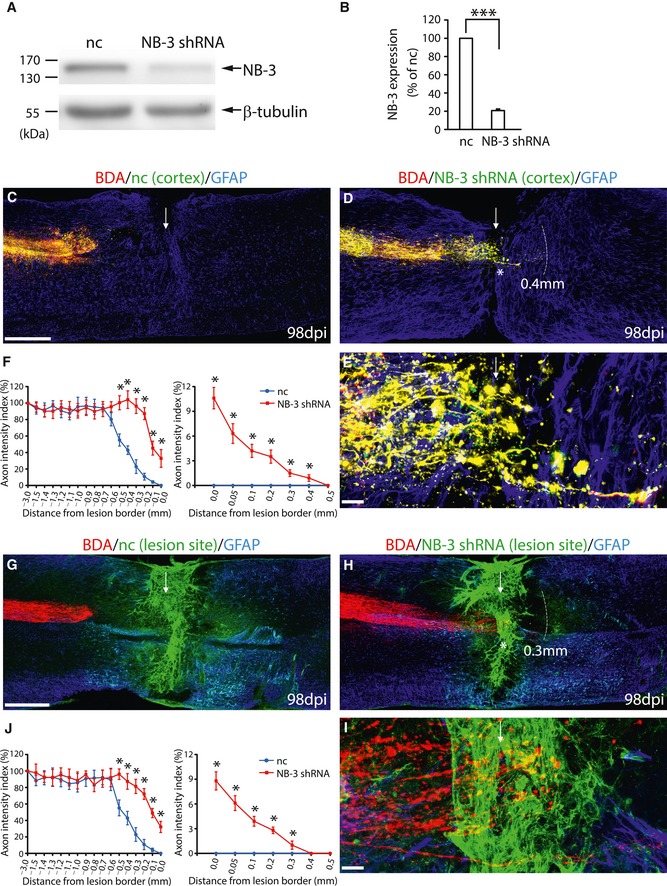
Injection of lentivirus (LV) expressing NB‐3 shRNA with GFP (LV‐NB‐3 shRNA‐GFP) in WT mice with complete spinal transection was performed to interrupt the NB‐3 homophilic interactions to further test our hypothesis. The knockdown efficiency of LV‐NB‐3 shRNA‐GFP was assessed first. Over 80% of endogenously expressed NB‐3 was knocked down in cultured pyramidal neurons (Fig 5A and B). LV‐NB‐3 shRNA‐GFP was injected into the sensorimotor cortex to knock down NB‐3 expression in corticospinal neurons and in the completely transected axons or into the spinal lesion site to knock down the NB‐3 expression in scar‐forming cells.
Figure 5. Interruption of NB‐3 homophilic binding leads to enhanced regrowth of post‐traumatic corticospinal axons.
-
A, BWestern blot analysis (A) and quantification (B) of NB‐3 expression in cultured pyramidal neurons infected with lentivirus encoding negative control (LV‐nc‐GFP) and that encoding NB‐3 shRNA (LV‐NB‐3 shRNA‐GFP). NB‐3 expression levels were normalized by β‐tubulin. ***P < 0.001; one‐sample t‐test. Data were analyzed from five independent experiments.
-
C–ESagittal sections showing the BDA‐labeled corticospinal axons in injured spinal cords following cortical injection of LV‐nc‐GFP (C) and LV‐NB‐3 shRNA‐GFP (D). High‐magnification image (E) of the area in (D) (asterisk).
-
FQuantification of the intensity index of BDA‐labeled axons at certain distances from the lesion border in (C and D). *P < 0.01; two‐way ANOVA followed by Fisher's LSD. n = 19 mice per group.
-
G–ISagittal sections showing the corticospinal axons in injured spinal cords following injection of LV‐nc‐GFP (G) and LV‐NB‐3 shRNA‐GFP (H) into the lesion sites. High‐magnification image (I) of the area in (H) (asterisk).
-
JQuantification of the intensity index of BDA‐labeled axons at certain distances from the lesion border in (G and H). *P < 0.01; two‐way ANOVA followed by Fisher's LSD. n = 17 mice per group.
In mice with cortical injection of negative control lentivirus (LV‐nc‐GFP), most BDA and GFP double‐labeled post‐traumatic corticospinal axons had retracted from the rostral lesion border, as did the axons labeled with BDA alone (Fig 5C). In the mice with cortical injection of LV‐NB‐3 shRNA‐GFP, many BDA and GFP double‐labeled axons extended farther toward the rostral lesion border and some of them even emerged from the caudal lesion border (Fig 5D and E) as compared with the axons labeled with BDA alone, which retracted from the rostral lesion border (Fig 5D). By comparing the regrowth extent of the post‐traumatic axons infected with LV‐NB‐3 shRNA‐GFP (Fig 5D) to those infected with LV‐nc‐GFP (Fig 5C), we found that LV‐NB‐3 shRNA‐GFP‐mediated knockdown of NB‐3 resulted in strong axonal extension 14 weeks after complete spinal transection. Quantification of the intensity index of BDA and GFP double‐labeled axons revealed significantly enhanced numbers of axons in the injured spinal cord from −0.5 to 0 mm to the rostral lesion border, and from 0 to 0.4 mm to the caudal lesion border in mice with cortical injection of LV‐NB‐3 shRNA‐GFP, as compared with that in mice with LV‐nc‐GFP injection (Fig 5F).
Regarding injecting LV into the spinal lesion site (Fig 5G–I), in some cases the BDA‐labeled post‐traumatic axons either contacted with LV‐infected GFP and GFAP double‐positive astrocytes or contacted with other LV‐infected GFP‐positive scar‐forming cells, whereas in other cases they did not. Many BDA‐labeled axons adhered rostrally to the lesion border, whether contacting LV‐nc‐GFP infected cells or not (Fig 5G). Compared with those axons, more BDA‐labeled axons that either contacted the LV‐NB‐3 shRNA‐GFP‐infected GFAP‐positive astrocytes or contacted other LV‐NB‐3 shRNA‐GFP‐infected scar‐forming cells extended immediately to the rostral lesion border and some of them even emerged from the caudal lesion border 14 weeks after complete spinal transection (Fig 5H and I). Quantification of the axon intensity index confirmed that injecting LV‐NB‐3 shRNA‐GFP into the spinal lesion site led to significantly increased numbers of axons in the injured spinal cord from −0.5 to 0 mm to the rostral lesion border, and from 0 to 0.3 mm to the caudal lesion border as compared with injecting LV‐nc‐GFP (Fig 5J).
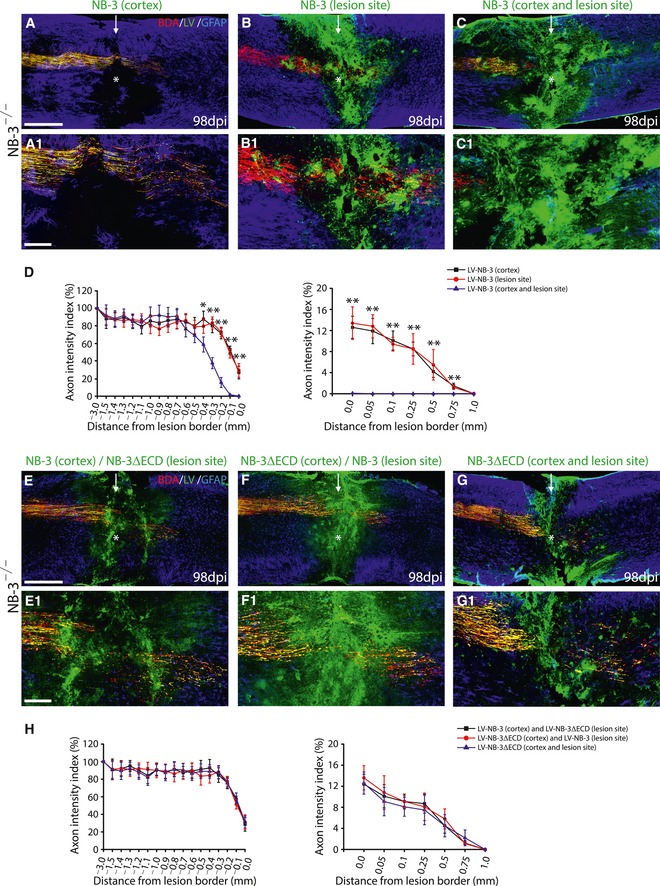
To obtain further evidence, we produced an LV overexpressing full‐length NB‐3 (LV‐NB‐3‐EGFP). In NB‐3−/− mice after complete spinal transection, LV‐NB‐3‐EGFP was injected into the sensorimotor cortex, into the spinal lesion site, or into both sites, respectively. Interruption of axonal regeneration was only observed when NB‐3 was overexpressed in both NB‐3−/− cortical neurons and scar‐forming cells 14 weeks after complete spinal transection (Fig EV1A–D).
Figure EV1. Regrowth of post‐traumatic corticospinal axons is interrupted by overexpression of NB‐3 in both cortex and the lesion site of NB‐3‐deficient mice.
-
A–CSagittal sections showing the corticospinal axons in injured spinal cords following injection of LV‐NB‐3‐EGFP into the cortex (A), the lesion epicenter (B), or both sites (C). High‐magnification images (A1–C1) of the areas in (A–C) (asterisks). The arrows indicate the lesion sites; the asterisks indicate the lesion epicenters.
-
DQuantification of the intensity index of EGFP‐labeled axons at certain distances from the lesion border in (A–C). *P < 0.05 and **P < 0.01; two‐way ANOVA followed by Fisher's LSD. n = 15 mice per group.
-
E–GSagittal sections showing the corticospinal axons in injured spinal cords following injection of LV‐NB‐3‐EGFP into the cortex and LV‐NB‐3ΔECD‐ EGFP into the lesion epicenter (E), or LV‐NB‐3ΔECD‐EGFP into the cortex and LV‐NB‐3‐EGFP into the lesion epicenter (F), or LV‐NB‐3ΔECD ‐EGFP into both sites (G). High‐magnification images (E1–G1) of the areas in (E–G) (asterisks). The arrows indicate the lesion sites.
-
HQuantification of the intensity index of EGFP‐labeled axons at certain distances from the lesion border in (E–G). Two‐way ANOVA followed by Fisher's LSD. n = 15 mice per group.
NB‐3 homophilically interacted in trans via its extracelluar domain. Thus, a construct encoding NB‐3 lacking the extracelluar domain (NB‐3ΔECD) was produced and used to interrupt the NB‐3 homophilic interactions. LV overexpressing NB‐3ΔECD (LV‐NB‐3 ΔECD‐EGFP) was produced. In NB‐3−/− mice after complete spinal transection, LV‐NB‐3ΔECD‐EGFP was simultaneously injected into the sensorimotor cortex and the spinal lesion site. Moreover, LV‐NB‐3‐EGFP was injected into the sensorimotor cortex with concurrent spinal injection of LV‐NB‐3ΔECD‐EGFP, and LV‐NB‐3ΔECD‐EGFP was injected into the sensorimotor cortex with concurrent spinal injection of LV‐NB‐3‐EGFP. No interruption of axonal regeneration was observed in any of these groups 14 weeks after complete spinal transection (Fig EV1E–H).
Self‐interactions of the NB‐3 protein
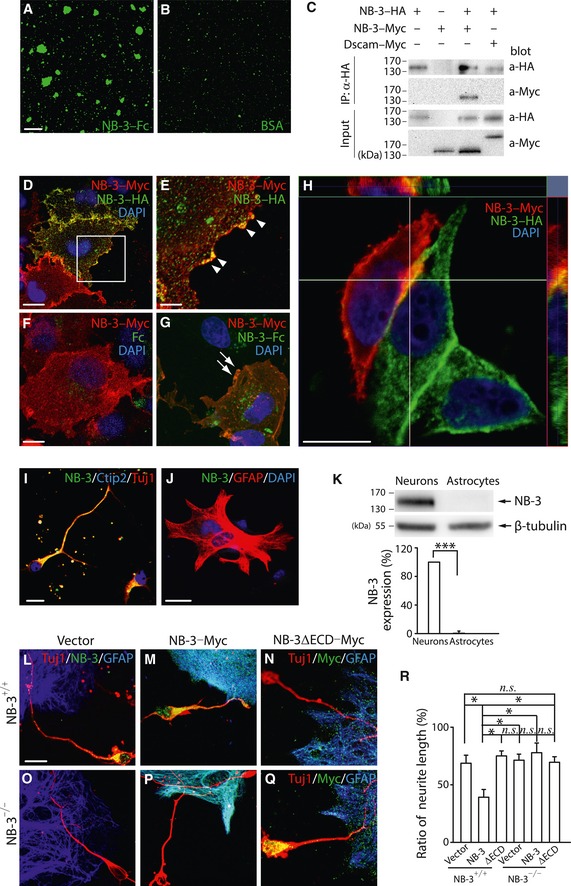
Thus, we examined the self‐interacting ability of NB‐3. We first performed a bead aggregation assay in which carboxylated‐modified microsphere beads were coated with NB‐3–Fc or bovine serum albumin (BSA) as a negative control. Aggregates formed by beads coated with NB‐3–Fc were much larger in size and in number as compared with BSA‐coated beads (Fig 6A and B), indicating that purified NB‐3 protein was capable of interacting with itself, which is an important characteristic of a neural adhesive protein (Wojtowicz et al, 2004; Jakovcevski et al, 2007). To further verify the property of self‐interaction in vitro, COS1 cells were transfected with NB‐3–HA and NB‐3–Myc or Down syndrome cell adhesion molecule (Dscam)–Myc as a negative control. NB‐3–Myc was detected in the NB‐3–HA immunoprecipitate, whereas Dscam–Myc was not, revealing co‐immunoprecipitation of NB‐3–Myc with NB‐3–HA in COS1 cells (Fig 6C). In COS1 cells overexpressing NB‐3–Myc and NB‐3–HA, co‐localization of NB‐3–Myc with NB‐3–HA at the cell membrane was detected (Fig 6D and E; Fig 6E, arrowheads), confirming that cis interactions of NB‐3 occurred in vitro. Furthermore, we evaluated the trans interactions of NB‐3 in COS1 cells. COS1 cells transfected with NB‐3–Myc were treated with NB‐3–Fc or human Fc fragment. Co‐localization of NB‐3–Myc with NB‐3–Fc but not Fc was observed at the cell membrane, indicating that NB‐3 self‐interacted in trans (Fig 6F and G; Fig 6G, arrows). We also overexpressed NB‐3–Myc in 293T cells and NB‐3–HA in COS1 cells separately and then co‐cultured these two cell lines. In adjacent 293T and COS1 cells expressing NB‐3, co‐localization of NB‐3–Myc with NB‐3–HA at the cell membrane was also detected (Fig 6H).
Figure 6. Self‐interactions of NB‐3 and its inhibition of neurite extension.
-
A, BNB‐3–Fc‐coated bead aggregation assay (A). BSA‐coated beads as a negative control (B).
-
CCo‐immunoprecipitation of NB‐3–Myc with NB‐3–HA from co‐transfected COS1 cells.
-
D, ECis interactions of NB‐3–Myc with NB‐3–HA in COS1 cells. (E) High‐magnification image of the boxed area in (D). Cells were co‐stained for Myc (red), HA (green), and DAPI (blue). The arrowheads indicate cell surface co‐localization of NB‐3–Myc and NB‐3–HA.
-
F, GTrans interactions between NB‐3 expressed in COS1 cells and treated NB‐3–Fc. Cells were co‐stained for Myc (red), Fc or NB‐3–Fc (green), and DAPI (blue). The arrows indicate co‐localization of NB‐3–Myc and NB‐3–Fc at the cell membrane (G).
-
HCell membrane co‐localization of NB‐3–Myc and NB‐3–HA separately expressed in 293T and COS1 cells. Cells were co‐stained for Myc (red), HA (green), and DAPI (blue).
-
I, JNB‐3 expression in cultured pyramidal neurons and astrocytes. Pyramidal neurons were co‐stained for NB‐3, Ctip2, and Tuj1 (I). Astrocytes were co‐stained for NB‐3, GFAP, and DAPI (J).
-
KWestern blot analysis and quantification of NB‐3 in cultured pyramidal neurons and astrocytes. NB‐3 expression levels were normalized by β‐tubulin and expressed relative to that of neurons. ***P < 0.001; one‐sample t‐test. Data were analyzed from three independent experiments.
-
L–QNB‐3+/+ (L and M) and NB‐3−/− (O and P) pyramidal neurons were co‐cultured with astrocytes that did not (L and O) or did (M and P) express NB‐3, and immunostained for Tuj1, NB‐3, and GFAP (L, M, O and P). NB‐3+/+ pyramidal neurons (N) and NB‐3−/− pyramidal neurons that overexpressed NB‐3ΔECD–Myc (Q) were co‐cultured with astrocytes that overexpressed NB‐3ΔECD–Myc, and immunostained for Tuj1, Myc, and GFAP (N and Q).
-
RThe length of neurites on astrocytes relative to total neurite length. n.s., not significant, and *P < 0.05; one‐way ANOVA followed by Bonferroni's post‐test. The neurite lengths of more than 150 pyramidal neurons from four independent experiments in each group were quantified.
Contact inhibition of neurite extension is mediated by NB‐3 homophilic interactions
To further verify our hypothesis, we carried out an in vitro pyramidal neuron–astrocyte co‐culture assay to mimic the cross‐talk between corticospinal neurons and scar‐forming cells under physiological conditions in SCI. The pyramidal neurons were dissociated from layer V sensorimotor cortex of embryonic day 18.5 (E18.5) NB‐3+/+ mice and co‐immunostained with antibodies to Ctip2 and Tuj1 to confirm their origin (Fig 6I). Immunofluorescence and Western blot analysis showed that the pyramidal neurons expressed NB‐3 (Fig 6I and K), whereas the astrocytes, which were dissociated from NB‐3+/+ mouse cortex at postnatal day 1–3 (P1–P3) and represented the glial scar‐forming cells, did not (Fig 6J and K). Dissociated NB‐3+/+ pyramidal neurons were co‐cultured for another 24 h with astrocytes that had been transfected with the NB‐3–Myc construct or NB‐3ΔECD–Myc construct or with negative control vector. When the neurites contacted astrocytes that lacked NB‐3 expression, they continued extending on the astrocytes (Fig 6L). When they contacted astrocytes that expressed NB‐3, most neurites immediately halted their extension (Fig 6M). When they contacted astrocytes that expressed NB‐3ΔECD, neurites kept extending on the astrocytes (Fig 6N). In contrast, dissociated NB‐3−/− pyramidal neurons from NB‐3−/− mice were co‐cultured with astrocytes that had been transfected with the NB‐3–Myc construct, NB‐3ΔECD–Myc construct, or negative control vector. The NB‐3‐deficient neurites continued extending on the astrocytes, in condition of either contacting astrocytes that did not express NB‐3 (Fig 6O) or contacting astrocytes expressing NB‐3 (Fig 6P). Moreover, when the neurites of NB‐3ΔECD‐expressing pyramidal neurons contacted astrocytes that expressed NB‐3ΔECD, the neurites kept extending on the astrocytes (Fig 6Q). The ratios of the length of neurites on the astrocytes to their total length were compared and revealed that NB‐3‐expressing astrocytes significantly limited the axonal extension of NB‐3‐expressing neurons (Fig 6R).
Cortical explants assay was established to further examine the inhibitory effect of NB‐3 homophilic interactions on neurite outgrowth. Layer V cortical explants from E18.5 NB‐3+/+ and NB‐3−/− mice were cultured in medium supplemented with either Fc or NB‐3–Fc. Neurite outgrowth was not affected when NB‐3+/+ cortical explants were cultured in medium supplemented with Fc (Fig 7A). In contrast, neurite outgrowth was prominently reduced when NB‐3+/+ cortical explants were cultured in medium supplemented with NB‐3–Fc (Fig 7A). Otherwise, neurite outgrowth was not affected when NB‐3−/− cortical explants were cultured in medium supplemented with either Fc or NB‐3–Fc (Fig 7A). Quantification of the neurite length also verified our observations (Fig 7B). Furthermore, the growth cone collapse assay was performed to test whether the NB‐3 homophilic interactions could induce the collapse of growth cone. Pyramidal neurons were disassociated from layer V sensorimotor cortex of E18.5 NB‐3+/+ and NB‐3−/− mice and cultured in medium supplemented with either Fc or NB‐3–Fc. Co‐immunostaining of Ctip2, NB‐3, and F‐actin was performed to label the growth cones of NB‐3‐expressing pyramidal neurons. The growth cones of NB‐3+/+ pyramidal neurons continued growing and extending when the medium was supplemented with Fc (Fig 7C and C1). In contrast, limited axonal extension and collapsed growth cones were both observed in cultured NB‐3+/+ pyramidal neurons when the medium was supplemented with NB‐3–Fc (Fig 7C and C2). However, the growth cones of NB‐3−/− pyramidal neurons presented robust extension and normal morphology when the medium was supplemented with either Fc or NB‐3–Fc (Fig 7C, C3, and C4). Quantification of the neurite length and the percentage of collapsed growth cones confirmed our observations (Fig 7D).
Figure 7. NB‐3 trans‐homophilic interactions inhibit neurite outgrowth and lead to growth cone collapse.
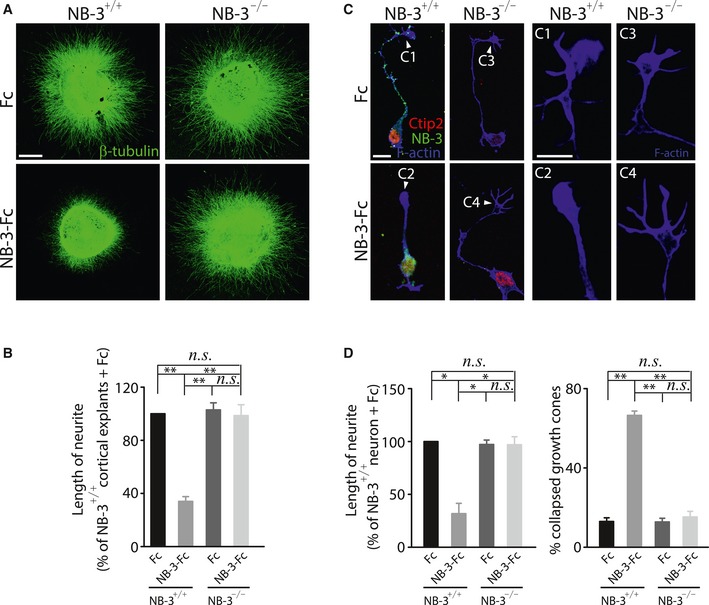
- Layer V cortical explants from E18.5 NB‐3+/+ and NB‐3−/− mice were cultured in medium supplemented with either Fc or NB‐3–Fc (50 μg/ml).
- Quantification of neurite outgrowth in (A). n.s., not significant, **P < 0.01; one‐way ANOVA followed by Bonferroni's post‐test. Data were analyzed from more than 50 layer V cortical explants from five independent experiments in each group.
- Pyramidal neurons of NB‐3+/+ and NB‐3−/− mice were cultured in medium supplemented with either Fc or NB‐3–Fc (50 μg/ml). The neurons were co‐stained for Ctip2, NB‐3, and rhodamine phalloidin. (C1–C4) High‐magnification images of the growth cones (white arrowheads) of the neurons in (C), respectively.
- Quantification of neurite length in (C), and the percentage of collapsed growth cones in (C). n.s., not significant, *P < 0.05, and **P < 0.01; one‐way ANOVA followed by Bonferroni's post‐test. Data were analyzed from more than 300 corticospinal neurons from six independent experiments in each group.
Trans‐homophilic interactions of NB‐3 downregulate mTOR signaling in corticospinal neurons
Activation of mTOR signaling was one of the most promising approaches for promoting axonal regeneration (Park et al, 2008; Liu et al, 2010; Zukor et al, 2013). Because axonal regrowth was observed after injury in NB‐3−/− mice, which completely lack NB‐3 homophilic interactions, and in LV‐NB‐3 shRNA‐GFP‐injected mice, in which their interactions are disrupted, we investigated whether NB‐3 homophilic interactions mediated downstream signaling that affects the mTOR signaling pathway.
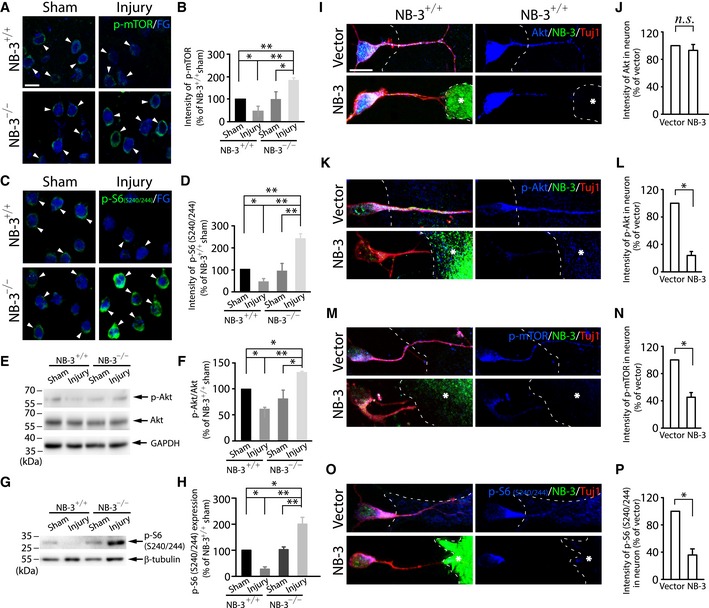
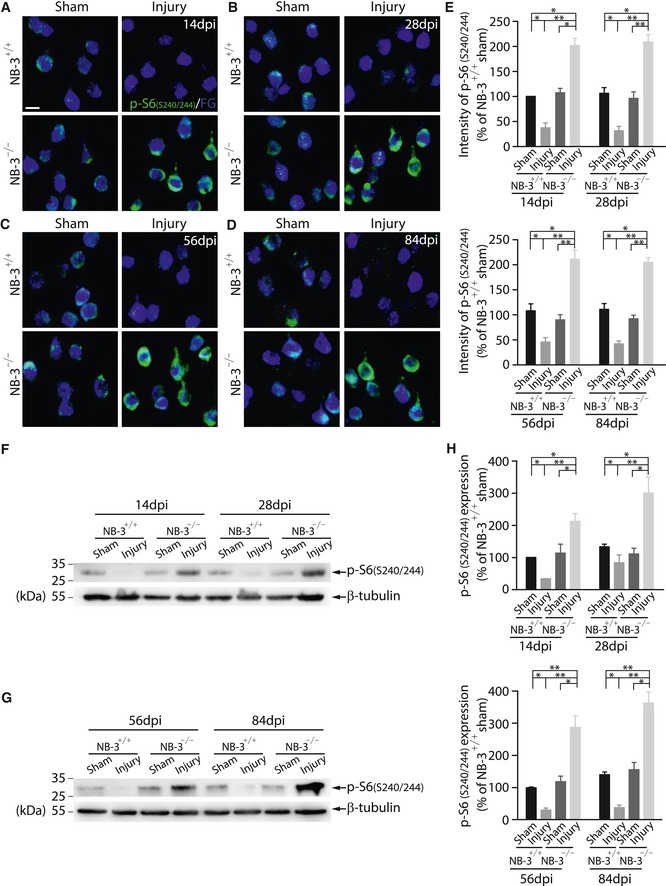
Immunohistochemistry revealed downregulation of phospho (p)‐mTOR (Fig 8A and B) and p‐S6 (Fig 8C and D) in FG‐labeled corticospinal neurons of the NB‐3+/+ mice 2 weeks post‐injury. In contrast, the expression of p‐mTOR and p‐S6 in the corticospinal neurons of the NB‐3−/− mice was significantly upregulated 2 weeks post‐injury, to levels much higher than those in the sham‐operated NB‐3+/+ mice (Fig 8A–D). Western blot analysis of sensorimotor cortical homogenates also showed a significantly decreased expression ratio of p‐Akt to total Akt (p‐Akt/Akt) (Fig 8E and F) and p‐S6 (Fig 8G and H) in NB‐3+/+ mice 2 weeks after SCI. In NB‐3−/− mice, the expression level of p‐Akt/Akt (Fig 8E and F) and p‐S6 (Fig 8G and H) was upregulated, suggesting that mTOR signaling was activated in the absence of NB‐3. Additionally, immunostaining in corticospinal neurons and Western blot analysis of sensorimotor cortical homogenates were carried out to detect the p‐S6 expression 4, 8, and 12 weeks after SCI. The p‐S6 expression in the corticospinal neurons of the NB‐3−/− mice showed a long‐term increase as compared with those in the NB‐3+/+ mice 2 weeks after sham surgery (Fig EV2A–E). Western blot analysis of sensorimotor cortical homogenates also showed a long‐term upregulation of p‐S6 expression in NB‐3−/− mice 4, 8, and 12 weeks after SCI (Fig EV2F–H).
Figure 8. Trans‐homophilic interactions of NB‐3 downregulate mTOR signaling activity in corticospinal neurons.
-
AImages of coronal sections of layer V sensorimotor cortex from NB‐3+/+ and NB‐3−/− mice after SCI. Corticospinal neurons were retrogradely labeled with Fluorogold (FG), and coronal sections were co‐stained with p‐mTOR (arrowheads).
-
BQuantification of fluorescence intensity of p‐mTOR in FG‐labeled corticospinal neurons in (A). *P < 0.05 and **P < 0.01; one‐way ANOVA followed by Bonferroni's post‐test. The intensities of more than 300 corticospinal neurons from three mice in each group were quantified.
-
CImages of coronal sections of layer V sensorimotor cortex from NB‐3+/+ and NB‐3−/− mice after SCI. Corticospinal neurons were retrogradely labeled with Fluorogold (FG), and coronal sections were co‐stained with p‐S6 (S240/244) (arrowheads).
-
DQuantification of fluorescence intensity of p‐S6 (S240/244) in FG‐labeled corticospinal neurons in (C). *P < 0.05 and **P < 0.01; one‐way ANOVA followed by Bonferroni's post‐test. The intensities of more than 300 corticospinal neurons from three mice in each group were quantified.
-
E–HWestern blot analysis and quantification of the expression of p‐Akt/Akt (E and F) and p‐S6 (S240/244) (G and H) in sensorimotor cortex from NB‐3+/+ and NB‐3−/− mice after SCI. *P < 0.05 and **P < 0.01; one‐way ANOVA followed by Bonferroni's post‐test. Data were analyzed from three independent experiments each including three mice per group.
-
I–PExpression and quantification of fluorescence intensity of Akt (I and J), p‐Akt (K and L), p‐mTOR (M and N), and p‐S6 (S240/244) (O and P) in NB‐3+/+ pyramidal neuron–astrocyte co‐cultures. The astrocytes were transfected with either NB‐3–Myc or a control vector. The dashed lines outline the astrocytes. The asterisks indicate the NB‐3‐expressing astrocytes. n.s., not significant, *P < 0.05; one‐sample t‐test. The intensities of more than 300 pyramidal neurons from six independent experiments in each group were quantified.
Figure EV2. The induced mTOR activity is sustained in NB‐3‐deficient pyramidal neurons after SCI.
-
A–DImages of coronal sections of layer V sensorimotor cortex from NB‐3+/+ and NB‐3−/− mice 14 (A), 28 (B), 56 (C), and 84 (D) days post‐injury (dpi). Corticospinal neurons were retrogradely labeled with Fluorogold (FG), and coronal sections were co‐stained with p‐S6 (S240/244) antibody. Scale bar, 20 μm.
-
EQuantification of fluorescence intensity of p‐S6 (S240/244) in FG‐labeled corticospinal neurons in (A–D). *P < 0.05 and **P < 0.01; one‐way ANOVA followed by Bonferroni's post‐test. The intensities of more than 300 corticospinal neurons from three mice in each group were quantified.
-
F–HWestern blot analysis (F and G) and quantification (H) of p‐S6 (S240/244) expression in sensorimotor cortices of NB‐3+/+ and NB‐3−/− mice 14, 28, 56, and 84 days post‐injury (dpi). *P < 0.05 and **P < 0.01; one‐way ANOVA followed by Bonferroni's post‐test. Data were analyzed from five independent experiments each including 3 mice per group.
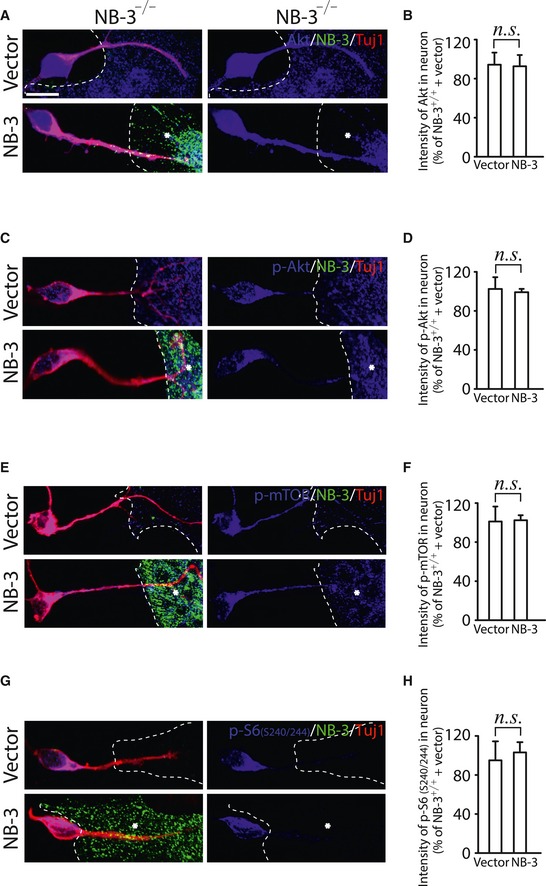
To validate the activation of mTOR signaling initiated by interruption of NB‐3 trans‐homophilic interactions in vitro, we examined the expression levels of Akt, p‐Akt, p‐mTOR, and p‐S6 in the NB‐3+/+ pyramidal neuron–astrocyte co‐cultures. The expression of total Akt was unchanged in the NB‐3+/+ pyramidal neuron–astrocyte co‐cultures (Fig 8I and J). Pyramidal neurons that contacted NB‐3‐expressing astrocytes displayed significantly decreased fluorescence intensity of p‐Akt, p‐mTOR, and p‐S6 as compared with neurons that contacted astrocytes that did not express NB‐3 (Fig 8K–P). In contrast, the expression levels of Akt, p‐Akt, p‐mTOR, and p‐S6 in NB‐3−/− pyramidal neurons were also examined in the NB‐3−/− pyramidal neuron–astrocyte co‐cultures. Experiments provided evident results that NB‐3 deficiency did not affect the expression levels of Akt, p‐Akt, p‐mTOR, and p‐S6 in pyramidal neurons, in condition of either contacting with NB‐3‐expressing astrocytes or contacting astrocytes that did not express NB‐3 (Fig EV3).
Figure EV3. Activities of Akt and mTOR are not affected in NB‐3‐deficient pyramidal neuron–astrocyte co‐cultures.
-
A–HExpression and quantification of fluorescence intensity of Akt (A and B), p‐Akt (C and D), p‐mTOR (E and F), and p‐S6 (S240/244) (G and H) in NB‐3−/− pyramidal neuron–astrocyte co‐cultures. The astrocytes were transfected with either a NB‐3–Myc or a control vector. The dashed lines outline the astrocytes. The asterisks indicate the NB‐3‐expressing astrocytes. Scale bar, 10 μm. The intensity of each signal was normalized to that in the control vector group of NB‐3+/+ pyramidal neuron–astrocyte co‐cultures. Data are presented as mean ± SEM. n.s., not significant; one‐sample t‐test. The intensities of more than 300 NB‐3−/− pyramidal neurons from five independent experiments in each group were quantified.
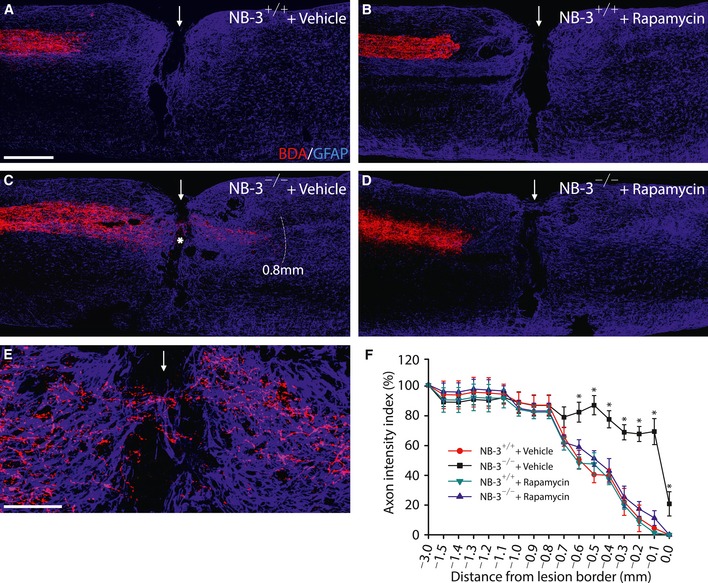
To assess the necessity of activation of mTOR signaling for the regeneration effects of NB‐3 deficiency, NB‐3+/+ or NB‐3−/− mice were treated intraperitoneally with rapamycin (a mTOR inhibitor) every 2 days after SCI. As compared with the retraction of post‐traumatic corticospinal axons in NB‐3+/+ mice treated with vehicle or rapamycin (Fig EV4A, B and F), axons still extended immediately to the rostral lesion border and beyond the scar up to 0.8 mm in NB‐3−/− mice treated with vehicle 14 weeks post‐injury (Fig EV4C, E and F), whereas axons retracted from the rostral lesion border in NB‐3−/− mice treated with rapamycin (Fig EV4D and F).
Figure EV4. Inhibition of mTOR by rapamycin abolishes regrowth of post‐traumatic corticospinal axons in NB‐3‐deficient mice.
-
A–ERepresentative images of sagittal sections showing the BDA‐labeled corticospinal axons in NB‐3+/+ and NB‐3−/− mice following intraperitoneal injection of vehicle (A and C) or rapamycin (B and D) 14 weeks after complete spinal transection. (E) High‐magnification image of the area in (C) (asterisk). Numerous post‐traumatic corticospinal axons in NB‐3−/− mice approached the lesion border, and some axons grew into and beyond the scar (C and E). Rapamycin treatment abolished the outgrowth of post‐traumatic corticospinal axons in NB‐3−/− mice (D). The arrows indicate the lesion sites; the white dashed line in (C) indicates the regenerative corticospinal axons extending 0.8 mm caudal to the lesion site; the asterisk in (C) indicates the lesion epicenter. Scale bars, 400 μm (A–D) and 100 μm (E).
-
FQuantification of the intensity index of BDA‐labeled axons at certain distances from the rostral lesion border in (A–D). Data are presented as mean ± SEM. *P < 0.01; two‐way ANOVA followed by Fisher's LSD. n = 5 mice per group.
CHL1 and PTPσ are involved in the signaling cascade initiated by NB‐3 trans‐homophilic interactions
Our findings suggested that NB‐3 trans‐homophilic interaction transduced a signaling cascade from scar‐forming cells to post‐traumatic corticospinal neurons that inactivated downstream mTOR signaling in neurons. However, the sequence and components of this signal transduction required further exploration.
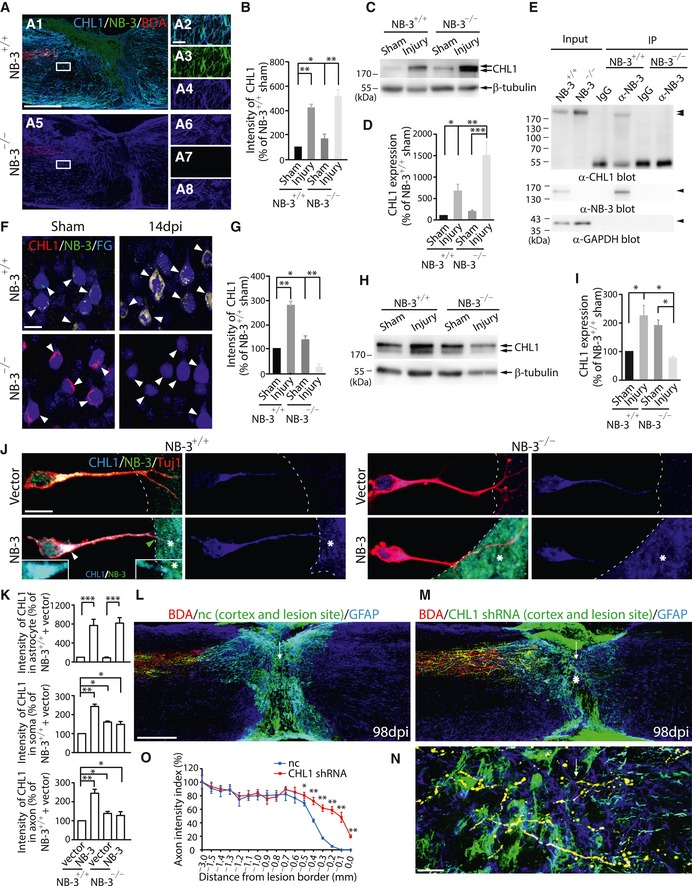
CHL1 directly interacts with NB‐3 in a cis manner in vitro and enhances cell membrane expression of NB‐3 to regulate apical dendrite orientation in the developing visual cortex (Ye et al, 2008). Additionally, trans interactions of NB‐3 and CHL1 have not been detected in vitro, indicating that NB‐3 and CHL1 are not each other's ligand (Ye et al, 2008). CHL1 is induced mainly in cells forming the glial scar and plays a role in SCI (Jakovcevski et al, 2007). Thus, we assumed that NB‐3 and CHL1 acted in synergy at the lesion site after SCI. In our analysis, SCI‐induced CHL1 co‐localized with induced NB‐3 in the scar‐forming cells (Fig 9A and B) and post‐traumatic corticospinal axons (Appendix Fig S4A–E) of the NB‐3+/+ mice 2 weeks post‐injury. Western blot analysis of sham and injured spinal cord homogenates also showed increased expression of CHL1 in the spinal lesion areas of NB‐3+/+ mice (Fig 9C and D), which was similar to NB‐3 induction. And further biochemical analysis confirmed that NB‐3 interacted with CHL1 in spinal cord lesion areas of NB‐3+/+ mice (Fig 9E). This simultaneous induction and interaction suggested that NB‐3 and CHL1 were involved in similar processes in the regulation of axonal regeneration after SCI. Moreover, we found a stronger induction of CHL1 in spinal lesion areas (Fig 9A–D) but significantly reduced CHL1 expression in corticospinal neurons (Fig 9F and G) and sensorimotor cortex (Fig 9H and I) of NB‐3−/− mice 2 weeks post‐injury. These data strongly hinted that once the synergy between NB‐3 and CHL1 was interrupted in the spinal lesion site of NB‐3−/− mice, their inhibitory effects on axonal regrowth were abolished. Then, we evaluated CHL1 expression in pyramidal neuron–astrocyte co‐cultures. When NB‐3 was overexpressed in astrocytes, CHL1 expression was synchronously enhanced and co‐localized with NB‐3 (Fig 9J and K; Fig 9J, asterisks). The NB‐3+/+ pyramidal neurons that contacted NB‐3‐expressing astrocytes displayed significantly increased CHL1 expression and a stronger co‐localization of NB‐3 and CHL1 in both somas and axons as compared with neurons that contacted astrocytes that did not express NB‐3 (Fig 9J and K; Fig 9J, arrowheads). The co‐localization was also identified at the E‐cadherin‐labeled cell membrane of pyramidal neurons (Appendix Fig S5A and B; Appendix Fig S5A, arrowhead) and observed in the axon tips of pyramidal neurons (Fig 9J, green arrowhead). Comparatively, CHL1 expression was not affected in the NB‐3−/− pyramidal neurons that either contacted with NB‐3‐expressing astrocytes or contacted astrocytes that did not express NB‐3 (Fig 9J and K).
Figure 9. Co‐induction of CHL1 and NB‐3 after SCI mediates downstream signaling transduction.
-
ACo‐immunostaining of CHL1 (blue), NB‐3 (green), and BDA (red) in injured spinal cords of NB‐3+/+ (A1) and NB‐3−/− (A5) mice. (A2–A4 and A6–A8) High‐magnification images of boxed areas in (A1 and A5), respectively. Images in (A2 and A6) are presented as single‐channel fluorescence images in (A3–A4 and A7–A8), respectively.
-
BQuantification of fluorescence intensity of CHL1 at the spinal lesion sites of NB‐3+/+ and NB‐3−/− mice after SCI. *P < 0.05 and **P < 0.01; one‐way ANOVA followed by Bonferroni's post‐test. n = 11 mice per group.
-
C, DWestern blot analysis (C) and quantification (D) of CHL1 expression in spinal lesion areas of NB‐3+/+ and NB‐3−/− mice after SCI. *P < 0.05, **P < 0.01, and ***P < 0.001; one‐way ANOVA followed by Bonferroni's post‐test. Data were analyzed from three independent experiments each including two mice per group.
-
ECo‐immunoprecipitation of NB‐3 and CHL1 from spinal lesion areas of NB‐3+/+ and NB‐3−/− mice.
-
FCo‐immunostaining of CHL1 and NB‐3 in FG‐labeled corticospinal neurons (arrowheads) of NB‐3+/+ and NB‐3−/− mice 14 days post‐injury (dpi).
-
GQuantification of the fluorescence intensity of CHL1 in (F). *P < 0.05 and **P < 0.01; one‐way ANOVA followed by Bonferroni's post‐test. The intensities of more than 300 corticospinal neurons from three mice in each group were quantified.
-
H, IWestern blot analysis (H) and quantification (I) of CHL1 expression in sensorimotor cortices of NB‐3+/+ and NB‐3−/− mice after SCI. *P < 0.05; one‐way ANOVA followed by Bonferroni's post‐test. Data were analyzed from three independent experiments each including three mice per group.
-
JCHL1 expression in the somas and axons of NB‐3+/+ and NB‐3−/− pyramidal neurons when co‐culturing with NB‐3‐expressing astrocytes (dashed lines and asterisks) or astrocytes that did not express NB‐3 (dashed lines). Co‐localization of CHL1 and NB‐3 in astrocytes overexpressing NB‐3 (asterisks). Co‐localization of CHL1 and NB‐3 in the somas and axons of co‐cultured NB‐3+/+ pyramidal neurons (arrowheads). Left inset, high‐magnification view of the soma (white arrowhead). Right inset, high‐magnification view of the axon tip (green arrowhead).
-
KQuantification of fluorescence intensity of CHL1 in (J). *P < 0.05, **P < 0.01, and ***P < 0.001; one‐way ANOVA followed by Bonferroni's post‐test. The intensities of more than 300 astrocytes or pyramidal neurons from 3 independent experiments in each group were quantified.
-
L–NSagittal sections showing the corticospinal axons in injured spinal cords following injection of LV‐nc‐GFP (L) and LV‐CHL1 shRNA‐GFP (M) into both the sensorimotor cortex and lesion sites. High‐magnification image (N) of the area in (M) (asterisk). The arrows indicate the lesion sites; the asterisk indicates the lesion epicenter.
-
OQuantification of intensity index of BDA‐labeled axons at certain distances from the lesion border in (L and M). *P < 0.05 and **P < 0.01; two‐way ANOVA followed by Fisher's LSD. n = 9 mice (nc) and n = 10 mice (CHL1 shRNA).
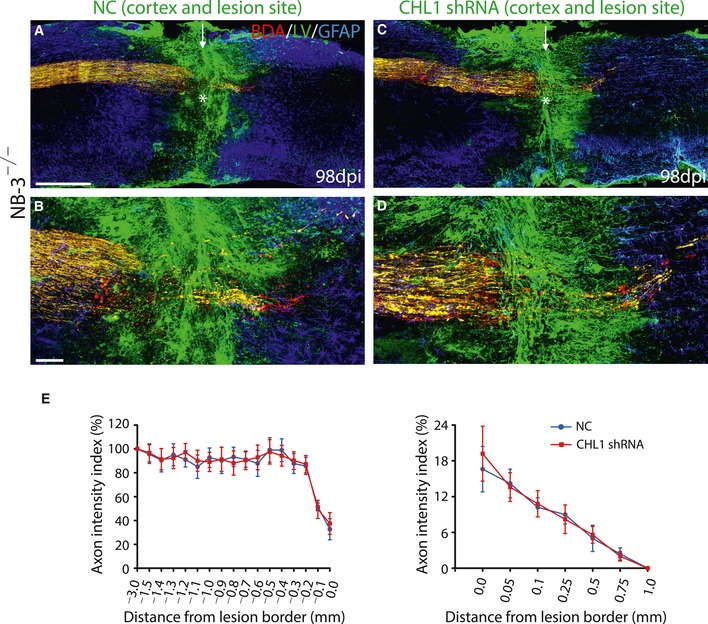
LV‐CHL1 shRNA‐GFP was simultaneously injected into the sensorimotor cortex to knock down the CHL1 expression in post‐traumatic axons and into the spinal lesion site to knock down the CHL1 expression in scar‐forming cells. In mice with injection of control lentivirus (LV‐nc‐GFP), most BDA and GFP double‐labeled post‐traumatic corticospinal axons had retracted from the rostral lesion border (Fig 9L and O). In mice with injection of LV‐CHL1 shRNA‐GFP, many BDA and GFP double‐labeled axons sprouted and extended to the rostral lesion border, and several BDA and GFP double‐labeled axons even transversed the lesion epicenter that contained LV‐CHL1 shRNA‐GFP‐infected scar‐forming cells at 14 weeks post‐injury (Fig 9M–O). In addition, the regrowth of post‐traumatic corticospinal axons was not further enhanced in NB‐3−/− mice with cortical and spinal injections of LV‐CHL1 shRNA‐GFP (Fig EV5). These results suggested that CHL1 was involved in NB‐3‐mediated contact inhibition and delivered inhibitory signal to corticospinal neurons together with NB‐3 through the same signaling complex after SCI.
Figure EV5. The regrowth of post‐traumatic corticospinal axons is not further enhanced by interruption of CHL1 expression in NB‐3‐deficient mice.
-
A–DSagittal sections showing the corticospinal axons in injured spinal cords following injection of LV‐nc‐GFP (A and B) or LV‐CHL1 shRNA‐GFP (C and D) into the cortex and the lesion sites in NB‐3−/− mice. (B, D) High‐magnification images of the areas in (A and C) (asterisks), respectively. The arrows indicate the lesion sites; the asterisks indicate the lesion epicenters. Scale bars, 400 μm (A and C) and 80 μm (B and D).
-
EQuantification of the intensity index of BDA‐labeled axons at certain distances from the lesion border in (A and C). Data are presented as mean ± SEM, two‐way ANOVA followed by Fisher's LSD. n = 11 mice per group.
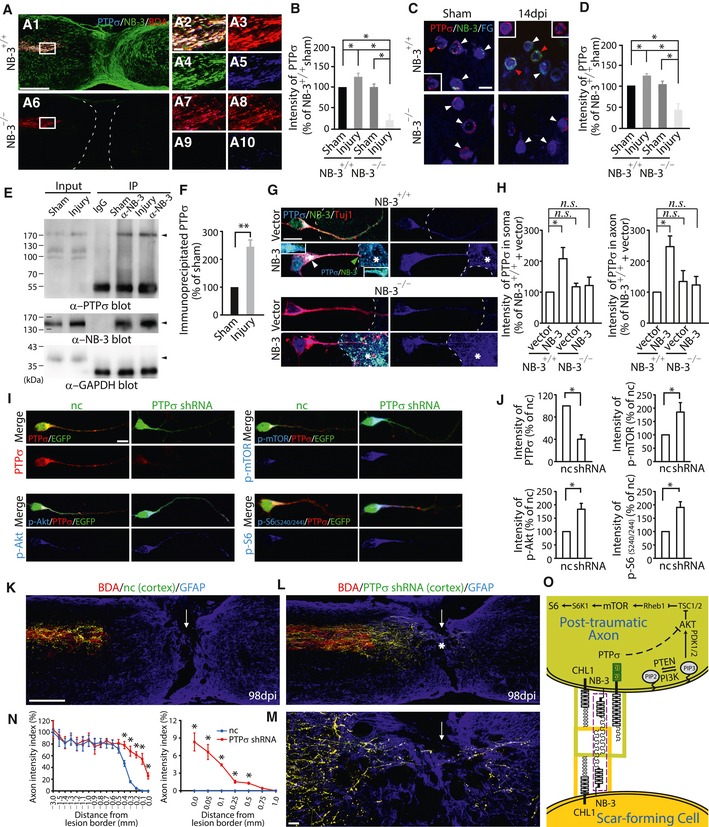
PTPσ inhibits axonal regeneration after injury (McLean et al, 2002; Sapieha et al, 2005; Shen et al, 2009; Fry et al, 2010). PTPα, a homolog of PTPσ, directly interacts with NB‐3 and CHL1 in cortical neurons and regulates the development of apical dendrites (Ye et al, 2008). Using co‐immunostaining with NB‐3 and PTPσ antibodies, a strong co‐induction of PTPσ and NB‐3 was observed at the terminations of BDA‐labeled axons in the completely transected spinal cords of NB‐3+/+ mice, whereas the expression of PTPσ was downregulated in those of NB‐3−/− mice (Fig 10A and B). Accordingly, we also observed a co‐induction of PTPσ and NB‐3 in FG‐labeled post‐traumatic corticospinal neurons of NB‐3+/+ mice, and significantly reduced PTPσ expression in those of NB‐3−/− mice 2 weeks post‐injury (Fig 10C and D; Fig 10C, arrowheads). Co‐immunoprecipitation of NB‐3 and PTPσ from sensorimotor cortical homogenates of NB‐3+/+ mice was detected (Fig 10E and F). In addition, SCI appeared to facilitate the interaction between NB‐3 and PTPσ in sensorimotor cortex (Fig 10E and F). As a negative control, co‐immunoprecipitation of NB‐3 and PTPσ from sensorimotor cortical homogenates of NB‐3−/− mice was not detected (Appendix Fig S6). Then, we evaluated PTPσ expression in pyramidal neuron–astrocyte co‐cultures. In the co‐cultures, PTPσ expression was also elevated in both the somas and axons of NB‐3+/+ pyramidal neurons when they contacted NB‐3‐expressing astrocytes as compared with those that contacted astrocytes that did not express NB‐3 (Fig 10G and H). And a stronger co‐localization of NB‐3 and PTPσ which was detected in the somas and axon tips of pyramidal neurons also confirmed their interactions (Fig 10G, arrowheads). The co‐localization was also identified at the E‐cadherin‐labeled cell membrane of pyramidal neurons (Appendix Fig S5C and D; Appendix Fig S5C, arrowhead). In contrast, PTPσ expression was not elevated in the NB‐3−/− pyramidal neurons that either contacted with NB‐3‐expressing astrocytes or contacted astrocytes that did not express NB‐3 (Fig 10G and H). All these data suggested that PTPσ also worked together with NB‐3 to regulate intrinsic axonal regeneration signaling after SCI. In accordance with previous findings that adult PTPσ‐deficient mouse retinas had constitutively elevated activity of mitogen‐activated protein kinase (MAPK) and Akt kinase (Sapieha et al, 2005), we also found that transfection of PTPσ shRNA into cultured pyramidal neurons resulted in downregulation of PTPσ and upregulation of p‐Akt, p‐mTOR, and p‐S6 in pyramidal neurons (Fig 10I and J).
Figure 10. PTPσ is involved in the signaling cascade mediated by NB‐3 trans‐homophilic interactions.
-
ACo‐immunostaining of PTPσ (blue), NB‐3 (green), and BDA (red) at spinal lesion sites of NB‐3+/+ (A1) and NB‐3−/− (A6) mice. (A2–A5 and A7–A10) High‐magnification images of boxed areas in (A1 and A6) showing PTPσ expression at the terminations of BDA‐labeled corticospinal axons, respectively. Images in (A2 and A7) are presented as single‐channel fluorescence images in (A3–A5 and A8–A10), respectively.
-
BQuantification of fluorescence intensity of PTPσ at BDA‐labeled axonal terminations of NB‐3+/+ and NB‐3−/− mice after SCI. *P < 0.05; one‐way ANOVA followed by Bonferroni's post‐test. n = 12 mice per group.
-
CCo‐immunostaining of PTPσ and NB‐3 in the FG‐labeled corticospinal neurons (arrowheads) of NB‐3+/+ and NB‐3−/− mice 14 days post‐injury (dpi). Insets, only the signals from PTPσ and FG in NB‐3+/+ corticospinal neurons (red arrowheads) were visualized.
-
DQuantification of fluorescence intensity of PTPσ in (C). *P < 0.05; one‐way ANOVA followed by Bonferroni's post‐test. The intensities of more than 300 corticospinal neurons from three mice in each group were quantified.
-
ECo‐immunoprecipitation of NB‐3 and PTPσ from sensorimotor cortical lysates of NB‐3+/+ mice after SCI.
-
FQuantification of immunoprecipitated PTPσ by NB‐3 in (E). **P < 0.01; one‐sample t‐test. Data were analyzed from three independent experiments each including 15 mice per group.
-
GPTPσ expression in NB‐3+/+ and NB‐3−/− pyramidal neurons when co‐culturing with NB‐3‐expressing astrocytes (dashed lines and asterisks) or astrocytes that did not express NB‐3 (dashed lines). Upper inset, high‐magnification view of the soma (white arrowhead). Lower inset, high‐magnification view of the axon tip (green arrowhead).
-
HQuantification of fluorescence intensity of PTPσ in (G). n.s., not significant, and *P < 0.05; one‐way ANOVA followed by Bonferroni's post‐test. The intensities of more than 300 pyramidal neurons from four independent experiments in each group were quantified.
-
IExpression of PTPσ, p‐Akt, p‐mTOR, and p‐S6 (S240/244) in pyramidal neurons that expressed PTPσ shRNA‐GFP. A control plasmid expressing GFP was transfected as the negative control (nc).
-
JQuantification of fluorescence intensity of PTPσ, p‐Akt, p‐mTOR, and p‐S6 (S240/244) in (I). *P < 0.05; one‐sample t‐test. The intensities of more than 300 pyramidal neurons from four independent experiments in each group were quantified.
-
K–MSagittal sections showing the corticospinal axons in injured spinal cords following injection of LV‐nc‐GFP (K) and LV‐PTPσ shRNA‐GFP (L) into the sensorimotor cortex. High‐magnification image (M) of the area in (L) (asterisk). The arrows indicate the lesion sites; the asterisk indicates the lesion epicenter.
-
NQuantification of the intensity index of BDA‐labeled axons at certain distances from the lesion border in (K and L). *P < 0.01; two‐way ANOVA followed by Fisher's LSD. n = 8 mice (nc) and n = 10 mice (PTPσ shRNA).
-
OA model illustrating the signal transduction between scar‐forming cells and post‐traumatic axons mediated by NB‐3 trans‐homophilic interactions.
In mice with cortical injection of control lentivirus (LV‐nc‐GFP), most BDA and GFP double‐labeled post‐traumatic corticospinal axons that had retracted from the rostral lesion border, as did the axons labeled with BDA alone (Fig 10K and N). In the mice with cortical injection of LV‐PTPσ shRNA‐GFP, a lot of BDA and GFP double‐labeled axons extended toward the rostral lesion border and some of them even penetrated the lesion epicenter and grew into the distal spinal cord 14 weeks post‐injury (Fig 10L–N), as compared with the axons labeled with BDA alone, which retracted from the rostral lesion border (Fig 10L).
Thus, in our model (Fig 10O), SCI‐induced expression of NB‐3 and CHL1 in scar‐forming cells and of NB‐3, CHL1, and PTPσ in post‐traumatic corticospinal neurons and axonal terminations where they contacted at the spinal lesion site. CHL1 promotes cell membrane expression of NB‐3 in neurons (Ye et al, 2008). Therefore, the induction of NB‐3 and CHL1 in scar‐forming cells mutually promoted the expression of the other protein within cells, as well as at the cell membrane. This accelerated signal transduction to neurons by increasing the possibility of NB‐3 trans interactions at their contact surface (Fig 10O). In neurons, NB‐3 interacted with PTPσ to regulate unknown signaling components to inactivate the downstream mTOR signaling pathway (Fig 10O).
Discussion
Little is known about the molecular signals mediating the cross‐talk between scar‐forming cells and post‐traumatic axons. In this study, we observed the regrowth of corticospinal axons was enhanced in vivo with NB‐3 deficiency or interruption of NB‐3 trans‐homophilic interactions. To determine whether the regrowth of corticospinal axons was due to axonal regeneration or axonal preservation, the time course of axonal extension was analyzed in NB‐3+/+ and NB‐3−/− mice after SCI. In NB‐3+/+ mice, most post‐traumatic corticospinal axons retracted from the lesion border and adhered rostrally to the glial scar 56 days post‐injury (Appendix Fig S7A–F and M–O). In contrast, the obvious dieback of post‐traumatic corticospinal axons was not detected in NB‐3−/− mice 14, 28, and 56 days post‐injury (Appendix Fig S7G–L and M–O). These results indicated that the regrowth of post‐traumatic corticospinal axons was due to axonal regeneration in NB‐3−/− mice after SCI. However, the concept of axon regeneration has become very controversial in this field. Axon regeneration is defined as axon growth from the severed end of injured axon, whereas regenerative sprouting refers to axonal processes that emerge from the side of an axon that has been injured at a distal point. In practice, it is very difficult to distinguish these two processes in vivo and certainly not with currently available methods. An accurate definition of these two processes will depend on breakthrough techniques to distinguish between axon regeneration and regenerative sprouting. Thus, advances in technology may help to clearly delineate these two distinct axonal processes.
Moreover, we also observed the NB‐3 induction in different types of scar‐forming cells including astrocytes, fibroblasts, and pericytes. It would be useful to determine whether all scar‐forming cells with NB‐3 induction, including fibroblasts and pericytes that are located in the epicenter of the lesion scar, have similar effects on axonal regrowth after SCI or whether a distinct type of scar‐forming cells employs the NB‐3 signaling pathway and transduces the signal to neurons. Moreover, a microtubule‐stabilizing drug (epoB) was recently reported to abrogate directed migration of scar‐forming cells and promote axon regrowth after SCI (Jorg et al, 2015). It would be interesting to explore whether interruption of NB‐3 trans‐homophilic interactions between post‐traumatic axons and scar‐forming cells has the same effect as epoB with respect to abrogating directed migration of scar‐forming cells and propelling growth of post‐traumatic axons. Also, can epoB regulate the signal transduction initiated by NB‐3 trans‐homophilic interactions between post‐traumatic axons and scar‐forming cells?
The ligands and downstream signaling molecules of NB‐3 have not been well elucidated, particularly in axonal regeneration after SCI. Our data suggest that trans‐homophilic interactions of NB‐3 mediate the transduction of a contact inhibitory signal from scar‐forming cells to corticospinal neurons. Co‐induction of NB‐3 with CHL1 in scar‐forming cells and that of NB‐3 with CHL1 and PTPσ within corticospinal neurons and axons suggest that these proteins form a complex at their contact surface. Based on previous findings that SCI‐induced CHL1 in scar‐forming cells restricts axonal growth (Jakovcevski et al, 2007), we speculate that CHL1 alone could not transduce the inhibitory signal from the scar‐forming cells to the neurons in the absence of NB‐3, whereas the cis interactions of CHL1 and NB‐3 at the axonal terminations and the trans‐homophilic interactions of NB‐3 at the contact surface are the key steps for the downstream signaling cascade in neurons. In our study, we noticed that CHL1 was elevated in the spinal lesion areas of NB‐3−/− mice 14 days post‐injury, but not in the sensorimotor cortex. We also noticed the CHL1 elevation at the terminations of post‐traumatic corticospinal axons in NB‐3−/− mice 14 days post‐injury (Appendix Fig S4A–E). However, we found CHL1 was certainly elevated in the sensorimotor cortex of NB‐3−/− mice 7 days post‐injury (Appendix Fig S4F–J). It suggested that induced CHL1 in the somas of corticospinal neurons was efficiently transported to the axonal terminations and accumulated at the terminations of injured corticospinal axons in NB‐3−/− mice 14 days post‐injury. Moreover, the sustained expression of CHL1 in the somas of corticospinal neurons may depend on the NB‐3 expression after SCI. This transportation of CHL1 and the lack of sustained expression resulted in the CHL1 reduction in the sensorimotor cortex of NB‐3−/− mice 14 days post‐injury. CHL1, indeed, promoted cell expression of NB‐3 and strengthened their interactions in the complex.
Previous studies demonstrated that PTPσ has multiple roles in the process of axonal regeneration (Coles et al, 2011). We demonstrated that PTPσ is involved in the NB‐3‐associated complex, which exerts inhibitory functions on neurons by modulating mTOR activity. Although CHL1 was still highly induced after SCI, the assembly of the protein complex including NB‐3, PTPσ, and CHL1 would have been interrupted in the absence of NB‐3 and in the presence of lower levels of PTPσ in spinal lesion sites of injured NB‐3‐deficient mice. Consequently, steady activation of Akt and downstream mTOR in corticospinal neurons would have ultimately led to axonal regrowth. Therefore, PTPσ acts as a signal mediator for trans‐homophilic interactions of NB‐3.
In our study, mice injected with LV expressing NB‐3 shRNA (LV‐NB‐3 shRNA‐GFP) were subjected to surgery at the age of 8–10 weeks. NB‐3 should be downregulated in 8‐ to 10‐week‐old mice. Previous study reported that PTEN ablation leads to axon regeneration only when the ablation occurs relatively early (Liu et al, 2010). We also saw weak axonal regeneration in mice injected with LV‐NB‐3 shRNA‐GFP as compared with NB‐3−/− mice. Our results are consistent with the above finding concerning PTEN ablation. Moreover, we found that NB‐3 interacted with PTPσ to inactivate downstream mTOR signaling in neurons via modifying unknown signaling components. Thus, the NB‐3 signaling pathway is definitely not the same as the PTEN‐mTOR signaling pathway, especially regarding the component that directly affects the mTOR/p‐S6 activity. Therefore, NB‐3 signaling seems to be a distinct signaling pathway involved in regulating axonal regeneration by inactivating mTOR signaling. However, it is too early to exclude the possibility that NB‐3 trans‐homophilic interactions might have unknown effects on other signaling pathways that regulate the internal regrowth capability of post‐traumatic axons. Thus, additional molecules involved in this complex and the consequences of downstream signals must be elucidated.
Materials and Methods
Animals and surgeries
Animal experiments were conducted in accordance with the Soochow University guidelines. NB‐3‐deficient mice have been previously described (Takeda et al, 2003). The detailed surgical procedures for spinal cord injury are described in Appendix Supplementary Materials and Methods.
Plasmid construction
The detailed information for the constructs of NB‐3–Myc, NB‐3–HA, NB‐3ΔECD NB‐3ΔECD–Myc, PTPσ shRNA, CHL1 shRNA, NB‐3 shRNA, and the negative control is described in Appendix Supplementary Materials and Methods.
Neural tracing
Biotinylated dextran amine (Invitrogen) was injected into the sensorimotor cortex to examine the regrowth of corticospinal axons. FG (Biotium) was injected into the dorsal CST at the T10 segment of the spinal cord to retrogradely label the corticospinal neurons. The detailed procedures for neural tracing are described in Appendix Supplementary Materials and Methods.
Immunohistochemistry
Immunohistochemistry was performed on cryostat sections (30 μm). Images were acquired on Zeiss LSM700 confocal microscopes (Carl Zeiss). The detailed procedures and the antibodies used in experiments are described in Appendix Supplementary Materials and Methods.
LV preparation and injection
Lentiviruses encoding NB‐3, NB‐3ΔECD, NB‐3 shRNA, CHL1 shRNA, PTPσ shRNA, and negative control were prepared. The detailed methods for LV preparation and injection are described in Appendix Supplementary Materials and Methods.
Western blotting and co‐immunoprecipitation
Western Blotting and co‐immunoprecipitation were performed by using either spinal cord lysates or sensorimotor cortical lysates. The detailed methods are described in Appendix Supplementary Materials and Methods.
Primary culture of astrocytes and pyramidal neurons
The cortical neurons from layer V sensorimotor cortex of E18.5 embryos were co‐cultured with astrocytes from cerebral cortices of P1–P3 mice. The detailed methods for co‐culture are described in Appendix Supplementary Materials and Methods.
Electrophysiology
Electrophysiological transmission experiments were using previously described techniques (Bradbury et al, 2002). The detailed methods for electrophysiology are described in Appendix Supplementary Materials and Methods.
Quantification
Quantifications were carried out to evaluate the axon intensity index, fluorescence intensity, neurite length, the percentage of regenerative corticospinal axons associated with reactive astrocytes or GFAP‐positive tissue bridges, the cell density and cell volume of scar‐forming cells, and the synapse reformation. The detailed methods for the quantifications are described in Appendix Supplementary Materials and Methods.
Author contributions
YL supervised the project. ZH and CZ examined the axonal regeneration. YS, ZH, and YG performed experiments to interpret the NB‐3 downstream signaling pathway. YG performed the culture assays. YG, ZH, and YY performed the animal surgeries. ZH and YG assessed mice locomotion after surgeries. ZH performed electrophysiological experiments. YS and KW provided the NB‐3‐deficient mice. YS, ZH, and YL wrote and edited the manuscript.
Conflict of interest
The authors declare that they have no conflict of interest.
Supporting information
Appendix
Expanded View Figures PDF
Review Process File
Source Data for Figure 1C
Source Data for Figure 2D
Source Data for Figure 5A
Source Data for Figure 6C
Source Data for Figure 8
Source Data for Figure 9
Source Data for Figure 10E
Acknowledgements
We appreciate the gifts of NB‐3–Myc construct and purified NB‐3–Fc protein from Dr. Haihong Ye. We also thank Dr. Yimin Zou for critical reading of the manuscript. This study was supported by grants from the National Natural Sciences Foundation of China (numbers 81330026, 31271259, 30990261, 30871425), the National Key Basic Research Development Program of the Ministry of Science and Technology of China (973 Program) (2013CB945600), the Chinese Academy of Sciences (KSCX2‐EW‐Q‐11), and A Project Funded by the Priority Academic Program Development of Jiangsu Higher Education Institutions.
The EMBO Journal (2016) 35: 1745–1765
See also: MC Danzi & VP Lemmon (August 2016)
References
- Barritt AW, Davies M, Marchand F, Hartley R, Grist J, Yip P, McMahon SB, Bradbury EJ (2006) Chondroitinase ABC promotes sprouting of intact and injured spinal systems after spinal cord injury. J Neurosci 26: 10856–10867 [DOI] [PMC free article] [PubMed] [Google Scholar]
- Bradbury EJ, Moon LDF, Popat RJ, King VR, Bennett GS, Patel PN, Fawcett JW, McMahon SB (2002) Chondroitinase ABC promotes functional recovery after spinal cord injury. Nature 416: 636–640 [DOI] [PubMed] [Google Scholar]
- Coles CH, Shen Y, Tenney AP, Siebold C, Sutton GC, Lu W, Gallagher JT, Jones EY, Flanagan JG, Aricescu AR (2011) Proteoglycan‐specific molecular switch for RPTPsigma clustering and neuronal extension. Science 332: 484–488 [DOI] [PMC free article] [PubMed] [Google Scholar]
- Faulkner JR, Herrmann JE, Woo MJ, Tansey KE, Doan NB, Sofroniew MV (2004) Reactive astrocytes protect tissue and preserve function after spinal cord injury. J Neurosci 24: 2143–2155 [DOI] [PMC free article] [PubMed] [Google Scholar]
- Fry EJ, Chagnon MJ, Lopez‐Vales R, Tremblay ML, David S (2010) Corticospinal tract regeneration after spinal cord injury in receptor protein tyrosine phosphatase sigma deficient mice. Glia 58: 423–433 [DOI] [PubMed] [Google Scholar]
- Giger RJ, Hollis ER, Tuszynski MH (2010) Guidance molecules in axon regeneration. Cold Spring Harb Perspect Biol 2: a001867 [DOI] [PMC free article] [PubMed] [Google Scholar]
- Goritz C, Dias DO, Tomilin N, Barbacid M, Shupliakov O, Frisen J (2011) A pericyte origin of spinal cord scar tissue. Science 333: 238–242 [DOI] [PubMed] [Google Scholar]
- Herrmann JE, Imura T, Song BB, Qi JW, Ao Y, Nguyen TK, Korsak RA, Takeda K, Akira S, Sofroniew MV (2008) STAT3 is a critical regulator of astrogliosis and scar formation after spinal cord injury. J Neurosci 28: 7231–7243 [DOI] [PMC free article] [PubMed] [Google Scholar]
- Hill CE, Beattie MS, Bresnahan JC (2001) Degeneration and sprouting of identified descending supraspinal axons after contusive spinal cord injury in the rat. Exp Neurol 171: 153–169 [DOI] [PubMed] [Google Scholar]
- Huang X, Sun J, Zhao T, Wu KW, Watanabe K, Xiao ZC, Zhu LL, Fan M (2011) Loss of NB‐3 aggravates cerebral ischemia by impairing neuron survival and neurite growth. Stroke 42: 2910–2916 [DOI] [PubMed] [Google Scholar]
- Huang ZH, Yu Y, Shimoda Y, Watanabe K, Liu YB (2012) Loss of neural recognition molecule NB‐3 delays the normal projection and terminal branching of developing corticospinal tract axons in the mouse. J Comp Neurol 520: 1227–1245 [DOI] [PubMed] [Google Scholar]
- Jakovcevski I, Wu JF, Karl N, Leshchyns'ka I, Sytnyk V, Chen J, Irintchev A, Schachner M (2007) Glial scar expression of CHL1, the close homolog of the adhesion molecule L1, limits recovery after spinal cord injury. J Neurosci 27: 7222–7233. [DOI] [PMC free article] [PubMed] [Google Scholar]
- Johnson KG, Van Vactor D (2003) Receptor protein tyrosine phosphatases in nervous system development. Physiol Rev 83: 1–24 [DOI] [PubMed] [Google Scholar]
- Jorg R, Farida H, Kevin C, Sebastian D, David A, Andrea T, Margaret B, Christopher S, Gary B, Kristina D, Michael P, Oliver B, Michael D, Armin B, Norbert W, Armin B, Norbert W, Mary B, John L, Frank B (2015) Systemic administration of epothilone B promotes axon regeneration after spinal cord injury. Science 348: 347–352 [DOI] [PMC free article] [PubMed] [Google Scholar]
- Lang C, Bradley PM, Jacobi A, Kerschensteiner M, Bareyre FM (2013) STAT3 promotes corticospinal remodelling and functional recovery after spinal cord injury. EMBO Rep 14: 931–937 [DOI] [PMC free article] [PubMed] [Google Scholar]
- Liu Y, Wang X, Lu CC, Sherman‐Kermen R, Steward O, Xu XM, Zou Y (2008) Repulsive Wnt signaling inhibits axon regeneration after CNS injury. J Neurosci 33: 8376–8382 [DOI] [PMC free article] [PubMed] [Google Scholar]
- Liu K, Lu Y, Lee JK, Samara R, Willenberg R, Sears‐Kraxberger I, Tedeschi A, Park KK, Jin D, Cai B, Xu B, Connolly L, Steward O, Zheng B, He Z (2010) PTEN deletion enhances the regenerative ability of adult corticospinal neurons. Nat Neurosci 13: 1075–1081 [DOI] [PMC free article] [PubMed] [Google Scholar]
- McLean J, Batt J, Doering LC, Rotin D, Bain JR (2002) Enhanced rate of nerve regeneration and directional errors after sciatic nerve injury in receptor protein tyrosine phosphatase sigma knock‐out mice. J Neurosci 22: 5481–5491 [DOI] [PMC free article] [PubMed] [Google Scholar]
- Okada S, Nakamura M, Katoh H, Miyao T, Shimazaki T, Ishii K, Yamane J, Yoshimura A, Iwamoto Y, Toyama Y, Okano H (2006) Conditional ablation of Stat3 or Socs3 discloses a dual role for reactive astrocytes after spinal cord injury. Nat Med 12: 829–834 [DOI] [PubMed] [Google Scholar]
- Park KK, Liu K, Hu Y, Smith PD, Wang C, Cai B, Xu B, Connolly L, Kramvis I, Sahin M, He Z (2008) Promoting axon regeneration in the adult CNS by modulation of the PTEN/mTOR pathway. Science 322: 963–966 [DOI] [PMC free article] [PubMed] [Google Scholar]
- Sabelstrom H, Stenudd M, Reu P, Dias DO, Elfineh M, Zdunek S, Damberg P, Goritz C, Frisen J (2013) Resident neural stem cells restrict tissue damage and neuronal loss after spinal cord injury in mice. Science 342: 637–640 [DOI] [PubMed] [Google Scholar]
- Sakurai K, Toyoshima M, Ueda H, Matsubara K, Takeda Y, Karagogeos D, Shimoda Y, Watanabe K (2009) Contribution of the neural cell recognition molecule NB‐3 to synapse formation between parallel fibers and Purkinje cells in mouse. Dev Neurobiol 69: 811–824 [DOI] [PubMed] [Google Scholar]
- Sakurai K, Toyoshima M, Takeda Y, Shimoda Y, Watanabe K (2010) Synaptic formation in subsets of glutamatergic terminals in the mouse hippocampal formation is affected by a deficiency in the neural cell recognition molecule NB‐3. Neurosci Lett 473: 102–106 [DOI] [PubMed] [Google Scholar]
- Sapieha PS, Duplan L, Uetani N, Joly S, Tremblay ML, Kennedy TE, Di Polo A (2005) Receptor protein tyrosine phosphatase sigma inhibits axon regrowth in the adult injured CNS. Mol Cell Neurosci 28: 625–635 [DOI] [PubMed] [Google Scholar]
- Shen Y, Tenney AP, Busch SA, Horn KP, Cuascut FX, Liu K, He Z, Silver J, Flanagan JG (2009) PTPsigma is a receptor for chondroitin sulfate proteoglycan, an inhibitor of neural regeneration. Science 326: 592–596 [DOI] [PMC free article] [PubMed] [Google Scholar]
- Silver J, Miller JH (2004) Regeneration beyond the glial scar. Nat Rev Neurosci 5: 146–156 [DOI] [PubMed] [Google Scholar]
- Sofroniew MV (2009) Molecular dissection of reactive astrogliosis and glial scar formation. Trends Neurosci 32: 638–647 [DOI] [PMC free article] [PubMed] [Google Scholar]
- Sun F, Park KK, Belin S, Wang D, Lu T, Chen G, Zhang K, Yeung C, Feng G, Yankner BA, He Z (2011) Sustained axon regeneration induced by co‐deletion of PTEN and SOCS3. Nature 480: 372–375 [DOI] [PMC free article] [PubMed] [Google Scholar]
- Takeda Y, Akasaka K, Lee S, Kobayashi S, Kawano H, Murayama S, Takahashi N, Hashimoto K, Kano M, Asano M, Sudo K, Iwakura Y, Watanabe K (2003) Impaired motor coordination in mice lacking neural recognition molecule NB‐3 of the contactin/F3 subgroup. J Neurobiol 56: 252–265 [DOI] [PubMed] [Google Scholar]
- Thompson KM, Uetani N, Manitt C, Elchebly M, Tremblay ML, Kennedy TE (2003) Receptor protein tyrosine phosphatase sigma inhibits axonal regeneration and the rate of axon extension. Mol Cell Neurosci 23: 681–692 [DOI] [PubMed] [Google Scholar]
- Wanner IB, Anderson MA, Song B, Levine J, Fernandez A, Gray‐Thompson Z, Ao Y, Sofroniew MV (2013) Glial scar borders are formed by newly proliferated, elongated astrocytes that interact to corral inflammatory and fibrotic cells via STAT3‐dependent mechanisms after spinal cord injury. J Neurosci 33: 12870–12886 [DOI] [PMC free article] [PubMed] [Google Scholar]
- Wojtowicz WM, Flanagan JJ, Millard SS, Zipursky SL (2004) Alternative splicing of Drosophila Dscam generates axon guidance receptors that exhibit isoform‐specific homophilic binding. Cell 118: 619–633 [DOI] [PMC free article] [PubMed] [Google Scholar]
- Ye H, Tan YLJ, Ponniah S, Takeda Y, Wang SQ, Schachner M, Watanabe K, Pallen CJ, Xiao ZC (2008) Neural recognition molecules CHL1 and NB‐3 regulate apical dendrite orientation in the neocortex via PTP alpha. EMBO J 27: 188–200 [DOI] [PMC free article] [PubMed] [Google Scholar]
- Zukor K, Belin S, Wang C, Keelan N, Wang XH, He ZG (2013) Short hairpin RNA against PTEN enhances regenerative growth of corticospinal tract axons after spinal cord injury. J Neurosci 33: 15350–15361 [DOI] [PMC free article] [PubMed] [Google Scholar]
Associated Data
This section collects any data citations, data availability statements, or supplementary materials included in this article.
Supplementary Materials
Appendix
Expanded View Figures PDF
Review Process File
Source Data for Figure 1C
Source Data for Figure 2D
Source Data for Figure 5A
Source Data for Figure 6C
Source Data for Figure 8
Source Data for Figure 9
Source Data for Figure 10E