

Abstract
Background
The autosomal dominant polycystic kidney disease (APDKD) genotype influences renal phenotype severity but its effect on polycystic liver disease (PLD) is unknown. Here we analyzed the influence of genotype on liver phenotype severity.
Methods
Clinical data were retrieved from electronic records of patients who were mutation screened with the available liver imaging (n = 434). Liver volumes were measured by stereology (axial or coronal images) and adjusted to height (HtLV).
Results
Among the patients included, 221 (50.9%) had truncating PKD1 (PKD1-T), 141 (32.5%) nontruncating PKD1 (PKD1-NT) and 72 (16.6%) PKD2 mutations. Compared with PKD1-NT and PKD2, patients with PKD1-T had greater height-adjusted total kidney volumes (799 versus 610 and 549 mL/m; P < 0.001). HtLV was not different (1042, 1095 and 1058 mL/m; P = 0.64) between the three groups, but females had greater HtLVs compared with males (1114 versus 1015 mL/m; P < 0.001). Annualized median liver growth rates were 1.68, 1.5 and 1.24% for PKD1-T, PKD1-NT and PKD2 mutations, respectively (P = 0.49), and remained unaffected by the ADPKD genotype when adjusted for age, gender and baseline HtLV. Females <48 years of age had higher annualized growth rates compared with those who were older (2.65 versus 0.09%; P < 0.001). After age 48 years, 58% of females with severe PLD had regression of HtLV, while HtLV continued to increase in males.
Conclusions
In contrast to the renal phenotype, the ADPKD genotype was not associated with the severity or growth rate of PLD in ADKPD patients. This finding, along with gender influence, indicates that modifiers beyond the disease gene significantly influence the liver phenotype.
Keywords: ADPKD, genotype–phenotype, PLD, polycystic liver
INTRODUCTION
Polycystic liver disease (PLD) is characterized by the presence of multiple cholangiocyte-derived epithelial cysts that cause progressive liver enlargement. Most commonly PLD coexists with autosomal dominant polycystic kidney disease (ADPKD) [1] and less commonly occurs as a genetically distinct disease with few or no renal cysts in autosomal dominant polycystic liver disease (ADPLD) [2]. ADPLD is caused by heterozygous mutations in the PRKCSH, SEC63 and LRP5 genes and is associated with an exclusive or predominant liver phenotype [3–7]. ADPKD is the most common monogenic kidney disease and the fourth leading cause of end-stage renal disease (ESRD) worldwide [8, 9]. It is characterized by relentless development of kidney cysts. It is genetically heterogeneous with two genes identified, PKD1 (16p13.3) and PKD2 (4q21). PLD is the most common extrarenal manifestation of ADPKD [10, 11]. Hepatic cyst prevalence and total hepatic cyst volume are higher with increasing age and in females compared with males [1, 12]. Hepatic cysts are evident in 94% of patients with ADPKD who are >35 years of age [1, 12]. Although most patients are asymptomatic, some have more severe PLD, leading to altered biochemical features as well as impaired quality of life [5]. Indeed, cystic mass effect or massive liver enlargement can cause dyspnea, early satiety, gastroesophageal reflux, mechanical back pain, jaundice from bile duct compression, hepatic venous outflow obstruction and portal vein and inferior vena cava compression [13]. Factors affecting the severity of the PLD phenotype are not well known. The use of estrogens in postmenopausal women with ADPKD has been associated with an increased rate of growth of liver cysts [14]. Limited data pooled from patients with PLD from several randomized placebo-controlled trials showed that females <48 years of age have the highest rate of polycystic liver growth [15–18].
The relationship between the ADPKD genotype and the severity and rate of progression of PLD is not well understood. Mutations in PKD1 account for ∼85% of cases and are associated with a more severe renal phenotype, a greater number of cysts, larger kidneys and faster progression to ESRD than cases with PKD2 mutations. The subtype of the PKD1 mutation also affects the renal phenotype. Truncating PKD1 mutations, accounting for two-thirds of PKD1 families, are associated with younger age of ESRD onset than nontruncating mutations [19].
The aim of this study was to examine whether the ADPKD genotype including the PKD1 mutation subtype affects the liver phenotype including the severity and growth rate of liver volume in ADKPD patients.
MATERIALS AND METHODS
Study population
All patients with ADPKD who were evaluated and had genetic screening at the Mayo Clinic in Rochester, MN, USA, from January 2000 to December 2014 were identified (n = 642). The DNA samples of these patients were exclusively collected for research genetic testing and not for routine clinical care and were relatively representative of ADPKD patients seen at the Mayo Clinic. However, since the Mayo Clinic has been a referral center for surgical management of patients with severe PLD over the last three decades, our patient cohort was enriched with severe PLD. Only patients that were genetically resolved (a PKD1 or PKD2 mutation was identified) were included in this study. Prior data from our center found an association between the position of the PKD1 gene mutation and the severity of renal disease [20]. However, recent data from the Genkcyst study found a strong effect associated with mutation type (truncating versus nontruncating) but not with the location of the mutation in PKD1 [19]. We have also completed a recent study of more than 1100 patients from the HALT-PKD and CRISP studies [21] that also found an effect associated with mutation type but not mutation position. Since these recent studies included a much larger number of patients than the original study that found a position effect, we elected to stratify patients with PKD1 mutations by the mutation effect rather than location of the mutation in PKD1. Patients with PKD1 mutations were divided into two subgroups: those with truncating (frameshift, nonsense, splice mutations and large rearrangements) and nontruncating (in-frame and missense) mutations, because truncating PKD1 mutations have been associated with a more severe kidney phenotype. We excluded patients for whom liver imaging by a CT scan or MRI was unavailable, incomplete or only available after an intervention that might have affected the liver volume. Patients who had no height available were also excluded (Figure 1). Demographics and clinical data were retrieved from the patients' electronic records. The Mayo Clinic Institutional Review Board approved the study and all patients provided research authorization.
FIGURE 1:
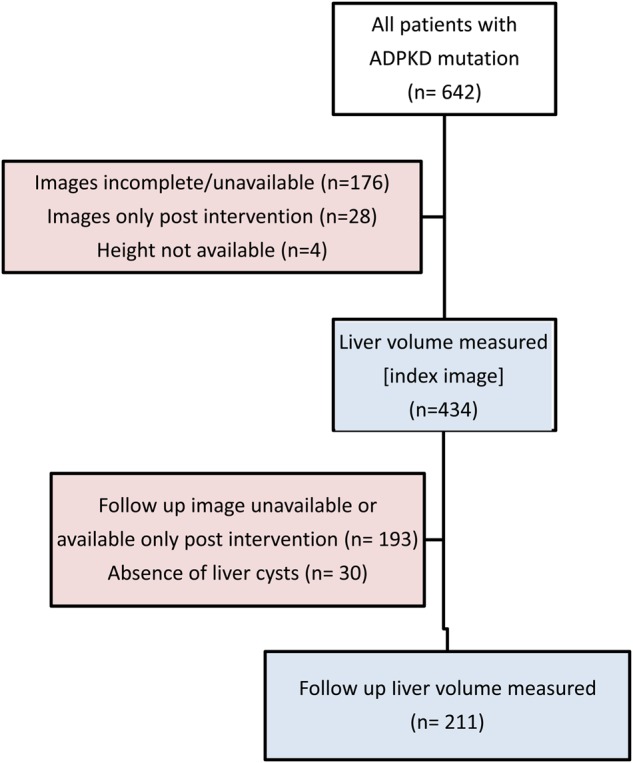
Study flow chart. The chart shows the number of patients with PKD mutations, the number of patients with available liver imaging and the number of patients with sequential liver images available for liver growth calculation.
Data retrieved from records included age at the time of imaging, gender, race, height, total kidney volume (TKV), history of hypertension, age of ESRD onset, history of oral contraceptive use at any point in time prior to the first (index) liver imaging, number of parity prior to the index liver imaging and number of liver volume reduction interventions before and after the index liver imaging (including liver resection, cyst fenestration, liver transplantation and somatostatin analog). Laboratory tests within 6 months of liver imaging were extracted and included serum creatinine, alkaline phosphatase, aspartate transaminase (AST) and alanine transaminase (ALT). Estimated glomerular filtration rate (eGFR) was calculated using the Chronic Kidney Disease Epidemiology Collaboration (CKD-EPI) formula [22].
Outcomes: liver volume and annualized liver growth
Liver volume measurements were performed on axial or coronal CT or MRI using Analyze software (Analyze 120.0, Biomedical Image Resource, Mayo Clinic, Rochester, MN). The first available liver volume (index image, LV1), performed prior to any intervention that might affect the liver volume, was used in the main analysis of the phenotype–genotype relationship (n = 434). Liver volume was height adjusted (HtLV). PLD was defined in this clinical setting as the presence of one or more liver cysts on imaging. Patients with no liver cysts were considered as part of the liver phenotype spectrum. The liver volumes of those patients were included in the main analysis (relationship between index liver volume and genotype). Classification of the liver phenotype, based on the presence or absence of cysts and HtLV, was adapted from a prior study describing liver involvement in early ADPKD, with patients categorized into absence of cysts, mild (HtLV < 1000 mL/m), moderate (HtLV 1000–1800 mL/m) and severe PLD (HtLV > 1800 mL/m) [12].
To evaluate liver volume progression, we measured the liver volume on the last available follow-up image (LV2) of patients with PLD (we excluded the 30 patients with no liver cysts at baseline) if done at least 1 year after the index image (n = 211). The progression rate of height-adjusted liver volume was annualized and expressed in percent using the following formula:
Statistical analysis
Data were reported as mean ± SD for normally distributed data or median and interquartile range (IQR) for skewed data. Comparisons between groups were done by Student's t-test (two groups) or ANOVA (more than two groups) for normally distributed data and by the Wilcoxon rank sum test or the Kruskall–Wallis test as appropriate for skewed data. Kaplan–Meier analysis (log-rank) was used to compare median renal survival. Liver volumes were adjusted for height. Due to the skewed nature of the liver volume, HtLV was log-transformed for normality. Univariate associations between each of the clinical variables and PKD genotype were examined. Multivariate linear regression analysis was performed to assess the association of log-transformed HtLV and annualized liver growth rate with age, gender, PKD mutation, pregnancy and baseline liver volume in various statistical models that included different combinations of the aforementioned variables. To quantify the degree to which individuals within the same family correlate with each other in regard to index liver volume (log HtLV) and annualized growth rate, we determined the intraclass correlation coefficient (ICC) adjusting for age and sex. P-values <0.05 were considered statistically significant.
RESULTS
The study flow chart is shown in Figure 1. Between January 2000 to December 2014, among the 642 patients with a documented PKD1 or PKD2 mutation at the Mayo Clinic, 434 patients had available liver imaging. Baseline characteristics are presented in Table 1. Patients were stratified further into PKD1 mutation subtype. Among the 434 patients from 306 families, 221 (50.9%) had truncating PKD1 (frameshift, nonsense, splice mutations and large rearrangements), 141 (32.5%) nontruncating PKD1 (in-frame and missense) and 72 (16.6%) had PKD2 mutations. Compared with nontruncating PKD1 and PKD2, patients with truncating PKD1 mutations were younger at the time of imaging (mean age 43.3 versus 47.5 and 50.4 years, respectively; P < 0.001), reached ESRD at a younger age (median age 56.5 versus 68.4 and 79.4 years, respectively; P < 0.001, log-rank) (Supplementary data, Figure S1) and had larger height-adjusted total kidney volume (HtTKV) (799 versus 614 and 549 mL/m; P < 0.001, adjusted for age and gender; Table 1). Differences in gender, race, renal function or liver function tests, length of follow-up and rates of surgical intervention or somatostatin analog treatment were not statistically significant among patients with truncating PKD1, non-truncating PKD1 and PKD2 mutations (Table 1).
Table 1.
Baseline characteristics of the study population
|
PKD1 (n = 362) |
PKD2 (n = 72) | P-value | ||
|---|---|---|---|---|
| Truncating (n = 221) | Nontruncating (n = 141) | |||
| Age at index imaging, mean ± SD, years | 43.3 ± 13.3 | 47.6 ± 14 | 50.4 ± 14.2 | <0.001 |
| Female | 135 (61.1%) | 88 (62.4%) | 40 (55.6%) | 0.61 |
| White | 189 (85.5%) | 120 (84%) | 63 (87.5%) | 0.75 |
| HtTKV, median (IQR), mL/ma | 799 (492–1514) | 614 (348–1169) | 549 (330–1150) | <0.001b |
| Log HtTKV, median (IQR) | 6.7 (6.2–7.3) | 6.4 (5.8–7) | 6.3 (5.8–7) | <0.001b,c |
| Hypertension, n (%) | 177 (80.1%) | 104 (73.8%) | 53 (73.6%) | 0.077b |
| Serum creatinine, median (IQR), mg/dLd | 1.2 (1–1.8) | 1.1 (0.9–1.5) | 1.1 (0.9–1.5) | 0.005b |
| eGFR (CKD-EPI), median (IQR), mL/min/1.73 m2d | 62.5 (34–84) | 67.7 (43–92) | 64.5 (51–86) | <0.001b |
| Renal survival, median (95% CI), years | 56.5 (54.3–58.6) | 69.3 (63.8–71.8) | 79.4 (69.3-n/a) | <0.001e |
| AST, median (IQR), U/La | 23 (19–29) | 24 (20–29) | 26 (20–31) | 0.58 |
| ALT, median (IQR), U/La | 22 (16–35) | 24 (18–36) | 21 (17–38) | 0.78 |
| Alkaline phosphatasea, median (IQR) | 74 (56–116) | 80 (60–109) | 92 (65–161) | 0.061 |
| One interventionf, n (%) | ||||
| Fenestration/liver resection | 36 (16.3%) | 25 (17.7%) | 11 (15.2%) | 0.56 |
| Liver transplant | 22 (10%) | 14 (9.9%) | 8 (11.1%) | |
| Somatostatin analog | 4 (1.8%) | 1 (0.7%) | 0 (0%) | |
| Fenestration/liver resection | 10 (4.5%) | 11 (7.8%) | 3 (4.2%) | |
| Second interventionf, n (%) | 3 (1.4%) | 5 (3.5%) | 0 (0%) | 0.15 |
| Liver resection | 0 (0%) | 3 (2.1%) | ||
| Liver transplant | 1 (0.5%) | 0 (0%) | ||
| Somatostatin analog | 2 (0.9%) | 2 (1.4%) | ||
| OCP useg | 39 (29%) | 18 (21%) | 3 (8%) | 0.074h |
| Parity at time of index LVg | ||||
| 0 | 28 (25%) | 15 (24%) | 5 (21%) | 0.15h |
| 1 | 20 (17%) | 7 (11%) | 1 (4%) | |
| 2 | 30 (27%) | 15 (24%) | 3 (12%) | |
| ≥3 | 35 (31%) | 25 (41%) | 15 (63%) | |
AST, aspartate transaminase; ALT, alanine transaminase; OCP, oral contraceptive pills; use of OCP documented at any visit.
aWithin 1 year of liver image.
bAge and gender adjusted.
cP < 0.001 between truncating and nontruncating and P = 0.11 between nontruncating and PKD2.
dWithin 6 months of liver image.
eLog-rank test.
fInterventions performed prior to available imaging were excluded.
gSome females had missing data; males were excluded.
hAge adjusted.
PLD severity based on PKD genotype and gender
The association between baseline HtLV and age stratified by ADPKD mutations and gender is shown in Figure 2. Liver volumes in patients with PKD1 truncating, PKD1 nontruncating and PKD2 mutations were not different (median HtLV 1042, 1095 and 1058 mL/m; P = 0.64; age and gender adjusted). When patients are stratified according to liver phenotype severity (absence of hepatic cysts, mild, moderate or severe PLD), there was no difference found between the distribution of these categories in patients with truncating PKD1, nontruncating PKD1 and PKD2 mutations (P = 0.28) (Table 2 and Supplementary data, Figure S2).
FIGURE 2:

HtLV by PKD mutation, age and gender. The figure shows the cross-sectional distribution of HtLV at the time of index image based on the PKD mutation and gender.
Table 2.
Index liver volumes based on ADPKD genotype and gendera
| ADPKD genotype |
Gender |
||||||
|---|---|---|---|---|---|---|---|
| PKD1 truncating (n = 221) | PKD1 nontruncating (n = 141) | PKD2 (n = 72) | P-value | Male (n = 171) | Female (n = 263) | P-value | |
| LV1 (mL) | 1813 (1530–2902) | 1482 (1279–2997) | 1837 (1420–2773) | 0.55b | 1846 (1442–3569) | 1828 (1576–2275) | 0.002c |
| HtLV1 (mL/m) | 1042 (901–1729) | 1095 (884–1730) | 1058 (857–1600) | 0.64b | 1016 (886–1234) | 1115 (886–2127) | <0.001c |
| Log HtLV1 | 6.95 (6.80–7.45) | 7.0 (6.78–7.46) | 6.96 (6.75–7.38) | 0.42b | 7.01 (6.78–7.66) | 6.92 (6.78–7.11) | <0.001c |
| No cystsd | 12 (40%) | 14 (46.7%) | 4 (13.3%) | 0.28b | 18 (60%) | 12 (40%) | <0.001c |
| Mildd | 92 (55%) | 45 (27%) | 30 (18%) | 69 (41.3%) | 98 (58.7%) | ||
| Moderated | 65 (47.8%) | 49 (36%) | 22 (16.2%) | 67 (49.3%) | 69 (50.7%) | ||
| Severed | 52 (51.5%) | 33 (32.7%) | 16 (15.8%) | 17 (16.8%) | 84 (83.2%) | ||
aLiver volumes are reported as median (IQR).
bAdjusted for age and gender.
cAdjusted for age.
dMild (HtLV < 1000 mL/m), moderate (HtLV = 1000–1800 mL/m), severe (HtLV > 1800 mL/m). Percentages are based on each row.
Females had larger age-adjusted liver volumes compared with males (HtLV 1115 versus 1016 mL/m; P < 0.001) and more cases with severe PLD than males (Table 2 and Figure 2). Females who had more than one pregnancy had similar age-adjusted HtLV as compared with nulliparous females (1140 versus 950 mL/m; P = 0.12).
On multivariate linear regression analysis, there was no association between HtLV (log-transformed for the analysis) and ADPKD mutations (truncating or nontruncating PKD1 and PKD2 mutations; Table 3). The analysis included two models, the first adjusting for age and gender and the second for age and number of pregnancies. In Model 1, for each decade of age there was a 10.1% increase in HtLV (P < 0.001), females had a 22.4% higher HtLV compared with males (P < 0.001) and patients with PKD1 truncating mutations had a nonsignificant 9.7% higher HtLV compared with those with PKD2 mutation (P = 0.21). In Model 2, pregnancy was not statistically associated with HtLV [effect size 16.8% (95% CI −4–37.5), P = 0.11], while age remained associated with HtLV. After adjusting for age and sex, there was a significant familial effect on log HtLV with an ICC of 0.45 (P = 0.001). In other words, when sampling individuals from the same family (pedigree), their correlation explained 45% of the variability in log HtLV.
Table 3.
Multivariate linear regression analysis for variables associated with height-adjusted liver volume
| Dependent variable | Independent variable | Effect size | 95% CI | P-value |
|---|---|---|---|---|
| HtLV1 (log) | Model 1 | |||
| PKD1 truncatinga | 9.7% | −5.4%–24.8% | 0.21 | |
| PKD1 nontruncatinga | 5.1% | −10.2%–21% | 0.54 | |
| Female | 22.4% | 11.6%–33.1% | <0.001 | |
| Ageb (per decade) | 10.1% | 6.3%–14% | <0.001 | |
| Model 2 | ||||
| PKD1 truncatinga | 1% | −26.3%–28.2% | 0.28 | |
| PKD1 nontruncatinga | −6.6% | −35.5%–22.4% | 0.50 | |
| Pregnancy (≥1)c | 16.8% | −4%–37.5% | 0.11 | |
| Ageb (per decade) | 8.7% | 1.68%–15.7% | 0.017 | |
aThe reference group is PKD2.
bAt index image.
cMales were excluded.
Liver volume progression based on PKD genotype and gender
In this analysis, from the 434 patients, we excluded 30 who did not have cysts at the index image. Follow-up images were identified to calculate liver volume growth rates. Among the 404 patients with PLD on index images, 211 had a subsequent image at least 1 year later. One-hundred nineteen patients (56.4%) had truncating PKD1, 54 (25.4%) nontruncating PKD1 and 38 (18%) had PKD2 mutations; 60.7% were female (Table 4). Annualized liver growth rates were not different between the ADPKD genotypes. Median growth rates were 1.68, 1.5 and 1.24% for patients with truncating PKD1, non-truncating PKD1 and PKD2 mutations, respectively (P = 0.56, age and gender adjusted). Age <48 years at the index image was associated with faster growth rates when compared with older patients (1.75 versus 0.74%; P = 0.037) (Figure 3A). This age effect was seen in females (2.65 versus 0.09%; P < 0.001) but not in males (2.28 versus 0.8%; P = 0.18; Figure 3B), as the progression of liver volume plots illustrates (Figure 4).
Table 4.
Liver growth rates based on ADPKD genotype and gendera
| ADPKD genotype |
Gender |
||||||
|---|---|---|---|---|---|---|---|
| PKD1 truncating (n = 119) | PKD1 nontruncating (n = 54) | PKD2 (n = 38) | P-value | Male (n= 83) | Female (n= 128) | P-value | |
| Age at LV1, mean ± SD, years | 40.6 ± 11 | 47.2 ± 11.2 | 47.9 ± 12.5 | <0.001 | 43.5 ± 11.5 | 43.5 ± 12 | 0.98 |
| Age at LV2, mean ± SD, years | 47 ± 11 | 52 ± 11.2 | 54.8 ± 12.3 | <0.001 | 49.5 ± 11 | 49.6 ± 12 | 0.98 |
| HtLV1, mL/m | 1000 (887–1254) | 1167 (894–1922) | 1091 (876–1761) | 0.56c | 1003 (894–1196) | 1095 (889–1779) | 0.016d |
| HtLV2, mL/m | 1121 (968–1514) | 1206 (933–2165) | 1185 (899–1956) | 0.50c | 1058 (920–1358) | 1243 (969–2157) | 0.006d |
| Mildb | 60 (63%) | 20 (21%) | 15 (16%) | 41 (43%) | 54 (57%) | 0.056d | |
| Moderate | 43 (56%) | 20 (26%) | 14 (18%) | 34 (44%) | 43 (56%) | ||
| Severe | 16 (41%) | 14 (36%) | 9 (23%) | 0.55c | 8 (21%) | 31 (79%) | |
| Annualized growth rate, % | 1.68 (−0.6–5.2) | 1.5 (−1.3–4.1) | 1.24(−0.6–3.6) | 0.56c | 1.25 (−0.6–3.3) | 1.87 (−0.9–5.3) | 0.07d |
aLiver volumes and growth rates are reported as median (IQR).
bClassification at follow-up image: mild (HtLV < 1000 mL/m), moderate (HtLV 1000–1800 mL/m), severe (HtLV > 1800 mL/m).
cAdjusted for age and gender.
dAdjusted for age.
FIGURE 3:

Annualized liver growth rate by mutation, gender, baseline age and liver volume. The figure compares (A) the annualized growth rate of liver volumes in percent among the PKD mutations, gender, age less or greater than 48 years and severity of PLD at index image with a cut-off HtLV of 1800 mL/m and (B) those rates between patients younger and older than age 48 in both males and females. The asterisk indicates statistical significance (P < 0.05). The numbers in the box represent the median annualized growth rates. N indicates the number of patients in each category.
FIGURE 4:

Height-adjusted liver volume progression in (A) females, (B) males and in those with (C) positive and (D) negative growth. This figure shows the progression of liver volumes among different groups over time. Each line represents one patient. There is no significant effect of PKD genotype on liver growth rates in both females (A) and males (B). Some patients have positive liver growth, in particular females <48 years of age (C), when compared with other patients who have volume regression, particularly women >48 years of age (D).
The effect of ADPKD genotype on liver growth rates was assessed by multivariate linear regression to adjust for age, gender and baseline liver volume. Two statistical models were considered using age and HtLV as continuous or dichotomous variables. Both models showed that the rate of growth was unaffected by the ADPKD genotype (Table 5). Model 1, for example, compared patients with a PKD2 mutation with those with a PKD1 truncating mutation and showed a nonsignificant lower annualized growth rate of 1.17% (P = 0.32). Age was associated with a lower annualized growth rate (−1.06% per decade; P = 0.007) and baseline HtLV with a higher annualized growth rate (0.69% per 500 mL/m; P = 0.002). There was no significant familial effect on the liver growth rate (P = 0.34) based on the ICC.
Table 5.
Multivariate linear regression analysis for variables associated with annualized liver volume growth rate
| Dependent variable | Independent variable | Effect size | 95% CI | P-value |
|---|---|---|---|---|
| Annualized growth rate, % | Model 1 | |||
| PKD1 truncatinga | −1.17 | −3.5–1.1 | 0.32 | |
| PKD1 nontruncatinga | −0.97 | −3.5–1.6 | 0.46 | |
| Female | 0.44 | −0.4–1.3 | 0.31 | |
| Age (per decade) | −1.06 | −1.8 to −0.3 | 0.007 | |
| HtLV1 (per 500 mL/m) | 0.69 | 0.3–1.1 | 0.002 | |
| Model 2 | ||||
| PKD1 truncatinga | −0.97 | −3.29–1.34 | 0.41 | |
| PKD1 nontruncatinga | −0.89 | −3.49–1.71 | 0.50 | |
| Female | 0.46 | −0.42–1.35 | 0.30 | |
| Age ≥ 48 yearsb | −1.17 | −2.1 to −0.3 | 0.013 | |
| HtLV1 ≥ 1800b | 2.23 | −0.03–4.49 | 0.053 | |
aThe reference group is PKD2.
bAt index image.
Decrease of cystic liver volume
Of interest, several patients [n = 63 (30%)] had negative growth in liver volume without any intervention. Because the margin of error for intrareader variability was 1.23 ± 0.8%, we analyzed patients who had an absolute negative growth of >3% (n = 52) and compared them with those with an absolute positive growth >3% (n = 132) between the index and last available image. Compared with patients with positive growth, those with a decrease in liver volume were older (47.2 versus 41.7 years, P = 0.006), with a larger proportion >48 years of age at the index imaging (46 versus 29%; P = 0.02). The proportion of females (62 versus 63%; P = 0.86) and those with severe PLD (23 versus 17%; P = 0.37) were similar in both groups. Figures 4C and D show the changes of liver volume in relation to age and gender with positive or negative growth.
Among the 28 female patients with severe PLD, 16 (57%) were <48 years of age. Among them, 12 (75%) were progressors (median annualized growth 10.6%) and 4 (25%) were nonprogressors (median annualized growth −2.4%). Among the 12 women with severe PLD >48 years of age, 5 (42%) were progressors (median 4.9%) and 7 (58%) were non-progressors (median −2.4%). Among the seven males with severe PLD, two patients (28%) were <48 years of age (median growth 2.3%) and five (72%) were >48 (median annualized growth 5.4%). Contrary to the females, all males >48 years of age with severe PLD continued to have significant liver growth.
Growth of liver parenchyma in patients with no liver cysts
Among the 30 patients with no cysts on the index image, 14 patients had a follow-up image with no evidence of liver cysts. Patients with no liver cysts on both images were 36.6 ± 17 years at the time of follow-up image, mostly males (65%) and their median Ht-TKV was 629 mL/m (range 382–1201). Among the 14 patients, 5 (35.7%) had a PKD1 truncating mutation, 8 (57.2%) had a PKD1 nontruncating mutation and 1 (7.1%) had a PKD2 mutation. The median HtLV was 840 mL/mm (IQR 777–994) and 981 (843–1108) at index and follow-up image, respectively (P = 0.1), the mean time of follow-up was 5.9 ± 4.5 years and annualized liver parenchymal growth was 2.9% (IQR −1.64–3.68) (Supplementary data, Figure S3). Four patients were noted to have large annualized growth rates exceeding 3.2%. These four patients had marked concurrent increases in body weight (17–35 kg). The characteristics and imaging of these four patients are summarized in Supplementary data, Table S1.
DISCUSSION
The main finding of this study is that the significant difference in renal phenotype between ADPKD genotypes is not paralleled by the liver phenotype. ADPKD mutations do not predict the severity or growth rate of PLD. Both PKD1 (truncating or non-truncating) and PKD2 patients have similar liver volumes and growth rates even when adjusted for age and gender. The effect of the ADPKD genotype on liver cystic disease has not been previously studied. This study examines, for the first time, this relationship in a large cohort of ADPKD patients who had both genetic and liver imaging data available.
This study has several strengths. First, the genotypic characteristics of this cohort resemble those of typical ADPKD patients seen in a clinical setting. PKD1 patients represent 83.5% of the cohort and these have larger kidney volumes and reach ESRD at a younger age. The difference in renal phenotype among the three ADPKD genotype groups is reflected in the current study population. This cohort confirms the high prevalence of liver cysts in ADPKD (93%) in addition to the higher prevalence and severity of PLD in women compared with men [1]. Second, this cohort is one of the largest cohorts studying liver phenotypes in ADPKD patients. Third, since patients with severe PLD are often referred to our center for treatment, this cohort is enriched in those patients [23% (101/434)] as compared with other national cohorts such as the HALT-PKD cohort [5.3% (28/522)] [19].
The factors underlying the different impact of the PKD genotype on the severity of the liver and kidney phenotypes are not well understood. In both organs, the development of cysts requires the level of functional polycystin to drop below a critical threshold [23–25]. While it is clear that PKD1 and PKD2 mutations are associated with liver cyst development in an age-related fashion, the level of functional polycystin seems less important than for renal disease. More critical seems to be the exposure to female hormones and as yet unidentified other genetic and environmental modifying factors. These modifiers may mainly be acting at the level of cyst growth rather than cyst development, where polycystin levels seem most important. Liver cysts appear to be much more susceptible to growth-promoting modifiers than those in the kidney.
The rate of liver growth in patients with PLD has been reported in a relatively small number of patients who were assigned to placebo in randomized controlled clinical trials of somatostatin analogs [16–18, 26]. Our cohort has a larger number of patients with follow-up images (n = 211) and a longer mean follow-up (6 years). As in a recent meta-analysis of randomized clinical trials with somatostatin analogs, we found that the rate of increase in liver volume was greater in women <48 years of age compared with women >48 years and men [26]. These observations are consistent with the stability of liver volume reported in postmenopausal women not taking hormone replacement therapy [14] and is likely explained by the greater exposure of younger women to estrogens and progesterone, including pregnancies and oral contraceptives [27, 28]. In our cohort, liver volumes were higher in women with a history of pregnancy, but this difference disappeared after adjusting for age.
Another interesting observation in this study is that 58% of females >48 years of age with severe PLD (HtLV > 1800 mL/m) at baseline had a significant regression in liver volume during their follow-up imaging. In contrast, PLD in males continues to progress with age, with no regression. This finding should be considered in the clinical decision making in patients, particularly perimenopausal women, when considering surgical or pharmacological interventions such as liver resection or fenestration or initiation of a somatostatin analog. However, these results should be interpreted with caution because of the limited number of older subjects with severe PLD.
Four patients with ADPKD without liver cysts were noted to have marked liver growth with a concurrent marked increase in body weight (17–35 kg). The liver enlargement in these patients was likely related to weight gain since obesity is well known to be associated with hepatomegaly [29]. It may also be due in part to ADPKD progression since liver parenchymal volumes have been found to be larger in patients with ADPKD when compared with the general population [12] and hepatocyte hypertrophy has been described in a hypomorphic PKD1 mouse model [30].
Given the nature of the retrospective study, several limitations are associated with the clinical data available. In particular, we are unable to confirm the duration of exposure to oral contraceptives; because of the possibility that we have missed women taking contraceptives (some might not have reported this on the medication list), we did not analyze the effect of hormonal therapy on liver volume. The smaller number of patients with PKD2 mutations (72 of 434 included) could have affected the power to detect a difference in the liver phenotype (liver volume). However, despite the small number of the PKD2 population, we were able to detect a statistically different renal phenotype (renal survival and kidney volume) in PKD2 when compared with PKD1 in our cohort. Furthermore, even between the PKD1 groups (truncating and nontruncating) with a larger number of patients, we did not detect a difference in liver volumes. The number of patients >48 years of age, particularly those with severe PLD (male and females), is small and thus the results of the subgroup analysis showing regression of liver volume in many females and continuous progression in males should be interpreted cautiously.
In conclusion, in contrast to the renal phenotype, the ADPKD genotype and PKD1 mutation subtype were not significantly associated with the severity or growth rate of PLD in ADKPD patients. This finding, along with the demonstrated gender influence, indicates that modifiers beyond the disease gene significantly influence the liver phenotype.
SUPPLEMENTARY DATA
Supplementary data are available online at http://ndt.oxfordjournals.org.
FUNDING
This study was supported by grants from the National Institute of Diabetes and Digestive and Kidney Diseases, National Institutes of Health (DK090728), the Mayo Translational PKD Center (DK058816-15) and the Mayo Clinic's Center for Clinical and Translational Science (National Institute of Health grant UL1TR000135). This study was also supported by funding from the Zell Family Foundation.
CONFLICT OF INTEREST STATEMENT
The results of this study have not been published previously in whole or part, except in abstract form.
(See related article by D’Agnolo and Drenth. Risk factors for progressive polycystic liver disease: where do we stand? Nephrol Dial Transplant 2016; 31: 857–859)
Supplementary Material
ACKNOWLEDGEMENTS
The authors thank Dr Walter Kremers for statistical support.
REFERENCES
- 1.Bae KT, Zhu F, Chapman AB et al. Magnetic resonance imaging evaluation of hepatic cysts in early autosomal-dominant polycystic kidney disease: the Consortium for Radiologic Imaging Studies of Polycystic Kidney Disease cohort. Clin J Am Soc Nephrol 2006; 1: 64–69 [DOI] [PubMed] [Google Scholar]
- 2.Van Keimpema L, De Koning DB, Van Hoek B et al. Patients with isolated polycystic liver disease referred to liver centres: clinical characterization of 137 cases. Liver Int 2011; 31: 92–98 [DOI] [PubMed] [Google Scholar]
- 3.Drenth JP, te Morsche RH, Smink R et al. Germline mutations in PRKCSH are associated with autosomal dominant polycystic liver disease. Nat Genet 2003; 33: 345–347 [DOI] [PubMed] [Google Scholar]
- 4.Qian Q, Li A, King BF et al. Clinical profile of autosomal dominant polycystic liver disease. Hepatology 2003; 37: 164–171 [DOI] [PubMed] [Google Scholar]
- 5.Reynolds DM, Falk CT, Li A et al. Identification of a locus for autosomal dominant polycystic liver disease, on chromosome 19p13.2-13.1. Am J Hum Genet 2000; 67: 1598–1604 [DOI] [PMC free article] [PubMed] [Google Scholar]
- 6.Davila S, Furu L, Gharavi AG et al. Mutations in SEC63 cause autosomal dominant polycystic liver disease. Nat Genet 2004; 36: 575–577 [DOI] [PubMed] [Google Scholar]
- 7.Cnossen WR, te Morsche RH, Hoischen A et al. Whole-exome sequencing reveals LRP5 mutations and canonical Wnt signaling associated with hepatic cystogenesis. Proc Natl Acad Sci USA 2014; 111: 5343–5348 [DOI] [PMC free article] [PubMed] [Google Scholar]
- 8.Torres VE, Harris PC, Pirson Y. Autosomal dominant polycystic kidney disease. Lancet 2007; 369: 1287–1301 [DOI] [PubMed] [Google Scholar]
- 9.Gabow PA. Autosomal dominant polycystic kidney disease. N Engl J Med 1993; 329: 332–342 [DOI] [PubMed] [Google Scholar]
- 10.Everson GT. Hepatic cysts in autosomal dominant polycystic kidney disease. Mayo Clin Proc 1990; 65: 1020–1025 [DOI] [PubMed] [Google Scholar]
- 11.Everson GT, Taylor MR, Doctor RB. Polycystic disease of the liver. Hepatology 2004; 40: 774–782 [DOI] [PubMed] [Google Scholar]
- 12.Hogan MC, Abebe K, Torres VE et al. Liver involvement in early autosomal-dominant polycystic kidney disease. Clin Gastroenterol Hepatol 2015; 13: 155–164 e6 [DOI] [PMC free article] [PubMed] [Google Scholar]
- 13.Torres VE, Rastogi S, King BF et al. Hepatic venous outflow obstruction in autosomal dominant polycystic kidney disease. J Am Soc Nephrol 1994; 5: 1186–1192 [DOI] [PubMed] [Google Scholar]
- 14.Sherstha R, McKinley C, Russ P et al. Postmenopausal estrogen therapy selectively stimulates hepatic enlargement in women with autosomal dominant polycystic kidney disease. Hepatology 1997; 26: 1282–1286 [DOI] [PubMed] [Google Scholar]
- 15.Gevers TJ, Hol JC, Monshouwer R et al. Effect of lanreotide on polycystic liver and kidneys in autosomal dominant polycystic kidney disease: an observational trial. Liver Int 2015; 35: 1607–1614 [DOI] [PubMed] [Google Scholar]
- 16.Caroli A, Antiga L, Cafaro M et al. Reducing polycystic liver volume in ADPKD: effects of somatostatin analogue octreotide. Clin J Am Soc Nephrol 2010; 5: 783–789 [DOI] [PMC free article] [PubMed] [Google Scholar]
- 17.Hogan MC, Masyuk TV, Page LJ et al. Randomized clinical trial of long-acting somatostatin for autosomal dominant polycystic kidney and liver disease. J Am Soc Nephrol 2010; 21: 1052–1061 [DOI] [PMC free article] [PubMed] [Google Scholar]
- 18.van Keimpema L, Nevens F, Vanslembrouck R et al. Lanreotide reduces the volume of polycystic liver: a randomized, double-blind, placebo-controlled trial. Gastroenterology 2009; 137: 1661–1668 e1–2 [DOI] [PubMed] [Google Scholar]
- 19.Cornec-Le Gall E, Audrezet MP, Chen JM et al. Type of PKD1 mutation influences renal outcome in ADPKD. J Am Soc Nephrol 2013; 24: 1006–1013 [DOI] [PMC free article] [PubMed] [Google Scholar]
- 20.Rossetti S, Burton S, Strmecki L et al. The position of the polycystic kidney disease 1 (PKD1) gene mutation correlates with the severity of renal disease. J Am Soc Nephrol 2002; 13: 1230–1237 [DOI] [PubMed] [Google Scholar]
- 21.Heyer CM, Sundsbak JL, Abebe KZ et al. Predicted mutation strength of nontruncating PKD1 mutations aids genotype-phenotype correlations in autosomal dominant polycystic kidney disease. J Am Soc Nephrol 2016; 27 [DOI] [PMC free article] [PubMed] [Google Scholar]
- 22.Levey AS, Stevens LA, Schmid CH et al. A new equation to estimate glomerular filtration rate. Ann Intern Med 2009; 150: 604–612 [DOI] [PMC free article] [PubMed] [Google Scholar]
- 23.Lantinga-van Leeuwen IS, Dauwerse JG, Baelde HJ et al. Lowering of Pkd1 expression is sufficient to cause polycystic kidney disease. Hum Mol Genet 2004; 13: 3069–3077 [DOI] [PubMed] [Google Scholar]
- 24.Jiang ST, Chiou YY, Wang E et al. Defining a link with autosomal-dominant polycystic kidney disease in mice with congenitally low expression of Pkd1. Am J Pathol 2006; 168: 205–220 [DOI] [PMC free article] [PubMed] [Google Scholar]
- 25.Hopp K, Ward CJ, Hommerding CJ et al. Functional polycystin-1 dosage governs autosomal dominant polycystic kidney disease severity. J Clin Invest 2012; 122: 4257–4273 [DOI] [PMC free article] [PubMed] [Google Scholar]
- 26.Gevers TJ, Inthout J, Caroli A et al. Young women with polycystic liver disease respond best to somatostatin analogues: a pooled analysis of individual patient data. Gastroenterology 2013; 145: 357–365 .e1–2 [DOI] [PubMed] [Google Scholar]
- 27.Alvaro D, Onori P, Metalli VD et al. Intracellular pathways mediating estrogen-induced cholangiocyte proliferation in the rat. Hepatology 2002; 36: 297–304 [DOI] [PubMed] [Google Scholar]
- 28.Glaser S, DeMorrow S, Francis H et al. Progesterone stimulates the proliferation of female and male cholangiocytes via autocrine/paracrine mechanisms. Am J Physiol Gastrointest Liver Physiol 2008; 295: G124–G136 [DOI] [PMC free article] [PubMed] [Google Scholar] [Retracted]
- 29.Bian H, Hakkarainen A, Lundbom N et al. Effects of dietary interventions on liver volume in humans. Obesity 2014; 22: 989–995 [DOI] [PubMed] [Google Scholar]
- 30.Hopp K, Hommerding CJ, Wang X et al. Tolvaptan plus pasireotide shows enhanced efficacy in a PKD1 model. J Am Soc Nephrol 2015; 26: 39–47 [DOI] [PMC free article] [PubMed] [Google Scholar]
Associated Data
This section collects any data citations, data availability statements, or supplementary materials included in this article.