

Abstract
The association between obesity and multiple myeloma (MM) risk may be partly attributed to reduced circulating levels of adiponectin in obese individuals. To prospectively evaluate MM risk in relation to adiponectin levels overall and stratified by body mass index and other characteristics, we conducted a pooled investigation of pre-diagnosed peripheral blood samples from 624 MM cases and 1,246 individually matched controls from seven cohorts participating in the MM Cohort Consortium. Analysis of circulating analyte levels measured by enzyme-linked immunosorbent assays revealed that higher total adiponectin levels were associated with reduced MM risk overall (highest quartile vs. lowest: odds ratio [OR]=0.64, 95% confidence interval [CI]=0.47-0.85; Ptrend = 0.001). This association was apparent among cases diagnosed six or more years after blood collection (OR=0.60, CI=0.40-0.90; Ptrend = 0.004) and was similar in magnitude for men and women (OR=0.59 and 0.66, respectively). Interestingly, we observed strong associations among subjects who were overweight (OR=0.41, CI=0.26-0.65) or obese (OR=0.41, CI=0.17-0.98) but not among those with normal weight (OR=1.20, CI=0.73-2.00; overweight/obese vs. normal weight, Pinteraction = 0.04). Our findings provide the strongest epidemiologic evidence to date that adiponectin protects against MM development, particularly among overweight and obese individuals, and offer a method for risk assessment in this susceptible population of heavier patients.
Introduction
An estimated 26,850 cases of multiple myeloma (MM), a plasma cell malignancy, were diagnosed in the United States in 2015 (1). Currently, there is no established curative treatment for MM, and although clinical outcomes have improved in recent years it remains a highly fatal malignancy, with an estimated 5-year relative survival of 47% in the United States (1). MM is consistently preceded by monoclonal gammopathy of undetermined significance (MGUS), a premalignant plasma cell disorder characterized by the presence of a monoclonal protein in serum and/or urine in the absence of evidence of smoldering or overt MM. The etiology of MM remains poorly understood; established risk factors include older age, male sex, African ancestry, family history of lymphoid malignancies, and severe immune dysregulation (2, 3). Obesity has also been consistently associated with an increased risk of MM (4-6). Decreased circulating levels of adiponectin, a polypeptide hormone with important anti-proliferative, anti-inflammatory and insulin-sensitizing properties (7), have been proposed as a potential mechanism through which obesity contributes to myelomagenesis. Although adiponectin is secreted mainly by visceral adipose tissue, it is well established that, paradoxically, circulating levels are lower among obese individuals compared to those with normal body weight (8). This hormone activates adiponectin receptors, which are expressed by many normal cell types and cancers including myeloma cells (9). Adiponectin receptor activation results in activation of AMP kinase, which in turns regulates cellular energy metabolism in a manner that involves inhibition of mTOR and downregulation of oxidative phosphorylation (9-12).
In a recent prospective investigation of 174 cases and 348 controls in the Prostate, Lung, Colorectal and Ovarian (PLCO) Cancer Screening Trial, we observed a statistically significant reduced risk of MM among participants with higher circulating levels of total adiponectin (13). The study’s small sample size limited the interpretation of this finding, and precluded more detailed analyses across population subgroups of body mass index (BMI) categories. However, it is intriguing that the results are consistent with recent experimental evidence from studies conducted in vitro and in animal models that adiponectin induces myeloma cell apoptosis (9, 14). Few other obesity- or immune-related biomarkers have been associated with risk of MM in prospective studies, although there is some evidence to suggest that pre-diagnosis levels of IGF binding protein-1 and soluble IL-6 receptor are elevated in the years immediately preceding MM diagnosis (15).
To better understand the relationship between circulating adiponectin and MM risk, both overall and across normal weight, overweight and obese individuals, we conducted a pooled investigation involving 624 cases and 1,246 controls within the MM Cohort Consortium (MMCC).
Materials and Methods
Study population
We selected 627 MM cases and 1,247 individually-matched controls from seven cohorts participating in the MMCC: the Alpha-Tocopherol, Beta-Carotene Cancer Prevention Study (ATBC; 59 cases, 118 controls); the Cancer Prevention Study II (CPS-II; 68 cases, 136 controls); the Health Professionals Follow-up Study (HPFS; 28 cases, 55 controls); the Melbourne Collaborative Cohort Study (MCCS; 53 cases, 106 controls); the Nurses’ Health Study (NHS; 48 cases, 90 controls); the PLCO Cancer Screening Trial (174 cases, 348 controls); and the Women’s Health Initiative (WHI; 197 cases, 394 controls). The majority of subjects (453 cases, 899 controls) were selected from cohorts other than PLCO and are hereafter described as the replication set; the pooled data from all cohorts including PLCO is defined as the combined set. The design and methods of the participating cohorts have been described (16-22). Most (71%) of the selected subjects were included in a previous investigation in the MMCC (15). As in the previous study, we selected cases with archived pre-diagnosis blood samples who had a confirmed incident primary diagnosis of MM (ICDA=203; ICD-O-2-M=9731, 9732, 9830; or ICD-O-3-M=9731-9734). We restricted cases to those diagnosed at least 3 months after the date of phlebotomy, and excluded cases with a history of cancer (other than non-melanoma skin cancer) prior to the MM diagnosis. Controls were also cancer-free as of the corresponding case diagnosis date, and were individually matched to cases with a 2:1 ratio with the exception of a small number of cases (N=7) matched 1:1 to controls. The matching criteria included cohort of origin, birth year (±12 months), sex, race (white, black, Asian, other), type of blood sample (serum, plasma-heparin, plasma-EDTA), date of blood collection (±2 months), and (when available) fasting status at blood draw (<8, ≥8 hours since last meal). Among the selected subjects, one case and one control had insufficient sample volume for analysis, and two additional cases were later adjudicated as not having MM. After excluding these subjects, there remained 450 cases and 898 controls in the replication set and 624 cases and 1,246 controls in the combined set. All of the participating cohorts received Institutional Review Board approval from their respective institutions.
Analyte measurements
Circulating levels of total and high-molecular-weight (HMW) adiponectin were measured among selected subjects from all of the participating cohorts. These analytes were measured in duplicate using standard enzyme-linked immunosorbent assay (ELISA) methods; assays were performed in the laboratory of M.N.P. at McGill University (www.mcgill.ca/assaylab) using reagents purchased from R&D Systems, Inc. (Minneapolis, MN). The lower limits of detection were 3.9 ng/mL for both total and HMW adiponectin. Samples from matched case-control sets were analyzed together in the same batch. Blinded quality control (QC) samples from the participating cohorts were included with the test samples from each cohort, and pooled QC specimens were added to each of the batches for all of the participating cohorts. Samples from a subset of controls (N=66) from the original study in PLCO were re-tested contemporaneously with those from the other cohorts; these assay results showed excellent agreement with the original measurements (spearman ρ = 0.96). For the study-specific QC results, the median (range) overall coefficients of variation (CVs) were 8.3% (4.5%-19.6%) for total adiponectin and 7.0% (2.9%-18.7%) for HMW adiponectin. The CVs for pooled QC specimens were 5.6% and 5.3% for total and HMW adiponectin, respectively; no evidence of laboratory drift across cohorts was observed for either analyte.
Statistical analysis
We evaluated determinants of natural log-transformed analyte concentrations among controls using multivariable linear regression models including cohort, age, sex, race, and BMI as independent variables. Differences in median analyte levels between cases and controls were assessed using the Wilcoxon rank-sum test. For our main analyses, we computed odds ratios (ORs) and 95% confidence intervals (CIs) using conditional logistic regression models, conditioning on the matched sets, to assess future risk of MM in relation to quartiles of analyte concentrations. Tests for trend were performed by assigning the value of the within-category median to each quartile. As in the previous study (15), we performed a “cohort adjustment” to the original analyte values to reduce the impact of cohort-related variability in analyte levels, and we further adjusted analyte levels for sex to correct for differences between men and women within and across studies; a description of these procedures is available in the Supplemental Methods. We also performed analyses using quartile cut points based on the overall (and sex-specific) distributions among pooled controls. Additional analyses included BMI (modeled categorically as <25, 25-29.9, and ≥30 kg/m2) as a covariate. To assess whether the relationships between adiponectin and MM risk differed across population subgroups, we stratified analyses by sex, time from blood collection to case diagnosis/control reference date (<6 years, ≥6 years), BMI category (<25, 25-29.9, and ≥30 kg/m2), and age at blood collection (<65 years, ≥65 years). We used conditional logistic regression models for analyses stratified by matching factors, and unconditional models adjusted for matching factors for analyses stratified by BMI category; tests of multiplicative interaction were based on the same models as those used for the stratified analyses and were performed using likelihood ratio tests comparing models with and without the interaction terms. We also estimated study-specific ORs and 95% CIs, and assessed OR heterogeneity across cohorts using Cochran’s Q test and the I2 statistic (23).
To evaluate a possible non-linear relation between adiponectin and MM risk, we modeled adiponectin levels using restricted cubic splines with 4 automatically placed knots (at the 5th, 32nd, 63rd, and 95th percentiles among controls) in unconditional logistic regression models adjusted for the matching factors (24). Models were fit both overall and within selected strata of BMI (<25, ≥25 kg/m2). For these analyses, we excluded 19 extreme high values (>3 standard deviations above the mean) and 1 implausibly low value. We repeated the analyses changing the number and placement of the knots to evaluate the robustness of our findings. We assessed non-linearity using likelihood ratio tests comparing the model with only the linear term for adiponectin with the models that included the linear term and the cubic spline terms.
Several sensitivity analyses were performed. We repeated the main analyses after excluding subjects with outlying analyte values (>3 standard deviations above the mean), and performed analyses restricted to non-Hispanic whites. For all analyses, findings were considered to be statistically significant if the two-sided P-value was < 0.05.
Results
Consistent with the matched design of this study, the distributions of sex, race, and age at phlebotomy were similar for the cases and controls (Table 1). Levels of total adiponectin among controls increased with age (medians of 9.3 and 12.0 μg/mL for 40-59 years and ≥70 years, respectively) and were lower for obese persons compared to those with normal body weight (medians of 8.8 and 12.7 μg/mL, respectively), for men compared with women (8.0 and 13.7 μg/mL), and for blacks compared with whites (7.2 and 11.0 μg/mL) (all P < 0.001; Supplementary Table S1).
Table 1.
Selected characteristics of cases and controls in the Multiple Myeloma Cohort Consortium*
| Characteristic | Cases | Controls |
|---|---|---|
| No. of persons | 624 (100) | 1,246 (100) |
| Cohort | ||
| Alpha-Tocopherol, Beta-Carotene Study (ATBC) | 59 (9.5) | 117 (9.4) |
| Cancer Prevention Study II (CPS-II) | 67 (10.7) | 136 (10.9) |
| Health Professionals Follow-up Study (HPFS) | 28 (4.5) | 55 (4.4) |
| Melbourne Collaborative Cohort Study (MCCS) | 52 (8.3) | 106 (8.5) |
| Nurses’ Health Study (NHS) | 48 (7.7) | 90 (7.2) |
| PLCO Cancer Screening Triala | 174 (27.9) | 348 (27.9) |
| Women’s Health Initiative (WHI) | 196 (31.4) | 394 (31.6) |
| Mean age at blood draw, years (SD) | 63.9 (7.0) | 63.9 (7.0) |
| Sex | ||
| Female | 355 (56.9) | 708 (56.8) |
| Male | 269 (43.1) | 538 (43.2) |
| Race | ||
| White | 568 (91.2) | 1,138 (91.4) |
| Black | 35 (5.6) | 68 (5.5) |
| Other | 20 (3.2) | 39 (3.1) |
| Mean BMI at blood draw, kg/m2 (SD) | 27.4 (5.0) | 27.2 (4.9) |
| Type of blood sample | ||
| EDTA plasma | 288 (46.2) | 579 (46.5) |
| Heparin plasma | 274 (43.9) | 544 (43.7) |
| Serum | 62 (9.9) | 123 (9.9) |
| Time from blood draw to diagnosis | ||
| < 6 years | 282 (45.2) | |
| ≥ 6 years | 342 (54.8) | |
| Median biomarker concentration (IQR)b | ||
| Total adiponectin, μg/mL | 11.5 (8.0-16.5)c | 12.8 (8.6-17.8) |
| High-molecular-weight (HMW) adiponectin, μg/mL | 6.6 (4.3-10.1)c | 7.4 (4.7-10.8) |
Reported as frequency (%) unless otherwise noted
Analyzed separately in a previous investigation (13)
Reported as cohort- and sex-corrected analyte levels. Differences between cases and controls were also observed for uncorrected total and HMW adiponectin levels (P ≤ 0.005).
P ≤ 0.002 for cases vs. controls, Wilcoxon rank-sum test
As shown in Table 1, cases had significantly lower analyte levels than controls for total adiponectin (medians of 11.5 and 12.8 μg/mL, respectively; P = 0.001, Wilcoxon rank-sum test) and HMW adiponectin (medians of 6.6 and 7.4 μg/mL; P = 0.002). Total and HMW adiponectin concentrations were almost perfectly correlated (Spearman ρ = 0.99 among controls). Thus, we focus on the results for total adiponectin and present the HMW adiponectin results in the online supplement. High total adiponectin levels were associated with a reduced risk of MM in both the independent replication (highest quartile vs. lowest: OR 0.68, 95% CI 0.48-0.96; Ptrend = 0.02) and combined sets (OR 0.64, 95% CI 0.47-0.85; Ptrend = 0.001; Table 2). These findings were unchanged when adjusted for BMI (OR 0.64, 95% CI 0.47-0.87; Ptrend = 0.001). In the restricted cubic spline regression analyses, the relation between total adiponectin and MM was similar to that observed in the categorical analyses (Supplementary Figure 1); an overall test for a linear relation was statistically significant (P = 0.0007) and we did not find evidence of a significant departure from linearity in this analysis (P for non-linearity = 0.4) or in the alternative spline models (data not shown).
Table 2.
Circulating levels of total adiponectin and risk of multiple myelomaa
| Quartileb
|
Ptrend | ||||
|---|---|---|---|---|---|
| Q1 | Q2 | Q3 | Q4 | ||
| Total adiponectin | |||||
| No. of cases | 183 | 178 | 139 | 124 | |
| No. of controls | 311 | 311 | 311 | 313 | |
| Base model | |||||
| Replication setc | 1.0 (ref) | 0.88 (0.64-1.21) | 0.74 (0.53-1.02) | 0.68 (0.48-0.96) | 0.020 |
| Combined setd | 1.0 (ref) | 0.95 (0.73-1.24) | 0.74 (0.56-0.97) | 0.64 (0.47-0.85) | 0.001 |
| Multivariate model including body mass index | 1.0 (ref) | 0.95 (0.72-1.24) | 0.73 (0.55-0.97) | 0.64 (0.47-0.87) | 0.001 |
Odds ratios (ORs) and 95% confidence intervals (CIs) were estimated using conditional logistic regression models.
Quartile cut points were defined based on the distribution of cohort- and sex-adjusted analyte levels among controls, as follows: Q1, ≤8.64 μg/mL; Q2, 8.65-12.79 μg/mL; Q3, 12.80-17.79 μg/mL; Q4, ≥17.80 μg/mL.
Excluding PLCO
Including PLCO
In logistic regression models stratified by BMI (Table 3), we observed a strong inverse association between adiponectin levels and MM risk among overweight or obese individuals (OR of 0.41 for the highest quartile vs. the lowest in both overweight and obese subjects, Ptrend ≤ 0.039), but found no evidence of an association among normal weight persons (Ptrend = 0.79; Pinteraction = 0.04). In the spline models stratified by BMI category (Figure 1), we observed a clear linear relation between adiponectin and MM risk among overweight and obese individuals (P for linearity = 0.0001) but not among normal weight individuals (P for linearity = 0.8). We did not find evidence of a significant departure from linearity in either group (P for non-linearity = 0.4 and 0.8 for overweight/obese and normal weight individuals, respectively).
Table 3.
Circulating levels of total adiponectin and risk of multiple myeloma (MM) in stratified analysesa
| Cases | Controls | Quartileb
|
Ptrend | Pintc | ||||
|---|---|---|---|---|---|---|---|---|
| Q1 | Q2 | Q3 | Q4 | |||||
| By sex | ||||||||
| Female | 355 | 708 | 1.0 (ref) | 0.85 (0.59-1.23) | 0.66 (0.45-0.96) | 0.66 (0.44-0.98) | 0.029 | |
| Male | 269 | 538 | 1.0 (ref) | 1.08 (0.73-1.61) | 0.85 (0.57-1.28) | 0.59 (0.38-0.93) | 0.011 | 0.526 |
| By time to MM diagnosis | ||||||||
| <6 years | 282 | 562 | 1.0 (ref) | 0.76 (0.51-1.14) | 0.58 (0.38-0.89) | 0.64 (0.42-0.99) | 0.039 | |
| ≥6 years | 342 | 678 | 1.0 (ref) | 1.13 (0.79-1.62) | 0.88 (0.61-1.27) | 0.62 (0.42-0.93) | 0.008 | 0.215 |
| By body mass index (BMI) at blood drawd | ||||||||
| <25 kg/m2 | 212 | 463 | 1.0 (ref) | 1.40 (0.82-2.38) | 0.85 (0.50-1.43) | 1.20 (0.73-2.00) | 0.785 | |
| 25-29.9 kg/m2 | 270 | 492 | 1.0 (ref) | 0.76 (0.51-1.13) | 0.70 (0.46-1.07) | 0.41 (0.26-0.65) | <0.001 | |
| ≥30 kg/m2 | 136 | 277 | 1.0 (ref) | 0.93 (0.56-1.55) | 0.73 (0.40-1.35) | 0.41 (0.17-0.98) | 0.039 | 0.041 |
| By age at blood drawe | ||||||||
| <65 years | 314 | 623 | 1.0 (ref) | 1.10 (0.77-1.58) | 0.88 (0.60-1.29) | 0.61 (0.39-0.95) | 0.020 | |
| ≥65 years | 310 | 617 | 1.0 (ref) | 0.80 (0.54-1.19) | 0.61 (0.41-0.91) | 0.61 (0.41-0.92) | 0.017 | 0.400 |
Based on conditional logistic regression models unless otherwise noted.
Quartile cut points were defined based on the distribution of cohort- and sex-adjusted total adiponectin levels among controls, as follows: Q1, ≤8.64 μg/mL; Q2, 8.65-12.79 μg/mL; Q3, 12.80-17.79 μg/mL; Q4, ≥17.80 μg/mL.
Tests of multiplicative interaction were based on the same models as those used for the stratified analyses and were performed using likelihood ratio tests comparing models with and without the interaction terms.
Based on unconditional logistic regression models adjusted for cohort, sex, age, race, and fasting status.
Strata were defined based on the age at blood draw for cases; matched sets were preserved.
Figure 1.
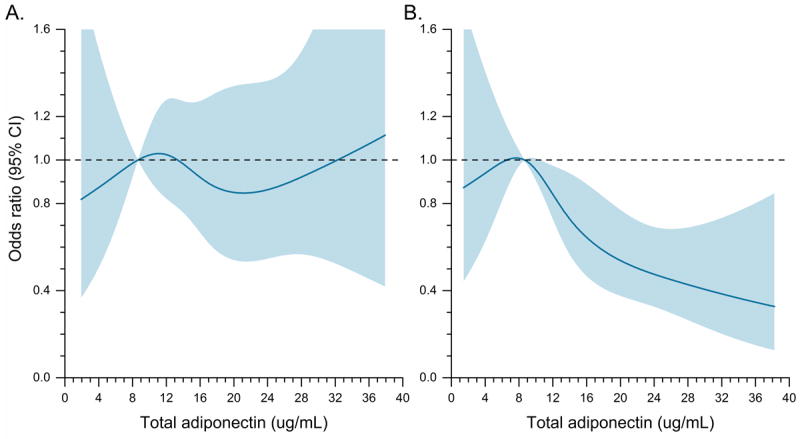
Risk of MM in relation to circulating total adiponectin levels estimated using restricted cubic spline regression models with 4 knots, among individuals with A) body mass index (BMI) <25 kg/m2 (P-linear = 0.8, P-nonlinearity = 0.8); and B) BMI ≥25 kg/m2 (P-linear = 0.0001, P-nonlinearity = 0.4). The odds ratio is represented by the solid line, and the 95% confidence interval (CI) is represented by the shaded area.
In other stratified analyses (Table 3) the risk estimates were not significantly different for men and women (ORs for highest quartile vs. lowest were 0.59 and 0.66 for men and women, respectively; Pinteraction = 0.5) or for those who were < 65 years or ≥65 years of age at blood collection (OR of 0.61 for both groups; Pinteraction = 0.4). Notably, the association between adiponectin and MM was present and similarly strong even in cases diagnosed 6 or more years after blood collection (OR 0.62, 95% CI 0.42-0.93; Ptrend = 0.008; <6 vs. ≥6 years, Pinteraction = 0.2). We found no evidence of heterogeneity across cohorts (total adiponectin levels above vs. below median: I2 = 0%, P = 0.8; Figure 2).
Figure 2.
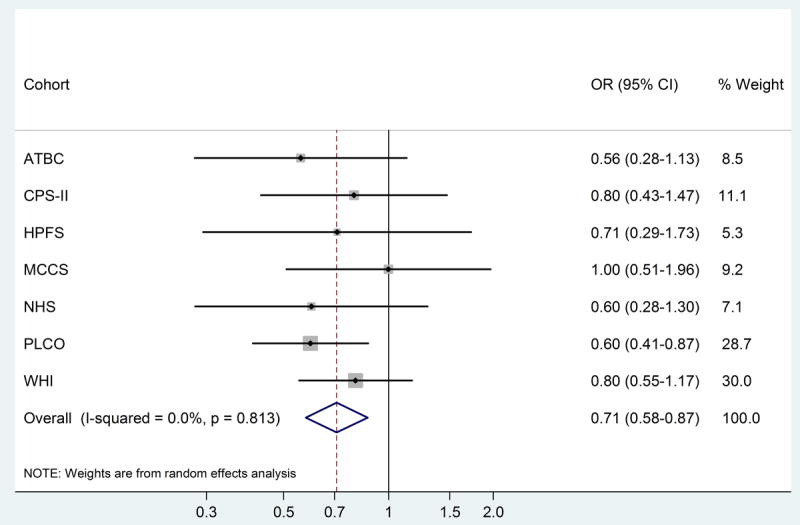
Cohort-specific and meta-analysis summary odds ratios (OR) and 95% confidence intervals (CI) for the relationship between circulating total adiponectin levels (above vs. below median) and risk of MM.
Our findings for total adiponectin were unchanged when outliers among analyte values were excluded (highest quartile vs. lowest: OR 0.63, 95% CI 0.47-0.85; Ptrend = 0.001), when quartile cut points were based on the overall distribution among pooled controls rather than the cohort- and sex-adjusted levels (OR 0.52; 95% CI 0.38-0.73; Ptrend < 0.001), and after restricting analyses to non-Hispanic white subjects (OR 0.67, 95% CI 0.50-0.92; Ptrend = 0.003). The results were also essentially the same for total and HMW adiponectin (Supplementary Table S2).
Discussion
This pooled investigation provides the strongest epidemiologic evidence to date that high pre-diagnosis circulating adiponectin levels may help to protect against development of MM, and suggests for the first time that this association may be particularly strong among overweight and obese individuals. We found that high adiponectin levels were associated with a statistically significantly reduced future risk of MM in this study involving MM cases and matched controls from seven cohorts. The consistency in the association between adiponectin and MM across cohorts, with inverse associations observed in all but one study, lends further support to our hypothesis. The association between adiponectin and MM remained when we restricted to cases diagnosed six or more years after blood collection, suggesting that altered adiponectin levels may play a role in the etiology of MM rather than resulting from pre-clinical disease.
Notably, our findings for adiponectin are consistent with recent experimental evidence that this hormone induces myeloma cell apoptosis (9, 14). Several proposed biological mechanisms might explain in part the observed inverse association between adiponectin and risk of MM, such as activation of AMP kinase, and suppression of lipogenesis through protein kinase A activation and downregulated expression of acetyl-CoA-carboxylase (9). Alternately, it is well-established that adipose tissue is metabolically active and that excess adiposity can produce a chronic inflammatory state (25). Adiponectin may in turn prevent MM development by suppressing pro-inflammatory cytokines such as IL-6 and/or inducing anti-inflammatory cytokines such as IL-10 and IL-1RA (26-28). A novel finding from this study is that the inverse association between adiponectin and MM was only apparent among overweight and obese individuals. This pattern suggests that adiponectin may reduce MM risk by suppressing other protumorigenic effects of obesity.
Our findings may be relevant to the prevention and management of MM and its precursor MGUS. Currently, obesity is the only established potentially modifiable risk factor for MM (6); recent findings suggest that central obesity, in addition to excess body weight overall, may be associated with MM risk (5). Efforts to control obesity may reduce the incidence of MM, possibly by modulating circulating adiponectin levels. Given that circulating levels of adiponectin are strongly negatively correlated with the amount of visceral adipose tissue (25), reducing central obesity may be particularly important. Furthermore, adiponectin receptor agonists are being studied as drug candidates for metabolic diseases (29); our data support the possibility that they may be useful in MM prevention or treatment.
We also note that, in secondary analyses among controls, adiponectin levels were considerably lower among blacks compared with whites even after adjustment for BMI, consistent with previous reports (30, 31). One prior investigation found that among women with comparable levels of visceral adiposity, circulating levels of adiponectin were lower among African Americans compared with whites (32). The well-documented greater than two-fold excess incidence of MM in black men and women persists in the US (33) and remains unexplained. The present findings suggest that differences by race in circulating adiponectin levels may play a role. Studies in more racially diverse populations are warranted to investigate the association between adiponectin and MM among blacks, and whether differences in adiponectin levels contribute to racial disparities in this malignancy.
This investigation has several strengths. With 624 MM cases and 1,246 controls, it is the largest study to evaluate the relationship between pre-diagnosis circulating adiponectin and MM, and the first to evaluate this association separately within strata of BMI. Other strengths include the prospective design and the availability of high quality covariate data that were harmonized across cohorts. Limitations of the study include a relatively small number of subjects in some strata (e.g., blacks) and the lack of information on MGUS status at the time of phlebotomy. Priorities for future studies include assessment of whether differences by race and sex in adiponectin levels contribute to disparities in MM incidence, characterization of the role of this metabolic hormone in progression from MGUS to clinically manifest disease, and evaluation of the clinical implications of our findings for risk reduction and therapy among MM patients and overweight/obese patients in particular.
Supplementary Material
Acknowledgments
This work was supported by the Intramural Research Program of the National Institutes of Health, National Cancer Institute; by NIH grants K07 CA115687, RO1 CA 127435, R01 CA149445, UM1 CA186107, P01 CA87969, R01 CA49449, and UM1 CA167552; and by the American Cancer Society grant RSG-11-020-01-CNE (to B.M.B.). Dr. Pollak’s laboratory is funded in part by a grant from the Terry Fox Foundation, Vancouver, Canada. The American Cancer Society funds the creation, maintenance, and updating of the Cancer Prevention Study-II cohort. The WHI program is funded by the National Heart, Lung, and Blood Institute, National Institutes of Health, U.S. Department of Health and Human Services through contracts HHSN268201100046C, HHSN268201100001C, HHSN268201100002C, HHSN268201100003C, HHSN268201100004C, and HHSN271201100004C. The NCI funded the PLCO Cancer Screening Trial, which was also supported by contracts from the Division of Cancer Prevention of the NCI and by the Intramural Research Program of the Division of Cancer Epidemiology and Genetics, NCI, NIH, DHHS. The authors thank the WHI investigators and staff for their dedication, and the study participants for making the program possible. A full listing of WHI investigators can be found at http://www.whi.org/researchers/Documents%20%20Write%20a%20Paper/WHI%20Investigator%20Short%20List.pdf. We would also like to thank the participants and staff of the Nurses’ Health Study and Health Professionals Follow-up Study for their valuable contributions as well as the following state cancer registries for their help: AL, AZ, AR, CA, CO, CT, DE, FL, GA, ID, IL, IN, IA, KY, LA, ME, MD, MA, MI, NE, NH, NJ, NY, NC, ND, OH, OK, OR, PA, RI, SC, TN, TX, VA, WA, WY. The authors thank the PLCO Cancer Screening Trial screening center investigators, the staff of Information Management Services, Inc. and Westat, Inc., and, most importantly, the study participants for their contributions that made this study possible. We thank David Check of the Division of Cancer Epidemiology and Genetics, National Cancer Institute, for assistance with the graphical presentation of the figures. The authors assume full responsibility for analyses and interpretation of these data.
Footnotes
Conflicts of interest: None declared
References
- 1.ACS. Cancer Facts & Figures 2015. Atlanta, GA: American Cancer Society; 2015. [Google Scholar]
- 2.Baris D, Brown LM, Andreotti G, Devesa SS. Epidemiology of Multiple Myeloma. In: Wiernik PH, Goldman JM, Dutcher JP, Kyle RA, editors. Neoplastic Diseases of the Blood. Fifth Edition. New York: Springer; 2013. pp. 547–563. [Google Scholar]
- 3.De Roos AJ, Baris D, Weiss NS, Herrinton LJ. Multiple Myeloma. In: Schottenfeld D, Fraumeni JF, editors. Cancer Epidemiology and Prevention. Third Edition. New York: Oxford University Press; 2006. pp. 919–945. [Google Scholar]
- 4.Hofmann JN, Moore SC, Lim U, et al. Body mass index and physical activity at different ages and risk of multiple myeloma in the NIH-AARP diet and health study. Am J Epidemiol. 2013;177(8):776–786. doi: 10.1093/aje/kws295. [DOI] [PMC free article] [PubMed] [Google Scholar]
- 5.Teras LR, Kitahara CM, Birmann BM, et al. Body size and multiple myeloma mortality: a pooled analysis of 20 prospective studies. Br J Haematol. 2014;166(5):667–676. doi: 10.1111/bjh.12935. [DOI] [PMC free article] [PubMed] [Google Scholar]
- 6.Wallin A, Larsson SC. Body mass index and risk of multiple myeloma: a meta-analysis of prospective studies. Eur J Cancer. 2011;47(11):1606–1615. doi: 10.1016/j.ejca.2011.01.020. [DOI] [PubMed] [Google Scholar]
- 7.Roberts DL, Dive C, Renehan AG. Biological mechanisms linking obesity and cancer risk: new perspectives. Annu Rev Med. 2010;61:301–316. doi: 10.1146/annurev.med.080708.082713. [DOI] [PubMed] [Google Scholar]
- 8.Greenberg AS, Obin MS. Obesity and the role of adipose tissue in inflammation and metabolism. Am J Clin Nutr. 2006;83(2):461S–465S. doi: 10.1093/ajcn/83.2.461S. [DOI] [PubMed] [Google Scholar]
- 9.Medina EA, Oberheu K, Polusani SR, et al. PKA/AMPK signaling in relation to adiponectin’s antiproliferative effect on multiple myeloma cells. Leukemia. 2014;28(10):2080–2089. doi: 10.1038/leu.2014.112. [DOI] [PubMed] [Google Scholar]
- 10.Morita M, Gravel SP, Chenard V, et al. mTORC1 controls mitochondrial activity and biogenesis through 4E-BP-dependent translational regulation. Cell Metabolism. 2013;18(5):698–711. doi: 10.1016/j.cmet.2013.10.001. [DOI] [PubMed] [Google Scholar]
- 11.Tanabe H, Fujii Y, Okada-Iwabu M, et al. Crystal structures of the human adiponectin receptors. Nature. 2015;520(7547):312–316. doi: 10.1038/nature14301. [DOI] [PMC free article] [PubMed] [Google Scholar]
- 12.Zakikhani M, Dowling RJ, Sonenberg N, et al. The effects of adiponectin and metformin on prostate and colon neoplasia involve activation of AMP-activated protein kinase. Cancer Prev Res (Phila) 2008;1(5):369–375. doi: 10.1158/1940-6207.CAPR-08-0081. [DOI] [PubMed] [Google Scholar]
- 13.Hofmann JN, Liao LM, Pollak MN, et al. A prospective study of circulating adipokine levels and risk of multiple myeloma. Blood. 2012;120(22):4418–4420. doi: 10.1182/blood-2012-06-438606. [DOI] [PMC free article] [PubMed] [Google Scholar]
- 14.Fowler JA, Lwin ST, Drake MT, et al. Host-derived adiponectin is tumor-suppressive and a novel therapeutic target for multiple myeloma and the associated bone disease. Blood. 2011;118(22):5872–5882. doi: 10.1182/blood-2011-01-330407. [DOI] [PMC free article] [PubMed] [Google Scholar]
- 15.Birmann BM, Neuhouser ML, Rosner B, et al. Prediagnosis biomarkers of insulin-like growth factor-1, insulin, and interleukin-6 dysregulation and multiple myeloma risk in the Multiple Myeloma Cohort Consortium. Blood. 2012;120(25):4929–4937. doi: 10.1182/blood-2012-03-417253. [DOI] [PMC free article] [PubMed] [Google Scholar]
- 16.The alpha-tocopherol, beta-carotene lung cancer prevention study: design, methods, participant characteristics, and compliance. The ATBC Cancer Prevention Study Group. Ann Epidemiol. 1994;4(1):1–10. doi: 10.1016/1047-2797(94)90036-1. [DOI] [PubMed] [Google Scholar]
- 17.Design of the Women’s Health Initiative clinical trial and observational study. The Women’s Health Initiative Study Group. Control Clin Trials. 1998;19(1):61–109. doi: 10.1016/s0197-2456(97)00078-0. [DOI] [PubMed] [Google Scholar]
- 18.Calle EE, Rodriguez C, Jacobs EJ, et al. The American Cancer Society Cancer Prevention Study II Nutrition Cohort: rationale, study design, and baseline characteristics. Cancer. 2002;94(9):2490–2501. doi: 10.1002/cncr.101970. [DOI] [PubMed] [Google Scholar]
- 19.Colditz GA, Hankinson SE. The Nurses’ Health Study: lifestyle and health among women. Nat Rev Cancer. 2005;5(5):388–396. doi: 10.1038/nrc1608. [DOI] [PubMed] [Google Scholar]
- 20.Giles GG, English DR. The Melbourne Collaborative Cohort Study. IARC Sci Publ. 2002;156:69–70. [PubMed] [Google Scholar]
- 21.Hayes RB, Reding D, Kopp W, et al. Etiologic and early marker studies in the prostate, lung, colorectal and ovarian (PLCO) cancer screening trial. Control Clin Trials. 2000;21(6 Suppl):349S–355S. doi: 10.1016/s0197-2456(00)00101-x. [DOI] [PubMed] [Google Scholar]
- 22.Rimm EB, Giovannucci EL, Willett WC, et al. Prospective study of alcohol consumption and risk of coronary disease in men. Lancet. 1991;338(8765):464–468. doi: 10.1016/0140-6736(91)90542-w. [DOI] [PubMed] [Google Scholar]
- 23.Higgins JP, Thompson SG, Deeks JJ, et al. Measuring inconsistency in meta-analyses. BMJ. 2003;327(7414):557–560. doi: 10.1136/bmj.327.7414.557. [DOI] [PMC free article] [PubMed] [Google Scholar]
- 24.Durrleman S, Simon R. Flexible regression models with cubic splines. Stat Med. 1989;8(5):551–561. doi: 10.1002/sim.4780080504. [DOI] [PubMed] [Google Scholar]
- 25.Tilg H, Moschen AR. Adipocytokines: mediators linking adipose tissue, inflammation and immunity. Nat Rev Immunol. 2006;6(10):772–783. doi: 10.1038/nri1937. [DOI] [PubMed] [Google Scholar]
- 26.Ajuwon KM, Spurlock ME. Adiponectin inhibits LPS-induced NF-kappaB activation and IL-6 production and increases PPARgamma2 expression in adipocytes. American Journal of Physiology Regulatory, Integrative and Comparative Physiology. 2005;288(5):R1220–1225. doi: 10.1152/ajpregu.00397.2004. [DOI] [PubMed] [Google Scholar]
- 27.Klein B, Tarte K, Jourdan M, et al. Survival and proliferation factors of normal and malignant plasma cells. Int J Hematol. 2003;78(2):106–113. doi: 10.1007/BF02983377. [DOI] [PMC free article] [PubMed] [Google Scholar]
- 28.Wolf AM, Wolf D, Rumpold H, et al. Adiponectin induces the anti-inflammatory cytokines IL-10 and IL-1RA in human leukocytes. Biochem Biophys Res Commun. 2004;323(2):630–635. doi: 10.1016/j.bbrc.2004.08.145. [DOI] [PubMed] [Google Scholar]
- 29.Okada-Iwabu M, Yamauchi T, Iwabu M, et al. A small-molecule AdipoR agonist for type 2 diabetes and short life in obesity. Nature. 2013;503(7477):493–499. doi: 10.1038/nature12656. [DOI] [PubMed] [Google Scholar]
- 30.Cohen SS, Gammon MD, Signorello LB, et al. Serum adiponectin in relation to body mass index and other correlates in black and white women. Ann Epidemiol. 2011;21(2):86–94. doi: 10.1016/j.annepidem.2010.10.011. [DOI] [PMC free article] [PubMed] [Google Scholar]
- 31.Liao LM, Schwartz K, Pollak M, et al. Serum leptin and adiponectin levels and risk of renal cell carcinoma. Obesity (Silver Spring) 2013;21(7):1478–1485. doi: 10.1002/oby.20138. [DOI] [PMC free article] [PubMed] [Google Scholar]
- 32.Lara-Castro C, Doud EC, Tapia PC, et al. Adiponectin multimers and metabolic syndrome traits: relative adiponectin resistance in African Americans. Obesity (Silver Spring) 2008;16(12):2616–2623. doi: 10.1038/oby.2008.411. [DOI] [PMC free article] [PubMed] [Google Scholar]
- 33.Howlader N, Noone A, Kraphcho M, et al. SEER Cancer Statistics Review, 1975-2012. Bethesda, MD: National Cancer Institute; Apr, 2015. http://seer.cancer.gov/csr/1975_2012/, based on November 2014 SEER data submission, posted to the SEER web site. [Google Scholar]
Associated Data
This section collects any data citations, data availability statements, or supplementary materials included in this article.