

Abstract
Astrocytes play critical roles in neuronal activity and inhibition of regeneration. Here we show that the cleaved p75 neurotrophin receptor (p75NTR) is a component of the nuclear pore complex (NPC) required for glial scar formation and reduced gamma oscillations in mice via regulation of TGF-β signaling. The cleaved p75NTR interacts with nucleoporins to promote Smad2 nucleocytoplasmic shuttling. Thus, NPC remodeling by regulated intramembrane cleavage of p75NTR controls astrocyte-neuronal communication in response to profibrotic factors.
A major growth factor promoting the transition of quiescent to reactive astrocytes is TGF-β, which is implicated in neuronal functions and neurodegeneration1. However, the mechanisms that control astrocyte responses to TGF-β and their contribution to astrocyte-neuronal communication remain elusive. After brain injury, p75NTR is up-regulated in astrocytes2,3. To investigate the role of p75NTR in astrocytes, we crossed p75NTR−/− mice with GFAP-TGF-β mice, which spontaneously develop hydrocephaly and neuronal dysfunction4. Remarkably, loss of p75NTR prevented astrocyte activation and rescued the hydrocephaly in GFAP-TGF-β mice (Fig. 1a, b and Supplementary Fig. 1a, b). p75NTR was expressed in astrocytes and its deletion did not affect TGF-β levels in GFAP-TGF-β mice (Supplementary Fig. 1c, d). Astrocytes contribute to gamma oscillations5, which control learning, memory, and attention6. TGF-β-induced astrocyte activation decreased gamma oscillations and altered locomotor activity that were rescued upon genetic depletion of p75NTR (Fig. 1c, d). In accordance, loss of p75NTR in brain trauma reduced astrocyte activation and deposition of neurocan, a component of the glial scar that inhibits neural regeneration7,8 (Supplementary Fig. 2). TGF-β treatment in p75NTR−/−, but not in WT primary astrocytes failed to stimulate protein secretion and gene expression of neurocan (Supplementary Fig. 3a). Indeed, treatment of cortical neurons with conditioned medium (CM) from TGF-β-treated p75NTR−/− astrocytes did not inhibit neurite outgrowth, when compared to WT CM (Supplementary Fig. 3b). Neurocan expression in TGF-β-treated WT cells was unaffected by neutralization of neurotrophins or inhibition of Trk signaling (Supplementary Fig. 3c). Loss of p75NTR also reduced TGF-β-induced expression of GAT1 and S100b (Supplementary Fig. 3d), which regulate astrocyte-neuronal crosstalk9. These data reveal an unanticipated role for p75NTR in regulating astrocyte activation and neuronal activity in response to TGF-β.
Figure 1.
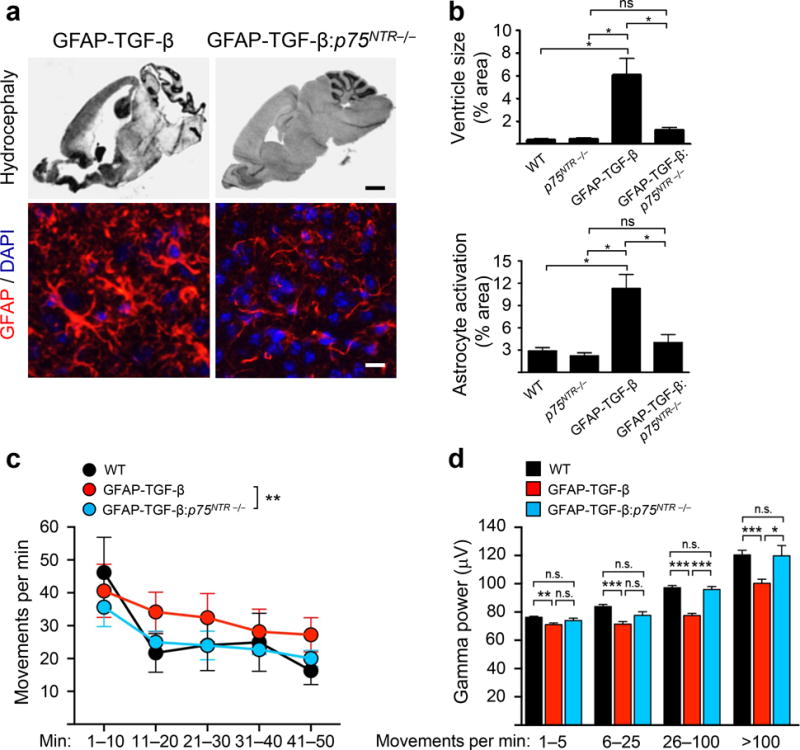
p75NTR deficiency rescues TGF-β-induced hydrocephalus, astrocyte activation and neuronal dysfunction. (a) Hematoxylin and eosin stain and GFAP immunostaining (red) of representative brain sections of 4-week old WT, p75NTR−/−, GFAP-TGF-β, and GFAP-TGF-β: p75NTR−/− mice. Nuclei are stained with 4′,6′-diamidino-2-phenylindole (DAPI) (blue). Representative images are shown from n = 4 mice. (b) Quantification of ventricle size and GFAP intensity (n = 4 mice per group). Values are mean ± SEM. Ventricle size (top), *P = 4.995 × 10⁻⁶; GFAP intensity (bottom), *P = 2.452 × 10⁻⁶ and ns, not significant, by one-way ANOVA. Scale bar, 750 μm (upper) and 15 μm (lower). (c) Locomotor activity in the open field during the 50 min of EEG recordings. p75NTR deficiency normalized locomotor activity in GFAP-TGF-β mice (n = 6–8 mice per group). ** P = 0.003 by repeated-measures ANOVA and Bonferroni post-hoc multiple comparisons test. (d) Gamma oscillatory power (30–80Hz) during different locomotor activity intervals in an open field from (c). GFAP-TGF-β, but not GFAP-TGF-β:p75NTR−/−, mice had impaired activity-dependent inductions of gamma oscillatory activity (n = 6–8 mice per group). *P < 0.05, ** P < 0.01, *** P < 0.001 by one-way ANOVA and Bonferroni post-hoc multiple comparisons test; 1–5 movements/min, P = 0.009; 6–25 movements/min, P = 9.568 × 10⁻⁵; 26-100 movements/min, P = 4.793 × 10⁻¹⁷; >100 movements/min, P = 0.0002.
TGF-β signals by nuclear accumulation of phosphorylated Smad (P-Smad) transcriptional regulators10. p75NTR−/− astrocytes had reduced nuclear, but not cytosolic TGF-β-dependent accumulation of P-Smad2 compared to WT (Fig. 2a, Supplementary Fig. 4). p75NTR undergoes regulated intramembrane cleavage by γ-secretase resulting in the liberation of the p75 intracellular domain (p75ICD)11. Nuclear P-Smad2 and neurocan expression were reduced in WT astrocytes treated with γ-secretase inhibitors (Fig. 2b, Supplementary Fig. 5a). In p75NTR−/− astrocytes, transient transfection of p75-FasTM, a p75NTR mutant resistant to γ-secretase cleavage12, increased P-Smad2 nuclear accumulation by 2.8 fold upon TGF-β treatment compared to 4.7 and 7.7 fold increase induced by full-length p75NTR (p75FL) or p75ICD respectively (Supplementary Fig. 5b). Nuclear accumulation of Stat-1 was not affected (Supplementary Fig. 5c). These results suggest that γ-secretase cleavage of p75NTR and its proteolytic product p75ICD regulate P-Smad2 nuclear accumulation in astrocytes.
Figure 2.
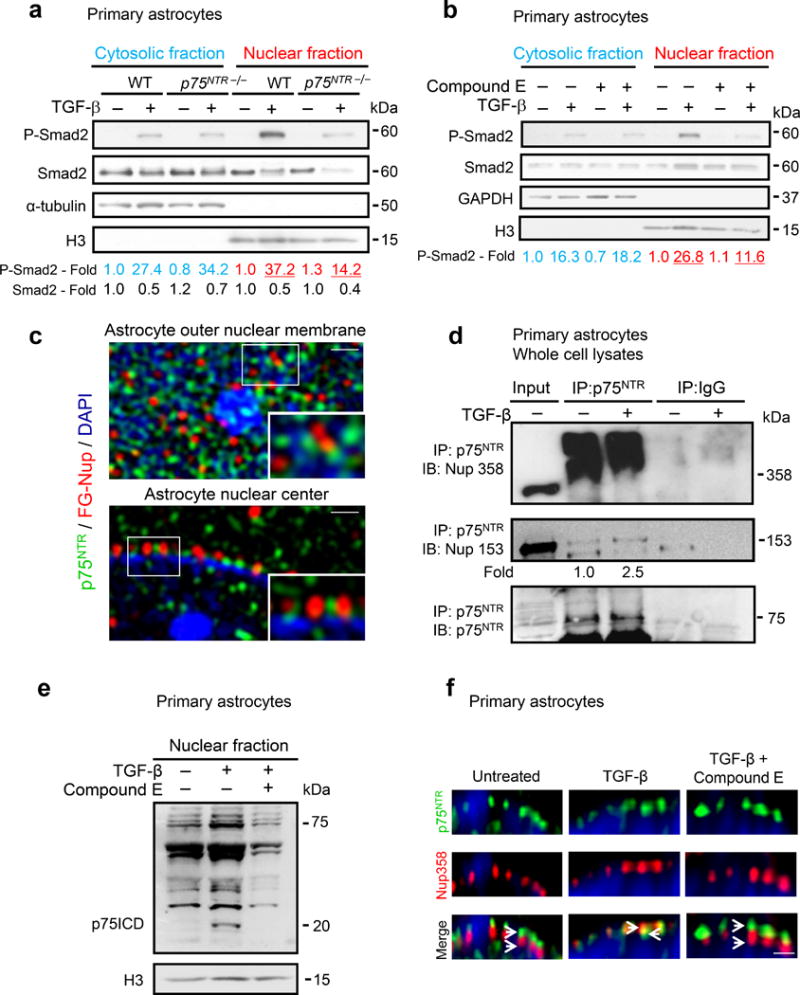
p75NTR is a component of the NPC regulating TGF-β-induced P-Smad2 nuclear translocation. (a) P-Smad2 in the cytosolic and nuclear fractions of WT and p75NTR−/− astrocytes. Representative immunoblots from three independent experiments are shown. (b) P-Smad2 in cytosol and nuclear fractions of TGF-β-treated astrocytes in the presence of the γ-secretase inhibitor compound E. Representative immunoblots from three independent experiments are shown. (c) 3D-SIM of WT astrocytes stained for p75NTR (green) and FG-Nup (red) shows abundant p75NTR staining at the nuclear surface (top) and sparse p75NTR staining in the nuclear center (bottom). Enlargement of regions indicated by a rectangle show p75NTR adjacent to FG-Nup proteins at the nuclear surface (top inset) and the nuclear center (bottom inset). Scale bars: 250 nm, top and bottom panel and 100 nm, insets. Nuclei are stained with DAPI (blue). Representative images from three independent experiments are shown. (d) Endogenous co-immunoprecipitation of p75NTR with individual FG-Nup proteins in whole cell lysates. Representative immunoblots are shown from two independent experiments. (e) Nuclear fraction of WT astrocytes treated with TGF-β for 1 h, or after 4 h pre-treatment with γ-secretase inhibitor compound E. Blots were developed with anti-p75NTR and H3 antibodies. Representative immunoblots from three independent experiments are shown. (f) 3D-STED of WT astrocytes stained for p75NTR (green) and FG-Nup358 (red). TGF-β-induced relocalization of p75NTR signal within the NPC is blocked by Compound E. Scale bar: 100 nm. Nuclei are stained with DRAQ5 (blue). Representative images are shown from two independent experiments. Full-length blots are shown in Supplemental Figure 15.
Smad nuclear translocation depends on direct binding to FG-repeat containing nucleoporins (FG-Nups) that triggers the opening of the nuclear pore13. Since stabilization of the natively unfolded FG domains by binding of nuclear co-factors is necessary for opening of the pore13, we examined whether p75NTR regulates nuclear import by interacting with FG-Nup complexes. In astrocytes p75NTR showed perinuclear localization and co-localized with FG-Nups, while in neurons p75NTR localized primarily in the cytoplasm and plasma membrane as expected (Supplementary Fig. 6a, b). The distinct ring-like perinuclear localization was specific for the p75ICD and p75NTR antibody absorption with recombinant p75ICD abolished the staining (Supplementary Fig. 6c–e). Super-resolution imaging of p75NTR and FG-Nups in astrocytes by three-dimensional structured illumination microscopy (3D-SIM), identified p75NTR at the nuclear outer membrane adjacent to FG-Nups and inside the nucleus (Fig. 2c, Supplementary Fig. 7, Supplementary Movie 1). In astrocytes, p75NTR interacted with FG-Nups localized throughout the NPC14 including the cytoplasmic filament Nup358, the inner center Nup62, and the nuclear basket Nup153 (Fig. 2d, Supplementary Fig. 8a, b). In situ proximity ligation assay (PLA), which allows sensitive single molecule detection of protein interactions, showed that TGF-β increased the interaction of both Smad2 and p75ICD with Nup153 and Nup358 (Supplementary Fig. 8c). Scanning peptide array analysis and deletion mutagenesis identified that the Nup153 FG region and the death domain (DD) of the p75ICD are required for the interaction (Supplementary Fig. 9a–c). Transfection of p75-Δ83 in p75NTR−/− astrocytes increase P-Smad2 nuclear accumulation upon TGF-β treatment by only 2.2 fold compared to 4.7 and 7.7 fold increase induced by p75FL or p75ICD respectively (Supplementary Fig. 5b), suggesting that the p75DD, which is required for interaction with the FG domain, also regulates the nuclear transport of P-Smad2. These results suggest that, in astrocytes, p75NTR binds to the FG repeat-containing Nups in order to facilitate Smad2 translocation into the nucleus.
We further investigated how TGF-β regulates NPC remodeling in astrocytes. TGF-β induced γ-secretase cleavage of p75NTR (Fig. 2e). In WT astrocytes, TGF-β induced interaction of Nup153 with p75ICD specifically in the nuclear fraction, while full-length p75NTR was detected only in the cytosolic fraction (Supplementary Fig. 10). TGF-β induced redistribution of the p75ICD within the NPC, as assessed by increased co-localization of p75ICD with Nup358 that was prevented by inhibition of γ-secretase (Fig. 2f). In accordance, TGF-β treatment of p75FL-transfected astrocytes or p75FL-transfected p75NTR−/− fibroblasts induced γ-secretase-dependent p75ICD formation (Supplementary Fig. 11a, b). TGF-β induced rapid phosphorylation of presenilin-1 (Supplementary Fig. 11c), suggesting that TGF-β activates a key component of the γ-secretase complex localized at the nuclear envelope15.
To detect spatiotemoral dynamics of p75NTR intramembrane cleavage, we generated a Cherry-p75NTR-EGFP reporter, which can differentiate between uncleaved p75FL (yellow) and cleaved p75NTR (green) (Fig. 3a). Cherry-p75NTR-EGFP transfected untreated astrocytes, but not fibroblasts, showed primarily green signal (Fig. 3b, Supplementary Fig. 12). Inhibition of α-secretase, but not γ-secretase increased yellow signal, suggesting that in unstimulated astrocytes the p75NTR reporter was cleaved by α-secretase (Fig. 3b, Supplementary Fig. 12a). Time-lapse imaging in astrocytes transfected with the cherry-p75NTR-EGFP reporter showed that TGF-β induced the release and translocation of cleaved p75NTR reporter into the nucleus (Fig. 3b, c and Supplementary Movie 2). Similarly, TGF-β increased the release of endogenous p75ICD into the nucleus by ~2.75 fold (P = 0.016) (Fig. 3d). In accordance with the biochemical data for endogenous p75NTR (Fig. 2e), inhibition of γ-secretase abolished the TGF-β-induced accumulation of cleaved p75NTR into the nucleus, suggesting that TGF-β induced the release and nuclear accumulation of the p75ICD (Fig. 3b, c and Supplementary Movie 2). Inhibition of p75NTR cleavage by long treatment of α- or γ-secretase inhibitors prevented the nuclear localization of p75ICD (Supplementary Fig. 13).
Figure 3.
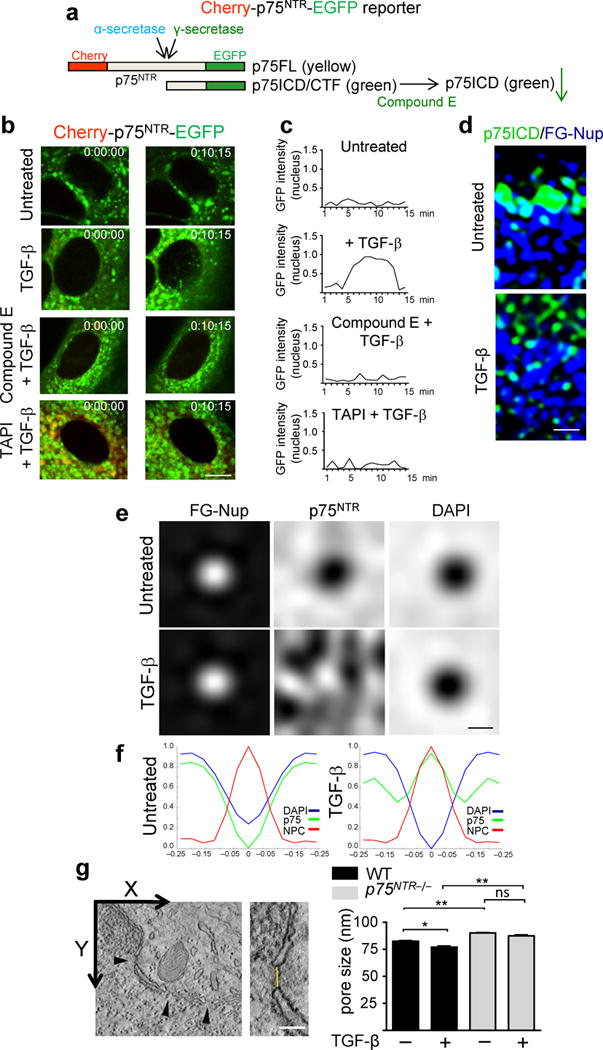
TGF-β-induced p75NTR intramembrane cleavage regulates the NPC structure and function. (a) Cherry-p75NTR-EGFP fusion protein. p75NTR N-terminal, Cherry (red); p75NTR C-terminal, EGFP (green); uncleaved p75FL (yellow). EGFP signal reduction after γ-secretase inhibition indicates reduced p75ICD formation. (b) Real-time imaging of TGF-β-treated astrocytes transfected with cherry-p75NTR-EGFP in the presence of the γ-secretase inhibitor compound E or the α-secretase inhibitor TAPI-2. Representative merged cherry/EGFP images from three independent experiments are shown. Scale bar, 5 μm. (c) Quantification of nuclear EGFP signal. Values from the mean of 20 nuclei obtained from three independent experiments. (d) TGF-β-treated WT astrocytes show increased nuclear p75ICD (right) compared to control (left). Scale bar: 200 nm. Representative images from five independent experiments are shown. (e) Averaged signal for p75NTR (white) revealed relocalization of p75NTR into the NPC in TGF-β-treated astrocytes. p75NTR signal is absent (black) in the NPC in untreated astrocytes. Scale bar, 100 nm. (f) Quantification of p75NTR (green), FG-Nup (red) and DAPI signals (blue) in ~800 NPCs obtained from three independent experiments. (g) Nuclear pore diameter measurements by 3D electron tomography in ~16 nuclear pores per condition. Values are mean ± SEM. *P < 0.01, ** P < 0.0001, and ns, not significant, by one-way ANOVA and Bonferroni post-hoc multiple comparisons; WT untreated vs WT + TGF-β, P = 0.0003; WT untreated vs p75NTR−/− untreated, P = 3.794 × 10⁻⁷; WT + TGF-β vs p75NTR−/− + TGF-β, P = 8.774 ×10⁻¹⁰; p75NTR−/− untreated vs p75NTR−/− + TGF-β, P = 0.054.
To determine the redistribution of the p75ICD at the NPC upon TGF-β treatment at high resolution, we performed simultaneous imaging by 3D-SIM of endogenous p75NTR at ~800 individual nuclear pores. Upon TGF-β stimulation the p75ICD trafficked from the outer nuclear membrane to the inner center of the NPC (Fig. 3e). Quantification of the p75ICD, nucleoporin and DNA signals (Supplementary Fig. 14) showed that under basal conditions the p75ICD correlated with the DNA signal16 (Fig. 3e, f), suggesting that at baseline the p75ICD is excluded from the inner center of the NPC. In contrast, upon TGF-β stimulation the p75ICD correlated with the FG-Nup signal (Fig. 3e, f), suggesting redistribution of the p75ICD into the inner center of the NPC. As expected, the DNA signal was unaltered under basal conditions or upon TGF-β stimulation (Fig. 3e, f). Finally, 3D electron tomography17 showed increased nuclear pore size in p75NTR−/− astrocytes (Fig. 3g), consistent with the function of nucleoporins as regulators of the structure and size of the nuclear pore18. Altogether, these results suggest that in astrocytes a part of the intracellular pool of p75NTR might be readily available for TGF-β-induced γ-secretase cleavage to facilitate the transport of Smad2 into the nuclear pore.
We found that γ-secretase-dependent cleavage of p75NTR is required for TGF-β signaling in astrocytes by regulating dynamic changes in the composition of the NPC to facilitate the nuclear translocation of Smad2. It is therefore possible that the p75ICD functions as a nuclear factor that stabilizes FG domains of Nups to allow P-Smad2 nuclear import. Intramembrane proteolysis is mostly associated with the release of DNA-binding ICDs into the nucleus, as for example for Notch. We propose a novel paradigm whereby intramembrane proteolysis generates nucleoporin-binding ICDs to promote nucleocytoplasmic shuttling of transcription factors. In accordance to biophysical models proposed to explain NPC selectivity and transport14, it is possible that TGF-β-induced regulated intramembrane cleavage of p75NTR generates proteolytic fragments that bind FG-Nups along the NPC to generate affinity gradients to modulate Smad2 transport. The cleaved p75NTR is detected in the NPC of astrocytes, but not neurons, and is in line with the variances in NPC composition between cells19. Thus, cell-specific regulation of intramembrane proteolysis might contribute to the cell-specific composition of the NPC to determine differential growth factor signal transduction pathways between neurons and astrocytes. Further, we could show that p75NTR-mediated TGF-β signaling alters activity-dependent gamma oscillations, suggesting an unanticipated role for p75NTR in regulation of neural information processing and cognition. Identification of γ-secretase-mediated cleavage of p75NTR as a molecular link between TGF-β signaling, astrocyte activation and neuronal functions could provide therapeutic targets for resolving the gliotic scar and promoting neuronal activity.
METHODS
Methods and any associated references are available in the online version of this paper.
METHODS
Animals
C57BL/6J mice (Jackson Laboratory), C57BL/6J-inbred mice deficient for p75NTR−/−20, and the transgenic mouse line hGFAP-pTGF-β14 were used. Transgenic hGFAP-pTGF-β1 mice and p75NTR−/− mice were bred to obtain hGFAP-pTGF-β1: p75NTR−/− mice. All mice were in C57Bl/6 background crossed for over 10 generations and littermates were used in all experiments. Mice were housed under a 12 h light/dark cycle. Up to five animals per cage were housed and were fed standard chow, and had access to food and water ad libitum. All animal procedures were performed under the guidelines set by the University of California, San Francisco, Institutional Animal Care and Use Committee and are in accord with those set by the National Institutes of Health.
Cortical stab wound injury
Cortical stab wound injury (SWI) was performed as described previously in male mice8. For the expression analysis of p75NTR in astrocytes and for the analysis of the role of p75NTR in astrocyte activation after SWI, the following stereotaxic coordinates were used: sagittal: anteroposterior (AP), −1.0 mm; mediolateral (ML), −1.0 mm; dorsoventral (DV), −1.7 mm, respectively from bregma according to Paxinos and Franklin.
Three-dimensional structured illumination microscopy (3D-SIM)
Astrocytes were grown to 60–80% confluency on 22×22 mm cover glasses (Corning) coated with poly-D-lysine, cultured in DMEM supplemented with 10% heat-inactivated FBS and penicillin/streptomycin. Image stacks of astrocytes were taken using 3D-SIM microscope16. Briefly, super-resolution imaging was performed on using a three-dimensional structured illumination (3D-SIM) microscope21 equipped with a 100×, 1.4 NA, oil-immersion objective (Olympus) For 3D-SIM recording, image stacks with a z-distance of 0.125 μm were acquired. Exposure times were between 100 and 200 ms, yielding typically 3000–10000 counts in a raw image of 16-bit dynamic range. Raw images containing 3D-SIM illumination pattern were processed to reconstruct high-resolution information as described16 with Volocity 5 software (Perkin Elmer). Reconstructed images were registered to compensate for slightly differing camera positions and orientations by calibration with images of 100nm fluorescent beads. For deconvolution of confocal data sets a maximum-likelihood estimation algorithm was applied using theoretic point spread functions and a maximum number of 10 iterations. To determine numbers and volumes of RF a threshold-based segmentation was applied using the object separation option of Volocity. Despite the slightly bigger RF sizes within dense clusters possible due to incomplete separation, the average volume of RF was found to correspond well to the 2-fold increase in resolution that 3D-SIM provides over confocal laser scanning microscopy.
Stimulated emission depletion (STED) microscopy
Astrocytes were grown to 60–80% confluency on 24×24 mm cover glasses (Assistent), cultured in DMEM supplemented with 10% heat-inactivated FBS and penicillin/streptomycin. Astrocytes were treated with 2 ng/ml of TGF-β (R&D Systems), pretreated with 1 μM compound E (Calbiochem), an inhibitor of γ-secretase activity, 3 hour before TGF-β treatment, or left untreated. Images were obtained using a commercial gated STED microscope (TCS SP8 STED-WS or TCS SP8 STED 3x) with a HCX PL APO 100×/1.4 oil objective (Leica Microsystems, Germany). Detection of the STAR440 and STAR488 fluorophores (Abberior, Germany) was performed in sequential acquisition mode using HyD detectors in the gating mode and wavelengths ranges of 470 – 510 nm and 530 – 560 nm, respectively. The image stacks were Nyquist sampled with a pixel size of 30 nm, a z-step size of 210 nm, and at a scan speed of 400 Hz using six line averages. The pinhole was set to one airy unit. All image stacks were deconvolved using the Huygens STED deconvolution module (Scientific Volume Imaging, Netherlands). In the further analysis to obtain orthogonal sections IMARIS 7.6 (Bitplane, Switzerland) was used.
EEG recordings and behavioral locomotor activity
Mice were implanted for video EEG monitoring after anesthesia with intraperitoneal ketamine (75 mg/kg) and medetomidine (1 mg/kg). Both male and female mice were used and experiments were performed during the light cycle. Teflon-coated silver wire electrodes (0.125 mm diameter) soldered to a multichannel electrical connector were implanted into the subdural space over the left frontal cortex (1 mm lateral and anteriorNA to the bregma) and the left and right parietal cortex (2 mm lateral and posterior to the bregma). The left frontal cortex electrode was used as a reference. All EEG recordings were carried out at least 10 days after surgery on freely moving mice in an open field chamber (40 × 40 × 30 cm). Exploratory locomotor activity was measured with an automated Flex-Field/Open Field Photobeam Activity System (San Diego Instruments). Mice were placed in one of four identical open field chambers for 50 min. The apparatus was cleaned with 70% ethanol between trials. Total movements included fine and ambulatory horizontal movements as well as vertical movements. EEG activity was recorded with the Harmonie software (version 5.0b, Stellate, Canada) for 50 min. For spectral analysis of EEG recordings, segments of 50 minutes of unfiltered EEG recordings (sampling rate 200 s−1) from freely moving animals were imported and analyzed using LabChart 7 Pro software (AD Instruments). 30 – 90Hz band was used for the gamma power calculation with a 58 – 62 Hz notch filter was applied to remove potential electrical noise. Spectral power was obtained by subjecting the recordings to a fast Fourier transform (FFT) using a Hann cosine-bell window with 50% overlap between windows. FFT was performed with a 512 point FFT size to obtain a resolution of 0.39 Hz. The gamma frequency band (gamma activity) represents the average of the spectral values in the 30 – 90 Hz range.
Construction of cherry-p75NTR-EGFP
For generation of cherry-p75NTR-EGFP the rat p75NTR-EGFP plasmid was used22. A forward (5′) primer containing a BglII restriction site immediately 5′ to the initiating cherry sequence and a reverse primer designed to delete the cherry stop codon with EcoR1 restriction site immediately 3′ was used to amplify the cherry sequence and cloned in frame into the p75NTR-EGFP plasmid, generating cherry-p75NTR-EGFP.
Live Cell Imaging
Rat astrocytes were transfected by electroporation using Amaxa Astrocyte Nucleofector kit (Lonza) following manufacturer’s instructions with the cherry-p75NTR-EGFP fusion construct. Cells were plated in 500 μl of DMEM with 10% heat-inactivated FBS and 1% penicillin/streptomycin at a density of 50,000 cells per well in eight-well Nunc plates coated with poly-D-lysine. 24 h after transfection, rat astrocytes were serum deprived for 3 h before imaging. Astrocytes were treated with 2 ng/ml of TGF-β (R&D Systems), pretreated with 1 μM compound E (Calbiochem), an inhibitor of γ-secretase activity, or with 20 μM TAPI-2 (Calbiochem), an inhibitor of α-secretase, after transfection and 3 hours before TGF-β treatment. TGF-β was added and the cherry-p75NTR-EGFP intracellular dynamic was imaged in living cells under 5% CO2 and 95% air through a 63× oil-immersion lens (NA 1.4) on a TCS SP5 confocal system (Leica) with a heated stage (37°C). GFP and cherry were excited with the 488 nm line of an argon laser and the 543 nm line of an helium–neon laser, respectively. The FITC-TRITC filter combination was used to detect the GFP and cherry signal. Fluorescence emissions were collected between 500 – 560 nm for the GFP and to prevent any bleed through, we selected a more efficient emission filter for TRITC corresponding to 600 – 640 nm. Images were acquired in the green and red channels at 11-second intervals over 15 minutes. The images were processed using the LASAF software (Leica). The digitized images were analyzed using ImageJ software (National Institutes of Health). The number of pixels per image with an intensity above a predetermined threshold level within the astrocyte nucleus was quantified by measurement of the GFP signal of the cherry-p75NTR-GFP fusion protein representing the cleaved p75ICD. All quantitative analyses were performed in a blinded manner.
Astrocyte conditioned medium and neurite outgrowth assay
Astrocyte conditioned medium (ACM) and neurite outgrowth assays were performed as described8 using WT or p75NTR−/− primary astrocytes treated with 20 ng/ml TGF-β for 2 d. For inhibitor studies, astrocytes were pretreated with 10 μM TGF-β receptor type I inhibitor (Calbiochem) 1 h before TGF-β treatment. Cortical neurons were cultured with 80% ACM, extended processes for 24 h and were stained with β-tubulin (Sigma). Neurite outgrowth was determined as the proportion of total cells bearing neurites longer than the diameter of the cell body, an indication of successful initiation of neurite outgrowth23. The number of neurite-bearing cells was counted, percentage to the total number of cells was calculatedas “neurite outgrowth (%)”. The number of neurite-bearing cells was measured from 400 to 500 neurons per condition. Ten representative images per well were taken. All experiments were repeated four times and were performed in triplicate.
p75NTR cleavage
For TGF-β induced cleavage of p75NTR, primary mouse astrocytes were pretreated with 1 μM compound E (Calbiochem), 3 h before TGF-β treatment. Primary mouse astrocytes were treated with 20 ng/ml TGF-β (R&D Systems) for 1 h. Rat astrocytes were electroporated using Amaxa Astrocyte Nucleofector kit (Lonza) with the p75NTR full length construct. Cells were plated in DMEM with 10% heat-inactivated FBS and 1% penicillin/streptomycin at a density of 500,000 cells per 75cm2 flask coated with poly-D-lysine. Primary p75NTR−/− MEFs were electroporated and cultured in the same conditions, but were plated at a density of 300,000 cells per well of a 6 well plate. Fibroblasts were pretreated with 1 μM compound E (Calbiochem), or with 20 μM TAPI-2 (Calbiochem), 14 h and 1 h before TGF-β treatment. 10 μM MG132 (Calbiochem) was added to astrocytes and fibroblasts 1 h before TGF-β treatment. 24 h after electroporation, cells were treated with 20 ng/ml TGF-β (R&D Systems) for 12 h for astrocytes and for 3 h for embryonic fibroblasts and cell lysates were harvested and processed for Western blotting. Primary mouse astrocyte nuclear fraction was prepared using the Active Motif kit (Active Motif 54001). Cell lysates were probed with rabbit anti-p75ICD (1:300 (9992), kind gift of Moses Chao), rabbit anti-p75NTR (1:1000, 07 – 476, Millipore), rabbit anti-H3 (1:1000, 9715, Cell Signaling) and rabbit anti-GAPDH (1:1000, 2118, Cell Signaling).
Peptide array mapping
Peptide array was performed as described24. Peptide libraries were synthesized by automatic SPOT synthesis25. Synthetic overlapping peptides (25 amino acids in length) of Nup153 were spotted on Whatman 50 cellulose membranes according to standard protocols by using Fmoc-chemistry with the AutoSpot Robot ASS 222 (Intavis Bioanalytical Instruments AG). Membranes were overlaid with 10 μg/ml recombinant GST-p75NTR ICD. Bound recombinant GST-p75NTR ICD was detected using goat anti-GST (1:2000, 27-4557-01, GE Healthcare) followed by secondary anti–rabbit horseradish peroxidase antibody (1:2500, RPN 4031, GE Healthcare).
Electron Tomography
For electron microscopy, primary astrocytes were grown on poly-D-lysine coated 75 cm2 tissue culture flasks. Astrocytes were treated with 2 ng/ml of TGF-β1 (R&D Systems) for 1 h. Astrocytes were fixed in 2.5% glutaraldehyde, 2% paraformaldehyde, 0.1M sodium cacodylate pH 7.4 and pelleted, postfixed in 1% osmium tetroxide, 0.8% potassium ferrocyanide, 3mM calcium chloride in the same buffer, en block stained in 2% uranyl acetate, dehydrated in ethanol, infiltrated and embedded in Durcupan. Samples were sectioned on a Reichert Ultracut S ultramicrotome at a thickness of 300 nm and sections picked up on 100 mesh clamshell grids. These sections were poststained for 15 minutes in a 1% uranyl acetate solution followed by 5 minutes in a Sato lead solution. To ensure stability in the beam, a thin coat of carbon was applied to each side of the sections. Colloidal gold particles with a diameter of 15 nm were deposited on opposite sides of the section to serve as fiducial cues. For each tilt series, a single series of images was collected with a JEOL (Tokyo, Japan) 4000EX intermediate voltage electron microscope operated at 400 kV. The specimens were irradiated before collecting data to limit anisotropic specimen thinning during tilt series collection. Using a CCD camera, tilt series were recorded at 20,000× magnification in angular increments of 2° from −60° to +60° about an axis perpendicular to the optical axis of the microscope. Precise angular increments were achieved using a computer-controlled goniometer. The pixel dimensions of the CCD camera were 3448 × 3448 and the pixel resolution was 0.865 nm. The IMOD software package26 was used for rough alignment of the tilt series and the TxBR software package was used for fine alignment and reconstruction27. Nuclear pore diameter measurements were made using NIH ImageJ. Measurements were taken in the XY plane of multiple slices about the presumed center of the pore and the maximum value was taken to be the true center.
PLA analysis
PLA analysis was performed following the manufacturer’s instructions (Olink Bioscience). Briefly, astrocytes were plated in 300 μl of DMEM with 10% heat-inactivated FBS and 1% penicillin/streptomycin at a density of 30,000 cells per well in eight-well Nunc plates coated with poly-D-lysine and cultured for two days at 37°C in 5% CO2. Cells were fixed with 4% PFA at 4°C for 30 min, permeabilized using 0.1% Triton/PBS for 10 min at 4°C, and blocked by using the blocking solution of Olink PLA kit for 30 min at +37°C. Cells were incubated with primary antibody diluted in 1% BSA/PBS – overnight at 4°C. The following primary antibodies were used: rabbit anti-p75ICD (1:300 (9992), kind gift of Moses Chao), anti mouse anti-nuclear pore complex protein (1:2000, ab24609, Abcam), anti mouse Nup358 (1:100, sc-74518, SantaCruz Biotechnologies), anti rat Nup153 (1:100, sc-101544, SantaCruz Biotechnologies), anti rabbit P-Smad2 (1:500, 3101, Cell Signaling). Cells were incubated with the according PLA probes (secondary antibodies for anti-mouse, anti-rat and anti-rabbit, respectively) for 60 min at 37°C. For ligation and circularization of the DNA-oligos, cells were incubated with ligase-solution for 30 min at 37°C. For rolling circle amplification cells were incubated with amplification-solution, containing a fluorophore with the excitation wavelength of 594 nm for 100 min at 37°C. Cells were mounted with a coverslip using a minimal volume of Duolink In Situ Mounting Medium with DAPI and analyzed by confocal microscopy (images were acquired on a Leica TCS SP8 laser confocal microscope with 63× oil immersion objectives and the LAS AF image analysis software. For quantification, the PLA signal per nucleus was counted for 70 nuclei per each condition. All quantitative analyses were performed in a blinded manner.
Immunohistochemistry
P28 mice were transcardially perfused with ice-cold saline under avertin anesthesia and brain samples were removed, embedded in OCT (Tissue-Tek), and frozen on dry ice. Immunohistochemistry on sagittal brain cryostat sections was performed as described8. The primary antibodies used were rat anti-glial fibrillary acidic protein (GFAP) (1:1000; 13-0300, Invitrogen), rabbit anti-neurocan (1:500)28 and rabbit anti-p75NTR (1:300; AB1554, Millipore) and secondary antibodies were conjugated with Alexa Fluor 488 or 594 (1:200; Jackson ImmunoResearch Laboratories). Quantitative image analysis for the immunostained mouse sagittal sections was performed on three separate tissue sections through the body of the lateral ventricle. For measurement of ventricle sizes in the brain, equivalent cresyl violet staining of sagittal sections were chosen on the basis of common morphological landmarks. Ventricle size was calculated from the ventricle area divided by the total brain area in a blinded manner using ImageJ. For quantification of GFAP intensity at the lateral ventricle 5 nonoverlapping rectangular boxes (100 × 100μm) were localized along the subventricular zone of the lateral ventricle. The digitized images were analyzed using ImageJ software (National Institutes of Health). The number of pixels per image with an intensity above a predetermined threshold level was quantified by measurement of the immunoreactive areas for GFAP. The measurement of total immunoreactivity is represented as percent area density defined as the number of pixels (positively stained areas) divided by the total number of pixels (sum of positively and negatively stained area) in the imaged field. All quantitative analyses were performed in a blinded manner.
Cell culture
HEK293T (ATCC), NIH3T3 (ATCC) and isolated MEF cells were maintained in DMEM supplemented with 10% heat-inactivated fetal bovine serum (FBS) and 1% penicillin/streptomycin. MEFs and primary cortical astrocytes were isolated from p75NTR−/− mice as we described8,29. Astrocytes were used for experiments after they reached confluency.
Immunocytochemistry
Primary astrocytes were plated for 2 d at a density of 20,000 cells per well in eight-well Nunc plates coated with poly-D-lysine in 300 μl of DMEM with 10% heat-inactivated FBS and 1% penicillin/streptomycin. Astrocytes were treated with 2 ng/ml of TGF-β1 (R&D Systems) for 1 h. Immunocytochemistry was performed as described8 using goat anti-p75ECD (1:100, sc-6189, SantaCruz Biotechnologies), rabbit anti-p75ICD (1:300 (9992), kind gift of Moses Chao), mouse anti-nuclear pore complex protein (1:2000, ab24609, Abcam), rabbit anti-phospho-presenilin-1 (1:100, ab78914, Abcam), rabbit anti-phospho-Smad2 (1:500, ab3849, Millipore) in PBS with 1% BSA overnight.
RNA isolation and quantitative PCR
RNA was isolated from primary astrocyte cultures and quantitative real-Time PCR was performed as described8. The following primers were used:
| Neurocan: | Fwd 5′-TGC AAC CAC GGC TAA GCT C-3′ Rev 5′-GGG GAT AAG CAG GCA ATG AC-3′ |
| Fibronectin: | Fwd 5′-GCA GTG ACC ACC ATT CCT G-3′ Rev 5′-GGT AGC CAG TGA GCT GAA CAC-3′ |
| GAT1: | Fwd 5′-GAAAGCTGTCTGATTCTGAGGTG-3′ Rev 5′-AGCAAACGATGATGGAGTCCC-3′ |
| S100b: | Fwd 5′-TGGTTGCCCTCATTGATGTCT-3′ Rev 5′-CCCATCCCCATCTTCGTCC-3′ |
| GAPDH: | Fwd 5′-CAA GGC CGA GAA TGG GAA G-3′ Rev 5′-GGC CTC ACC CCA TTT GAT GT-3′ |
Immunoblots
Immunoblots to detect neurocan in the supernatant of WT or p75NTR−/− astrocytes were performed as described8. Astrocytes were treated with 20 ng/ml TGF-β (R&D Systems) for 2 days and pretreated with 10 μM SB431542 (Sigma), an inhibitor of TGF-β receptor type I, 1 h before TGF-β treatment as indicated. For rescue experiments p75NTR−/− astrocytes were infected with lentivirus expressing p75NTR constructs and medium was changed 2 days after infection and cells were treated on the third day post-infection. Astrocyte cytoplasmic and nuclear fractions were prepared using the Active Motif kit (Active Motif 54001). For detection of P-Smad2, WT and p75NTR−/− astrocytes were treated with 2 ng/ml TGF-β (R&D Systems) for 1 h or in inhibitor studies, WT astrocytes were pre-treated with 1 μM compound E (Calbiochem), an inhibitor of γ-secretase activity, 1 h before TGF-β treatment. For detection of P-presenilin-1 WT primary astrocytes were treated with 2 ng/ml TGF-β. The following primary antibodies were used: rabbit anti-histone H3 (1:1000, 9715, Cell Signaling), rabbit anti-P-Smad2 (1:1000, 3101, Cell Signaling), mouse anti-Smad2 (1:1000, 3103, Cell Signaling), rabbit anti-GAPDH (1:1000, 2118, Cell Signaling), rabbit anti-neurocan (1:500)28 rabbit anti-P-presenilin-1 (1:1000, ab78914, Abcam), rabbit anti-presenilin-1 (1:1000, ab71181, Abcam), mouse anti-α-tubulin (1:1000, T6199, Sigma).
Co-immunoprecipitation
Co-immunoprecipitation was performed as described30. For mapping experiments, immunoprecipitation was performed with anti-HA antibody (Cell Signaling) or anti-Nup153 antibody (SantaCruz Biotechnologies). For endogenous co-immunoprecipitation, cell lysates were incubated with rabbit anti-mouse p75NTR antibody (1:100; (9992, kind gift of Moses Chao)) and rat anti-mouse Nup153 antibody (5 μg, SantaCruz Biotechnologies) bound to A-agarose beads for 4 h at 4°C. Cell lysates were probed with the following antibodies: mouse anti-nuclear pore complex protein antibody (1:1000, ab24609, abcam), rat anti-Nup153 antibody (1:500, sc-101544, SantaCruz Biotechnologies), mouse anti-Nup358 antibody (1:500, sc-74518, SantaCruz Biotechnologies), rabbit anti-HA (1:1000, 3724, Cell Signaling), rabbit anti-p75NTR (1:1000, AB1554, Millipore).
Statistics
Statistical significance was calculated using GraphPad Prism (GraphPad Software) by unpaired or paired two-sided Student’s t test to analyze significance between two experimental groups or by analysis of variance one-way ANOVA, Bonferron’s post-test or two-way ANOVA for multiple comparisons. Data are presented as mean ± SEM. Data distribution was assumed to be normal, but this was not formally tested. No statistical methods were used to predetermine sample sizes, but our sample sizes are similar to those reported in previous publications6,8,23. No randomization was used to assign experimental groups or to collect data but mice and cells were assigned to specific experimental groups without bias. All animals were present at the end of study. No data points were excluded. All histopathological analyses were performed in a blinded manner.
Supplementary Material
Supplementary Movie 1. Three-dimensional view of p75NTR at the astrocyte nucleus imaged with 3D-SIM. 3D-SIM of primary mouse astrocytes stained for p75NTR (green), nucleoporin (red) and DAPI (blue) show abundant p75NTR staining at the nuclear surface. Scale bar, 5 μm.
Supplementary Movie 2. Live cell imaging of primary astrocytes transfected with cherry-p75NTR-EGFP and treated with TGF-β. Timelapse movie showing no p75ICD (green) nuclear translocation in untreated primary astrocytes, rapid p75ICD nuclear translocation after treatment of primary astrocytes with TGF-β and inhibition of the TGF-β-induced p75ICD nuclear localization by pretreatment of primary astrocytes with the γ-secretase inhibitor compound E or with the α-secretase inhibitor TAPI-2. Treatment of cells with the α-secretase inhibitor TAPI-2 resulted in an increase of yellow signal, indicative of full length p75NTR. Scale bar, 5 μm.
Acknowledgments
We thank John W. Sedat for 3D-SIM microscopy, Benjamin D. Sachs and Dimitrios Davalos for discussions, Richard Margolis for anti-neurocan antibody, Wernher Fouquet and Ulf Schwarz at LEICA Microsystemsand the University of Freiburg Life Imaging Center (LIC) for microscopy support. Supported in part by NCRR 5P41RR004050-24 and NIGMS 8P41GM103412-24 to M.E. and the BIOSS – Centre for Biological Signaling Studies EXC 294 for the Life Imaging Center to R.N. Supported by the NMSS postdoctoral fellowships to J.K.R. and N.L.M., the AHA fellowship to V.R., the German Academic Exchange Service fellowship to K.M., NIH/NIA AG047313 to J.P., the European Commission FP7 PIRG08-GA-2010-276989 and the German Research Foundation SCHA 1442/3-1 and SCHA 1442/3-2 to C.S., and NIH/NINDS R01NS051470, R01NS052189, R01NS066361, and R21NS082976 to K.A.
Footnotes
AUTHOR CONTRIBUTIONS
C.S. performed the majority of the experiments. J.K.R. performed histology and surgeries, K.M. performed STED microscopy and biochemical experiments, A.S.K. performed EEG recordings and behavioral measurements, P.M.C. performed 3D-SIM microscopy, A.P. performed electron tomography, F.K. performed peptide arrays, N.L.M. contributed to live cell imaging and histology, E.V. maintained mouse colonies, B.B.R., V.R., and J.P.C contributed to animal colonies and histology, R.N. contributed to image analysis. M.D.H, M.H.E., T.W., and J.J.P. contributed to the experimental design, data analysis and interpretation. C.S. and K.A. designed the study, analyzed data, coordinated the experimental work, and wrote the manuscript with contribution from all authors.
COMPETING FINANCIAL INTERESTS
The authors declare no competing financial interests.
A Supplementary Methods Checklist is available.
References
- 1.Krieglstein K, Zheng F, Unsicker K, Alzheimer C. Trends Neurosci. 2011;34:421–429. doi: 10.1016/j.tins.2011.06.002. [DOI] [PubMed] [Google Scholar]
- 2.Hanbury R, et al. J Comp Neurol. 2002;444:291–305. doi: 10.1002/cne.10104. [DOI] [PubMed] [Google Scholar]
- 3.Oderfeld-Nowak B, et al. Neuroscience. 2003;120:31–40. doi: 10.1016/s0306-4522(03)00289-6. [DOI] [PubMed] [Google Scholar]
- 4.Wyss-Coray T, et al. Am J Pathol. 1995;147:53–67. [PMC free article] [PubMed] [Google Scholar]
- 5.Lee HS, et al. Proc Natl Acad Sci USA. 2014 [Google Scholar]
- 6.Verret L, et al. Cell. 2012;149:708–721. doi: 10.1016/j.cell.2012.02.046. [DOI] [PMC free article] [PubMed] [Google Scholar]
- 7.Silver J, Miller JH. Nat Rev Neurosci. 2004;5:146–156. doi: 10.1038/nrn1326. [DOI] [PubMed] [Google Scholar]
- 8.Schachtrup C, et al. J Neurosci. 2010;30:5843–5854. doi: 10.1523/JNEUROSCI.0137-10.2010. [DOI] [PMC free article] [PubMed] [Google Scholar]
- 9.Araque A, et al. Neuron. 2014;81:728–739. doi: 10.1016/j.neuron.2014.02.007. [DOI] [PMC free article] [PubMed] [Google Scholar]
- 10.Schmierer B, Hill CS. Nat Rev Mol Cell Biol. 2007;8:970–982. doi: 10.1038/nrm2297. [DOI] [PubMed] [Google Scholar]
- 11.Parkhurst CN, Zampieri N, Chao MV. J Biol Chem. 2010;285:5361–5368. doi: 10.1074/jbc.M109.045054. [DOI] [PMC free article] [PubMed] [Google Scholar]
- 12.Le Moan N, Houslay DM, Christian F, Houslay MD, Akassoglou K. Mol Cell. 2011;44:476–490. doi: 10.1016/j.molcel.2011.08.033. [DOI] [PMC free article] [PubMed] [Google Scholar]
- 13.Frey S, Richter RP, Gorlich D. Science. 2006;314:815–817. doi: 10.1126/science.1132516. [DOI] [PubMed] [Google Scholar]
- 14.Terry LJ, Wente SR. Eukaryot Cell. 2009;8:1814–1827. doi: 10.1128/EC.00225-09. [DOI] [PMC free article] [PubMed] [Google Scholar]
- 15.Annaert WG, et al. J Cell Biol. 1999;147:277–294. doi: 10.1083/jcb.147.2.277. [DOI] [PMC free article] [PubMed] [Google Scholar]
- 16.Schermelleh L, et al. Science. 2008;320:1332–1336. doi: 10.1126/science.1156947. [DOI] [PMC free article] [PubMed] [Google Scholar]
- 17.Kim CE, Perez A, Perkins G, Ellisman MH, Dauer WT. Proc Natl Acad Sci USA. 2010;107:9861–9866. doi: 10.1073/pnas.0912877107. [DOI] [PMC free article] [PubMed] [Google Scholar]
- 18.Allen TD, Cronshaw JM, Bagley S, Kiseleva E, Goldberg MW. J Cell Sci. 2000;113(Pt 10):1651–1659. doi: 10.1242/jcs.113.10.1651. [DOI] [PubMed] [Google Scholar]
- 19.Tran EJ, Wente SR. Cell. 2006;125:1041–1053. doi: 10.1016/j.cell.2006.05.027. [DOI] [PubMed] [Google Scholar]
- 20.Lee KF, et al. Cell. 1992;69:737–749. doi: 10.1016/0092-8674(92)90286-l. [DOI] [PubMed] [Google Scholar]
- 21.Gustafsson MG, et al. Biophys J. 2008;94:4957–4970. doi: 10.1529/biophysj.107.120345. [DOI] [PMC free article] [PubMed] [Google Scholar]
- 22.Kreitzer G, Marmorstein A, Okamoto P, Vallee R, Rodriguez-Boulan E. Nat Cell Biol. 2000;2:125–127. doi: 10.1038/35000081. [DOI] [PubMed] [Google Scholar]
- 23.Schachtrup C, et al. Proc Natl Acad Sci USA. 2007;104:11814–11819. doi: 10.1073/pnas.0704045104. [DOI] [PMC free article] [PubMed] [Google Scholar]
- 24.Sachs BD, Akassoglou K. Biochem Soc Trans. 2007;35:1273–1277. doi: 10.1042/BST0351273. [DOI] [PubMed] [Google Scholar]
- 25.Frank R. J Immunol Methods. 2002;267:13–26. doi: 10.1016/s0022-1759(02)00137-0. [DOI] [PubMed] [Google Scholar]
- 26.Kremer JR, Mastronarde DN, McIntosh JR. J Struct Biol. 1996;116:71–76. doi: 10.1006/jsbi.1996.0013. [DOI] [PubMed] [Google Scholar]
- 27.Lawrence A, Bouwer JC, Perkins G, Ellisman MH. J Struct Biol. 2006;154:144–167. doi: 10.1016/j.jsb.2005.12.012. [DOI] [PubMed] [Google Scholar]
- 28.Milev P, Maurel P, Haring M, Margolis RK, Margolis RU. J Biol Chem. 1996;271:15716–15723. doi: 10.1074/jbc.271.26.15716. [DOI] [PubMed] [Google Scholar]
- 29.Baeza-Raja B, et al. Proc Natl Acad Sci USA. 2012;109:5838–5843. doi: 10.1073/pnas.1103638109. [DOI] [PMC free article] [PubMed] [Google Scholar]
- 30.Sachs BD, et al. J Cell Biol. 2007;177:1119–1132. doi: 10.1083/jcb.200701040. [DOI] [PMC free article] [PubMed] [Google Scholar]
Associated Data
This section collects any data citations, data availability statements, or supplementary materials included in this article.
Supplementary Materials
Supplementary Movie 1. Three-dimensional view of p75NTR at the astrocyte nucleus imaged with 3D-SIM. 3D-SIM of primary mouse astrocytes stained for p75NTR (green), nucleoporin (red) and DAPI (blue) show abundant p75NTR staining at the nuclear surface. Scale bar, 5 μm.
Supplementary Movie 2. Live cell imaging of primary astrocytes transfected with cherry-p75NTR-EGFP and treated with TGF-β. Timelapse movie showing no p75ICD (green) nuclear translocation in untreated primary astrocytes, rapid p75ICD nuclear translocation after treatment of primary astrocytes with TGF-β and inhibition of the TGF-β-induced p75ICD nuclear localization by pretreatment of primary astrocytes with the γ-secretase inhibitor compound E or with the α-secretase inhibitor TAPI-2. Treatment of cells with the α-secretase inhibitor TAPI-2 resulted in an increase of yellow signal, indicative of full length p75NTR. Scale bar, 5 μm.