

Abstract
Objective
White matter hyperintensities(WMH) are areas of increased signal on magnetic resonance imaging(MRI) scans that most commonly reflect small vessel cerebrovascular disease. Increased WMH volume is associated with risk and progression of Alzheimer’s disease(AD). These observations are typically interpreted as evidence that vascular abnormalities play an additive, independent role contributing to symptom presentation, but not core features of AD. We examined the severity and distribution of WMH in presymptomatic PSEN1, PSEN2, and APP mutation carriers to determine the extent to which WMH manifest in individuals genetically-determined to develop AD.
Methods
The study comprised participants(n=299, age=39.03±10.13) from the Dominantly Inherited Alzheimer Network, including 184(61.5%) with a mutation that results in AD and 115(38.5%) first-degree relatives who were non-carrier controls. We calculated the estimated years from expected symptom onset(EYO) by subtracting the affected parent’s symptom onset age from the participant’s age. Baseline MRI data were analyzed for total and regional WMH. Mixed effects piecewise linear regression was used to examine WMH differences between carriers and non-carriers with respect to EYO.
Results
Mutation carriers had greater total WMH volumes, which appeared to increase approximately 6 years prior to expected symptom onset. The effects were most prominent for the parietal and occipital lobe, which showed divergent effects as early as 22 years prior to estimated onset.
Interpretation
Autosomal dominant AD is associated with increased WMH well before expected symptom onset. The findings suggest the possibility that WMH are a core feature of AD, a potential therapeutic target, and a factor that should be integrated into pathogenic models of the disease.
Introduction
White matter hyperintensities (WMH), visualized as increased signal on T2-weighted magnetic resonance imaging (MRI) of the brain are common radiological features of aging. Previously thought to reflect benign changes in underlying tissue or radiographic artifacts, they have emerged as correlates of cognitive, functional, emotional, and motoric abnormalities that emerge in later life1 and have been linked pathologically to small vessel cerebrovascular disease, including arteriosclerosis, demyelination and axonal loss due to ischemia or neuronal death, cerebral amyloid angiopathy, and microglia activation2. In recent years, there has been strong evidence that WMH are associated with the clinical risk and symptomatic course of late onset Alzheimer’s disease (LOAD)3. Despite these consistent observations, white matter abnormalities are not included in current conceptual models of the pathogenesis and biological marker progression of LOAD (e.g., 4). The debate on the extent to which WMH represent a core feature of LOAD can be summarized in two opposing views. On the one hand, because AD is defined pathologically by the presence of Aβ plaques with neuritic plaques and neurofibrillary tangles adding to the severity of the changes, white matter damage is considered a comorbidity that does not represent these pathologies. On the other hand, WMH predict the clinical onset and course of AD similarly to or better than other biological markers of AD5, 6, may in part reflect vascular forms of AD pathology, there are viable biological models that implicate small vessel cerebrovascular disease in the deposition of primary AD pathology7, and among individuals with late onset dementia, presence of multiple pathologies is more common than not 8–10.
The study of the emergence of WMH - - or any biological markers - - and their contributions to LOAD in humans is difficult because the ordering and timing of the biological changes that lead to dementia can occur up to decades before the onset of symptoms4, which is typically the point when human studies of LOAD are conducted. White matter hyperintensity severity is also tightly linked to vascular risk factors and age2, so determination of its contribution to late onset AD is potentially confounded by these factors. To overcome these issues, we turned to the landmark Dominantly Inherited Alzheimer Network (DIAN) study. The study enrolls individuals at 50% risk for autosomal dominant AD by virtue of having a first-degree relative with a pathogenic mutation in one of three AD-causing genes: amyloid precursor protein (APP), presenilin 1 (PSEN1), and presenilin 2 (PSEN2). Pathogenic mutations are virtually fully penetrant, leading to 100% probability that the mutation carrier will develop early onset AD. Although autosomal dominant forms of AD account for fewer than 1% of all AD cases, there is strong overlap in symptomatology with LOAD, and a recent critical DIAN study established that the order of biological changes begins with deposition of amyloid, followed by neurodegenerative changes (e.g., as indexed by levels of tau protein in the cerebrospinal fluid [CSF]), and cognitive decline 11. Because the age at onset of clinical symptoms is highly heritable among individuals with autosomal dominant AD12, parental age at onset can be used as a reliable estimate of clinical onset among asymptomatic mutation carriers. Here, we tested the hypothesis that WMH burden is elevated among mutation carriers and increases with greater temporal proximity to the estimated year of onset of clinical symptoms. Our goal was to determine definitively whether WMH are a core feature of AD. Given our previous observations of a WMH regional selectivity in LOAD, we also examined the regional distribution of WMH.
Methods
Overall design
The DIAN study (www.dian-info.org; NIA-U19-AG032438) is an international effort that includes sites in USA, UK, Germany, and Australia. The study recruits individuals from families with a known autosomal dominant mutation for AD, including APP, PSEN1, and PSEN2, irrespective of their own mutation status. As part of the DIAN Observational Study, participants receive a baseline assessment with sampling of blood and CSF, clinical assessment, neuropsychological evaluation, and neuroimaging, and are followed longitudinally with identical assessments. Full procedures for the study are described elsewhere11, 13. All study procedures received approval from each participating institution and all participants gave informed consent.
Clinical assessment
All evaluation procedures were conducted by individuals unaware of the mutation status of each participant. The clinical assessment included evaluation with the Clinical Dementia Rating scale (CDR)14, physical and neurological examination, neuropsychological testing, and determination of the parental age at onset. Parental age at onset was determined with a semi-structured interview that assessed the age at which the affected parent began exhibiting signs of progressive cognitive decline 11. Estimated years from expected symptom onset (EYO) were calculated as the difference between the participant’s age and the parental age at onset11. This variable was established for all participants regardless of their own mutation status. Data included in the present study were a subset from Data Freeze 6 with available T2-weighted magnetic resonance imaging (MRI) scans. Remote or current history of hypertension, hypercholesterolemia, diabetes, and smoking (≥ 100 cigarettes smoked in lifetime) was ascertained via interview and considered in secondary analyses.
Biochemical and genetic analysis
Cerebrospinal fluid was collected via lumbar puncture on each participant under fasting conditions11. Samples were shipped to the DIAN biomarker core laboratory and immunoassay (INNOTEST β-Amyloid1-42 and INNO-BIA AlzBio3) was used to measure CSF concentrations of Aβ1-42 and phosphorylated tau (ptau181). All samples underwent quality control procedures11. Each participant’s mutation status and APOE genotype was determined according to procedures in the published DIAN protocol11, 13.
Brain imaging
Participants received structural MRI. For the current study, we quantified WMH on T2-weighted fluid attenuated inversion recovery (FLAIR) structural MRI scans. Scan acquisition took place on pre-qualified 3T scanners at each site. Harmonization and quality assurance across platforms, sites, and acquisition times followed the Alzheimer’s Disease Neuroimaging Initiative (ADNI) protocols15. The neuroimaging core laboratory reviewed each MRI scan to ensure compliance with the acquisition protocol and image quality. Standardized FLAIR sequences (TR:9000, TE:90, TI: 2500, voxel dimensions: 0.86 × 0.86 × 5.0 mm) were acquired as part of the DIAN MRI protocol. The FLAIR images were transferred to Columbia University for WMH quantification using procedures previously described16. Briefly, a study-specific intensity threshold was applied to each image to label voxels falling within the WMH intensity distribution. An expert operator reviewed and edited every image if necessary. A “lobar” atlas was co-registered linearly to each labeled FLAIR image to define WMH volumes in frontal, temporal, parietal, and occipital lobes. White matter hyperintensity volume was defined as the sum of the labeled voxels multiplied by voxel dimensions; regional volumes were calculated within each labeled lobar region-of-interest. In a random subset of 10 participants, test-retest reliability was greater than 0.98 for regional and total WMH volumes. All imaging analyses were completed without knowledge of mutation status and demographic and clinical data.
In a subset of participants, T2*-weighted MR images were analyzed at the Mayo Clinic (Rochester, MN) for presence of cerebral microbleeds. We operationally defined possible cerebral amyloid angiopathy (CAA) as the presence of at least one cerebral microbleed according to the Boston criteria17. We examined whether the presence of cerebral microbleeds mediated the hypothesized relationship between WMH and mutation status.
Statistical analysis
Demographic and clinical variables were compared between mutation carriers and non-carriers with t-tests and Chi-squared analysis for continuous and categorical data, respectively. We explored the relationship between total WMH volume and CSF-derived AD biomarkers with Spearman’s rank order correlations stratified by mutation status. To test whether WMH volume differed by mutation type, we used a general linear model that examined the interaction between Carrier Status (carrier vs. non-carrier) and familial Mutation Type (PSEN1, PSEN2, APP). We employed piecewise linear mixed effect regression with an inflection point as a parameter18 to examine the total and regional WMH volumes with respect to estimated years from symptom onset, controlling for participant family as a random effect. The primary parameter of interest was the interaction between Mutation Status and EYO, which would demonstrate that WMH volume is increasing among mutation carriers at a rate that is greater than non-mutation carriers. The inclusion of the inflection point as an additional parameter, in the context of a significant interaction, tests whether there is a point within the time period at which at which the association between EYO and WMH volume begins to diverge between mutation carriers and non-carriers. The inflection point was selected based on Bayesian Information Criterion (BIC)19; we tested whether the inclusion of the inflection point significantly improved the model fit compared with the model without the inflection point with the likelihood ratio test (LRT)20. Overall model fits were also determined with the LRT. Similar analyses were run with CSF measures of Aβ1-42 (a marker of β-amyloid), ptau181 (a presumed marker of neurofibrillary tangles), and the ratio of Aβ1-42 to ptau181, in order to compare the timing and ordering among the biomarkers. Analyses involving WMH were also re-run controlling for ptau181 (Model 2) or Aβ1-42 (Model 3). Analyses were re-run after the inclusion of participant age and APOE-ε4 status as additional covariates to ensure that the primary observations were not confounded by these factors. Similarly we compared vascular risk histories between mutation carriers and non-carriers and computed a vascular risk summary score by adding the dichotomous variables together. This score was considered as a covariate in subsequent analyses. For visualization, LOESS regression analysis21 was conducted and the estimates and their 95% confidence limits were drawn. Statistical analyses were conducted with the use of the PROC MIXED and SGPLOT procedures in SAS software, version 9.3 (SAS Institute). We tested the differences in total and regional WMH volumes in individuals with CDR scores of 0 with a general linear model, adjusting for participant’s age, to ensure that differences between groups were not related to the inclusion of symptomatic individuals. Prior to statistical analyses, total and regional WMH volumes underwent inverse hyperbolic transformation because the distributions of these variables were highly positively skewed22.
Similar mixed effects piecewise linear regression and formal testing of mediation was used to examine differences between carriers and non-carriers in presence of cerebral microbleeds and to test the whether the association between WMH and mutation status is dependent on the presence of cerebral microbleeds.
Results
Data from 299 participants of the total DIAN cohort that had passed rigorous quality assurance for Data Freeze 6 were included in these analyses (see Table 1 for demographic, clinical, and biomarker data). There were 184 (61.5%) mutation carriers, including 141 (77%) PSEN1, 15 (8%) PSEN2, and 28 (15%) APP mutation carriers. Mutation carriers and non-carriers were almost identical in age, sex distribution, vascular risk factors, EYO, and frequency of APOE-ε4, but had a greater proportion of symptomatic individuals (i.e., CDR>0). Mutation carriers had greater total, temporal, parietal, and occipital WMH volumes than non-carriers; these differences between mutation carriers and non-carriers remained when restricting the sample to asymptomatic participants (i.e., CDR=0; p<0.05 for total and occipital lobe, p=0.09 for parietal lobe, p=0.11 for temporal lobe). Differences in WMH volume between mutation carriers and non-carriers were not driven by a single mutation type, as evidenced by a significant main effect of Carrier Status (p<0.05) for all regions apart from frontal lobe, and non-significant interactions (p>0.05) between Carrier Status and Mutation Type for all regions. As expected, mutation carriers had lower levels of Aβ1-42 and higher levels of ptau181 compared with non-carriers; these differences remained (p<0.001) when restricting the sample to individuals with CDR scores of 0. Increased total WMH volume was associated with lower Aβ1-42 levels in mutation carriers (r=−0.190, p=0.01) but not in non-carriers (r=−0.053, p=0.623; see Figure 1). White matter hyperintensity volume was not related to ptau181 levels in mutation carriers (r=−0.090, p=0.162) or in mutation non-carriers (r=−0.025, p=0.813). Descriptive statistics for WMH volume, including median, first quartile, third quartile, and interquartile range are presented in Table 2.
Table 1.
Demographic, clinical, and biomarker data in mutation carriers and non-carriers.
| Mutation non-carriers | Mutation carriers | Total sample | Statistic | ||
|---|---|---|---|---|---|
| N | 115 | 184 | 299 | ||
| Age, mean years ± SD | 39.95 ± 9.93 | 39.09 ± 10.29 | 39.03 ± 10.13 | t=0.115, p=0.908 | |
| EYO, mean years ± SD | −7.86 ± 11.57 | −7.39 ± 9.51 | −7.57 ± 10.34 | t=0.385, p=0.703 | |
| Women, n(%) | 65 (56.5%) | 104 (56.5%) | 169 (56.5%) | χ2=0.00, p=1.00 | |
| Vascular factors | Hypertension | 17 (15%) | 18 (10%) | 35 (12%) | χ2=1.3, p=0.26 |
| Hypercholesterolemia | 20 (17%) | 28 (15%) | 48 (16%) | χ2=0.09, p=0.77 | |
| Diabetes | 2 (1.7%) | 3 (1.6%) | 5 (1.7%) | χ2=0.005, p=0.94 | |
| Smoking | 49 (43%) | 74 (40%) | 123 (41%) | χ2=0.08, p=0.77 | |
| CDR | 0 | 107 (93%) | 114 (62%) | 221 (74%) | χ2=37.31, p<0.001 |
| 0.5 | 8 (7%) | 43 (23%) | 51 (17%) | ||
| 1 | 0 (0%) | 20 (11%) | 20 (6.67%) | ||
| 2 | 0 (0%) | 5 (3%) | 5 (1.67%) | ||
| 3 | 0 (0%) | 2 (1%) | 2 (0.67%) | ||
| APOE-epsiv;4+ | 33 (29%) | 56 (30.4%) | 89 (30%) | χ2=0.102, p=0.749 | |
| WMH, mean IHS ± SD§ | Frontal | 0.15 ± 0.34 | 0.47 ± 2.92 | 0.35 ± 2.30 | t=1.44, p=0.151 |
| Temporal | 0.02 ± 0.11 | 0.12 ± 0.48 | 0.08 ± 0.39 | t=2.62, p=0.009 | |
| Parietal | 0.06 ± 0.25 | 0.41 ± 2.29 | 0.27 ± 1.811 | t=2.05, p=0.042 | |
| Occipital | 0.09 ± 0.16 | 0.33 ± 0.77 | 0.24 ± 0.62 | t=4.08, p<0.001 | |
| Total | 0.39 ± 0.73 | 1.42 ± 6.02 | 1.03 ± 4.77 | t=2.29, p=0.023 | |
| CSF Aβ1-42*§ | 411.40 ± 113.49 | 304.50 ± 156.85 | 343.93 ± 151.25 | t=6.14, p<0.001 | |
| CSF ptau181¥§ | 29.93 ± 10.18 | 65.58 ± 37.79 | 52.41 ± 35.12 | t=11.14, p<0.001 | |
| CSF Aβ1-42 :tau ratio | 8.123 ± 4.23 | 4.26 ± 4.02 | 5.68 ± 4.49 | t=7.11, p<0.001 | |
Equal variances not assumed because Levene’s Test for Equality of Variances was significant (p<0.01)
Available for n=244
Available for n=249
EYO=estimated years to symptom onset, CDR=Clinical Dementia Rating scale, WMH=white matter hyperintensities, IHS=inverse hyperbolic sine
Figure 1.

Correlation between total WMH volume and Aβ1-42, plotted separately for mutation carriers and non-carriers. The relationship was significant (r=−0.26, p=0.0012) for carriers but not for non-carriers (r=−0.053, p=0.623). Shaded areas represent 95% confidence intervals. IHS=inverse hyperbolic sine transformation.
Table 2.
Descriptive statistics of WMH volume (in cm3), including median, first quartile (Q1), third quartile (Q3), and interquartile range for tight bands of participants defined by estimated years to symptom onset and stratified by mutation status.
| Mutation non-carrier | Mutation carrier | Total | |||||||||||||
|---|---|---|---|---|---|---|---|---|---|---|---|---|---|---|---|
|
| |||||||||||||||
| EYO | N | Med | Q1 | Q3 | IQR | N | Med | Q1 | Q3 | IQR | N | Med | Q1 | Q3 | IQR |
| −30 to −20 y | 13 | 0.19 | 0.04 | 0.44 | 0.40 | 18 | 0.41 | 0.19 | 0.72 | 0.54 | 31 | 0.24 | 0.04 | 0.72 | 0.68 |
| −20 to −10 y | 40 | 0.35 | 0.05 | 0.79 | 0.74 | 52 | 0.29 | 0.05 | 0.81 | 0.76 | 92 | 0.34 | 0.05 | 0.80 | 0.75 |
| −10 to 0 y | 36 | 0.23 | 0.05 | 0.75 | 0.70 | 73 | 0.37 | 0.09 | 1.01 | 0.91 | 109 | 0.32 | 0.05 | 0.97 | 0.92 |
| 0 to 10 y | 15 | 0.08 | 0.00 | 0.36 | 0.36 | 35 | 0.43 | 0.00 | 1.93 | 1.93 | 50 | 0.29 | 0.00 | 1.10 | 1.10 |
| 10 to 21 y | 11 | 0.27 | 0.00 | 0.48 | 0.48 | 6 | 0.55 | 0.13 | 2.12 | 1.99 | 17 | 0.27 | 0.10 | 0.51 | 0.41 |
|
| |||||||||||||||
| Total | 115 | 0.24 | 0.04 | 0.66 | 0.62 | 184 | 0.37 | 0.07 | 0.97 | 0.90 | 299 | 0.31 | 0.05 | 0.89 | 0.84 |
Results of the piecewise linear mixed effect analyses revealed a reliable increase in total WMH volume among mutation carriers (significant Mutation Status by EYO interactions) with an inflection point occurring approximately 6.6 years prior to estimated symptom onset (EYO−6.6; see Figure 2 and Supplementary Table). When we examined the regional distribution of WMH, significant effects emerged in the parietal and occipital lobes. For the parietal lobe, much like total WMH volume, the inflection point occurred approximately seven years prior to estimated symptom onset (EYO −7). For the occipital lobes, the inflection point occurred approximately 22 years prior to estimated symptom onset (EYO −22; see Figure 3). Cerebrospinal fluid levels of Aβ1-42, ptau181, and Aβ1-42 to ptau181 ratio levels appeared to diverge in mutation carriers approximately 30, 26, and 29 years prior to estimated symptom onset, respectively. Thus, in terms of ordering and staging, the results suggest that total WMH volumes are increased reliably after amyloid and tau abnormalities are detectable but prior to symptom onset. Regionally, posterior WMH volume increases in mutation carriers at about the same time that CSF ptau181 and CSF amyloid changes occur. When adjusting for CSF AD biomarkers, total WMH volumes remained significantly elevated in mutation carriers when controlling for ptau181 levels but not when controlling for Aβ1-42 levels. Figure 4 displays representative examples of WMH in mutation carriers and non-carriers across three EYO time points. When all analyses were repeated with age and APOE-ε4 status as additional covariates (data not shown) none of the primary observations were altered and the additional covariate parameters were not statistically significant. Similarly, when the analyses were re-run with the vascular risk summary score none of the primary observations changed. When we examined the potential contribution of CAA among a subset of participants (n=175), we found that mutation carriers were more likely to have cerebral microbleeds than non-carriers (20% vs. 6%, p<0.05) and individuals with microbleeds had higher WMH volume than those without (p<0.05). White matter hyperintensity volume was increased in mutation carriers, up to 20 years prior to EYO, after controlling for microbleed status. Total WMH also remained significantly elevated in mutation carriers even after exclusion of individuals with microbleeds from the study sample. Formal testing of mediation demonstrated that 21% of the association between mutation status and WMH was mediated by presence of microbleeds (p=0.03) but a significant direct effect of WMH remained (p=0.02) after controlling for presence of microbleeds.
Figure 2.

Association between estimated year from symptom onset and total WMH volume in mutation carriers and non-carriers. Mutation carriers had greater total WMH volume; differences in WMH volume between groups began increasing systematically approximately 6.6 years prior to estimated symptom onset (inflection point: −6.6 EYO, indicated by arrow on x-axis). Shaded areas represent 95% confidence intervals. Arrow indicates the inflection point in the analysis. IHS=inverse hyperbolic sine transformation.
Figure 3.

Association between estimated year from symptom onset and regional WMH volumes and AD biomarkers in mutation carriers and non-carriers. In all cases, mutation carriers had more severe biomarker burden; the point at which differences between groups begin to increase systematically (i.e., inflection point) is indicated by an arrow on the x-axis. A: frontal lobe WMH volume (inflection point=−3.0 EYO); B: temporal lobe WMH volume (inflection point=−1.3 EYO); C: parietal lobe WMH volume (inflection point=−7.0 EYO); D: occipital lobe WMH volume (inflection point=−22.0 EYO); E: Aβ42 (inflection point=−30.1 EYO); F: ptau181 (inflection point=−26.0 EYO). Shaded areas represent 95% confidence intervals. IHS=inverse hyperbolic sine transformation.
Figure 4.
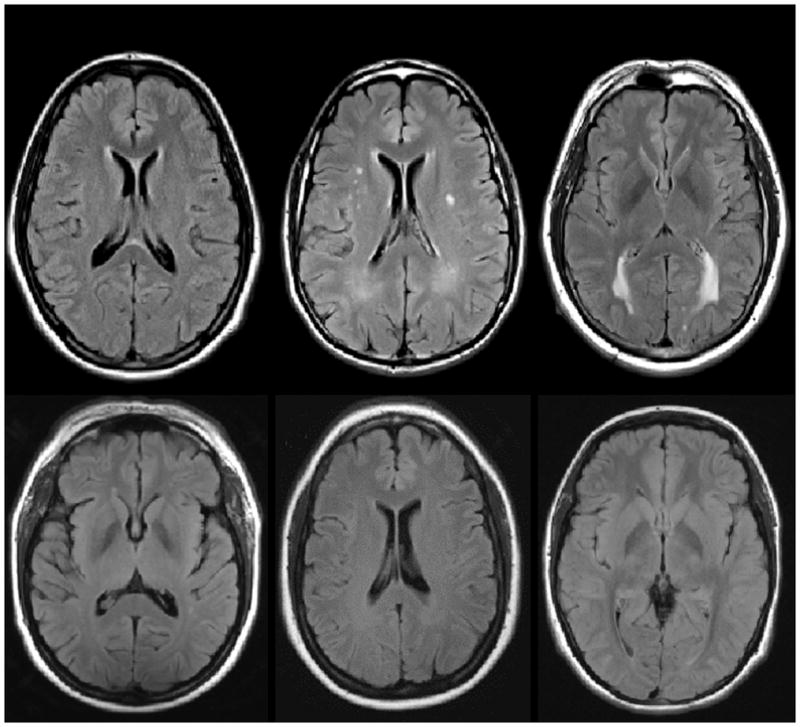
Examples of WMH distribution in mutation carriers (upper row) and non-carriers (lower row) across three EYO time points. The top row displays examples of T2-weighted FLAIR MRI scans from three mutation carriers at varying estimated years from symptom onset. The bottom row displays examples of MRI scans from non-carriers matched for estimated years from symptom onset (based on parental age of onset). All participants displayed in this figure had CDR scores of 0 at the time of MRI scan.
Discussion
We found that total WMH volume is significantly elevated among individuals with autosomal dominant genetic mutations for AD approximately six years prior to their estimated age of symptom onset. When considered regionally, WMH volume distributed in posterior brain areas is selectively elevated among mutation carriers about 22 years prior to estimated symptom onset. Together with the previous studies that have implicated WMH, particularly in posterior regions, in risk and progression of clinical symptomatology of LOAD 16, 23, our study suggests that WMH are an important feature of AD. Because mutation carriers and non-carriers in the current study are relatively young, virtually identical demographically, and at identical risk for inheriting an autosomal dominant mutation by virtue of having a parent with a mutation, the findings provide strong evidence that WMH in this population do not reflect comorbidity or other pathophysiology but rather reflect primary pathogenic processes in AD. The results highlight the potential role of regionally distributed WMH in AD and point to new avenues of investigation for preventative or treatment strategies.
In the context of other AD biomarkers, WMH appear to emerge globally after measurable changes in CSF Aβ1-42 and ptau181 but prior to symptom onset, although WMH distributed in posterior brain areas appear elevated at about the same time as tau and Aβ1-42 differences. These findings should be interpreted in the context of wide confidence intervals, and therefore relatively lower reliability, related to the inflection point analyses. White matter hyperintensity volume correlated with CSF Aβ1-42 but not ptau181, and when controlling for Aβ1-42 in our primary analyses, elevation of WMH associated with mutation status was attenuated. These results first suggest that WMH and beta amyloid pathology share some degree of dependency. We24 and others25, 26 have shown previously that WMH volume and markers of fibrillar amyloid pathology are related to each other in the context of LOAD, though others have not27. This study confirms that the two biomarkers are related to each other in individuals with definite pre-clinical AD. Second, they suggest that WMH do not result primarily from tau-related neurodegeneration, although the extent to which WMH are related to axonal damage secondary to tau abnormalities cannot be ruled out entirely by these analyses. We showed in ADNI that WMH severity predicts future CSF tau increases and neurodegenerative changes but that CSF tau levels do not predict future WMH accumulation28. We found that CSF Aβ1-42is levels appear to be initially higher followed by a rapid decline as a function of EYO in mutation carriers compared with non-carriers (see Figure 3), suggesting that Aβ1-42 are abnormally elevated and begin to decline prior to increases in tau. It is important to note that because the analyses were cross-sectional, the determination of an inflection point was estimated and variable, and we were unable to model the subject-specific trajectories, which would require longitudinal data. Nonetheless, in all cases but one (the statistical model in which we controlled for Aβ1-42, see Supplementary Table), inclusion of the inflection point significantly improved the model fit. Furthermore, our approach determined definitively that the relationship between estimated time to symptom onset and WMH volume differed between mutation carriers and non-carriers (i.e., significant Mutation Status by EYO interactions) and, much like previous work in DIAN 11, allowed us to compare the evolution of WMH compared with the other biological markers.
White matter hyperintensities are generally considered markers of small vessel cerebrovascular disease29, 30, although it is important to point out that non-ischemic damage that causes increased fluid motion in discrete areas in the white matter can result in hyperintense signal. Pathogenic mechanisms are not known completely, but a recent genetic meta-analysis suggested a role of blood pressure regulation, Aβ-related neurotoxicity, neuroinflammation, and glial cell activation31. Pathological correlates, immunohistochemical, and gene expression studies suggest demyelination, axonal loss, gliosis, vacuolation, microglial activation, arteriolosclerosis, and blood brain barrier dysfunction are secondary to ischemic injury in areas appearing radiographically as WMH 2. The pathophysiology of WMH is likely heterogeneous and only one study to our knowledge has examined the pathological correlates of WMH among individuals with autosomal dominant forms of AD, in whom the mediators of WMH might differ somewhat32. In that report, WMH burden correlated with the severity of cerebral amyloid angiopathy in the temporal lobes, leptomeningeal blood vessel diameter, and lower density of CD68-positive microglia in the parietal lobes among 10 individuals with PSEN1 mutations. Given the propensity for a posterior distribution of WMH we found in mutation carriers, cerebral amyloid angiopathy, which also tends to be distributed in posterior brain regions, is present among individuals with autosomal dominant forms of AD years before symptoms onset, and correlates with severity of WMH33, may be one mediating factor in these observations. Similarly, one previous report suggests that the WMH severity correlates with severity of fibrillar forms of amyloid pathology among individuals with CAA but not LOAD34, again suggesting an influence of CAA on the observed relationship between WMH volume and Aβ1-42 levels, and we could speculate that CAA may be one causative factor in the parenchymal deposition of Aβ. Although in the current study there was some co-dependency between WMH and presence of at least one cerebral microbleed, the observed increases in WMH among mutation carriers did not appear to be fully mediated by this marker of cerebral amyloid angiopathy. Loss of axons, myelin pallor, and diffuse Aβ has also been observed pathologically in the white matter of patients with autosomal dominant AD and LOAD and in animal models of the disease35–38. Alzheimer’s-related failure of the axonal machinery due to mitochondrial dysfunction, white matter astroglial proliferation, venous collagenosis, and damage to oligodendrocytes and their progenitor cells are other possible pathological correlates of our results36, 39–42. Clearly more work relating radiological white matter abnormalities to pathological phenomena is necessary.
White matter hyperintensities are quite common in normal aging43 and have been implicated in non-Alzheimer’s forms of cognitive impairment and dementia44. Thus, the question of the extent to which WMH represent a specific biomarker for AD or for its clinical instantiation is valid and consistent with the conceptualization of other AD biomarkers. For example, increased beta amyloid pathology is observed in up to 40% of older individuals with no evidence of dementia 45, 46; tau pathology is common in aging, in several neurodegenerative diseases, and in chronic traumatic brain injury 47–49, albeit with differing regional patterns across conditions; and regional atrophy is characteristic of LOAD 50, but is also common in normal aging 51. Our observations, together with previous work that has implicated WMH in late onset AD, suggest the possibility that WMH could be incorporated more formally into proposed hypothetical models of disease pathogenesis, such as those proposed by Jack and colleagues4. The definitive relationship we observed between increased WMH and autosomal dominant forms of AD should motivate continued research on the involvement of white matter abnormalities with the disease, including examination of mechanistic interactions with other putative AD biomarkers.
Supplementary Material
Acknowledgments
Funding. NIH/NIA U19 AG032438, NIHR Queen Square Dementia BRU, Seonjoo Lee is supported by NIH/NIA AG051348, German Center for Neurodegenerative Diseases (DZNE), Natalie Ryan is supported by a Brain Exit Foundation Fellowship. Work partially supported by the NIHR Queen Square Dementia BRU.
Footnotes
Author contributions
Conception and design of the study: SL, FV, MEZ, GT, TLSB, RJB, JCM, RM, AMB
Acquisition/analysis of data: SL, AN, GT, TLSB, DSM, AMF, AG, NCF, NJC, DMH, VB, BG, EM, RNM, AJS, CLM, JMR, NSR, SF, CL, PRS, RAS, SS, SC, CJ, MW, RJB, JCM, RM, AMB
Drafting manuscript or figures: SL, FV, MEZ, GT, AMB
Potential conflicts of interest
SL, FV, MEZ, AN, GT, TLSB, DSM, AF, AG, NJC, DMH, VB, BG, EM, RNM, AJS, CLM, JMR, NR, SF, CL, PRS, SS, SC, CJ, RJB, JCM, RM, and AMB have no relevant conflicts of interest
NF consults for Eli Lilly, Novartis, Sanofi, Roche, and GSK, which may conduct trials in autosomal dominant AD
RAS receives research support from Eli Lilly which manufactures solanezumab, being studied for the treatment of Alzheimer’s disease in the DIAN Study, and from Avid, who manufactures florbetapir, a PET tracer to detect amyloid, that is being used in the DIAN Study.
MW provides consulting to Eli Lilly, which makes an amyloid PET ligand. Eli Lilly is testing anti-amyloid treatments for Alzheimer’s disease.
References
- 1.Debette S, Markus HS. The clinical importance of white matter hyperintensities on brain magnetic resonance imaging: systematic review and meta-analysis. BMJ. 2010;341:c3666. doi: 10.1136/bmj.c3666. [DOI] [PMC free article] [PubMed] [Google Scholar]
- 2.Wardlaw JM, Valdes Hernandez MC, Munoz-Maniega S. What are White Matter Hyperintensities Made of? Relevance to Vascular Cognitive Impairment. J Am Heart Assoc. 2015;4(6) doi: 10.1161/JAHA.114.001140. [DOI] [PMC free article] [PubMed] [Google Scholar]
- 3.Brickman AM. Contemplating Alzheimer’s disease and the contribution of white matter hyperintensities. Curr Neurol Neurosci Rep. 2013 Dec;13(12):415. doi: 10.1007/s11910-013-0415-7. [DOI] [PMC free article] [PubMed] [Google Scholar]
- 4.Jack CR, Jr, Knopman DS, Jagust WJ, et al. Tracking pathophysiological processes in Alzheimer’s disease: an updated hypothetical model of dynamic biomarkers. Lancet Neurol. 2013 Feb;12(2):207–16. doi: 10.1016/S1474-4422(12)70291-0. [DOI] [PMC free article] [PubMed] [Google Scholar]
- 5.Lindemer ER, Salat DH, Smith EE, Nguyen K, Fischl B, Greve DN. White matter signal abnormality quality differentiates mild cognitive impairment that converts to Alzheimer’s disease from nonconverters. Neurobiol Aging. 2015 May 28; doi: 10.1016/j.neurobiolaging.2015.05.011. [DOI] [PMC free article] [PubMed] [Google Scholar]
- 6.Brickman AM, Provenzano FA, Muraskin J, et al. Regional white matter hyperintensity volume, not hippocampal atrophy, predicts incident Alzheimer disease in the community. Arch Neurol. 2012 Dec;69(12):1621–7. doi: 10.1001/archneurol.2012.1527. [DOI] [PMC free article] [PubMed] [Google Scholar]
- 7.Zlokovic BV. Neurovascular pathways to neurodegeneration in Alzheimer’s disease and other disorders. Nat Rev Neurosci. 2011;12(12):723–38. doi: 10.1038/nrn3114. [DOI] [PMC free article] [PubMed] [Google Scholar]
- 8.White L. Brain lesions at autopsy in older Japanese-American men as related to cognitive impairment and dementia in the final years of life: a summary report from the Honolulu-Asia aging study. J Alzheimers Dis. 2009;18(3):713–25. doi: 10.3233/JAD-2009-1178. [DOI] [PubMed] [Google Scholar]
- 9.Schneider JA, Arvanitakis Z, Bang W, Bennett DA. Mixed brain pathologies account for most dementia cases in community-dwelling older persons. Neurology. 2007 Dec 11;69(24):2197–204. doi: 10.1212/01.wnl.0000271090.28148.24. [DOI] [PubMed] [Google Scholar]
- 10.Cairns NJ, Perrin RJ, Franklin EE, et al. Neuropathologic assessment of participants in two multi-center longitudinal observational studies: The Alzheimer Disease Neuroimaging Initiative (ADNI) and the Dominantly Inherited Alzheimer Network (DIAN) Neuropathology. 2015 Aug;35(4):390–400. doi: 10.1111/neup.12205. [DOI] [PMC free article] [PubMed] [Google Scholar]
- 11.Bateman RJ, Xiong C, Benzinger TL, et al. Clinical and biomarker changes in dominantly inherited Alzheimer’s disease. N Engl J Med. 2012 Aug 30;367(9):795–804. doi: 10.1056/NEJMoa1202753. [DOI] [PMC free article] [PubMed] [Google Scholar]
- 12.Ryman DC, Acosta-Baena N, Aisen PS, et al. Symptom onset in autosomal dominant Alzheimer disease: a systematic review and meta-analysis. Neurology. 2014 Jul 15;83(3):253–60. doi: 10.1212/WNL.0000000000000596. [DOI] [PMC free article] [PubMed] [Google Scholar]
- 13.Morris JC, Aisen PS, Bateman RJ, et al. Developing an international network for Alzheimer research: The Dominantly Inherited Alzheimer Network. Clin Investig (Lond) 2012 Oct 1;2(10):975–84. doi: 10.4155/cli.12.93. [DOI] [PMC free article] [PubMed] [Google Scholar]
- 14.Morris JC, Ernesto C, Schafer K, et al. Clinical dementia rating training and reliability in multicenter studies: the Alzheimer’s Disease Cooperative Study experience. Neurology. 1997 Jun;48(6):1508–10. doi: 10.1212/wnl.48.6.1508. [DOI] [PubMed] [Google Scholar]
- 15.Jack CR, Jr, Bernstein MA, Borowski BJ, et al. Update on the magnetic resonance imaging core of the Alzheimer’s disease neuroimaging initiative. Alzheimers Dement. 2010 May;6(3):212–20. doi: 10.1016/j.jalz.2010.03.004. [DOI] [PMC free article] [PubMed] [Google Scholar]
- 16.Brickman AM, Zahodne LB, Guzman VA, et al. Reconsidering harbingers of dementia: progression of parietal lobe white matter hyperintensities predicts Alzheimer’s disease incidence. Neurobiol Aging. 2015 Jan;36(1):27–32. doi: 10.1016/j.neurobiolaging.2014.07.019. [DOI] [PMC free article] [PubMed] [Google Scholar]
- 17.Knudsen KA, Rosand J, Karluk D, Greenberg SM. Clinical diagnosis of cerebral amyloid angiopathy: validation of the Boston criteria. Neurology. 2001;56(4):537–9. doi: 10.1212/wnl.56.4.537. [DOI] [PubMed] [Google Scholar]
- 18.McZgee VE, Carleton WT. Piecewise regression. Journal of the American Statistical Association. 1970;65(331):1109–24. [Google Scholar]
- 19.Kim HJ, Yu B, Feuer EJ. SELECTING THE NUMBER OF CHANGE-POINTS IN SEGMENTED LINE REGRESSION. Stat Sin. 2009 May 1;19(2):597–609. [PMC free article] [PubMed] [Google Scholar]
- 20.Piepho HP, Ogutu JO. Inference for the break point in segmented regression with application to longitudinal data. Biometrical Journal. 2003;45(5):591–601. [Google Scholar]
- 21.Cleveland WS. Robust locally-weighted regression and smoothing scatterplots. Journal of the American Statistical Association. 1979;74:829–36. [Google Scholar]
- 22.Burbridge JB, Magee L, Robb AL. Alternative transformations to handle extreme values of the dependent variable. Journal of the American Statistical Association. 1988;83(401):123–7. [Google Scholar]
- 23.Prins ND, Scheltens P. White matter hyperintensities, cognitive impairment and dementia: an update. Nat Rev Neurol. 2015 Mar;11(3):157–65. doi: 10.1038/nrneurol.2015.10. [DOI] [PubMed] [Google Scholar]
- 24.Brickman AM, Guzman VA, Gonzalez-Castellon M, et al. Cerebral autoregulation, beta amyloid, and white matter hyperintensities are interrelated. Neurosci Lett. 2015 Apr 10;592:54–8. doi: 10.1016/j.neulet.2015.03.005. [DOI] [PMC free article] [PubMed] [Google Scholar]
- 25.Grimmer T, Faust M, Auer F, et al. White matter hyperintensities predict amyloid increase in Alzheimer’s disease. Neurobiol Aging. 2012 Dec;33(12):2766–73. doi: 10.1016/j.neurobiolaging.2012.01.016. [DOI] [PubMed] [Google Scholar]
- 26.Zhou Y, Yu F, Duong TQ. White matter lesion load is associated with resting state functional MRI activity and amyloid PET but not FDG in mild cognitive impairment and early Alzheimer’s disease patients. J Magn Reson Imaging. 2015 Jan;41(1):102–9. doi: 10.1002/jmri.24550. [DOI] [PMC free article] [PubMed] [Google Scholar]
- 27.Vemuri P, Lesnick TG, Przybelski SA, et al. Vascular and amyloid pathologies are independent predictors of cognitive decline in normal elderly. Brain. 2015 Mar;138(Pt 3):761–71. doi: 10.1093/brain/awu393. [DOI] [PMC free article] [PubMed] [Google Scholar]
- 28.Tosto G, Zimmerman ME, Hamilton JL, Carmichael OT, Brickman AM Alzheimer’s Disease Neuroimaging I. The effect of white matter hyperintensities on neurodegeneration in mild cognitive impairment. Alzheimers Dement. 2015 Jun 13; doi: 10.1016/j.jalz.2015.05.014. [DOI] [PMC free article] [PubMed] [Google Scholar]
- 29.Erten-Lyons D, Woltjer R, Kaye J, et al. Neuropathologic basis of white matter hyperintensity accumulation with advanced age. Neurology 2013. 2013 Sep 10;81(11):977–83. doi: 10.1212/WNL.0b013e3182a43e45. [DOI] [PMC free article] [PubMed] [Google Scholar]
- 30.Shim YS, Yang DW, Roe CM, et al. Pathological correlates of white matter hyperintensities on magnetic resonance imaging. Dement Geriatr Cogn Disord. 2015;39(1–2):92–104. doi: 10.1159/000366411. [DOI] [PMC free article] [PubMed] [Google Scholar]
- 31.Verhaaren BF, Debette S, Bis JC, et al. Multiethnic genome-wide association study of cerebral white matter hyperintensities on MRI. Circ Cardiovasc Genet. 2015 Apr;8(2):398–409. doi: 10.1161/CIRCGENETICS.114.000858. [DOI] [PMC free article] [PubMed] [Google Scholar]
- 32.Ryan NS, Biessels GJ, Kim L, et al. Genetic determinants of white matter hyperintensities and amyloid angiopathy in familial Alzheimer’s disease. Neurobiol Aging. doi: 10.1016/j.neurobiolaging.2015.08.026. in press. [DOI] [PubMed] [Google Scholar]
- 33.Thanprasertsuk S, Martinez-Ramirez S, Pontes-Neto OM, et al. Posterior white matter disease distribution as a predictor of amyloid angiopathy. Neurology. 2014 Aug 26;83(9):794–800. doi: 10.1212/WNL.0000000000000732. [DOI] [PMC free article] [PubMed] [Google Scholar]
- 34.Gurol ME, Viswanathan A, Gidicsin C, et al. Cerebral amyloid angiopathy burden associated with leukoaraiosis: a positron emission tomography/magnetic resonance imaging study. Ann Neurol. 2013 Apr;73(4):529–36. doi: 10.1002/ana.23830. [DOI] [PMC free article] [PubMed] [Google Scholar]
- 35.Takao M, Ghetti B, Murrell JR, et al. Ectopic white matter neurons, a developmental abnormality that may be caused by the PSEN1 S169L mutation in a case of familial AD with myoclonus and seizures. J Neuropathol Exp Neurol. 2001 Dec;60(12):1137–52. doi: 10.1093/jnen/60.12.1137. [DOI] [PubMed] [Google Scholar]
- 36.Sun SW, Song SK, Harms MP, et al. Detection of age-dependent brain injury in a mouse model of brain amyloidosis associated with Alzheimer’s disease using magnetic resonance diffusion tensor imaging. Exp Neurol. 2005 Jan;191(1):77–85. doi: 10.1016/j.expneurol.2004.09.006. [DOI] [PubMed] [Google Scholar]
- 37.Collins-Praino L, Francis Y, Wiegman AF, et al. Soluble amyloid beta levels are elevated in the white matter of Alzheimer’s patietns, independent of cortical plaque burden. Acta Neuropathologica Communications. 2014;2:83. doi: 10.1186/s40478-014-0083-0. [DOI] [PMC free article] [PubMed] [Google Scholar]
- 38.Brendza RP, O’Brien C, Simmons K, et al. PDAPP; YFP double transgenic mice: a tool to study amyloid-beta associated changes in axonal, dendritic, and synaptic structures. J Comp Neurol. 2003 Feb 17;456(4):375–83. doi: 10.1002/cne.10536. [DOI] [PubMed] [Google Scholar]
- 39.Behrendt G, Baer K, Buffo A, et al. Dynamic changes in myelin aberrations and oligodendrocyte generation in chronic amyloidosis in mice and men. Glia. 2013 Feb;61(2):273–86. doi: 10.1002/glia.22432. [DOI] [PubMed] [Google Scholar]
- 40.Leuba G, Kraftsik R. Visual cortex in Alzheimer’s disease: occurrence of neuronal death and glial proliferation, and correlation with pathological hallmarks. Neurobiol Aging. 1994 Jan-Feb;15(1):29–43. doi: 10.1016/0197-4580(94)90142-2. [DOI] [PubMed] [Google Scholar]
- 41.Reddy PH. Abnormal tau, mitochondrial dysfunction, impaired axonal transport of mitochondria, and synaptic deprivation in Alzheimer’s disease. Brain Res. 2011;1415:136–48. doi: 10.1016/j.brainres.2011.07.052. [DOI] [PMC free article] [PubMed] [Google Scholar]
- 42.Pantoni L. Cerebral small vessel disease: from pathogenesis and clinical characteristics to therapeutic challenges. The Lancet Neurology. 2010 Jul;9(7):689–701. doi: 10.1016/S1474-4422(10)70104-6. [DOI] [PubMed] [Google Scholar]
- 43.DeCarli C, Massaro J, Harvey D, et al. Measures of brain morphology and infarction in the framingham heart study: establishing what is normal. Neurobiol Aging. 2005 Apr;26(4):491–510. doi: 10.1016/j.neurobiolaging.2004.05.004. [DOI] [PubMed] [Google Scholar]
- 44.Gorelick PB, Scuteri A, Black SE, et al. Vascular contributions to cognitive impairment and dementia: a statement for healthcare professionals from the american heart association/american stroke association. Stroke. 2011 Sep;42(9):2672–713. doi: 10.1161/STR.0b013e3182299496. [DOI] [PMC free article] [PubMed] [Google Scholar]
- 45.Bennett DA, Schneider JA, Arvanitakis Z, et al. Neuropathology of older persons without cognitive impairment from two community-based studies. Neurology. 2006 Jun 27;66(12):1837–44. doi: 10.1212/01.wnl.0000219668.47116.e6. [DOI] [PubMed] [Google Scholar]
- 46.Aizenstein HJ, Nebes RD, Saxton JA, et al. Frequent amyloid deposition without significant cognitive impairment among the elderly. Arch Neurol. 2008 Nov;65(11):1509–17. doi: 10.1001/archneur.65.11.1509. [DOI] [PMC free article] [PubMed] [Google Scholar]
- 47.DeKosky ST, Blennow K, Ikonomovic MD, Gandy S. Acute and chronic traumatic encephalopathies: pathogenesis and biomarkers. Nat Rev Neurol. 2013 Apr;9(4):192–200. doi: 10.1038/nrneurol.2013.36. //print. [DOI] [PMC free article] [PubMed] [Google Scholar]
- 48.Crary JF, Trojanowski JQ, Schneider JA, et al. Primary age-related tauopathy (PART): a common pathology associated with human aging. Acta Neuropathol. 2014 Dec;128(6):755–66. doi: 10.1007/s00401-014-1349-0. [DOI] [PMC free article] [PubMed] [Google Scholar]
- 49.McKee AC, Stein TD, Kiernan PT, Alvarez VE. The neuropathology of chronic traumatic encephalopathy. Brain Pathol. 2015 May;25(3):350–64. doi: 10.1111/bpa.12248. [DOI] [PMC free article] [PubMed] [Google Scholar]
- 50.Jack CR, Jr, Petersen RC, O’Brien PC, Tangalos EG. MR-based hippocampal volumetry in the diagnosis of Alzheimer’s disease. Neurology. 1992 Jan;42(1):183–8. doi: 10.1212/wnl.42.1.183. [DOI] [PubMed] [Google Scholar]
- 51.Raz N, Lindenberger U, Rodrigue KM, et al. Regional Brain Changes in Aging Healthy Adults: General Trends, Individual Differences and Modifiers. Cereb Cortex 2005. 2005 Nov 1;15(11):1676–89. doi: 10.1093/cercor/bhi044. [DOI] [PubMed] [Google Scholar]
Associated Data
This section collects any data citations, data availability statements, or supplementary materials included in this article.