Abstract
The inability to maintain balance during varying postural control conditions can lead to falls, a significant cause of mortality and serious injury among older adults. However, our understanding of the underlying dynamical and stochastic processes in human postural control have not been fully explored. To further our understanding of the underlying dynamical processes, we examine a novel conceptual framework for studying human postural control using the center of pressure (COP) velocity autocorrelation function (COP-VAF) and compare its results to Stabilogram Diffusion Analysis (SDA). Eleven healthy young participants were studied under quiet unipedal or bipedal standing conditions with eyes either opened or closed. COP trajectories were analyzed using both the traditional posturographic measure SDA and the proposed COP-VAF. It is shown that the COP-VAF leads to repeatable, physiologically meaningful measures that distinguish postural control differences in unipedal versus bipedal stance trials with and without vision in healthy individuals. More specifically, both a unipedal stance and lack of visual feedback increased initial values of the COP-VAF, magnitude of the first minimum, and diffusion coefficient, particularly in contrast to bipedal stance trials with open eyes. Use of a stochastic postural control model, based on an Ornstein-Uhlenbeck process that accounts for natural weight-shifts, suggests an increase in spring constant and decreased damping coefficient when fitted to experimental data. This work suggests that we can further extend our understanding of the underlying mechanisms behind postural control in quiet stance under varying stance conditions using the COP-VAF and provides a tool for quantifying future neurorehabilitative interventions.
Keywords: Postural Control Model, Velocity Autocorrelation Function, Center of Pressure, Stochastic Dynamics
I. Introduction
FALLS are a major source of mortality and serious injury among older adults [1]–[3] and particularly in those with neurological disorders such as Parkinson’s disease [4]–[6]. Given the difficulty in treating balance dysfunction [6], [7], it is imperative to further our understanding of the mechanisms underlying postural control. Postural control is an integral component of daily living, which requires continuous sensorimotor integration (i.e., visual, vestibular, and proprioceptive) when maintaining balance during whole body movements under any self-induced or external perturbation. To maintain balance, continuous adjustments of the location of the center of pressure (COP) under the feet is required [8], particularly when visual feedback is inhibited, as when performing the Romberg test [9], [10].
Postural control is commonly evaluated using COP data collected on a force platform using summary measures of the anteroposterior and mediolateral displacement of the COP within the base of support that ignore the dynamic characteristics of the COP trajectory [11]–[13]. Several studies have introduced nonlinear time series analysis methods to study the stochastic and dynamic characteristics of human postural control [14]–[23]. Stochastic activity of the postural control system has been shown to be sensitive to altered visual conditions, aging, or neurological disorders [24]–[31]. Methods such as the Stabilogram Diffusion Analysis (SDA) [15], [24], [32], [33] assume that the COP during quiet stance can be modeled as a system of coupled, correlated random walks with short-term and long-term scaling exponents that do not change over time. However, this approach would be insufficient to capture temporal variations in stochastic properties and be susceptible to errors from voluntary weight shifts [23], [34]. In addition, SDA requires numerous long duration trials for reliable measures [35] that may be unfeasible for some clinical applications. In contrast to SDA, the COP velocity autocorrelation function (COP-VAF) may provide a more succinct evaluation of the dynamical and stochastic properties of the postural control system while using shorter duration trials [36].
The Ornstein-Uhlenbeck process has often been used to provide a simple model of stochastic behavior. In particular, the transition from a ballistic to diffusive behavior of the mean square displacement of the Ornstein-Uhlenbeck process has provided an excellent description of human postural sway [28], [37], [38]. Prior applications of stochastic models to postural control have often been based on the assumption that quiet standing is characterized by a two-process random-walk consisting of both short term and long term processes [15], [38], [39]. However, recent evidence suggests that a simple closed loop model or continuous diffusion process can reproduce characteristic mean square displacement trajectories in experimental human postural sway data [40]–[42].
In the present study, we further extend the use of statistical mechanics principles in the study of human postural control [14], by reporting a novel measure of postural control: the COP velocity autocorrelation function (COP-VAF). This study examines the changes in the COP-VAF due to alterations in visual and stance conditions and compare with prior findings based on SDA. Furthermore, we introduce a novel model of stochastic human postural control dynamics, based on an Ornstein-Uhlenbeck process incorporating damping, potential, Gaussian random noise, and a time-dependent center for the harmonic restoring force. In contrast to prior applications of the Ornstein-Uhlenbeck process [38]–[40], the model introduced in this study incorporates a time-dependent center for the harmonic restoring force that accounts for the natural weight shifts observed within and between the feet in a bipedal stance [17], [22], [23]. The model introduced in this study allows us to model both slow and fast components of human postural sway and to better understand the importance of neural control on the COP dynamics. This study explores the fidelity of the model to experimental data and provides an analysis of salient modeling parameters on stochastic and dynamic characteristics of the COP, as evaluated by the COP-VAF. In this study, we focus on the insights gained by our computational model to better understand the association between changes in COP-VAF measures and postural control characteristics. The present study furthers our hypothesis that when maintaining balance of an upright stance, the COP can be viewed as the collective movement of a system in a potential field with a preferred location, such as a location farthest from the boundary of the base of support, under the effect of some restorative force.
II. Methods
A. Participants and Protocol
Eleven healthy young participants were recruited for this study (mean ± SD age: 24.4 ± 5.4 yrs, weight: 72.0 ± 16.5 kg, height: 173.9 ± 9.1 cm, 4 females). All participants were right-side dominant with normal or corrected to normal vision. All participants signed an informed consent document approved by the human subjects Institutional Review Board of the University of California, San Diego.
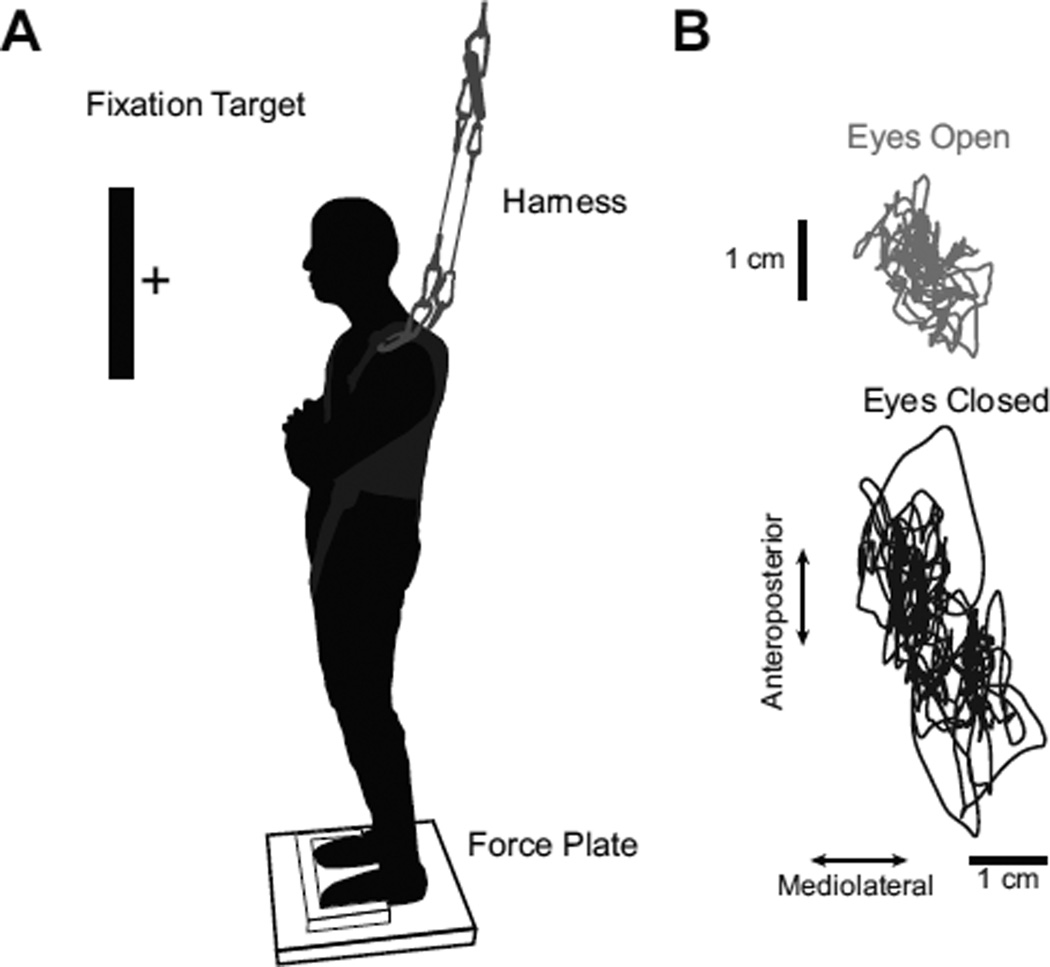
Participants were first asked to stand as still as possible during 80 s trials with either eyes open or closed. Two blocks of four continuous trials with eyes open or closed were counterbalanced in each participant, so as to reduce confounding factors, such as fatigue or learning. Participants were instructed to fold their arms across their chest, and during trials with eyes open, to fixate on a cross (Fig 1). In a second experiment, participants were asked to stand as still as possible on a single leg with either their eyes open or closed and using either their dominant or non-dominant limb for up to twelve 30 s trials. Visual feedback conditions were counterbalanced while the use of dominant and non-dominant limbs was alternated to minimize fatigue and learning. Unipedal stance trials were completed once participants had to put their foot down to regain balance. In between trials, subjects were allowed to rest by standing with both feet, and in all trials, subjects were allowed to rest by sitting in between blocks. All experiments were performed in a single test session with bipedal trials always presented before unipedal stance trials, so as to provide a ramp-up in difficulty.
Fig. 1.
A) Schematic of experimental setup, demonstrating platform used for foot placement, approximate position of fixation target, harness setup, and force plate. B) Representative COP excursion. The figure demonstrates the COP excursion from a representative participant with either eyes open (top) or eyes closed (bottom) during bipedal stance.
B. Hardware
COP data were collected using a ground-level six-channel force plate (AccuGait, AMTI, Watertown, MA). Three-dimensional ground reaction forces and moments were sampled at 100 Hz. A thin wooden platform mounted on top of the force plate was used to provide consistent foot placement on the force plate. Participants were instructed to position the front and sides of their shoes against the wooden platform at the start of each trial, so as to fix the initial stance width to 30.5 cm in all participants. Custom scripts (Vizard, WorldViz LLC, Santa Barbara, CA, USA) were developed to provide a 5-cm fixation target that was displayed on a monitor approximately one meter in front of the participant, at eye level, during eyes open conditions and to coordinate data collection. Participants were additionally fitted with a Neurocom harness (Neurocom, Natus, Clackamas, OR) to a custom ceiling mounted harness system for safety. In order to control for the shoe-floor interface during testing, participants wore standardized canvas shoes with a thin rubber sole. In addition, during this experiment, participants wore a full-body motion capture suit. Kinematic data were collected at a sampling rate of 100 Hz using a 24 camera 3D body motion tracking system (PhaseSpace, Inc., Impulse system, San Leandro, CA). Infrared light-emitting diodes were placed on the right and left leg, over the lateral malleolus, heel, and third metatarsophalangeal joint, femoral epicondyle, and greater trochanter, and left and right acromion.
C. Data Processing and Analysis
Custom Matlab (v7.4, Natick, MA) data processing software routines were written to process the data. Raw force plate data were processed with a 4th order, zero-lag, low-pass Butterworth filter with a 10 Hz cutoff frequency. COP position was calculated as follows: COPx = (−Fxzo − My)/Fz and COPy = (Mx − Fyzo)/Fz, with a correction for the geometric center of the force plate. The COP velocity was calculated using a Savitzky-Golay filter with a five point frame [43].
Traditional posturographic measures consisted of both the anteroposterior (AP) and mediolateral (ML) COP root-mean-square (RMS) displacement, and magnitude of COP velocity. SDA measures were calculated separately for anteroposterior (y), mediolateral (x), and radial (r) directions as described by Collins and De Luca [15]. The diffusion coefficient (D) is an average measure of the stochastic activity of a random walker, while the scaling or Hurst exponent (H) describes the relationship between past and future positions and is calculated using one half of the slope of a log-log plot of the radial mean square displacement (MSD), 〈Δr2〉, as a function of a time delay, τ. The critical point C was defined as the intersection between short (s) and long-term (l) regions of the linear-linear plots, and provides measures of the critical time interval (τc) and critical value [15].
The velocity autocorrelation function is a time dependent function that can be used to reveal the underlying nature of the dynamical processes in a system. Given both components of the planar COP velocity at a given origin, we can consider the COP-VAF,
| (1) |
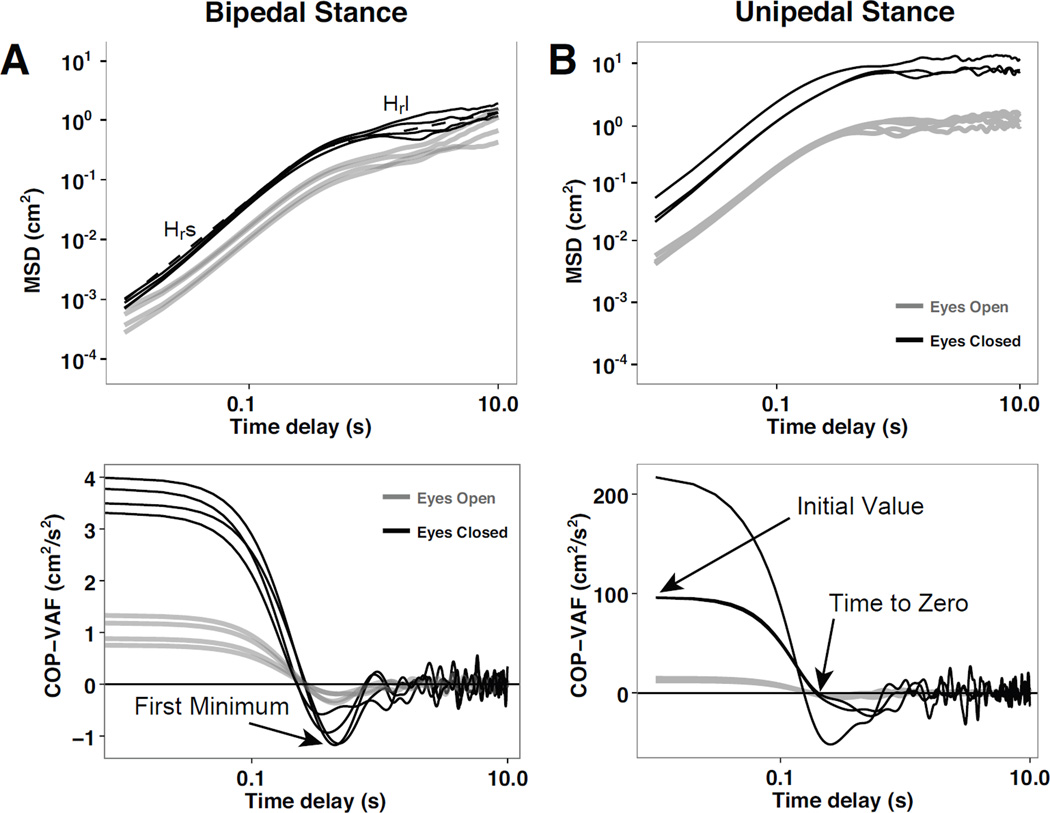
where the average of the dot products is carried out over time, using a range of relevant time scales, such as 0.01–10.0 seconds. The COP-VAF can provide further insight into the dynamics of the postural control system through the characteristic velocity correlation decay described by the initial value, time to zero, and first minimum (Fig. 2). In the human postural control system, the initial value of the COP-VAF provides a measure of the potential used in the system to maintain balance, and is expected to increase in value as balance demands increase. The time to zero and minimum, provide a measure of the time-scales of compensatory postural responses, as the zero-crossing time may indicate the time span over which the direction of the centripetal COP acceleration changes by 90-degrees, while the value of the first minimum provides a measure of the magnitude of corrective COP responses.
Fig. 2.
Representative mean square displacement (MSD) in the radial direction, 〈Δr2〉, and COP velocity autocorrelation function (COP-VAF) during bipedal stance (A) and unipedal stance (B). The top figures present the MSD as a function of the time delay from a representative participant with eyes open (gray line) or closed (black line) and characteristic measures of the Hurst exponent in the short-term, Hrs, and long-term region, Hrl. The bottom figures present the COP-VAF from a representative participant with eyes open (black line) or closed (gray line) and characteristic measures of initial value, time to zero, and first minimum.
Furthermore, as the VAF decays to zero at a long time, it can be integrated over time to calculate the planar diffusion coefficient D:
| (2) |
given a special case of the Green-Kubo relation [44]. A direct approximation of the planar diffusion coefficient, D, can then be calculated by taking the integral from zero to 10 seconds, D0. The measured planar diffusion coefficient, D0, provides an analogous measure to the diffusion coefficient calculated by SDA. Furthermore, as the decay of the COP-VAF should provide a measure of the time-scales of compensatory postural responses, the velocity power spectral density (PSD) can be calculated using a fast Fourier transform of the COP-VAF to extract additional information about dominant time scales in the postural control system. Using a cumulative velocity PSD, we can assess changes in power distribution across a narrow physiological range [45].
To compare between stance and visual conditions, a linear mixed model was performed with p < 0.05 used for statistical significance. Furthermore, the reliability of COP-VAF measures over the four bipedal stance trials with differing trial durations was assessed using intraclass correlation coefficients (ICCs) with a oneway random effects model [46]. All statistical analysis was carried out using R version 3.0.1 [47], using lme version 1.1–5 and lmerTest version 2.0–6 to carry out linear mixed-effects models.
D. Mathematical model
The center of pressure trajectories, as shown in Figure 1, generally take on the appearance of a random walk as previously noted [15], [24], [32], [33]. One important difference between pure Brownian motion and the COP trajectories is that people are attempting to remain stationary: they have a driving force returning toward a preferred position, i.e., the center of the foot. Thus, ignoring for now the separation of the feet, the simplest possible model is an Ornstein-Uhlenbeck process with a harmonic restoring force. We present the one dimensional case, but the results generalize to 2 dimensions without any change. The starting point is the equation of motion for a particle in a harmonic well, which is linearly damped and driven by a random force.
| (3) |
Here x(t) is the position of the particle of mass m, k is a spring constant, γ is a damping coefficient, ξ(t) is a random force with zero mean and standard deviation 1, and T is a constant setting the scale of the random force. Since there is a coefficient on all the terms, we set the mass m = 1 in the remainder.
To calculate the velocity autocorrelation, we take the standard approach of finding the power spectrum and applying the Wiener-Khinchin theorem to relate the Fourier transform of the power spectrum to the autocorrelation. The power spectrum has the form:
| (4) |
Assuming the random force is independent of the position, then its power spectrum is simply 1 on average by construction, and the random driving force is entirely represented by its magnitude T. Further, since the power spectrum is linear in T2, so is its Fourier transform (the autocorrelation), and the only effect of increasing noise in the system is to scale the autocorrelation. The remaining Fourier transform is standard, and we concentrate on the solution with poles with nonzero real parts (both damping and ringing, 4k > γ2). Defining , the velocity autocorrelation is
| (5) |
In practice we divide Cv(τ) by Cv(0) to normalize for the variable noise levels. Thus, using this analytical solution, we can identify initial values for γ and k for fitting to the COP-VAF of experimental data.
E. Computational Model
While the simple Ornstein-Uhlenbeck model is a reasonable starting point, we expect it to only be an approximation of what actually goes on during stance. Among other things, analytically incorporating the shifting of weight within and between the feet is challenging. Thus, we turn to some straightforward modeling of the data. To that end, we modeled stance as a random two dimensional walker whose position is updated as a sum of three terms: a damping, potential, and Gaussian random noise term. The model discretizes the problem into time steps δt and updates the velocity, , and position, , from time step n − 1 to n as
| (6) |
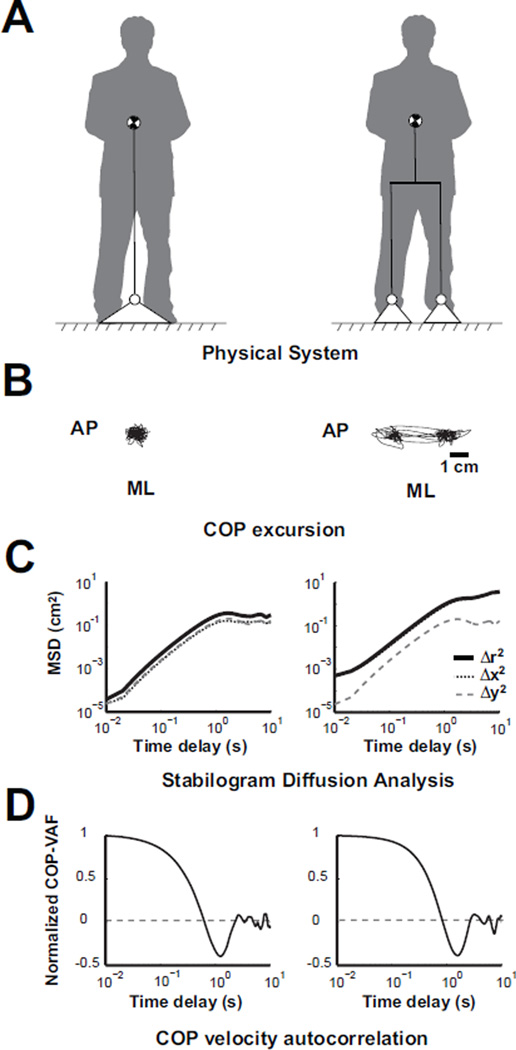
The and terms are the damping and potential as before; however, the spring force has a time dependent center, , to allow for variable centers of the spring. Below, the variable center mimics subjects shifting their weight within and between the feet by assigning where s is a separation, and shifts from (−s, 0) → (+s, 0), or vice versa, with a fixed probability q. The shift probability is chosen so that there are infrequent shifts, usually 6 per 104 trial steps (i.e. q = 6/104), so as to mimic the observed frequency of weight shifts in the participants of this study. The selected weight shift frequency selected in this study is higher than previously reported frequencies of large weight shifts in relaxed sway of 0.013 Hz [23], but preliminary sensitivity analysis suggests that COP-VAF outcome measures are insensitive to to weight shift frequencies ranging from 2 to 7 shifts per trial. The random variable in equation 6, , is Gaussian distributed in each dimension with standard deviation , where the factor of insures that the dynamics, e.g. the size of an excursion, remain unchanged when we vary the scale of δt. Considering nominal values of T = 1.0, δt = 0.01, γ = 1.5, and k = 4 our computational model yielded physiologically consistent COP excursions, mean square displacements, and velocity autocorrelations (Fig. 3). As seen in prior postural control studies, oscillatory behavior of the mean square displacement in the long-term region (i.e., time delays of 5 or more seconds in Fig. 3) is observed in simulations with nonzero separations [15], [24], [32], [33].
Fig. 3.
A) Schematic of physical system model considering a single (left) or a dual base of support (right). B) Simulated COP excursion from model using a separation distance of 0 cm (left) or 3 cm (right). C) Representative stabilogram diffusion analysis curves, and D) COP velocity autocorrelation function from model.
Using the computational model outlined above, estimates for the damping coefficient and spring constant, γ and k respectively, that best fit the experimental data were obtained by fitting the COP-VAF from the computational model to the experimental data. Initial values for γ and k were obtained from equation 5 for use in non-linear curve fitting in MATLAB (Mathworks, Natuck, MA), using a trust region reflective algorithm (lsqcurvefit). Time steps and T were fixed at 0.01 and 1, respectively, while the separation distance and simulation duration were fixed to experimentally relevant values of 2cm and 30s for unipedal stance trials, and 20cm and 80s for bipedal stance trials. To account for the variability in the modeled postural sway, the non-linear curve fitting was performed over 10 independent trials. Furthermore, the effect of varying damping, stiffness, and separation on stochastic and dynamic characteristics of the COP, as evaluated by the COP-VAF can be assessed using numerical simulation output defined by equation 6.
III. Results
A. Experimental Results
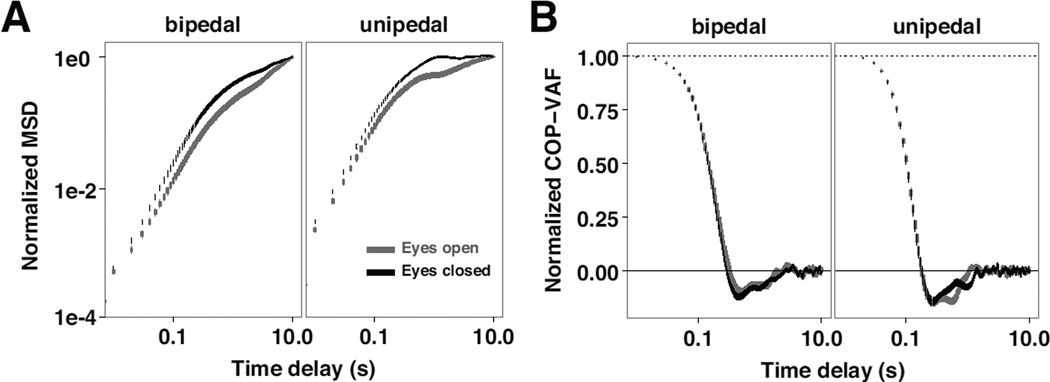
Generally, moving from a bipedal to unipedal stance greatly increased the size of the resulting COP distribution and modestly decreased the temporal scale of the motions (i.e., sped them up), as seen in Table I. Closing the eyes had similar noise injection characteristics as switching stance, as observed in representative COP-VAF and MSD trajectories during bipedal and unipedal stance trials with eyes open or closed (Fig. 2). In contrast to unnormalized trajectories of the SDA and COP-VAF, normalizing the SDA and COP-VAF trajectories by dividing by the MSD endpoint and COP-VAF initial value resolves many of the differences observed among differing stance and visual conditions (Fig. 4). Thus, normalized data provides an essential data set for further validation of our novel stochastic postural control model.
TABLE I.
Mean and standard deviation (SD) of outcome measures during unipedal and bipedal stance trials
| Bipedal stance | Unipedal Stance | |||||||
|---|---|---|---|---|---|---|---|---|
| Parameter | Eyes Open Mean (SD) |
Eyes Closed Mean (SD) |
Eyes Open Mean (SD) |
Eyes Closed Mean (SD) |
||||
| Traditional posturographic measures | ||||||||
| ML COP RMS (cm) | 0.37 | 0.24 | 0.36 | 0.18 | 0.48 | 0.10 | 1.28 | 0.26 |
| AP COP RMS (cm) | 0.73 | 0.32 | 0.62 | 0.22 | 0.83 | 0.25 | 1.52 | 0.43 |
| ML COP Velocity (cm/s) | 0.29 | 0.11 | 0.35 | 0.14 | 1.72 | 0.36 | 4.34 | 1.17 |
| AP COP Velocity (cm/s) | 0.53 | 0.17 | 0.76 | 0.33 | 1.64 | 0.30 | 4.54 | 1.50 |
| SDA measures | ||||||||
| Dxs | 0.03 | 0.02 | 0.04 | 0.03 | 0.40 | 0.14 | 2.85 | 1.27 |
| Dxl | 0.08 | 0.04 | 0.16 | 0.12 | 0.51 | 0.23 | 3.97 | 3.30 |
| Dys | 0.11 | 0.05 | 0.20 | 0.14 | 0.91 | 0.30 | 6.75 | 3.75 |
| Dyl | 0.01 | 0.01 | 0.01 | 0.01 | 0.01 | 0.01 | 0.03 | 0.08 |
| Drs | 0.04 | 0.03 | 0.02 | 0.02 | 0.06 | 0.07 | 0.05 | 0.08 |
| Drl | 0.05 | 0.03 | 0.03 | 0.02 | 0.07 | 0.08 | 0.09 | 0.14 |
| Hxs | 0.84 | 0.08 | 0.87 | 0.06 | 0.88 | 0.03 | 0.86 | 0.05 |
| Hxl | 0.83 | 0.06 | 0.90 | 0.05 | 0.82 | 0.06 | 0.85 | 0.04 |
| Hys | 0.83 | 0.06 | 0.90 | 0.05 | 0.83 | 0.04 | 0.86 | 0.03 |
| Hyl | 0.32 | 0.16 | 0.23 | 0.11 | 0.08 | 0.09 | 0.04 | 0.08 |
| Hrs | 0.37 | 0.14 | 0.21 | 0.12 | 0.22 | 0.16 | 0.05 | 0.07 |
| Hrl | 0.38 | 0.12 | 0.23 | 0.11 | 0.19 | 0.13 | 0.04 | 0.05 |
| Δtx | 1.30 | 0.32 | 1.43 | 0.32 | 0.90 | 0.15 | 1.01 | 0.34 |
| Δty | 1.34 | 0.47 | 1.30 | 0.47 | 1.04 | 0.32 | 1.21 | 0.38 |
| Δtr | 1.26 | 0.32 | 1.25 | 0.40 | 0.92 | 0.13 | 1.13 | 0.38 |
| 〈Δx2〉c | 0.06 | 0.04 | 0.09 | 0.06 | 0.35 | 0.12 | 3.00 | 1.16 |
| 〈Δy2〉c | 0.18 | 0.12 | 0.27 | 0.15 | 0.62 | 0.35 | 4.82 | 3.45 |
| 〈Δr2〉c | 0.22 | 0.10 | 0.34 | 0.18 | 0.95 | 0.40 | 7.75 | 3.97 |
| COP-VAF measures | ||||||||
| First Minimum Time (s) | 0.63 | 0.28 | 0.52 | 0.18 | 0.35 | 0.11 | 0.34 | 0.13 |
| First Minimum Value (cm2/s2) | −0.14 | 0.16 | −0.34 | 0.44 | −2.34 | 1.58 | −19.49 | 21.28 |
| Initial VAF Value (cm2/s2) | 0.77 | 0.60 | 1.59 | 1.47 | 10.21 | 3.44 | 82.78 | 57.89 |
| Time to Zero (s) | 0.38 | 0.15 | 0.33 | 0.13 | 0.20 | 0.06 | 0.20 | 0.09 |
| D0 (cm2/s) | 0.02 | 0.02 | 0.01 | 0.02 | 0.07 | 0.08 | 0.30 | 0.40 |
Fig. 4.
Normalized Stabilogram Diffusion Analysis (SDA) and COP-VAF curves of experimental data. A) Effect of vision and stance conditions on the mean (± standard error) radial mean square displacement (MSD) curve of all participants, normalized by dividing by the MSD endpoint. B) Mean (± standard error) COP-VAF curve of all participants, normalized by dividing by the initial value of the COP-VAF.
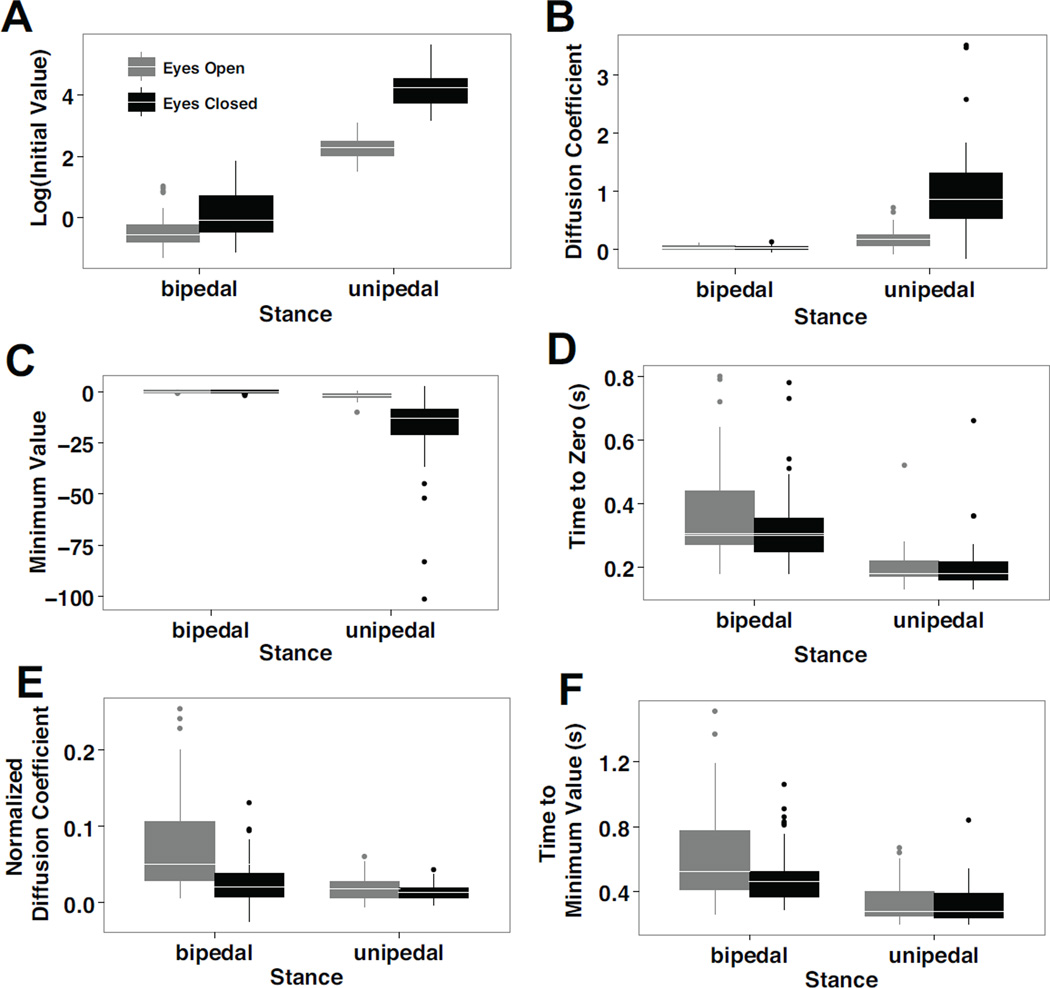
Consistent with traditional posturographic and SDA measures, the COP-VAF demonstrated significantly different dynamics when participants maintained a quiet stance on a single leg versus both, with eyes closed (Table I). In contrast to a bipedal stance, a unipedal stance led to a 32-fold increase in the initial value of the COP-VAF (χ2 = 40.8, p < 0.00001, Fig. 5), magnitude of the first minimum (χ2 = 16.9, p < 0.00005), and eight-fold increase in the diffusion coefficient (χ2 = 19.0, p < 0.00005), while leading to more than a 50% decrease in both the time to minimum (χ2 = 29.0, p < 0.00001) and time to zero (χ2 = 35.3, p < 0.00001). A lack of visual feedback led to more than a six-fold increase in the initial COP-VAF value (χ2 = 27.2, p < 0.00001) and magnitude of the first minimum (χ2 = 12.3, p < 0.0005), and three-fold increase in the diffusion coefficient (χ2 = 10.1, p < 0.005). Additionally, a Vision x Stance interaction effect was found in the initial value of the COP-VAF (χ2 = 131.3, p < 0.00001), the minimum value (χ2 = 56.8, p < 0.00001), the diffusion coefficient (χ2 = 131.3, p < 0.00001), and time to minimum (χ2 = 4.6, p < 0.05).
Fig. 5.
Boxplots of characteristic COP-VAF measures, demonstrating the median (in white line) and outliers (in dots) of A) the logarithm transform of the initial value, log10(Cv(0)), B) diffusion coefficient, C) minimum value, D) time to zero, E) normalized diffusion coefficient, and F) time to minimum value during eyes open (gray) and eyes closed (black) conditions in bipedal and unipedal stance conditions. All COP-VAF measures demonstrated statistically significant differences between unipedal and bipedal stance conditions, while measures A-C demonstrated significant differences between eyes open and closed conditions.
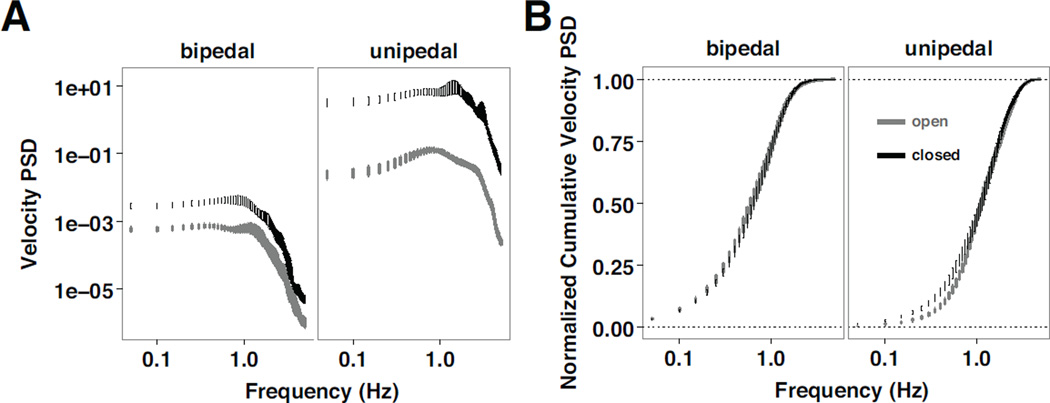
Overall, the velocity power spectra demonstrates an increase in power at lower frequencies with eyes closed during a quiet stance (Fig. 6A). Furthermore, as observed from the normalized cumulative velocity power spectra (Fig. 6B), in comparison to standing on both legs, standing on one leg results in a slower rise to the full area of the velocity power spectra, and increased differences due to vision, consistent with the primary outcome measures of the COP-VAF.
Fig. 6.
Analysis of velocity measurements. A) Log-log plot of the mean (± standard error) COP-VAF power spectral density (PSD) and B) semilogarithmic plot of the mean (± standard error) normalized cumulative COP-VAF PSD for eyes open (gray) and eyes closed (black) trials during bipedal and unipedal stance trials.
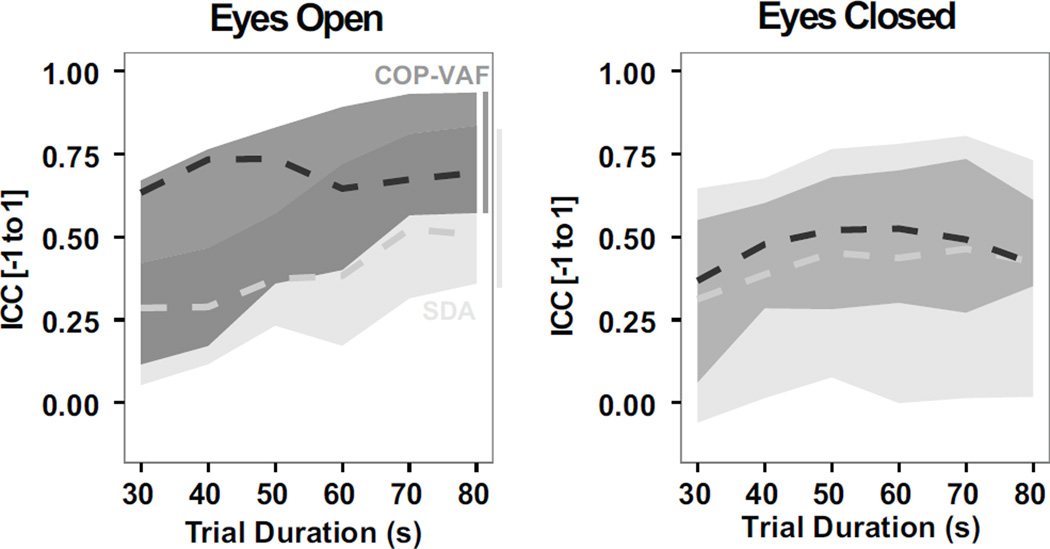
In contrast to SDA measures during a bipedal stance, COP-VAF measures provided more consistently reliable measures in 80 s trials. Intraclass Correlation Coefficients (ICCs) ranged from 0.57–0.93 in COP-VAF measures versus 0.36–0.83 in SDA measures in the eyes open condition. In the eyes closed condition, ICCs were more varied and ranged from 0.35–0.61 in COP-VAF measures versus 0.02–0.73 in SDA measures. Furthermore, considering the effect of trial duration (30–80 s) on the reliability of COP-VAF and SDA measures, considering up to 10 s time delays, we find COP-VAF measures to be, on average, more reliable than SDA measures (Fig. 7). The median ICC of COP-VAF measures demonstrated a 74% increase over SDA measures during eyes open trials, and 13% increase when eyes are closed.
Fig. 7.
Reliability of COP-VAF (dark grey) and SDA measures (light grey), as evaluated by the maximum, minimum, and median (dashed line) intraclass correlation coefficient (ICC), using trial durations ranging from 30–80 s in quiet bipedal stance with eyes open and closed.
B. Simulation Results
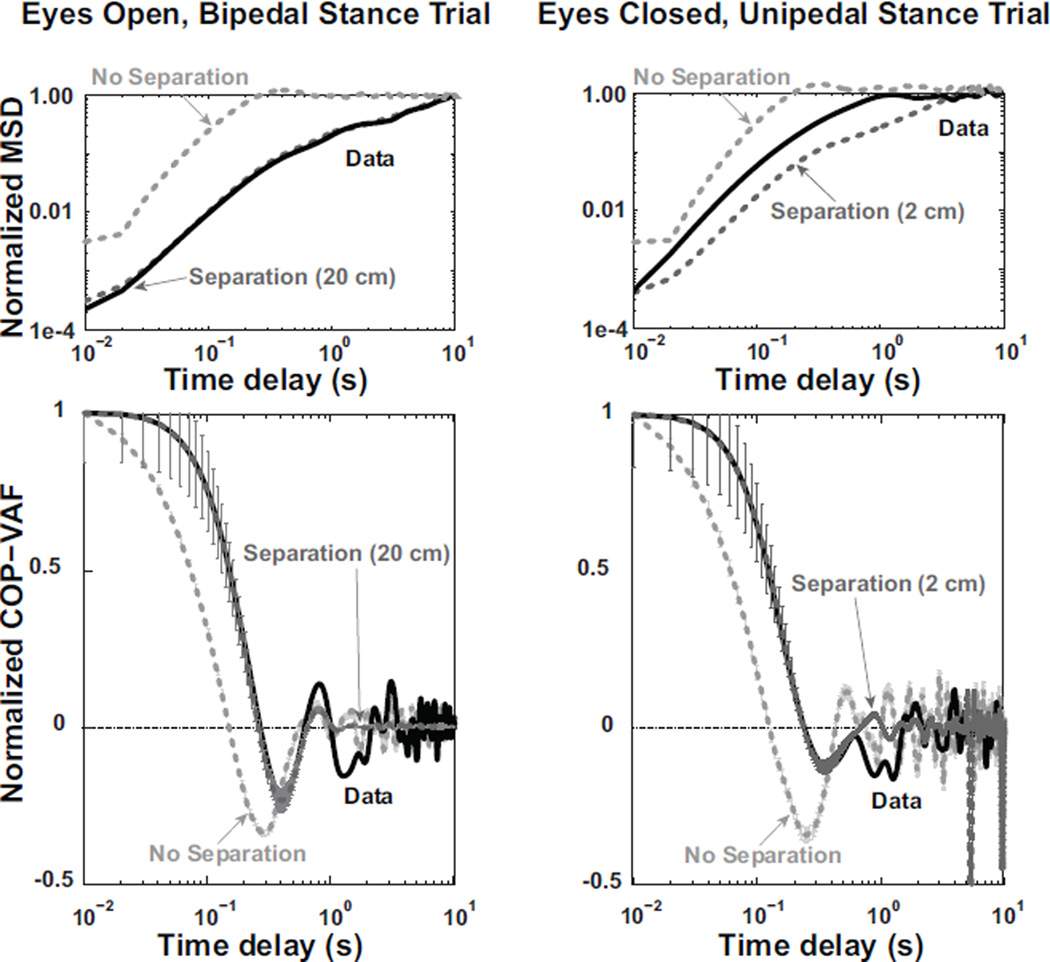
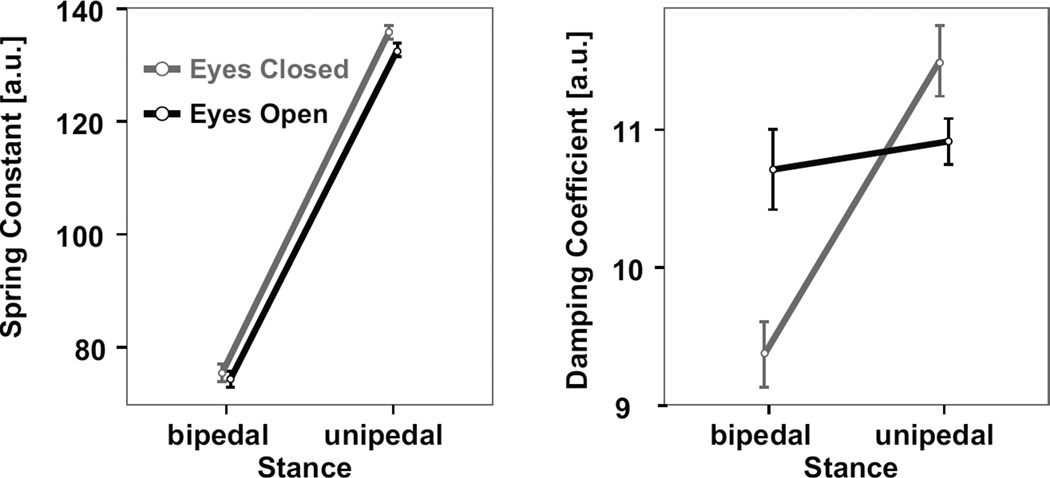
Figure 8 shows how the numerical model, with a nonzero separation distance, replicates the experimental data’s normalized velocity autocorrelation function in terms of minimum value, time to minimum value, and time to zero, in a range of visual and stance conditions. In addition, the radial mean square displacement of the model displays a similar pattern as experimental data (Fig. 8). Based on the non-linear fitting of the numerical simulation’s normalized COP-VAF to individual experimental trials, the fitted spring constant increased nearly two-fold (i.e., 1.8x) when going from a bipedal to unipedal stance (χ2 = 141.2, p < 0.00001, Fig. 9). Closed eyes led to increased spring constants in unipedal stance trials relative to bipedal stance trials (i.e., stance and vision interaction, χ2 = 10.2, p < 0.005). Furthermore, a lack of visual feedback led to a 12% decrease in the fitted damping coefficient in bipedal stance trials, while resulting in a 5% increase in unipedal stance trials (i.e., stance and vision interaction, χ2 = 16.4, p < 0.0001).
Fig. 8.
Left) Numerical simulation results for a representative eyes open, bipedal stance trial. Top Left) Normalized Mean Square Displacement (MSD) of experimental data from a single trial (black line) is compared with model results using a separation distance of 0 cm (light grey dashed line) or 20 cm (dark grey dashed line), using an experimentally relevant weight shift probability of 6 shifts per 80 seconds, γ = 7.2, and k = 77. Bottom Left) Normalized COP velocity autocorrelation function (COP-VAF) trajectory of experimental data (black line) and mean (± standard error) numerical simulation results using a separation distance of 20 cm (dark grey) or no separation (light gray). Right) Model results for a representative eyes closed, unipedal stance trial, using a weight shift probability of 6 per 21.7 seconds, separation distance of 0 (light gray) or 2 cm (dark gray), γ = 10.3, and k = 107.4 compared to experimental data from a single trial (black line). The Normalized MSD is shown on top right, while normalized COP-VAF is shown on bottom right.
Fig. 9.
Mean ± standard error of the spring constant (left) and damping coefficient (right) numerical model parameters used to fit experimental data.
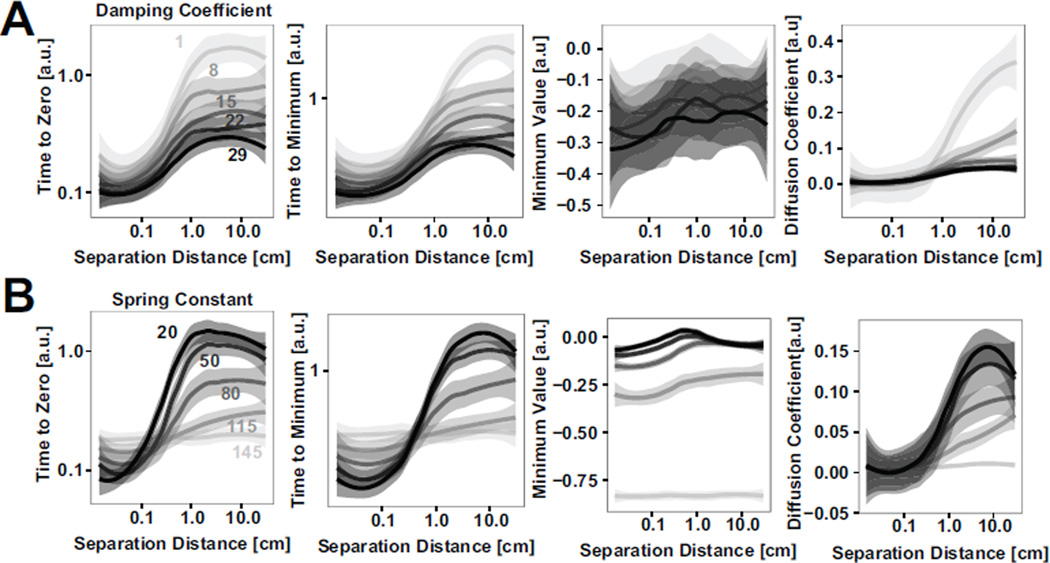
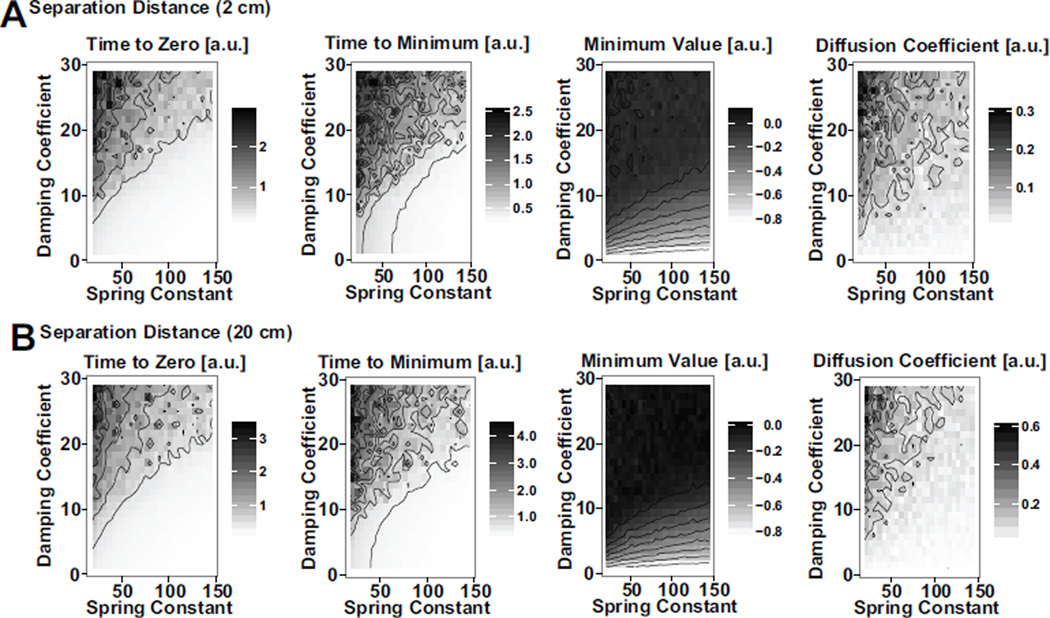
A parameter analysis of the numerical simulation was performed to quantify the effect of the separation distance, damping, and stiffness on COP-VAF outcome measures (Fig. 10). From the model results, it is clear that the sensitivity of outcome measures to separation distance decreases with increases in values for damping coefficient or spring constant. In addition, the sensitivity of outcome measures to these parameters is dependent on the separation magnitude, for experimentally relevant parameter ranges of γ = 9.4 – 11.5 and k = 74.3 −135.9. If the separation distance relative to the COP excursions without a weight shift is very small, < 0.5 cm, or very large, > 3 – 5 cm, the sensitivity to the parameters is lower, as the noise and separation terms respectively dominate these conditions. Between these conditions the similar scale of the separation allows for interactions, increasing the sensitivity to γ and k within this range. Further examination of the interaction between a varying spring constant and damping coefficient in models with a 2 cm or 20 cm separation distance demonstrate the largely consistent responses to changes in damping and potential under these two different conditions (Fig. 11).
Fig. 10.
A) Effect of varying damping coefficient values on mean ± standard error of primary COP-VAF outcome measures (i.e., time to zero, time to minimum, minimum value, and diffusion coefficient), and B) Effect of varying spring constant on mean ± standard error of primary COP-VAF outcome measures from numerical simulation results.
Fig. 11.
A) Effect of varying damping coefficient and spring constant values on primary COP-VAF outcome measures for a separation distance of 2 cm, and B) 20 cm.
IV. Discussion
The COP-VAF demonstrated repeatable, physiologically meaningful measures that can distinguish postural control differences in the quiet standing of healthy young individuals in unipedal and bipedal stances with and without vision. Consistent with prior studies [32], [48], postural sway variance increased while the temporal scale of motions decreased when the postural control system is challenged by a lack of visual feedback or unipedal stance. Distinct differences in the COP-VAF trajectories were observed due to visual condition, particularly during unipedal stance trials. In unipedal stance trials the initial value and magnitude of the minimum value of the COP-VAF were significantly higher with eyes closed than open, suggesting the presence of a stronger restorative force under more demanding postural stances. Furthermore, the increased delays observed in the time to minimum of bipedal stance trials with eyes open, relative to unipedal stance trials, suggests a decrease in damping or stiffness (Fig. 10). In addition to revealing dynamical properties of the human postural control system, the COP-VAF can be integrated over time to calculate the planar diffusion coefficient via a special case of the Green-Kubo relation [44], to reveal an average measure of the stochastic activity of the COP trajectory. The calculated diffusion coefficients significantly increased in a unipedal stance, particularly with eyes closed, which suggests that participants used visual feedback to reduce the stiffness of their musculoskeletal system via a reduction in muscular activity or co-contraction across stabilizing joints at the ankle, knee, hip, and trunk in a one-legged stance. A reduction in muscular activity and/or synchrony of muscle activation would then explain the decrease in diffusion coefficient, as it would be expected to reduce the magnitude of force fluctuations [49]–[53], consistent with prior work [32].
In addition, the COP-VAF has another interesting property when a Fourier transform is applied, as it can provide further insight into the underlying frequencies dominating human postural control processes. Our power spectral density analysis (Fig. 6) demonstrates an increase in lower frequency processes when eyes are closed, and particularly in unipedal stance. Given the broad peak around low frequencies observed in the power spectra, these results provide additional evidence that human postural sway may be characterized by changes in low frequency movements as postural control demands increase when eyes are closed or standing on one leg. Low frequency processes of sway, assumed to arise from neural control, have been found to account for a major contribution of sway variance during quiet stance, while also providing a universal index of postural control capacity [54]–[57].
The COP-VAF provides a more succinct evaluation of the dynamical and stochastic properties of the postural control system, as compared to SDA, and has five salient measures: a single diffusion coefficient (D0), two time scales (time to zero and time to minimum), and the initial and minimum COP-VAF values. As demonstrated by interclass correlation coefficients (ICC) analysis relative to SDA measures, COP-VAF measures demonstrated increased reliability in trial of up to 80 seconds in duration. However, further work remains to identify the preferred number of trials and durations, as previously identified for SDA measures [35].
Our novel model of stochastic postural control dynamics suggests a significant modulation of ankle stiffness due to stance condition changes when eyes are closed given the increase of the fitted spring constant under a unipedal stance condition, particularly under eyes close conditions. This is consistent with prior inverted pendulum models [58], [59] and our experimental data. In contrast with two-process models of postural control [15], [60], our model considers the influence of shifting weight within and between the feet, which can result in significant differences in COP dynamics [17], [22]. The proposed model can qualitatively reproduce the main COP-VAF and MSD characteristics observed in our empirical data, and further shows the importance of incorporating a physiologically relevant separation distance between weight shifts. As observed in a representative trial in Figure 8, a non-zero separation plays a key role in reproducing experimental quiet standing data under both unipedal and bipedal stances, but a more exact formulation based on subject-specific anatomy may be required in further work with a unipedal stance. Furthermore, within the higher end of physiologically-relevant ranges of the separation distance in human unipedal or bipedal stance (i.e., 4–20 cm), COP-VAF measures of the time to zero, time to minimum, and minimum value were relatively insensitive to variations in separation distance, consistent with recent experimental studies of volitional COP control [61], where visual feedback had a stronger effect on the structure of the COP than changes in center of mass excursion.
An additional benefit of the computational model lies in its ability to provide an insight into how postural control characteristics are changed with larger or smaller values of a given COP-VAF measure. Decreases in both the time to zero and minimum are associated with increased damping and stiffness (Fig. 10), consistent with a decreased time span over which the direction of the centripetal COP acceleration changes by 90-degrees. Decreases in the minimum value are associated with increases in stiffness, and may be associated with an increased magnitude of corrective COP responses, which is consistent with the increased stiffness in unipedal stance trials with eyes closed observed in our study (Fig. 9). Increases in the diffusion coefficient, D0, are associated with decreases in damping and stiffness, consistent with a biomechanical framework.
The mechanism underlying slow sway COP dynamics has not yet been defined. Recent findings in the postural control literature [23], [62]–[64] are consistent with a hypothesis of intermittent control of the inverted pendulum [65]–[67]. However, the double-power law behavior at low frequencies may also be due to the switching between open-loop and closed-loop dynamics, or intermittency in delay feedback control [15], [68]. Assuming that intermittent control of the COP is an independent process from the control of ankle stiffness, then the COP-VAF should provide a new tool for detection of this process, through the observation of variance in long time scale processes in unison with surrogate data.
The weight-shifting process introduced in our model (i.e., the extra term in the computational model or additional exponential curve in the simulated COP-VAF trajectory) is akin to a slowly migrating reference point defined by a central command, as suggested by Zatsiorsky and Duarte [19]. Furthermore, our weight-shifting process is consistent with intermittency, as individuals are not standing perfectly still and intermittently move their ‘desired’ center of mass location around in a conscious or subconscious manner. This process is similar to the constant speed paradigm observed by Doeringer and Hogan [69], where participants intermittently change their desired speed around a fixed average. If intermittent control and the weight-shifting process introduced in our model are indeed the same phenomenon, then we can infer that the characteristic time of choosing new centers of mass is longer than that of the system’s own response, or in other words, that intermittency is slower than balance. Thus, together with findings of variations in the scale-invariant structure of COP trajectories that are dependent on center of mass movements [23], further analysis of the power spectral density of the COP-VAF trajectory and role of weight-shifting frequency on the COP-VAF may provide significant insight into the quantification of intermittency in human postural control.
The present study has a few limitations, including a limited sample of healthy young individuals, which restrict generalizability, and no direct measure of the center of mass, which may be used alternatively in a measure of postural control dynamics, such as the center of mass velocity autocorrelation function. This study did not examine the effect of age or musculoskeletal and neurological disorders on COP-VAF measures. In contrast to other recent postural control models [70]–[72], we did not examine the effect of delays in the system but acknowledge that further work is merited in this topic, as feedback delays could induce further postural instability that would limit our ability to perform a parameter fitting. Furthermore, the normalized model parameters reported in this study need further examination to verify if they are physiologically plausible. The present study introduced a postural control model with a weight shift probability, q, that if zero or frequent, would provide altered dynamics of postural sway that could be extended to different behaviors like relaxed standing or reciprocal movements. Thus, identifying trial-specific values of q may be beneficial in future studies. This study did not explicitly incorporate the role of brain function in executing the motor control and modulating the stability in a bipedal or unipedal stance. Thus, the empirical study of stiffness and damping parameters, as a dynamical system abstraction of such motor control processes in the cortex, can be complemented with theory and experiments using EEG or other brain physiological signals. Further work should examine how older adults with and without balance dysfunction vary in their COP dynamics, as evaluated by the COP-VAF, to further our understanding of the aging process and progression of neurodegenerative disorders.
V. Conclusion
In summary, this study demonstrated that the COP-VAF may provide repeatable, physiologically meaningful measures of the COP dynamics, consistent with SDA and traditional posturographic measures, that may further our understanding of the underlying mechanisms behind the maintenance of balance in human upright stance. Based on a novel model of stochastic postural control dynamics, we show the importance of incorporating a parameter for natural weight shifts in upright stance and evidence for stiffness modulation when going from a bipedal to unipedal stance. Given the ability of COP-VAF measures to detect postural control differences due to vision and stance in healthy young adults and the underlying model to explore mechanistic differences, this work provides a novel tool for quantifying postural control changes due to aging and neurological impairment, and assessing the result of neurorehabilitative interventions aimed at improving balance.
Acknowledgments
The authors would like to thank Jason Trees and Claudia Lainscsek for their discussion and all the volunteers who participated in this study.
This work supported in part by National Institute of Health Grant 2 R01 NS036449, National Science Foundation (NSF) Grant ENG-1137279 (EFRI M3C), NSF Grant SMA-1041755, and ONR MURI Grant N00014-10-1-0072.
Contributor Information
Manuel E. Hernandez, Department of Kinesiology and Community Health, University of Illinois at Urbana-Champaign, Urbana, IL, 61801 USA (mhernand@illinois.edu.
Joseph Snider, Institute for Neural Computation, University of California, San Diego, La Jolla, CA 92093 USA (j1snider@ucsd.edu.
Cory Stevenson, Department of Bioengineering and Institute for Neural Computation, University of California, San Diego, La Jolla, CA 92093 USA (cesteven@ucsd.edu.
Gert Cauwenberghs, Department of Bioengineering and the Institute for Neural Computation, University of California, San Diego, La Jolla, CA 92093 USA (gert@ucsd.edu.
Howard Poizner, Neurosciences Graduate Program and with the Institute for Neural Computation, University of California, San Diego, La Jolla, CA 92093 USA (hpoizner@ucsd.edu.
References
- 1.Bell A, Talbot-Stern J, Hennessy A. Characteristics and outcomes of older patients presenting to the emergency department after a fall: a retrospective analysis. Med J Aust. 2000;173(4):179–182. doi: 10.5694/j.1326-5377.2000.tb125596.x. [DOI] [PubMed] [Google Scholar]
- 2.Del Corso L, Giuliano G, Romanelli A, Protti M, Moruzzo D, Amato V, Agelli M, Pentimone F. [falls and fractures in the elderly. causes and consequences] Minerva Med. 1994;85(5):245–251. [PubMed] [Google Scholar]
- 3.Riley R. Accidental falls and injuries among seniors. Health Rep. 1992;4(4):341–354. [PubMed] [Google Scholar]
- 4.Klawans H, Topel J. Parkinsonism as a falling sickness. JAMA. 1974;230(11):1555–1557. [PubMed] [Google Scholar]
- 5.Aita J. Why patients with parkinson’s disease fall. JAMA. 1982;247(4):515–516. [PubMed] [Google Scholar]
- 6.Koller W, Glatt S, Vetere-Overfield B, Hassanein R. Falls and parkinson’s disease. Clin Neuropharmacol. 1989;12(2):98–105. doi: 10.1097/00002826-198904000-00003. [DOI] [PubMed] [Google Scholar]
- 7.Bloem B. Postural instability in parkinson’s disease. Clin Neurol Neurosurg. 1992;94(Suppl):S41–S45. doi: 10.1016/0303-8467(92)90018-x. [DOI] [PubMed] [Google Scholar]
- 8.Winter D, Prince F, Frank J, Powell C, Zabjek K. Unified theory regarding a/p and m/l balance in quiet stance. J Neurophysiol. 1996;75(6):2334–2343. doi: 10.1152/jn.1996.75.6.2334. [DOI] [PubMed] [Google Scholar]
- 9.Jonsson B, Steen B. Function of the hip and thigh muscles in romberg’s test and “standing at ease“. an electromyographic study. Acta Morphol Neerl Scand. 1963;5:269–276. [PubMed] [Google Scholar]
- 10.Black F, Wall C, Rockette H, Kitch R. Normal subject postural sway during the romberg test. Am J Otolaryngol. 1982;3(5):309–318. doi: 10.1016/s0196-0709(82)80002-1. [DOI] [PubMed] [Google Scholar]
- 11.Diener H, Dichgans J, Bacher M, Gompf B. Quantification of postural sway in normals and patients with cerebellar diseases. Electroencephalogr Clin Neurophysiol. 1984;57(2):134–142. doi: 10.1016/0013-4694(84)90172-x. [DOI] [PubMed] [Google Scholar]
- 12.Hasan S, Lichtenstein M, Shiavi R. Effect of loss of balance on biomechanics platform measures of sway: influence of stance and a method for adjustment. J Biomech. 1990;23(8):783–789. doi: 10.1016/0021-9290(90)90025-x. [DOI] [PubMed] [Google Scholar]
- 13.Newell K, van Emmerik R, Lee D, Sprague R. On postural stability and variability. Gait Posture. 1993;1(4):225–230. [Google Scholar]
- 14.van Beijeren H, Kutner R, Kehr K. Tracer diffusion on two coupled lines: The long-time tail of the velocity autocorrelation function compared to the mode-coupling prediction. Phys Rev B Condens Matter. 1985;32(1):466–467. doi: 10.1103/physrevb.32.466. [DOI] [PubMed] [Google Scholar]
- 15.Collins J, De Luca C. Open-loop and closed-loop control of posture: a random-walk analysis of center-of-pressure trajectories. Exp Brain Res. 1993;95(2):308–318. doi: 10.1007/BF00229788. [DOI] [PubMed] [Google Scholar]
- 16.Chiari L, Cappello A, Lenzi D, Della Croce U. An improved technique for the extraction of stochastic parameters from stabilograms. Gait Posture. 2000;12(3):225–234. doi: 10.1016/s0966-6362(00)00086-2. [DOI] [PubMed] [Google Scholar]
- 17.Duarte M, Zatsiorsky V. Patterns of center of presure migration during prolonged unconstrained standing. Motor Control. 1999;3(1):12–27. doi: 10.1123/mcj.3.1.12. [DOI] [PubMed] [Google Scholar]
- 18.Duarte M, Zatsiorsky V. On the fractal properties of natural human standing. Neurosci Lett. 2000;283(3):173–176. doi: 10.1016/s0304-3940(00)00960-5. [DOI] [PubMed] [Google Scholar]
- 19.Zatsiorsky V, Duarte M. Instant equilibrium point and its migration in standing tasks: rambling and trembling components of the stabilogram. Motor Control. 1999;3(1):28–38. doi: 10.1123/mcj.3.1.28. [DOI] [PubMed] [Google Scholar]
- 20.Zatsiorsky V, Duarte M. Rambling and trembling in quiet standing. Motor Control. 2000;4(2):185–200. doi: 10.1123/mcj.4.2.185. [DOI] [PubMed] [Google Scholar]
- 21.Delignières D, Deschamps T, Legros A, Caillou N. A methodological note on nonlinear time series analysis: is the open- and closed-loop model of collins and de luca (1993) a statistical artifact? J Mot Behav. 2003;35(1):86–97. doi: 10.1080/00222890309602124. [DOI] [PubMed] [Google Scholar]
- 22.Duarte M, Sternad D. Complexity of human postural control in young and older adults during prolonged standing. Exp Brain Res. 2008;191(3):265–276. doi: 10.1007/s00221-008-1521-7. [DOI] [PubMed] [Google Scholar]
- 23.Ihlen E, Skjret N, Vereijken B. The influence of center-of-mass movements on the variation in the structure of human postural sway. J Biomech. 2013;46(3):484–490. doi: 10.1016/j.jbiomech.2012.10.016. [DOI] [PubMed] [Google Scholar]
- 24.Collins J, De Luca C, Burrows A, Lipsitz L. Age-related changes in open-loop and closed-loop postural control mechanisms. Exp Brain Res. 1995;104(3):480–492. doi: 10.1007/BF00231982. [DOI] [PubMed] [Google Scholar]
- 25.Mitchell S, Collins J, De Luca C, Burrows A, Lipsitz L. Open-loop and closed-loop postural control mechanisms in parkinson’s disease: increased mediolateral activity during quiet standing. Neurosci Lett. 1995;197(2):133–136. doi: 10.1016/0304-3940(95)11924-l. [DOI] [PubMed] [Google Scholar]
- 26.Sasaki O, Gagey P, Ouaknine A, Martinerie J, Le Van Quyen M, Toupet M, L’Heritier A. Nonlinear analysis of orthostatic posture in patients with vertigo or balance disorders. Neurosci Res. 2001;41(2):185–192. doi: 10.1016/s0168-0102(01)00276-0. [DOI] [PubMed] [Google Scholar]
- 27.Sasaki O, Usami S, Gagey P, Martinerie J, Le Van Quyen M, Arranz P. Role of visual input in nonlinear postural control system. Exp Brain Res. 2002;147(1):1–7. doi: 10.1007/s00221-002-1170-1. [DOI] [PubMed] [Google Scholar]
- 28.Bosek M, Grzegorzewski B, Kowalczyk A, Lubiński I. Degradation of postural control system as a consequence of parkinson’s disease and ageing. Neurosci Lett. 2005;376(3):215–220. doi: 10.1016/j.neulet.2004.11.056. [DOI] [PubMed] [Google Scholar]
- 29.Manor B, Costa M, Hu K, Newton E, Starobinets O, Kang H, Peng C, Novak V, Lipsitz L. Physiological complexity and system adaptability: Evidence from postural control dynamics of older adults. J Appl Physiol. 2010;109(6):1786–1791. doi: 10.1152/japplphysiol.00390.2010. [DOI] [PMC free article] [PubMed] [Google Scholar]
- 30.Ramdani S, Seigle B, Varoqui D, Bouchara F, Blain H, Bernard P. Characterizing the dynamics of postural sway in humans using smoothness and regularity measures. Ann Biomed Eng. 2011;39(1):161–171. doi: 10.1007/s10439-010-0137-9. [DOI] [PubMed] [Google Scholar]
- 31.Gurses S, Celik H. Correlation dimension estimates of human postural sway. Hum Mov Sci. 2013;32(1):48–64. doi: 10.1016/j.humov.2012.07.007. [DOI] [PubMed] [Google Scholar]
- 32.Collins J, De Luca C. The effects of visual input on open-loop and closed-loop postural control mechanisms. Exp Brain Res. 1995;103(1):151–163. doi: 10.1007/BF00241972. [DOI] [PubMed] [Google Scholar]
- 33.Collins J, De Luca C. Upright, correlated random walks: A statistical-biomechanics approach to the human postural control system. Chaos. 1995;5(1):57–63. doi: 10.1063/1.166086. [DOI] [PubMed] [Google Scholar]
- 34.Norris J, Marsh A, Smith I, Kohut R, Miller M. Ability of static and statistical mechanics posturographic measures to distinguish between age and fall risk. J Biomech. 2005;38(6):1263–1272. doi: 10.1016/j.jbiomech.2004.06.014. [DOI] [PubMed] [Google Scholar]
- 35.Doyle R, Ragan B, Rajendran K, Rosengren K, Hsiao-Wecksler E. Generalizability of stabilogram diffusion analysis of center of pressure measures. Gait Posture. 2008;27(2):223–230. doi: 10.1016/j.gaitpost.2007.03.013. [DOI] [PubMed] [Google Scholar]
- 36.Hernandez M, Stevenson C, Snider J, Poizner H. Center of pressure velocity autocorrelation as a new measure of postural control during quiet stance. Neural Engineering (NER), 2013 6th International IEEE/EMBS Conference on. 2013:1270–1273. [Google Scholar]
- 37.Bosek M, Grzegorzewski B, Kowalczyk A. Two-dimensional langevin approach to the human stabilogram. Hum Mov Sci. 2004;22(6):649–660. doi: 10.1016/j.humov.2004.02.005. [DOI] [PubMed] [Google Scholar]
- 38.Bosek M. Model of two noise source dependent ornstein-uhlenbeck processes applied to postural sway. Biosystems. 2008;94(3):282–284. doi: 10.1016/j.biosystems.2008.06.013. [DOI] [PubMed] [Google Scholar]
- 39.Frank T, Daffertshofer A, Beek P. Multivariate ornstein-uhlenbeck processes with mean-field dependent coefficients: application to postural sway. Phys Rev E Stat Nonlin Soft Matter Phys. 2001;63(1 Pt 1):011905. doi: 10.1103/PhysRevE.63.011905. [DOI] [PubMed] [Google Scholar]
- 40.Newell K, Slobounov S, Slobounova E, Molenaar P. Stochastic processes in postural center-of-pressure profiles. Exp Brain Res. 1997;113(1):158–164. doi: 10.1007/BF02454152. [DOI] [PubMed] [Google Scholar]
- 41.Peterka R. Postural control model interpretation of stabilogram diffusion analysis. Biol Cybern. 2000;82(4):335–343. doi: 10.1007/s004220050587. [DOI] [PubMed] [Google Scholar]
- 42.Maurer C, Mergner T, Peterka R. Abnormal resonance behavior of the postural control loop in parkinson’s disease. Exp Brain Res. 2004;157(3):369–376. doi: 10.1007/s00221-004-1852-y. [DOI] [PubMed] [Google Scholar]
- 43.Savitzky A, Golay M. Smoothing and differentiation of data by simplified least squares procedures. Analytical Chemistry. 1964;36(8):1627–1639. [Google Scholar]
- 44.Alonso D, Ruiz A, De Vega I. Polygonal billiards and transport: diffusion and heat conduction. Phys Rev E Stat Nonlin Soft Matter Phys. 2002;66(6 Pt 2):066131. doi: 10.1103/PhysRevE.66.066131. [DOI] [PubMed] [Google Scholar]
- 45.Kheifets S, Simha A, Melin K, Li T, Raizen M. Observation of brownian motion in liquids at short times: instantaneous velocity and memory loss. Science. 2014;343(28):1493–1496. doi: 10.1126/science.1248091. [DOI] [PubMed] [Google Scholar]
- 46.Shrout P, Fleiss J. Intraclass correlations: uses in assessing rater reliability. Psychol Bull. 1979;86(2):420–428. doi: 10.1037//0033-2909.86.2.420. [DOI] [PubMed] [Google Scholar]
- 47.R Core Team, R. A Language and Environment for Statistical Computing. Vienna, Austria: R Foundation for Statistical Computing; 2013. [Online]. Available: http://www.R-project.org/ [Google Scholar]
- 48.Meyer P, Oddsson L, De Luca C. The role of plantar cutaneous sensation in unperturbed stance. Exp Brain Res. 2004;156(4):505–512. doi: 10.1007/s00221-003-1804-y. [DOI] [PubMed] [Google Scholar]
- 49.Joyce G, Rack P. The effects of load and force on tremor at the normal human elbow joint. J Physiol. 1974;240(2):375–396. doi: 10.1113/jphysiol.1974.sp010615. [DOI] [PMC free article] [PubMed] [Google Scholar]
- 50.Galganski M, Fuglevand A, Enoka R. Reduced control of motor output in a human hand muscle of elderly subjects during submaximal contractions. J Neurophysiol. 1993;69(6):2108–2115. doi: 10.1152/jn.1993.69.6.2108. [DOI] [PubMed] [Google Scholar]
- 51.Keen D, Yue G, Enoka R. Training-related enhancement in the control of motor output in elderly humans. J Appl Physiol (1985) 1994;77(6):2648–2658. doi: 10.1152/jappl.1994.77.6.2648. [DOI] [PubMed] [Google Scholar]
- 52.Enoka R, Burnett A, Graves RA, Kornatz K, Laidlaw D. Task- and age-dependent variations in steadiness. Prog. Brain Res. 2000;123:389–395. doi: 10.1016/s0079-6123(08)62873-3. [DOI] [PubMed] [Google Scholar]
- 53.Yao W, Fuglevand R, Enoka R. Motor-unit synchronization increases emg amplitude and decreases force steadiness of simulated contractions. J Neurophysiol. 2000;83(1):441–452. doi: 10.1152/jn.2000.83.1.441. [DOI] [PubMed] [Google Scholar]
- 54.Kiemel T, Oie K, Jeka J. Multisensory fusion and the stochastic structure of postural sway. Biol Cybern. 2002;87(4):262–277. doi: 10.1007/s00422-002-0333-2. [DOI] [PubMed] [Google Scholar]
- 55.Kiemel T, Oie K, Jeka J. Slow dynamics of postural sway are in the feedback loop. J Neurophysiol. 2006;95(3):1410–1418. doi: 10.1152/jn.01144.2004. [DOI] [PMC free article] [PubMed] [Google Scholar]
- 56.Nomura T, Oshikawa S, Suzuki Y, Kiyono K, Morasso P. Modeling human postural sway using an intermittent control and hemodynamic perturbations. Math Biosci. 2013;245(1):86–95. doi: 10.1016/j.mbs.2013.02.002. [DOI] [PubMed] [Google Scholar]
- 57.Yamamoto T, Smith C, Suzuki Y, Kiyono K, Tanahashi T, Sakoda S, Morasso P, Nomura T. Universal and individual characteristics of postural sway during quiet standing in healthy young adults. Physiol Rep. 2015;3:3. doi: 10.14814/phy2.12329. [DOI] [PMC free article] [PubMed] [Google Scholar]
- 58.Winter D, Patla A, Prince F, Ishac M, Gielo-Perczak K. Stiffness control of balance in quiet standing. J Neurophysiol. 1998;80(3):1211–1221. doi: 10.1152/jn.1998.80.3.1211. [DOI] [PubMed] [Google Scholar]
- 59.Winter D, Patla A, Rietdyk S, Ishac M. Ankle muscle stiffness in the control of balance during quiet standing. J Neurophysiol. 2001;85(6):2630–2633. doi: 10.1152/jn.2001.85.6.2630. [DOI] [PubMed] [Google Scholar]
- 60.Gatev P, Thomas S, Kepple T, Hallett M. Feedforward ankle strategy of balance during quiet stance in adults. J Physiol. 1999;514(Pt 3):915–928. doi: 10.1111/j.1469-7793.1999.915ad.x. [DOI] [PMC free article] [PubMed] [Google Scholar]
- 61.Danna-Dos-Santos A, Degani A, Zatsiorsky V, Latash M. Is voluntary control of natural postural sway possible? J Mot Behav. 2008;40(3):179–185. doi: 10.3200/JMBR.40.3.179-185. [DOI] [PMC free article] [PubMed] [Google Scholar]
- 62.Loram I, Lakie M. Human balancing of an inverted pendulum: position control by small, ballistic-like, throw and catch movements. J Physiol. 2002;540(Pt 3):1111–1124. doi: 10.1113/jphysiol.2001.013077. [DOI] [PMC free article] [PubMed] [Google Scholar]
- 63.Loram I, Lakie M. Direct measurement of human ankle stiffness during quiet standing: the intrinsic mechanical stiffness is insufficient for stability. J Physiol. 2002;545(Pt 3):1041–1053. doi: 10.1113/jphysiol.2002.025049. [DOI] [PMC free article] [PubMed] [Google Scholar]
- 64.Loram I, Maganaris C, Lakie M. Human postural sway results from frequent, ballistic bias impulses by soleus and gastrocnemius. J Physiol. 2005;564(Pt 1):295–311. doi: 10.1113/jphysiol.2004.076307. [DOI] [PMC free article] [PubMed] [Google Scholar]
- 65.Morasso P, Schieppati M. Can muscle stiffness alone stabilize upright standing? J Neurophysiol. 1999;82(3):1622–1626. doi: 10.1152/jn.1999.82.3.1622. [DOI] [PubMed] [Google Scholar]
- 66.Bottaro A, Casadio M, Morasso P, Sanguineti V. Body sway during quiet standing: is it the residual chattering of an intermittent stabilization process? Hum Mov Sci. 2005;24(4):588–615. doi: 10.1016/j.humov.2005.07.006. [DOI] [PubMed] [Google Scholar]
- 67.Morasso P, Sanguineti V. Ankle muscle stiffness alone cannot stabilize balance during quiet standing. J Neurophysiol. 2002;88(4):2157–2162. doi: 10.1152/jn.2002.88.4.2157. [DOI] [PubMed] [Google Scholar]
- 68.Milton J, Townsend J, King M, Ohira T. Balancing with positive feedback: the case for discontinuous control. Philos Trans A Math Phys Eng Sci. 2009;367(1891):1181–1193. doi: 10.1098/rsta.2008.0257. [DOI] [PubMed] [Google Scholar]
- 69.Doeringer J, Hogan N. Intermittency in preplanned elbow movements persists in the absence of visual feedback. J Neurophysiol. 1998;80(4):1787–1799. doi: 10.1152/jn.1998.80.4.1787. [DOI] [PubMed] [Google Scholar]
- 70.Asai Y, Tasaka Y, Nomura K, Nomura T, Casadio M, Morasso P. A model of postural control in quiet standing: robust compensation of delay-induced instability using intermittent activation of feedback control. PLoS One. 2009;4(7):e6169. doi: 10.1371/journal.pone.0006169. [DOI] [PMC free article] [PubMed] [Google Scholar]
- 71.Stepan G. Delay effects in the human sensory system during balancing. Philos Trans A Math Phys Eng Sci. 2009;367(1891):1195–1212. doi: 10.1098/rsta.2008.0278. [DOI] [PubMed] [Google Scholar]
- 72.Boulet J, Balasubramaniam R, Daffertshofer A, Longtin A. Stochastic two-delay differential model of delayed visual feedback effects on postural dynamics. Philos Trans A Math Phys Eng Sci. 2010;368(1911):423–438. doi: 10.1098/rsta.2009.0214. [DOI] [PubMed] [Google Scholar]


