

Abstract
BACKGROUND
There is no convenient cheap pragmatic experimental model for Nonalcoholic Fatty Liver Disease (NAFLD)/Nonalcoholic Steatohepatitis (NASH). Objective: Our objective was to create a pragmatic model of NAFLD/NASH.
METHODS
Sprague-Dawley rats were fed a high-fat, high sugar homemade diet ad libitum for seven weeks. The high-fat, high sugar diet included 59% of energy derived from fat, 30% from carbohydrates, and 11% from protein. Serum levels of fasting glucose, triglyceride, cholesterol, liver enzymes, insulin, and hepatic tumor necrosis factor-alpha (TNF-α) gene expression were determined. Hepatic histology was examined by H&E stain.
RESULTS
Rats fed the high-fat, high sugar diet developed hepatic steatosis, and a moderate inflammation, which was associated with increased serum levels of liver enzymes, glucose, insulin, triglyceride, cholesterol, and hepatic TNF-α gene expression.
CONCLUSION
This rat model resembles the key features of human NAFLD/NASH and provides a simple pragmatic experimental model for elucidating the disease prevention and treatment.
Keywords: Experimental model, NAFLD, NASH, Rat, Nonalcoholic Fatty Liver Disease, Diet
INTRODUCTION
Non-alcoholic fatty liver disease (NAFLD) is one of the most common chronic liver disorders in the world causing a range of Histopathological features from simple hepatic steatosis to liver cirrhosis.1-3 Pathogenesis of NAFLD is associated with metabolic syndrome.4, 5 In metabolic syndrome, insulin cannot function properly, leading to activation of lipolysis pathways, which results in an increased influx of free fatty acids to the hepatocytes.6 Furthermore, the gene expression of some pro-inflammatory cytokines such as TNF-α increases in metabolic syndrome leading to malfunction of insulin receptors and insulin resistance.7
Studies of NAFLD/NASH on human subjects are not feasible because the development of NAFLD/NASH needs a long duration of time, and ethical considerations limit prescription of medications, and obtaining the hepatic tissues from patients. Animal models of NAFLD/NASH have provided researchers some critical data in finding some factors involved in development of NAFLD/NASH and assessment of various agents in treatment of the disease. These animal models are designed to simulate the clinical and hepatocellular features of human NAFLD/NASH.8 Lack of proper experimental models has hindered the investigation on pathogenic and therapeutic factors involved in fatty liver disease and the underlying liver metabolisms which lead to fat accumulation in the liver tissue.9, 10
Existing models consist of gene alterations, diet modifications or combinations of these two methods.8 The most important limitation of previous models is that they cannot fully represent multi factorial characteristics of NASH seen in human patients.
Thus, high-calorie diets are commonly used to induce fatty liver. Using high-fat diets to induce fatty liver in animal models is a similar model mimicking the pathogenesis of NAFLD in humans.9, 10
The aim of present study was to produce a practical, precise, and economical NASH model by designing a high-fat diet that provides all essential nutrients sufficiently and to be palatable enough to be consumed by rats in sufficient quantities so that it will eventually lead to weight gain. We hope that this model would represent the key features of NASH in humans.
MATERIALS AND METHODS
Animals and Diets
Twelve male Sprague-Dawley rats (weighted 150-200 gram), which were purchased from Pasteur Institute (Karaj, Iran), were individually housed in wire bar-floor cages. The animals’ weights were measured at the beginning of the study, and every week, while their food intakes were measured twice a week during the study. The first week after arrival, all the animals were fed the standard chow diet ad libitum to be acclimatized to the new standard environment with temperature of 22°C, humidity of 50% and 12-h light/dark cycles and then, they were randomly assigned to two groups fed either a standard chow diet with 10% of energy derived from fat, 30% from protein, and 60% from carbohydrates or a high-fat, high sugar diet with 59% of energy derived from fat, 30% from carbohydrates, and 11% from protein. Both groups were fed ad libitum. The high fat, high sugar diet was prepared by mixing the following items: 28% butter, 28% chow diet, 14% sugar, 19% yolk egg, and 11% white egg, then leaving the product in 100°C oven for 30 minutes, and cutting it to small cubes. The diets were prepared every week, and stored at –20°C. They were thawed every other day at 4°C in fridge. The food was delivered every other day at the beginning of the dark phase, and the remains were weighed and removed after 48 hours.
After seven-week feeding period, animals were sacrificed by exsanguination under light anesthesia. All procedures were carried out in accordance with the National Nutrition and Food Technology Research Institute (NNFTRI). The study protocol was approved at NNFTRI ethics committee with ethics code of NNFTRI 1393-568.
Tissue and Blood Preparation
Blood samples were collected in heparinized tubes; then, centrifuged (3500 rpm, 15 min, at 6°C) to separate the plasma. Plasma glucose was measured immediately, and the remaining samples were kept at -80°C before biochemical analysis.
Then, one lobe of each liver tissue was excised, and inserted in 10% buffered-formalin solution for histopathologic examination. Other liver samples (200 mg) were placed in liquid nitrogen tank, and then kept at -80°C for gene expression evaluation.10-13
RNA Extraction and Quantitative RT-PCR
Total RNA was extracted using RNeasy Plus Mini Kits (Qiagen) according to the manufacturer’s instructions and cDNA synthesized using Superscript II reverse transcriptase (Invitrogen). Quantitative real-time PCR was performed using the Bio-Rad Real-Time PCR System, using IQ SYBR Green Supermix (Bio-Rad).
The PCR mix contained 2 µl cDNA, 1 µl of the appropriate forward and reverse primers, and 2 µl SYBR Green PCR Master mix in a total volume of 25 mL. PCR consisted of 50 cycles of denaturation at 94°C for 30s, annealing at melting temperature (Tm) for 30 s, and extension at 72°C for 60 s. Primer sequences for each target gene, their source as well as their optimal PCR annealing temperatures are as follows: GAPDH forward primer 5′-GTGCTGAGTATGTCGTGGAGTCTA-3′ and reverse 5′- TCTCGTGGTTCACACCCATCAC -3′ (Tm 60°C), and TNF-α forward primer 5′- ACT GAA CTT CGG GGT GAT TG -3′ and reverse 5′- GCT TGG TGG TTT GCT ACG AC -3′ (Tm 60°C). Primer specificity was confirmed from the product size by agarose gel electrophoresis and the specificity of the PCR products checked by melt curve analysis.
Biochemical Assessments
Liver enzymes levels in plasma including alanine aminotransferase (ALT), and aspartate aminotransferase (AST) were measured using Sigma kits (Sigma Diagnostic, St Louis), and insulin concentrations were measured using the radioimmunoassay kit (Linco Research Inc, St Charles, MO). Serum Glucose and lipids including total cholesterol and triglycerides were measured calorimetrically using a commercial kit (Parsazmoon, Tehran, Iran).
Histopathology
Five sections from different lobes of each liver were submitted and processed by ethyl alcohol and xylene series, and embedded in paraffine blocks. Slides were stained with Hematoxyline Eosin and Masson’s Trichome and viewed under light microscopy by Nikon E 200. The grading was defined as follow: stages of steatosis were 0-3 indicating no fat, steatosis occupying less than 33% of the hepatic parenchyma, 34-66% of the hepatic parenchyma, and more than 66% of the hepatic parenchyma respectively; stages of inflammation were 0-3 indicating none, 1-2 foci/field, 3-4 foci/field, and more than 4 foci/field respectively13; for ballooning stages of 0-3 were indicated as minimal, mild , moderate, and markedrespectively.14
Statistical Analysis
Results are expressed as median (interquartile range) mean±SE and using Mann Whitney, Kruskal Wallis and chi-square tests. P<0.05 was considered for significance level. All statistical analyses were performed with the use of either GraphPad Prism Software Version 5.00 (GraphPad Software, SanDiego, CA), or SPSS 20.0 software (Chicago, IL, USA).
RESULTS
Body Weight, Food Consumption
The primary average weight in NAFLD model and control groups were 139 and 130 gram respectively, which were not statistically different. The animals were weighted at weeks 1, 3, 5, and 7 (Figure 1); from 5th week, the mean weight of animals in model group was significantly more than those in control group (p=0.002).
Fig. 1 .

Mean weight of rat nonalcoholic fatty liver disease the model and the control groups (n=6 in each group) at weeks 1, 3, 5, and 7; from 5th week, the mean weight of model group was significantly more than control group (p=0.002).
Mean food intake of animals in model group was significantly more than those in control group during the study (Figure 2); p values at weeks one to seven were 0.009, 0.015, 0.015, 0.002, 0.002,0.002, and 0.002 respectively.
Fig. 2 .

Mean food intake in rat nonalcoholic fatty liver disease the model and the control groups (n=6 in each group) at the end of each week. p values at weeks one to seven were 0.009, 0.015, 0.015, 0.002, 0.002,0.002, and 0.002 respectively.
Biochemical Assay
Plasma glucose and Insulin levels were significantly increased in model group compared with the controls (Table 1). Plasma levels of liver enzymes also were significantly elevated in model group in comparison to control group (Table 1). Plasma TG, cholesterol, and LDL cholesterol of model group were significantly more than control group at week seven (Table 1).
Table 1 . Plasma mean levels of glucose, insulin, lipids, and liver enzymes in rat Nonalcoholic fatty liver disease model and control group (n=6 in each group) .
|
model group
median (IQR) |
Control group
median (IQR) |
p -value | |
| ALT (IU/L) | 36 (28.2-65.7) | 20.5 (15.5-23.7) | 0.004 |
| AST (IU/L) | 45 (42.2-52) | 21.5 (18.5-24.5) | 0.002 |
| GGT (IU/L) | 12.3 (5.3-18) | 4 (2.7-7.5) | 0.02 |
| Glucose (mg/dL) | 179.3 (168-191) | 152.5 (137.7-159.7) | 0.009 |
| Insulin (pmol/l) | 540 (411-606) | 196 (171-230.5) | 0.001 |
| TG (mg/dL) | 159.5 (143.7-168.7) | 108 (97.7-118.7) | 0.002 |
| Cholesterol (mg/dL) | 145 (120-171.5) | 104 (96.5-118) | 0.009 |
| HDL.c (mg/dL) | 27.5 (22.2-35.2) | 30 (26.5-37) | 0.390 |
| LDL.c (mg/dL) | 87.4 (62.2-109) | 39 (31-56.2) | 0.009 |
TNF – α Gene Expression
Hepatic TNF-α gene expression was significantly increased in model group in comparison to control group (Figure 3).
Fig. 3 .
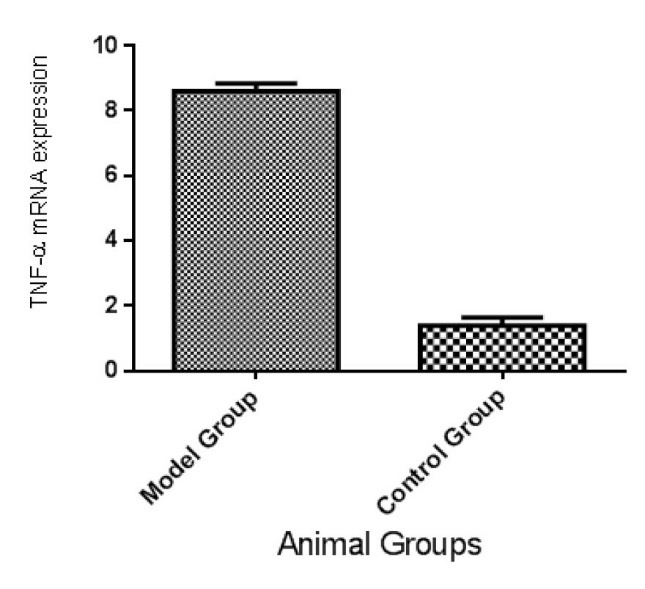
Mean and SE of Hepatic TNF-α gene expression in rat nonalcoholic fatty liver disease model and control groups (n=6 in each group), which is significantly different between two groups (p<0.01).
Histological Observations
Microscopic examination of hepatic tissues showed minimal accumulation of fat droplets in the hepatocytes of rats fed the chow diet (Fig. 4A, C, Table 2), while most of the animals in model group developed stages 2 and 3 of hepatic steatosis, ballooning, and inflammation (Fig. 4B, D, Table 2).
Fig. 4 .
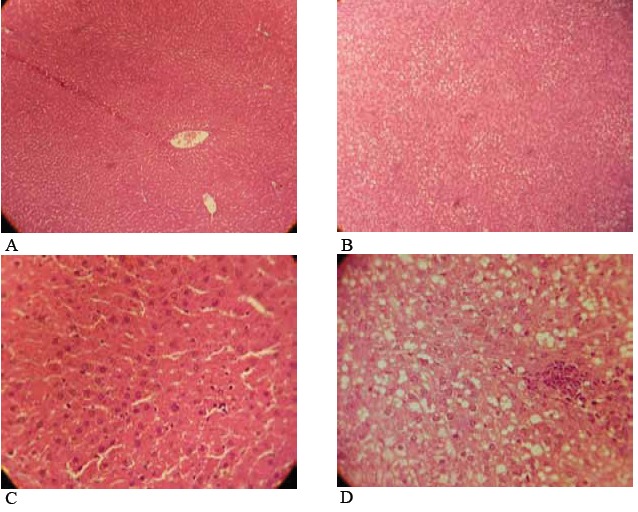
Hepatic pathology in rats fed high fat, high sugar diets ad libitum. The livers of rats fed the chow diet showed an accumulation of glycogen and minimal fat, and few inflammatory cells (A) ×100, (C) ×400, The livers of rats fed the high fat, high sugar diet showed pronounced hepatic steatosis, and abundant mononuclear inflammatory cells (B) ×100, (D) ×400. The liver samples were stained with hematoxylin and eosin.
Table 2 . Histopathological characteristics of rat Nonalcoholic fatty liver disease model and control groups (n=6 in each group).
| group | stage |
P
value
(model vs. control) |
||
| low | high | |||
| Steatosis n(%) | model | 2 (33.3) | 4 (66.7) | 0.002 |
| control | 6 (100) | 0 | ||
| Ballooning n(%) | model | 1 (16.7) | 5 (83.3) | 0.025 |
| control | 6 (100) | 0 | ||
| lobular inf. n(%) | model | 2 (33.3) | 4 (66.7) | 0.046 |
| control | 6 (100) | 0 | ||
| portal inf. n(%) | model | 2 (33.3) | 4 (66.7) | 0.025 |
| control | 6 (100) | 0 | ||
DISCUSSION
Experimental models of NAFLD/NASH are needed for examining different agents and their optimal dose in prevention and/or treatment of the disease. The experimental models should mimic the clinical and hepatocellular features of human NAFLD/NASH. Thus, the hepatic histopathology of animal models of NAFLD/NASH must be the same as what is seen in human NAFLD/NASH. Moreover, the animal models must mimic the clinical features of NAFLD/NASH in human such as insulin resistance, overweight, and hyperlipidemia; otherwise, the results of studies on these models cannot be applied in human disease.
Few experimental models of NAFLD/NASH have been designed currently,8 however the high fat diet induced models most resemble hepatic histopathology and pathophysiology of human NAFLD/NASH. High fat diet induced models show the NAFLD/NASH associated metabolic abnormalities such as obesity, insulin resistance, hyperglycemia, and dyslipidemia;8-10, 12, 13, 15 however, some of them do not show all characteristics of human NAFLD.8-10, 12, 13, 15 Our model of experimental NAFLD has the advantage of showing all NAFLD and metabolic syndrome features resembling the human disease.
Using purified diets for induction of NAFLD/NASH is budget consuming and unavailable in our country. This limitation has been overcome in the present study. By feeding rats a homemade, high-fat, high sugar diet ad libitum, we reproduced the typical hepatic features of NAFLD/NASH, associated with all its common features such as increased liver enzymes, insulin resistance, hyperlipidemia, and inflammation. The other similarity of this model to the human disease is that the diet was provided to animals ad libitum, which resembles the real life development of the disease.
The hepatic TNF-α gene expression increased in our model; this pro-inflammatory cytokine is involved in the histologic inflammation and the insulin resistance which lead to hepatic steatosis. Previous studies have shown that serum level of TNF-α increases in NAFLD/NASH, which enhance the steatosis and lead to hepatic inflammation.16, 17
We had previously tried to induce NAFLD/NASH model by feeding rats a high fat diet, but the animals did not show the key features of the disease. After adding sugar to the diet, all characteristics of the disease could be observed in the animals; these data confirm the previous findings that have shown the critical role of simple sugars specially fructose in pathogenesis of NAFLD/NASH.11, 18, 19
The advantages of this model are its cheapness, short time induction of disease, high similarity to human disease, showing all features of the disease, and availability of diet components. Moreover, all features of the disease have been shown in at least 80% of the animals indicating the high reproducibility of the model induction.
In Conclusion, we could reproduce successfully a convenient, cheap, and pragmatic experimental model of NAFLD/NASH by feeding the animals a home made high fat, high sugar diet. This model not only resembles the human disease, but also represents all key features of the disease. This model provides a useful tool for finding strategies for prevention and treatment of NAFLD/NASH.
CONFLICT OF INTEREST
The authors declare no conflict of interest related to this work.
Please cite this paper as:
Emamat H, Noori M, Foroughi F, Rismanchi M, Eini–Zinab H, Hekmatdoost A. An accessible and Pragmatic Experimental Model of Nonalcoholic Fatty Liver Disease. Middle East J Dig Dis 2016;8:109-115. DOI : 10.15171/mejdd.2016.15
References
- 1.Farrell GC, Larter CZ. Nonalcoholic fatty liver disease: from steatosis to cirrhosis. Hepatology. 2006;43(2 Suppl 1):S99–S112. doi: 10.1002/hep.20973. [DOI] [PubMed] [Google Scholar]
- 2.Ahmed U, Redgrave TG, Oates PS. Effect of dietary fat to produce non-alcoholic fatty liver in the rat. J Gastroenterol Hepatol. 2009;24:1463–71. doi: 10.1111/j.1440-1746.2009.05870.x. [DOI] [PubMed] [Google Scholar]
- 3.Ludwig J, McGill DB, Lindor KD. Review: nonalcoholic steatohepatitis. J Gastroenterol Hepatol. 1997;12:398–403. doi: 10.1111/j.1440-1746.1997.tb00450.x. [DOI] [PubMed] [Google Scholar]
- 4.Ratziu V, Giral P, Charlotte F, Bruckert E, Thibault V, Theodorou I. et al. Liver fibrosis in overweight patients. Gastroenterology. 2000;118:1117–23. doi: 10.1016/S0016-5085(00)70364-7. [DOI] [PubMed] [Google Scholar]
- 5.Marchesini G, Brizi M, Morselli-Labate AM, Bianchi G, Bugianesi E, McCullough AJ. et al. Association of nonalcoholic fatty liver disease with insulin resistance. Am J Med. 1999;107:450–5. doi: 10.1016/S0002-9343(99)00271-5. [DOI] [PubMed] [Google Scholar]
- 6.Valenti L, Fracanzani AL, Dongiovanni P, Santorelli G, Branchi A, Taioli E. et al. Tumor necrosis factor α promoter polymorphisms and insulin resistance in nonalcoholic fatty liver disease. Gastroenterology. 2002;122:274–80. doi: 10.1053/gast.2002.31065. [DOI] [PubMed] [Google Scholar]
- 7.Petta S, Muratore C, Craxi A. Non-alcoholic fatty liver disease pathogenesis: the present and the future. Dig Liver Dis. 2009;41:615–25. doi: 10.1016/j.dld.2009.01.004. [DOI] [PubMed] [Google Scholar]
- 8.Takahashi Y, Soejima Y, Fukusato T. Animal models of nonalcoholic fatty liver disease/nonalcoholic steatohepatitis. World J Gastroenterol. 2012;18:2300–8. doi: 10.3748/wjg.v18.i19.2300. [DOI] [PMC free article] [PubMed] [Google Scholar]
- 9.Lieber CS, Leo MA, Mak KM, Xu Y, Cao Q, Ren C. et al. Model of nonalcoholic steatohepatitis. Am J Clin Nutr. 2004;79:502–9. doi: 10.1093/ajcn/79.3.502. [DOI] [PubMed] [Google Scholar]
- 10.Safwat GM, Pisano S, D’Amore E, Borioni G, Napolitano M, Kamal AA. et al. Induction of non-alcoholic fatty liver disease and insulin resistance by feeding a high-fat diet in rats: does coenzyme Q monomethyl ether have a modulatory effect? Nutrition. 2009;25:1157–68. doi: 10.1016/j.nut.2009.02.009. [DOI] [PubMed] [Google Scholar]
- 11.Ackerman Z, Oron-Herman M, Grozovski M, Rosenthal T, Pappo O, Link G. et al. Fructose-induced fatty liver disease: hepatic effects of blood pressure and plasma triglyceride reduction. Hypertension. 2005;45:1012–8. doi: 10.1161/01.HYP.0000164570.20420.67. [DOI] [PubMed] [Google Scholar]
- 12.Dhibi M, Brahmi F, Mnari A, Houas Z, Chargui I, Bchir L. et al. The intake of high fat diet with different trans fatty acid levels differentially induces oxidative stress and non alcoholic fatty liver disease (NAFLD) in rats. Nutr Metab (Lond) 2011;8:65. doi: 10.1186/1743-7075-8-65. [DOI] [PMC free article] [PubMed] [Google Scholar]
- 13.Xu ZJ, Fan JG, Ding XD, Qiao L, Wang GL. Characterization of high-fat, diet-induced, non-alcoholic steatohepatitis with fibrosis in rats. Dig Dis Sci. 2010;55:931–40. doi: 10.1007/s10620-009-0815-3. [DOI] [PMC free article] [PubMed] [Google Scholar]
- 14.Brunt EM, Janney CG, Di Bisceglie AM, Neuschwander-Tetri BA, Bacon BR. Nonalcoholic steatohepatitis: a proposal for grading and staging the histological lesions. Am J Gastroenterol. 1999;94:2467–74. doi: 10.1111/j.1572-0241.1999.01377.x. [DOI] [PubMed] [Google Scholar]
- 15.Buettner R, Parhofer KG, Woenckhaus M, Wrede CE, Kunz-Schughart LA, Scholmerich J. et al. Defining high-fat -diet rat models: metabolic and molecular effects of different fat types. J Mol Endocrinol. 2006;36:485–501. doi: 10.1677/jme.1.01909. [DOI] [PubMed] [Google Scholar]
- 16.Liu J, Zhuang ZJ, Bian DX, Ma XJ, Xun YH, Yang WJ. et al. Toll-like receptor-4 signalling in the progression of non-alcoholic fatty liver disease induced by high-fat and high-fructose diet in mice. Clin Exp Pharmacol Physiol. 2014;41:482–8. doi: 10.1111/1440-1681.12241. [DOI] [PubMed] [Google Scholar]
- 17.Eslamparast T, Poustchi H, Zamani F, Sharafkhah M, Malekzadeh R, Hekmatdoost A. Synbiotic supplementation in nonalcoholic fatty liver disease: a randomized, double-blind, placebo-controlled pilot study. Am J Clin Nutr. 2014;99:535–42. doi: 10.3945/ajcn.113.068890. [DOI] [PubMed] [Google Scholar]
- 18.Yilmaz Y. Review article: fructose in non-alcoholic fatty liver disease. Aliment Pharmacol Ther. 2012;35:1135–44. doi: 10.1111/j.1365-2036.2012.05080.x. [DOI] [PubMed] [Google Scholar]
- 19.Kazumi T, Odaka H, Hozumi T, Ishida Y, Amano N, Yoshino G. Effects of dietary fructose or glucose on triglyceride production and lipogenic enzyme activities in the liver of Wistar fatty rats, an animal model of NIDDM. Endocr J. 1997;44:239–45. doi: 10.1507/endocrj.44.239. [DOI] [PubMed] [Google Scholar]