Summary
Nuclear pore complexes (NPCs) are fundamental components of all eukaryotic cells that mediate nucleocytoplasmic exchange. Elucidating their 110 MDa structure imposes a formidable challenge and requires in situ structural biology approaches. Fifteen out of about thirty nucleoporins (Nups) are structured and form the Y- and inner ring complexes. These two major scaffolding modules assemble in multiple copies into an eight-fold rotationally symmetric structure that fuses the inner and outer nuclear membranes to form a central channel of ∼60 nm in diameter 1. The scaffold is decorated with transport channel Nups that often contain phenylalanine (FG)-repeat sequences and mediate the interaction with cargo complexes. Although the architectural arrangement of parts of the Y-complex has been elucidated, it is unclear how exactly it oligomerizes in situ. Here, we combined cryo electron tomography with mass spectrometry, biochemical analysis, perturbation experiments and structural modeling to generate the most comprehensive architectural model of the NPC to date. Our data suggest previously unknown protein interfaces across Y-complexes and to inner ring complex members. We demonstrate that the higher eukaryotic transport channel Nup358 (RanBP2) has a previously unanticipated role in Y-complex oligomerization. Our findings blur the established boundaries between scaffold and transport channel Nups. We conclude that, similarly to coated vesicles, multiple copies of the same structural building block - although compositionally identical - engage in different local sets of interactions and conformations.
Throughout eukaryotes, the NPC has a three-ringed, sandwiched architecture 1. The inner ring complex (IR) has five members in mammals, namely Nups 205, 188, 155, 93, and 35 2. The cytoplasmic (CR) and nuclear rings (NR) are composed of multiple copies of the ten-membered Y-complex. X-ray structures of almost all its domains have been solved 3 and their localization within the overall Y-shape has been determined in vitro 4–6. Nup160, Nup37 and Elys localize to the large arm of the Y, and Nup85, Nup43 and Seh1 to the small arm. Nup96 and Sec13 comprise the stem base and join the two arms in a central hub element, collectively known as the vertex. Nup107 and Nup133 comprise the stem tip and are highly flexible in isolation 4,5. Scaffold Nups contain beta propeller and alpha solenoid domains 1. Although the NPC scaffold is symmetric across the nuclear envelope plane, a different set of transport channel Nups asymmetrically binds to the CR and NR. Two subcomplexes exclusively localize to the CR, the Nup214-Nup88-Nup62 complex 7 that also contains Rae1 and Nup98 as well as the Nup358 - RanGAP1*SUMO1 - Ubc9 complex 8. Nups Elys, Tpr, 50 and 153 are well-established members of the NR 1. In contrast, the Nup62-Nup58-Nup54 complex that is anchored to the scaffold via Nup93 1, appears symmetrically distributed.
We previously proposed that a total of 32 Y-complexes form two concentric, reticulated rings in both the CR and NR 4,9. The basic structural element is a dimer of two slightly shifted, tandem complexes that are referred to as the outer and inner Y-complex with respect to their distances to the nucleocytoplasmic axis. A recent crystallographic analysis of the entire vertex was overall consistent 10. From these findings arose a number of questions about how exactly this intriguing architectural arrangement is held together. Specifically, how are two concentric rings of different diameter formed by the same Y-complex building blocks? How do they interact with each other? Are those interactions identical within the NR and CR? Are they sufficient for the stability of the two concentric rings or are additional Nups required for oligomerization? Here, we addressed these questions, using an integrated in situ structural biology approach.
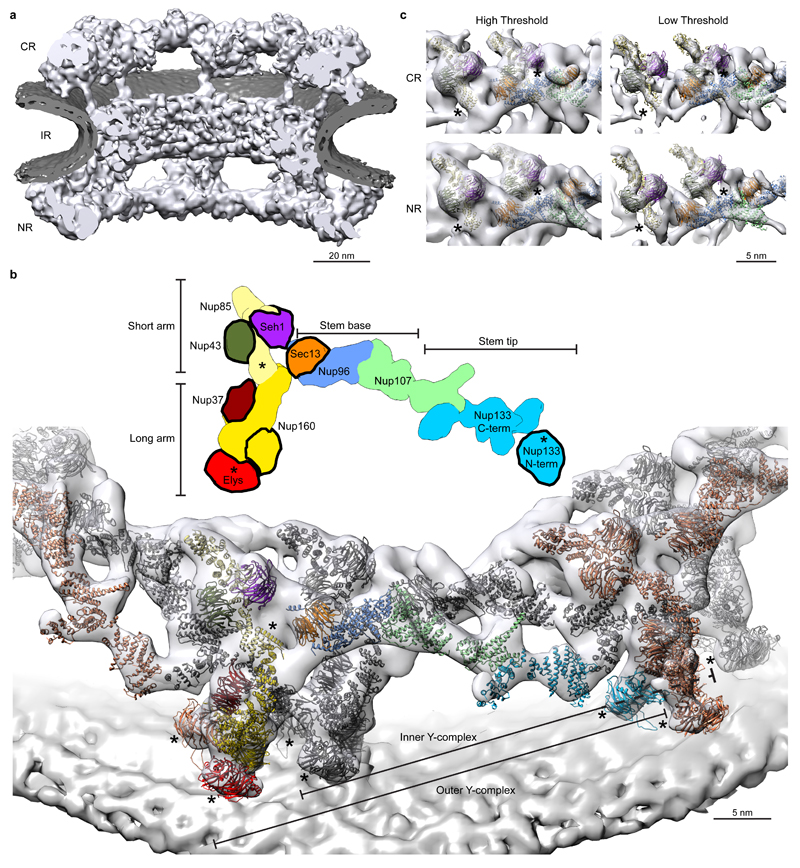
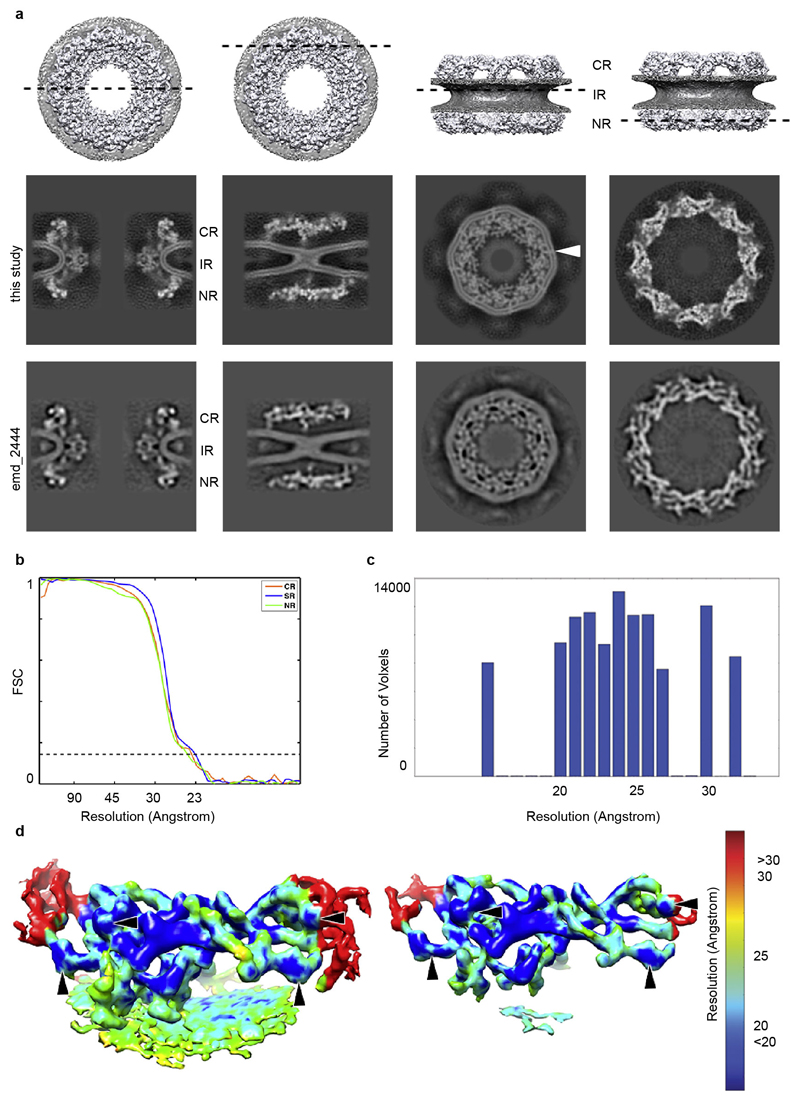
Using direct electron detection, we obtained a tomographic map of the NPC resolved overall to 23 Å with some local deviations in resolution (Fig. 1a and Extended Data Fig. 1, 2). In each of the four vertex positions per asymmetric unit, the crystal structures or homology models are seamlessly fitted (Fig. 1b) and certain structural features, such as e.g. individual beta propellers are clearly evident (Fig. 1c, Extended Data Fig. 3, Extended Data Tab. 1, Supplementary Table 1 and Video 1). In addition to previous analysis 4,10 the structures of Nup37, Nup43 and the Nup107 C-terminal domain in complex with Nup133 C-terminal domain can be unambiguously assigned outgoing from the vertex proteins. Those assignments are critical to understand how Y-complexes interact with each other in situ (see below). Although electron optical density for the beta propellers of Elys and Nup133 N-terminal domain is clearly seen in proximity of their known interfaces to Nup160 11,12, their exact orientation remains partially ambiguous because they might rotate around the beta propeller axis or flip perpendicularly to it (Supplementary Table 1). These interfaces – although biochemically defined – still await high-resolution structural analysis.
Figure 1. Tomographic map of the human NPC.
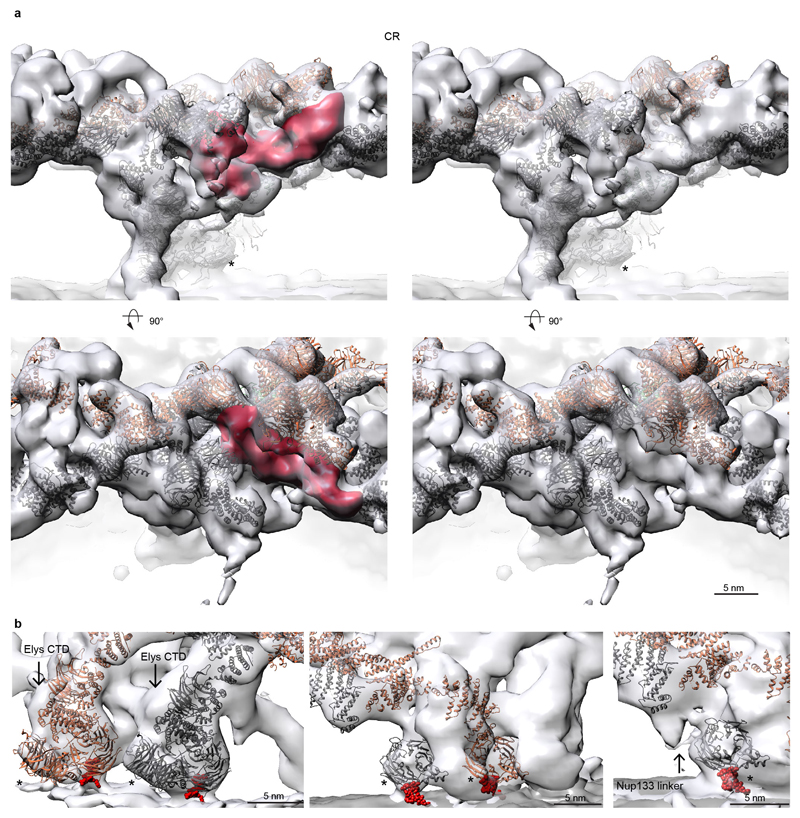
(a) The structure is shown cut in half (membranes in dark grey). (b) Segment of the NR with the two staggered inner (grey) and outer Y-complexes with their anterior and posterior counterparts (colored grey and orange). Color code according to the scheme on top (beta propellers highlighted with black strokes). Asterisks mark structures that can be unambiguously positioned but have some uncertainty in their orientation. (c) The small arm region of the inner and outer vertices is shown with two different isosurface thresholds. The fits of Nup85–Seh1, Nup43 and Sec13–Nup96–Nup107 are shown superimposed.
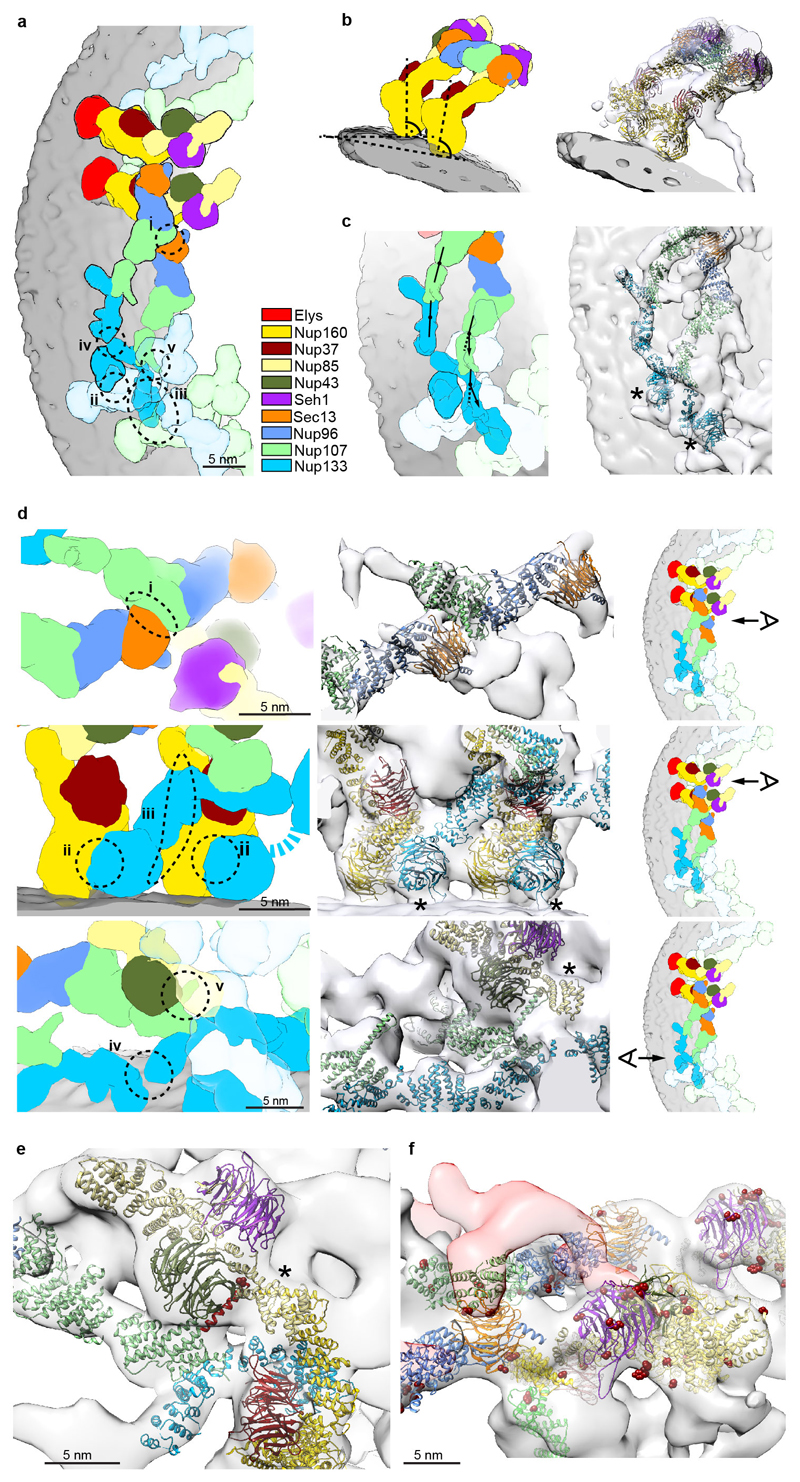
A number of minor conformational differences between the inner and outer Y-complexes are apparent in situ (Extended Data Fig. 4), which are consistent with the hinges observed within the stem in vitro 4,13. A major conformational difference is apparent for the N terminal beta propeller of Nup133 that is important for forming the head-to-tail contact with Nup160 12. Although both the inner and the outer copy are identically positioned with respect to Nup160, their position with respect to the corresponding Nup133 C-terminal domain is very different (Extended Data Fig. 4d), suggesting a critical function of the hinges for scaffold formation. Our structural model suggests five protein interfaces that contribute to Y-complex oligomerization in situ (Extended Data Fig. 4d), only two of which were previously described 4,10,12,14. Interestingly, several of those across the inner and outer Y-complex appear to be specific to higher eukaryotes. The inner Nup133 (residues 519–907) interfaces with the outer Nup37 and a region of Nup160 of unknown structure (residues 181–195). The outer Nup43 interfaces with the inner finger 15 region of Nup107 (Extended Data Fig. 2b, 4e). The latter four are absent in S. cerevisiae. Furthermore, phosphorylation sites that might control NPC disassembly at the onset of mitosis in higher eukaryotes 16,17 are enriched at such interfaces (Extended Data Fig. 4f). These findings support the previously proposed hypothesis 18 that NPC scaffold organization might be variable across species.
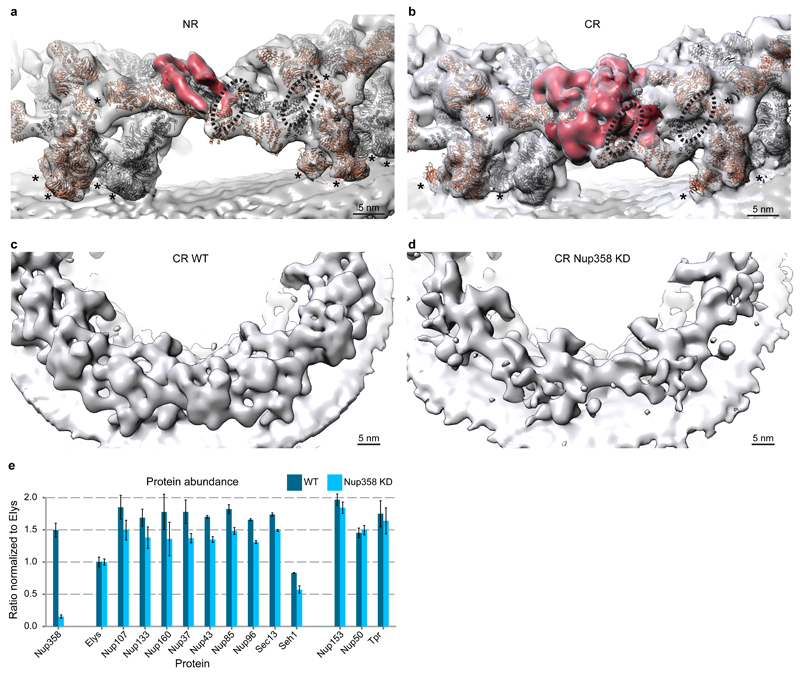
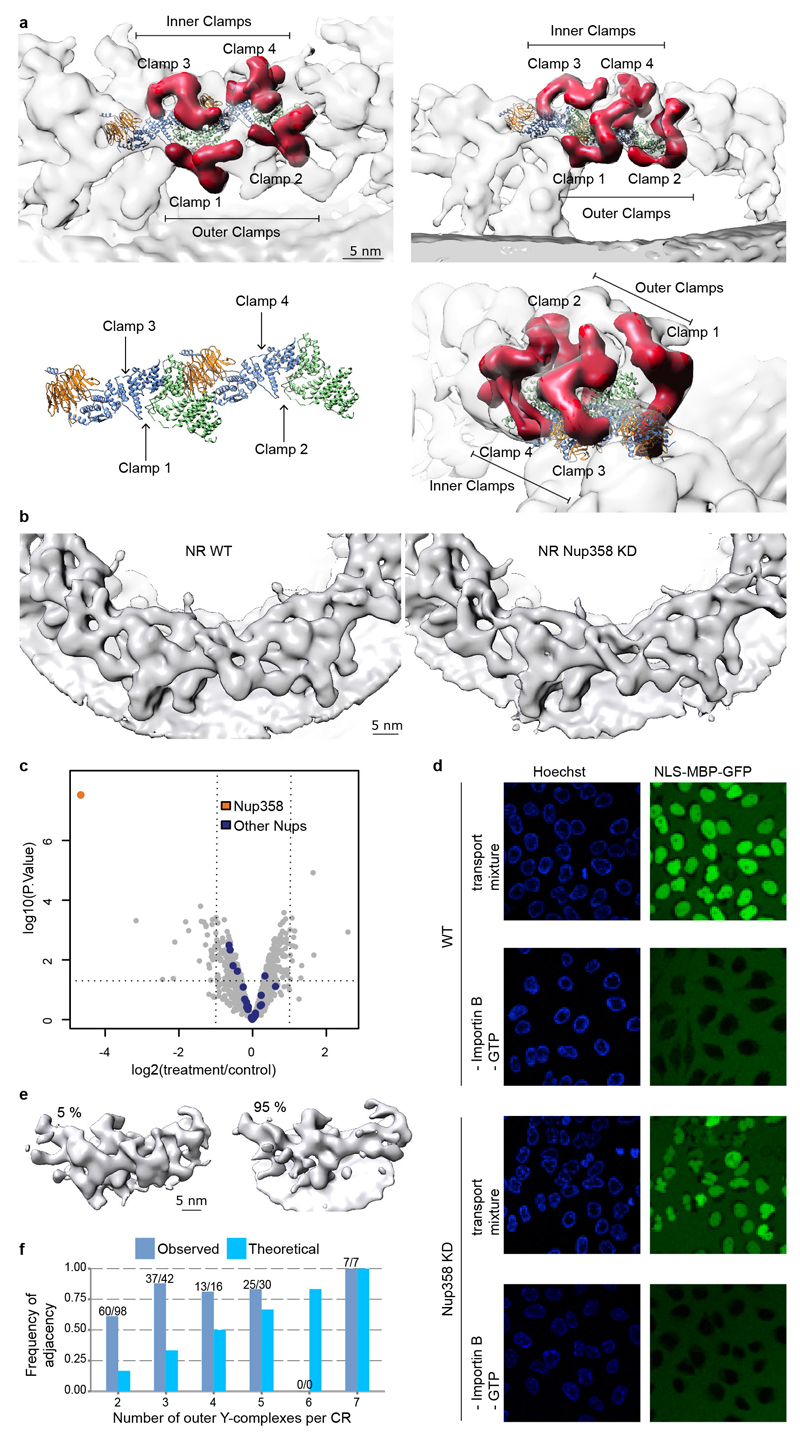
The stem bases of inner and outer Y-complexes are differently connected in the CR as compared to NR (Fig. 2a, b, Extended Data Fig. 5). In the CR, this density possibly could account for either of the Nup214 or 358 complexes. Gene silencing of the Nup214 however do not cause alterations of Y-complexes 4. To test if Nup358 complex contributes to this density, we obtained a tomographic map after removal of Nup358 complex using gene silencing (Extended Data Fig. 5). This structure displayed a striking phenotype. The outer Y-complex was missing in the CR (Fig. 2c, d) but not in the NR (Extended Data Fig. 5b). This finding was confirmed using classification of subtomograms and stoichiometric measurements (Extended Data Fig. 5e, f and Fig. 2e). We conclude that Nup358, which is not yet classified as a scaffold Nup, plays an unanticipated role in the maintenance of the quaternary structure of the CR. Intriguingly, variations in expression levels of Nup358 are highly relevant to human health (e.g. see 19). Which Nup fulfills a similar role in the NR remains to be investigated. Interestingly, a recent proximity labeling study suggested that Tpr binds to the respective region of the Y-complex 20.
Figure 2. Nup358 complex stabilizes the CR.
The connecting density (red) between the inner (grey) and outer (orange) Y-complexes differs in the NR (a) as compared to the CR (b). While the finger domain of Nup107 (dotted lines) is engaged with the connecting density, its inner counterpart is engaged with Nup43. Asterisks mark structures that can be unambiguously positioned but have some uncertainty in their orientation (c, d) Removal of Nup358 complex causes loss of the outer Y-complex in the CR but not NR (Extended Data Fig. 5). Tomographic structures are shown for the control (WT, c) and knockdown condition (KD, d). (e) Stoichiometric measurements show that in contrast to nuclear oriented Nups, Y-complex members are reduced by ∼20% upon Nup358 knockdown (combined p-value excluding Elys: 1.31e-6; one-sided Welch t-test combined using Fisher's method; error bars indicate median absolute deviation across three biological replicates and multiple independent peptides).
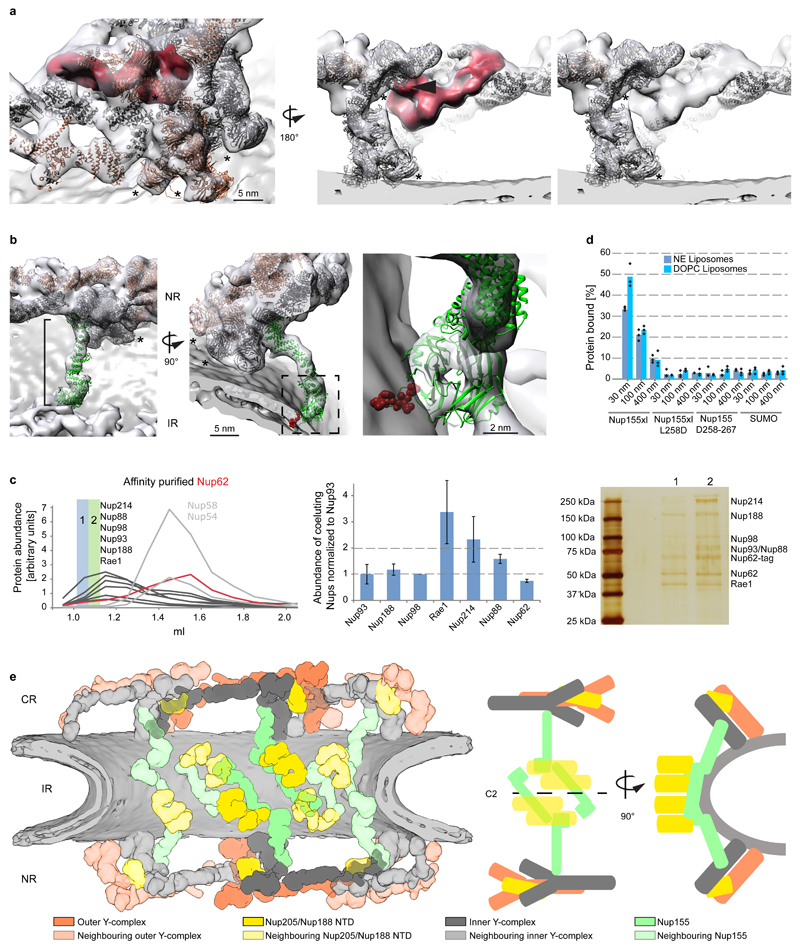
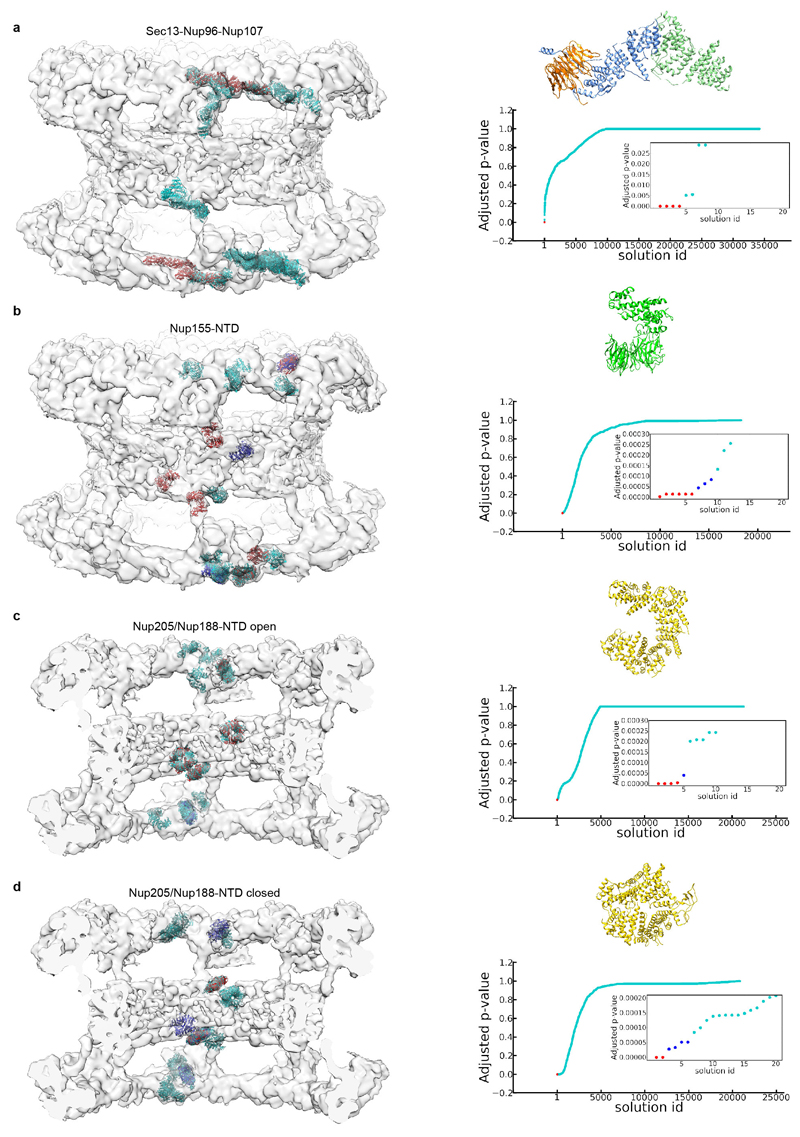
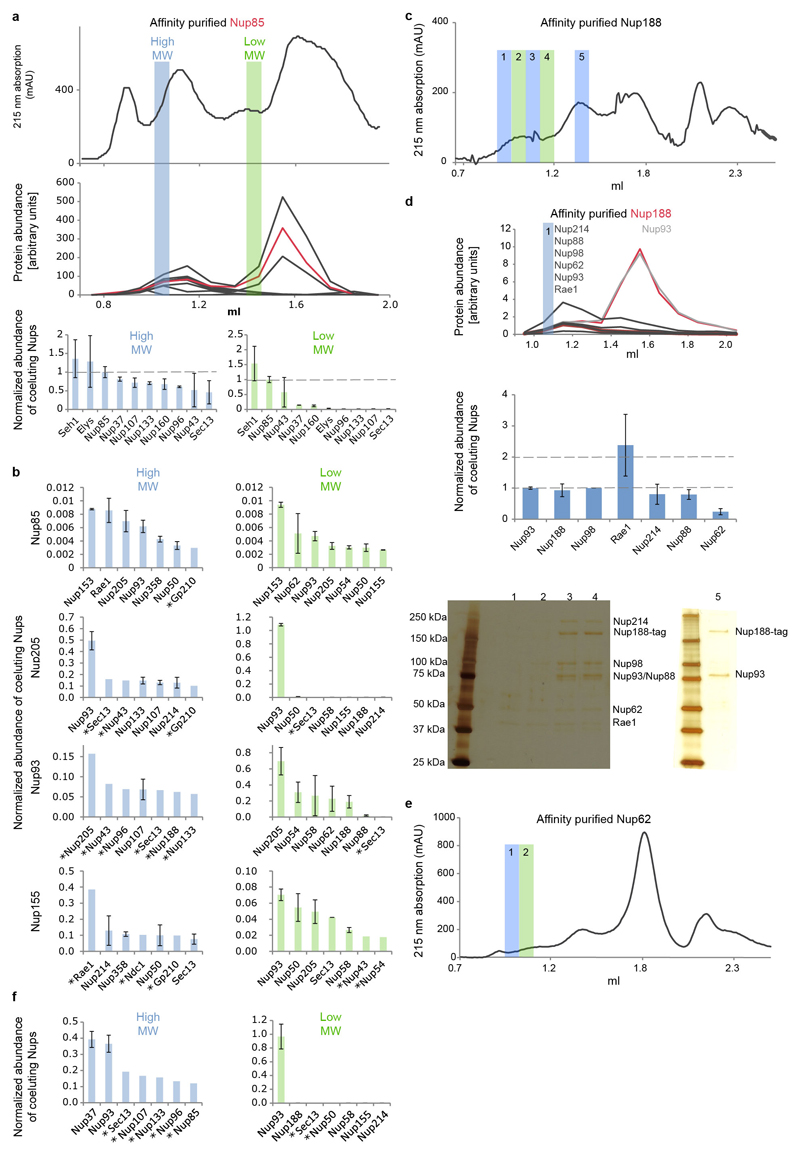
Additional density that cannot be attributed to members of the Y-complex but is consistent between the NR and CR was apparent in two specific regions. First, a peculiar question mark shaped density is evident in proximity of the small arm of the outer vertex in both the NR and CR (Fig. 3a, Extended Data Fig. 6a) that would be consistent with the established shape of the scaffold Nups 21. It is positioned such that it forms multiple contacts to both vertices and connects them to the inner stem of the anterior asymmetric unit, implying a critical role in ring formation. Second, also the rod shaped density that connects the inner vertex with the IR complex is symmetric across the NE plane (Fig. 3b). To systematically explore structural similarity between the tomographic map and the remaining IR scaffold Nups, we performed a systematic fitting of the available structures of Nups 155, 205, and 188, whereas the latter two are paralogous and cannot be distinguished at the given resolution. This analysis was consistent with a positioning of Nups 205/188 into the question mark shaped density in the CR and NR as well as Nup155 in the rod shaped connector but also identified several hits within the IR as expected (Fig. 3e, Extended Data Fig. 7). We biochemically confirmed weak interactions of Nups 93, 155 and 205 with the Y-complex (in interphasic cells; Extended Data Fig. 8) and a strong interaction of Nup188 with the Nup214 complex (in nocodazole-arrested, i.e. mitotic cells; Fig. 3c, Extended Data Fig. 8). Nup214 complex is known to bind to the inner vertex region of the CR 4 close to the above described question mark shape. In case of Nup155 the orientation of the fitted structure suggests that a specific loop of its beta propeller domain dips into the lipid bilayer (Fig. 3b). Liposome binding experiments with wild type Xenopus Nup155 and two mutant constructs affecting the aforementioned loop confirmed its importance in membrane binding (Fig. 3d). Interestingly, this orientation of Nup155 is very similar to the membrane binding modes of Nups 160 and 133 (Extended Data Fig. 6b). We conclude that the two positions discussed above are very likely taken up by Nups 205/188 and Nup155, respectively. These interactions are likely strengthened in situ and challenging to detect by classical approaches when taken out of the context of membrane. This arrangement explains the elevated copy number of Nups 205 and 93 and is consistent with a reduced copy number of Nup188 9,22. It is also consistent with crosslinking mass spectrometry data 4 and FRET analysis 23 that suggested proximity to yNup133 and yNup120 (vNup160) in situ. The systematic fitting analysis suggests that the IR is built of two slightly shifted rings on each side, similarly to the CR and NR (Fig. 3e, Extended Data Fig 7).
Figure 3. Scaffold architecture of the human NPC.
(a) Question mark shaped density (red) in the vertex region of the NR (arrowhead indicates Nup43). (b) Fit Nup155 (green) into the rod-shaped density connecting the outer rings with the IR. The membrane-binding motif (red) dips into the outer lipid bilayer. Asterisks mark structures that can be unambiguously positioned but have some uncertainty in their orientation. (c) Nups188 and 93 copurify with Nup214 complex. Nup62 was affinity-purified from nocodazole-arrested cells. The eluate was subjected to size exclusion chromatography. Arbitrary protein abundances measured in the fractions (left) using targeted mass spectrometry 24 are shown for the Nup62 complex (grey; Nup62 in red) and Nup214 complex members (black). Protein abundances within fraction one (blue) are shown as bar chart (center; error bars indicate the standard deviation of multiple independent peptides). A silver-stained SDS-PAGE of fractions one and two is shown on the right. (d) Binding of X. laevis Nup155, the L267D mutant, the 258–267 deletion or SUMO (negative control) to liposomes with a nuclear envelope lipid composition or DOPC liposomes of different sizes were analyzed in flotation experiments and quantified by western blotting (columns are the average bound quantities of three independent experiments, individual data points are indicated). (e) Scheme of the human nuclear pore scaffold architecture.
Taken together, our findings point to an intriguing architectural principle in which the same basic structural building block —despite being compositionally identical—establishes locally specific conformations and interactions. Interfaces across inner and outer Y-complexes appear to involve proteins specific to higher eukaryotes i.e. Nups 43 and 358. It appears that although key features of NPC architecture, such as the Y-shaped complex itself and its head-to-tail arrangement are common to all eukaryotes, its quaternary structure might be variable across the tree of life and perhaps even across cell types.
Methods
Molecular cloning and cell culture
HeLa Flp-In T-REx cell line 30 was stably transfected with an inducible plasmid expressing EmGFP and a microRNA against the ORF of the Nup358 mRNA using the BLOCK-iT Inducible Pol II miRNA RNAi Expression Vector Kit w/EmGFP from Life Technologies (with a modified Gateway destination vector compatible with the Flp-In system 4). Cells were treated for 4 days with 1 μg/ml of tetracycline to induce the expression of EmGFP and the miRNA. Isolation and plunge freezing of nuclear envelopes was carried out as previously described 4. All cell lines used in this study have been regularly tested for Mycoplasma contamination but have not been authenticated.
Nup188, Nup205, Nup93, Nup155, Nup85 and Nup62 cDNAs were purchased from the human ORFeome collection, subcloned into a Gateway destination vector with an N-terminal His6-HA-StrepII-tag, and stably transfected into the cell line 293 Flp-In T-REx (Life Technologies). Cells were treated for 8 days with 1 μg/ml of tetracycline to induce the expression of the fusion protein, which was subsequently affinity-purified.
Nuclear transport assays
HeLa cells of the Nup358-knockdown (KD) and control condition were washed 2x with transport buffer (20 mM Hepes, 110 mM KOAc, 5 mM NaOAc, 2 mM MgOAc, 1 mM EGTA, pH 7.3), incubated for 15 min with Hoechst 33342 (1 μg/ml, permeabilized via incubation for 5 min on ice with digitonin (40 μg/mL), washed 2 times with transport buffer supplied with 1.5% polyvinylpyrrolidone (PVP, 360 kDa) to remove the soluble factors and digitonin before the addition of the transport mix. The transport mix consists of the purified transporters and recycling factors with the addition of a source of energy (1 μM Impβ, 1 μM Impα, 4 μM Ran, 2 μM NTF2, 0.5 μM NLS-MBP-GFP, 2 mM GTP, 1 mM DTT in transport Buffer).
Affinity purification and mass spectrometric analysis
Protein expression and affinity purification was performed as described before 4. In brief, Hek-293 Flp Trex cells expressing N-terminally His6-HA-StrepII tagged bait protein were grown in sixteen 245x245 mm plates (Nunc) per experiment. In case of Nup188 and Nup62, the cells were arrested with 0.2 ng/ml nocodazole (Calbiochem) 18 h prior to collection and freezing in liquid nitrogen. Cells expressing Nup155, Nup93 and Nup85 were collected without Nocodazole arrest. Cells expressing Nup205 were applied to both approaches. Sixteen plates resulted typically in 5-7 ml of cell pellet. The cells were thawed on ice and lysed subsequently in 2.5 pellet volumes. For cells that were not nocodazole arrested, the cell suspension was sonicated 10x for 30 sec to solubilize proteins; each sonication cycle was followed by 30 sec incubation. The cleared lysate was split into four and each part was passed twice over a Strep-Tactin sepharose (IBA) column with a 400 µl bed volume by gravity flow at room temperature. After washing, the proteins were eluted with 2 mM Biotin (Sigma) in three elution steps per column (2x350 µl, 1x 200 µl). The eluate was combined and concentrated 60 fold to 60 µl final volume with (Millipore, 100 kDa molecular weight cutoff). The yield was typically between 30-160 µg of protein for cells expressing affinity tagged Nup205, Nup188 and Nup62 with nocodazole arrest and between 30 and 100 µg for cells expressing affinity tagged Nup205, Nup155, Nup93 and Nup85 without treatment (here, sonication was used for protein solubilization). Up to 50 µl of the concentrated eluate were subjected to size-exclusion chromatography using a Superose-6 column (GE Healthcare, 2.4 ml volume). The eluting protein was collected in 100 µl fractions. Fractions were analyzed with targeted proteomics as previously described 24,29. In short, AQUA peptides were spiked into each fraction in equimolar amount prior to protein digestion. To avoid over-digestion and loss of peptides during the digestion procedure, 5 µg of heat inactivated, cleared and denatured yeast lysate (2 µg/µl in 10 M Urea) were added to each fraction prior to digestion. The summed intensity of all transitions per protein resulting from MS data acquisition were averaged and normalized to Nup93 in case of Nup62 and Nup188 and to the bait in case of other proteins to result in the final protein abundance. Error bars indicate plus/minus one standard deviation between the intensities of independent AQUA peptides measured for the same protein.
Mass spectrometric analysis of the Nup358 knockdown was performed according to established standards in the field of proteomics, namely three biological replicates each of the Nup358 knockdown and control condition were analyzed. The shotgun proteomics data shown in Extended Data Fig. 5c were acquired as previously described 4; p-values were calculated using a two-sided t-test with empirical Bayes correction as implemented in limma. The targeted proteomic measurements shown in Fig. 2e were carried out as previously described 9,29; the p-value given in the legend of Fig. 2e was calculated using a one-sided Welch t-test combined using Fisher's method. All the targeted proteomic data were analysed using SpectroDive (Biognosys AG).
Mapping of Nup155 membrane binding motif
Xenopus Nup155 was cloned as a codon optimized (for expression in E. coli, Geneart) cDNA into a modified pET28a vector with a yeast SUMO solubility tag followed by a TEV site. The corresponding L258D mutant and the D258-267 deletion was generated by mutagenesis and deletion mutagenesis, respectively, using QuikChange site-directed mutagenesis kit (Agilent). Proteins were expressed in E. coli and purified using Ni-agarose. His6- and SUMO-tags were cleaved using TEV protease and proteins were concentrated using VIVASPIN columns (Sartorius) and separated by gel filtration (Superdex200 PC 3.2/30, GE Healthcare) in HEPES buffer (20 mM HEPES pH 7.5, 150 mM NaCl, 1mM DTT). SUMO was expressed and purified from the corresponding empty vectors.
NE lipid mixture - 60 mol% L-α-phosphatidylcholine, 19.8 mol% L-α-phosphatidylethanolamine, 10 mol% L-α-phosphatidylinositol, 5 mol% Cholesterol, 2.5 mol% Sphingomyelin, 2.5 mol% L-α-phosphatidylserine, 0.2 mol% 18:1-12:0 NBD-PE (1-oleoyl-2-{12-[(7-nitro-2-1,3-benzoxadiazol-4-yl)amino]dodecanoyl}-sn-glycero-3-phosphoethanolamine) or DOPC mixture – 99.2 mol% 1,2-dioleoyl-sn-glycero-3-ethylphosphocholine (DOPC), 0.2 mol% 18:1-12:0 NBD-PE were dissolved in chloroform to a final concentration of 1 mg/ml. Chloroform was evaporated in a glass vial under a low stream of Argon until an even lipid film formed followed by incubation under vacuum for 1-2 h. Liposomes were formed by gentle addition of HEPES Buffer to a final concentration of 5 mg/ml. After 1 h of incubation at 45°C, flask was shaken to dissolve residual lipids. After ten cycles of freeze/thawing liposomes were either snap frozen in liquid nitrogen and stored in -80°C or directly used. Different sized liposomes were formed by passing liposomes sequentially through Nuclepore Track-Etched Membranes (Whatman) with defined pore sizes (400, 100, 30 nm) at 45°C using the Avanti Mini-Extruder until desired size was reached. For 30 nm, liposomes were incubated in a sonication bath for 5 min before final extrusion. To ensure equal concentrations of different sized liposomes, fluorescence intensity was determined after extrusion using a Molecular Imager VersaDoc MP 4000 Imaging System and ImageJ. Concentrations were adjusted by dilution.
A protein/liposome mixture was prepared with a final protein concentration of 2.5 µM and a lipid concentration of 2.5 mg/ml and incubated at 25°C for 30 min. The protein/liposome mixture was mixed 1:1 with 72% sucrose in HEPES Buffer. 75 µL were added into a TLS-55 centrifuge tube and overlaid by 1800 µL 12% sucrose in HEPES Buffer and topped with 300 µL HEPES Buffer. Samples were spun for 2 h at 55,000 rpm, 25°C. Liposome containing top layers were collected (450 µL). Fluorescence intensities of the start protein/liposome mixture and the top fraction were determined. Collected fractions were precipitated by the method described by Wessel & Flügge 31. To compare different samples, pellets were resuspended in normalized volumes of sample buffer according to the determined fluorescence signal. Binding efficiency was determined by Western Blot analysis, comparing band intensities of start materials with collected fractions.
Electron microscopy
170 tomograms of HeLa cell nuclear envelopes were recorded using a Titan Krios TEM (FEI, Eindhoven) operated at 300kV and equipped with Gatan Quantum 968 energy filter and K2 summit direct electron detector. Tilt series are collected with SerialEM 32 using a bidirectional tilt scheme starting from 0 to -45 and then from 0 to +60 degrees tilt, with 3-degree increment. All tilts were recorded with the same exposure time and the average total dose ranged from 100-120 e/Å2. A parallel beam just covered the camera to minimize beam current and thus charging on the sample. To minimize stage-drift the delay time after tilting was set to the maximum 15 seconds. Defocus was distributed between -1.9 and -4.0 μm in 0.1 μm steps. The nominal pixel size was 3.42 Å. Four 4K frames were collected per tilt step in counting mode (0.8s each ∼0.76 e/Å2).
In case of the Nup358-KD condition, 140 tomograms were recorded as previously described 4. In brief, the tilt series were recorded using a Titan Krios TEM (FEI, Einhoven) operated at 300kV and equipped with Gatan GIF2002 energy filter and Multiscan CCD using FEI Tomo4 software. Tilt series were collected from -44 to +60 with 4-degree increment with an averaged total dose of 100 electron/ Å2 and defoci ranged from -3.0 to -5.0 μm.
Image processing
Four frames from each projection were subjected to cross-correlation analysis and summed to generate the motion-corrected projection 33. The defocus of individual projections was estimated by ctffind3 and all projections were CTF corrected by phase-flipping using IMOD as previously described 34. After tomogram reconstruction, subtomograms containing 2171 NPCs, corresponding to 17368 asymmetric units were extracted and subjected to subtomogram averaging. Subtomogram averaging was carried out on the asymmetric unit level and independently for the CR, IR and NR regions as previously described 4 but with the following modifications: A gold standard FSC procedure was employed on two independently aligned sets of subtomograms. The subtomograms with full dose including all projections were initially aligned. Subsequently, subtomograms with a dose of 80 electron/Å2 including projections from -45 to +40 were used for refinement. The two final structures were averaged and the average of CR, IR and NR were sharpened with empirically determined negative B-factor of 6000 Å2, while filtering the data to a resolution of 23.4, 22.9 and 24.1 Å respectively. These B-factors are likely due to additional dampening of high-frequency information by beam-induced motion at higher tilts, and the inaccuracy of tomogram alignment and reconstruction. To prevent oversharpening, a range of different B-factors were applied in order to compare the resulting tomographic maps to the respective X-ray structures filtered to 23 Å resolution (Extended Data Fig. 2). The mask during the averaging procedure was chosen such that the averaged segment was larger that the asymmetric unit. For visualization purposes, overlapping segments were fitted into each other. For the systematic fitting approach, the segments were joined.
In case of the Nup358-KD condition, subtomograms containing 920 NPCs, corresponding to 7360 asymmetric units were used for subtomogram averaging. The final structure has a resolution of 37.5 Å at FSC 0.5 criteria. The cryo-ET data of the Nup358-KD condition subjected to iterative multi-reference classification 35. Aligned asymmetric units are classified by constrained cross correlation coefficient using structures from Nup358-KD condition and untreated HeLa cells 4 until convergence. As a result, the majority of asymmetric subunits (7005) were classified into class 1 (outer Y-complex absent in CR), while ∼5% subunits (355) were classified into class 2 (outer Y-complex present in CR). The average of class 2 clearly shows intact wild type-like structure (Extended Data Fig. 5e, left). For the generation of Extended Data Fig. 5f, class 1 particles were queried for adjacent neighbors within single NPCs using a dedicated matlab script. The expected frequency for adjacency of outer Y-complexes in case of (hypothetical) stochastic binding was calculated using R.
Homology Modeling
MODexplorer 36 was used to detect modeling templates and generate initial sequence alignments to the templates. Swiss PDB Viewer 37 was used to optimize the alignments guided by alternative alignments and secondary structure predictions from GeneSilico MetaServer 38. Final models were built with Modeller 39 based on the optimized alignments. The modeling templates or selected human crystal structures are listed in Extended Data Table 1. The models were built in oligomeric state whenever a corresponding oligomeric structure was available (e.g., for the Sec13-Nup96 NTD-Nup107 CTD and Nup107 NTD-Nup133 CTD complexes).
Fitting of high resolution structures
The models were fitted to the EM map of the joined NR, IR and CR segments using UCSF Chimera 40 Fit In Map tool. Each model was separately fitted using systematic global search with an arbitrarily large number of 1,000,000 random initial placements and a normalized cross-correlation score as a fitting metric. The fits were clustered with the Fit In Map tool, taking the 8-fold symmetry into account, leading to on average 20,000-60,000 representative unique fits. The fits were scored with the normalized cross-correlation and the statistical significance of the scores was assessed as previously described 4. In brief, correlation scores were transformed to z-scores (Fisher’s z-transform) and centered; subsequently, an empirical null distribution was fitted from which two-sided p-values were computed. Then, the final fits were selected based on the fitting scores and/or agreement with the previously identified locations, cross-links and known interactions (See Supplementary Table 1 for detail). Nup85-CTD and Nup133 beta propeller domain were placed manually based on the locations expected from domain connectivity and vicinity to the membrane (Nup133). The fits of the Nup107-Nup133 and Nup37-Nup160 subcomplexes were apparent to be non-optimal from the rigid body fitting and thus were further optimized flexibly: i) The Nup107-Nup133 structure was divided into two substructures (Nup107-NTD and Nup133-Nup133 dimer) based on the previously identified hinge region 26 and re-fitted locally, ii) The Nup37-Nup160 structure was subjected to the Normal Mode Analysis using ElNemo 41 and a model that optimally fitted Nup160-CTD to the EM density without clashing with neighboring subunits served as a basis for separately placing the Nup160-CTD in the map. Some of the fits such as Nup155, Nup37-Nup160 NTD were further optimized locally. Interfaces of Nup43-Nup85 and Sec13-Nup107 were optimized with local re-docking or refinement, respectively, using Haddock 42. Although the orientation of Nup43 was not clear from the systematic fitting, the re-docking led to the best scoring model satisfying cross-links to Seh1 and Nup85-CTD.
Mapping of phosphorylation sites
The phosphorylation sites from human and mouse have been collected form the PTMcode database 43.
Extended Data
Extended Data Figure 1. Tomographic map of the human NPC.
(a) Orthoslices through the nucleocytoplasmic axis, CR, IR, and NR of a tomographic structure of the human NPC obtained using a direct electron detector (this study) compared to a structure obtained with a conventional detector using a similar experimental workflow (emd_2444). In both cases, the CR, IR and NR were aligned independently. The arrowhead indicates a transmembrane domain that is resolved in the IR. (b) Fourier shell correlation curves of the CR, IR and NR regions. (c) Histogram corresponding to the color-coded local resolution map shown in (d) that was calculated using ResMap 25. (d) A single segment of the NR ring is shown (in all other figures the segments are shown jointly with their anterior and/or posterior asymmetric unit) at two different isosurface thresholds. The redundant density of the outer Nup43 beta propeller (horizontal arrowhead) and the Nup133 middle domain (vertical arrowhead) of two neighboring asymmetric units are indicated for orientation. The reduced resolution at the edges is due to the border of the mask used during alignment and averaging that covered about 1.5 times the asymmetric unit.
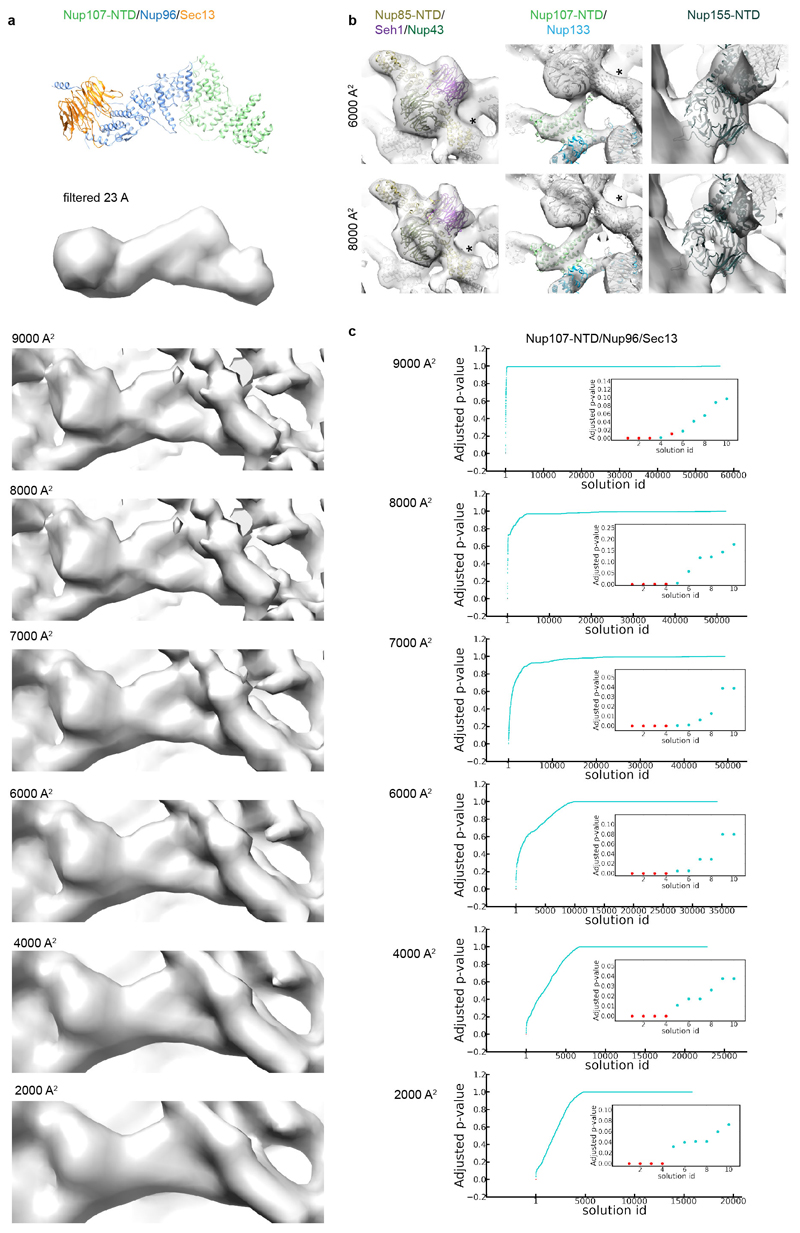
Extended Data Figure 2. B-factor correction.
X-ray structures filtered to the overall resolution of the tomographic map were compared to tomographic maps corrected with different B-factors to choose an appropriate B-factor. (a) X-ray structure of Nup107/Nup96/Sec13 at (top) and filtered to 23 Å (below) as compared to respective region of the outer vertex corrected with B-factors ranging from 2000 – 9000 A2. (b) B-factors of 6000 – 8000 A2 most realistically resemble features of the X-ray structures. Three regions of the tomographic map are superimposed with the respective X-ray structures at B-factors of 6000 A2 in comparison to 8000 A2. In these well-resolved regions, additional features such as more detailed shapes of beta propellers or the Nup107 finger domain (see also Fig. 2a, b; Extended Data Fig. 4e) are apparent at 8000 A2. Due to local deviations in resolution (Extended Data Fig. 1c, d) a more conservative B-factor of 6000 A2 was chosen to correct the averages. Asterisks mark structures that can be unambiguously positioned but have some uncertainty in their orientation, that is the Nup85-CTD. (c) Systematic fitting of the X-ray structure of Nup107/Nup96/Sec13 into the tomographic map as shown in Extended Data Fig. 7a but at different B-factors. Adjusted p-values are shown ranked; the four true positive hits are shown in red in the inset. The latter are consistently identified as top hits, except when a B-factor of 9000 A2 is used.
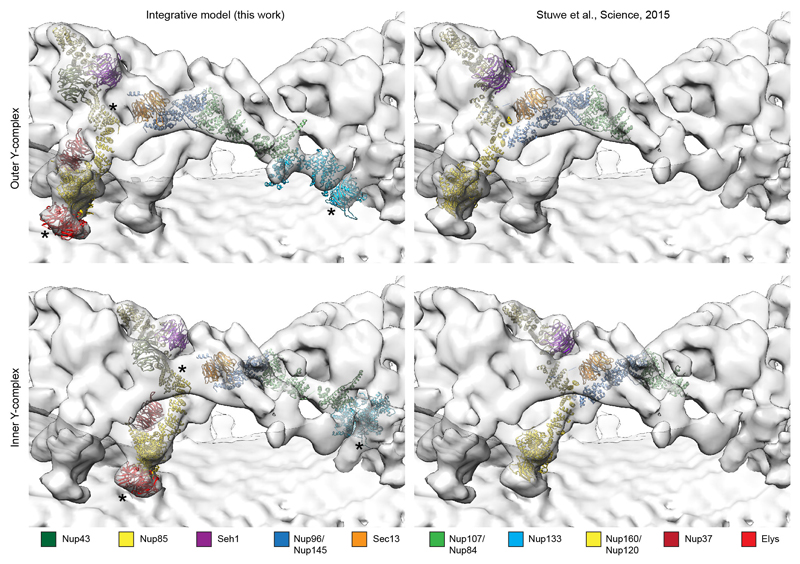
Extended Data Figure 3. Comparison of hybrid model of the Y-complex to the X-ray structure of the vertex region 10.
The hybrid model of the Y-complex (NR) shown on the left side was generated independently from the coordinates X-ray structure of the vertex shown on the right side. The structures of Y-complex members were fitted into the tomographic map based on spatial restraints and complementary information (see Supplementary Table 1 for detail). The outer and inner Y-complexes/vertices are shown separately on the top and the bottom. The molecular weight of one human Y-complex is approximately 1 MDa, the majority of which is structured. Asterisks mark structures that can be unambiguously positioned but have some uncertainty in their orientation. Those are the beta propellers of Elys and Nup133 as well as Nup85-CTD.
Extended Data Figure 4. The inner and outer Y-complexes have distinct conformations and engage in locally specific sets of interactions.
(a) Arrangement of the inner and outer Y-complex as seen from above. X-ray structures were filtered to 2.3 nm resolution and colored by protein. Positions of the five interfaces between Y-complexes are indicated. (b) The inner and outer copies of Nup160 assume the same normal vector with respect to the membrane and are slightly tilted to each other because of the different diameters from the central axis. (c) The hinges between the Nup107 C- and N-terminal domains as well as within the Nup133 C-terminal domain have a different conformation in the inner and outer Y-complex. In the case of the inner stem, the middle domain of Nup133 appears slightly bent inwards compared to the conformation revealed in the X-ray structure, which can be accounted for by introducing a hinge, as previously predicted based on the Nup133 structure 26. (d) Zoomed-in views showing details of five interfaces (I–V). The panels on the right indicate the viewing point. (I) Sec13 of the outer vertex interfaces with the Nup107 N-terminal domain of the inner vertex 4,10; (II) the N-terminal beta propeller of Nup133 interfaces with Nup160 of the posterior asymmetric unit in the case of both Y-complexes, forming the head-to-tail contact that facilitates ring formation 12,14; (III) therefore, only the beta propeller of the inner copy of Nup133 is sandwiched between both Nup160s. In this case, the N-terminal alpha-helical domain extends into a larger interface with the outer Nup160 of the posterior asymmetric unit; (IV) the very C-terminus of the inner Nup133 branches out of the inner stem to form a contact with its counterpart on the outer stem. This relatively small interface is reminiscent of a crystal contact observed in the Nup133–Nup107 structure (pdb code: 3I4R)26; and (V) Nups 85 and 43 of the outer vertex form an interface with the C-terminal domain of Nup107 of the inner stem. (e) The Nup107 finger domain (red) is exclusive to higher eukaryotes. While its inner copy (shown) interfaces with Nup43 and Nup85 of the outer vertex, its outer copy interfaces with the density connecting both Y-complexes (Fig. 2a, b). A phosphorylation site in the finger domain is depicted as dark red spheres. Asterisks mark structures that can be unambiguously positioned but have some uncertainty in their orientation, that is Nup85-CTD. (f) Vertex region of the CR as seen from the central channel. Phosphorylation sites are represented as in (e). The density connecting both Y-complexes is segmented as in Fig. 2b and is in close contact with several phosphorylation sites in Sec13, Nup96 and Nup107. Phosphorylation sites in Seh1 and Nup85 are in direct proximity to the Nup214 complex region.
Extended Data Figure 5. Connection of the inner and outer Y-complexes.
(a) Four clamp-shaped densities (segmented red) emanate from the Nup96/107 region of both Y-complexes in the CR. Only the inner clamps connect both Y-complexes, whereas the outer ones protrude into a more complex substructure at the outer periphery of the CR (Fig. 2b). (b) Same as in Fig. 2c, d but for the NR. (c) Volcano plot visualizing shotgun proteomics data obtained of HeLa cells in the Nup358 knockdown (treatment) as compared to the control condition. (d) Nuclear transport assays of NLS-MBP-GFP in non-treated cells and the Nup358 knockdown condition. Cargos with a classical nuclear localization signal are imported in the absence of Nup358 as previously observed 27 although a lower efficacy cannot be excluded. (e) Classification of subtomograms of the knockdown condition reveals that approximately 5% of all asymmetric units contain an outer Y-complex in the CR, which is in excellent agreement with the knockdown efficiency of ∼95%. Classification was done on the level of asymmetric units. Transferred to the level of NPCs, it suggests that out of 920 NPCs observed under gene silencing conditions, 663 had no outer Y-complex in the CR, 183 had one, 49 had two, 14 had three, 4 had four, 6 had five, 0 had six, 1 had seven and 0 had eight. (e) The observed adjacency of outer Y-complexes in the CR under knockdown conditions was much higher than expected. The 5% of asymmetric units that contained outer Y-complexes in the CR were analyzed on the NPC level to determine whether their neighboring asymmetric units also contained outer Y-complexes in the CR. The observed frequency of adjacency is shown in dark blue. The respective total number of observed outer Y-complexes in the CR and the number of the ones that had adjacent partners is indicated as (n/m). The observed frequency is considerably elevated over the theoretical frequency (shown in bright blue) that would be expected if Y-complexes would bind to random subunits. This observation implies cooperativity for Y-complex assembly/maintenance within the CR that might arise through the head to tail contact of adjacent Y-complexes. NPCs with 0, 1 and 8 outer Y-complexes per CR are not shown because they cannot contain any adjacent Y-complexes or were not observed, respectively.
Extended Data Figure 6. Structural signatures of inner ring scaffold Nups and membrane binding motifs of Nup160 and Nup133.
(a) Same as Fig. 3a but for the CR. (b) Fits of Nup160 (left) of the outer (orange) and inner (grey) Y-complexes into the NR are shown. Additional density accounting for the C-terminal domain of Elys is indicated. Fits of Nup133 are shown at normal (center) and high (right) isosurface thresholds. At the higher isosurface threshold, density linking both Nup133 domains is apparent also in the outer stem. The membrane-binding motifs 28 are colored red. Asterisks mark structures that can be unambiguously positioned but have some uncertainty in their orientation. Those are the beta propellers of Elys and Nup133 as well as Nup85-CTD.
Extended Data Figure 7. Systematic fitting of selected NPC components to the EM map.
Each panel shows the 20 best-scoring fits (left), a plot of p-values for all the solutions (right) and the top solutions in the inset. The models used for fitting are shown as ribbon representation. The fits and data points are colored according to the groups with similar p-value ranges. The group of fits with the best p-values is colored red (high-confidence fits), the second-best group (medium-confidence fits) blue, and all remaining - cyan. The membrane density has been removed for clarity. (a) The Sec13–Nup96–Nup107 subcomplex, for which the ground-truth is known because it is part of the vertex. (b–d) same as (a) but for the N-terminal domains of Nup155 , the open conformation of Nup205/188-NTD (template Nup205) and the closed conformation of Nup205/188-NTD (template Nup188), respectively.
Extended Data Figure 8. Co-elution analysis to detect weak nucleoporin interactions.
To detect weak interactions of scaffold nucleoporins we combined rapid affinity isolation with gel filtration and quantitative targeted proteomics to measure absolute protein abundances. Hek293 cells expressing various affinity-tagged Nups (in contrast to Fig. 3c without nocodazole arrest) were lysed using mild conditions and sonication for protein solubilization. Affinity isolates were subjected to gel-filtration and all fractions were analyzed using targeted mass spectrometry, as previously described 24,29 to measure protein abundances in the high and low molecular weight fractions. The high-molecular-weight fractions will be indicative of potential outgoing interactions of large molecular species. The low molecular weight fraction will highlight smaller fragments that occur after sonication. In case of affinity tagged Nup85 (a) the top panel shows the 215 nm absorption curve of the gel-filtration experiment. The middle panel shows the arbitrary protein abundance units of Y-complex members in all fractions (red for Nup85, black for all other Y-complex members). Protein abundances (normalized to the affinity tagged protein) in the high-molecular-weight fractions (blue bar) and low-molecular-weight fraction (green bar) are shown as bar charts in the bottom panel. The low molecular weight peak corresponds to the small arm proteins (Nup85, Seh1 and Nup43) the high molecular weight peak to the intact Y-complex. (b) The same approach was applied to Nup205, Nup93 and Nup155. The seven most abundant co-eluting Nups are shown for the high-molecular-weight fractions (blue bar plots) and low-molecular weight fraction (green bar plots). In case of Nup85 (top) the seven most abundant proteins apart from the Y-complex members are shown. Weak interactions of Y-complex members with Nups 205 and 93 are apparent. In case of Nup155, weak interactions are detected with CR and NR members, as well as Sec13 that localizes to the proximity of the C-term domain of Nup155 when fitted into the density connecting the IR with CR/NR. Tpr was excluded from this analysis since it was present in all fractions. Protein abundances based on single reference peptides are marked with an asterisk. (c) Same as (a, top panel) but for Nup188 affinity purified from nocodazole arrested cells. (d) Same as Fig. 3c but for Nup188 affinity purified from nocodazole arrested cells. Co-eluting species in the high molecular weight fraction are similar to the ones observed for affinity-purified Nup62 (Fig 3c). Isostoichiometric amounts of Nups 188, 98, 93, 62 and an enrichment of Nups 214, 88 and Rae1 were detected. The Nup188–Nup93 heterodimer thus binds to Nups that are well-established components of the CR, which is consistent with the systematic fitting approach. (e) Same as (c) but corresponding to Fig. 3c. (f) Same as (b; second panel for Nup205) but for nocodazole-arrested cells. In case of Nup205, the co-purifying species are overall similar in nocodazole-arrested as compared to untreated cells.
Extended Data Table 1. Template structures used for homology modeling or selected human crystal structures.
| Nucleoporin | AA covered by the model | Modeling template or human structure | Organism* | PDB Identifier | Model confidence† |
|---|---|---|---|---|---|
| Nup 107 | NTD (150-602) | Nup84/Nup145C/Sec13 | S.c. | 3IKO chain C | medium |
| CTD (667-924) | Crystal structure Nup107/Nup133 | H.s. | 3I4R chain A | high | |
| Nup133 | NTD (75-477) | Nup133 | H.s. | 1XKS | high |
| CTD (518-543) | Crystal structure Nup 107/Nup133 | H.s. | 3I4R chain B | high | |
| Nup96 | 277-751 | Nup84/Nup 145C/Sec13 | S.c. | 3IKO chain B | medium |
| Sec13 | 14-304 | Sec13Nup145C | H.s. | 3BG1 chain A | high |
| Nup85 | NTD (9-475) | Nup85 | S.c. | 3F3F chain C | medium |
| CTD (476-641) | Nic96 | S.c. | 2QX5 chain A | low | |
| Seh1 | 1-322 | Seh1 | S.c. | 3F3F chain A | high |
| Nup37 | 9-326 | Nup37 | S.p. | 4GQ2 chain P | medium |
| Nup160 | 41-1201 | Nup120 | S.p. | 4GQ2 chain M, 4FHN chain B | medium |
| Nup43 | 4-380 | Crystal structure | H.s. | 4179 chain A | high |
| Elys | NTD (3-493) | Elys | M.m. | 410O chain A | high |
| Nup93 | CTD (173-815) | Nic96 | S.c. | 2RFO chain A | medium |
| Nup188 | NTD (1-939) | Nup188 | M.t. | 4KF7 chain A | medium |
| Nup205 | NTD (9-1008) | Nup192 | S.c. | 4IFQ chain A | medium |
| Nup188 | M.t. | 4KF7 chain A | |||
| Nup155 | NTD (20-863) | Nup157 | S.c. | 4MHC chain A | high |
| CTD (871-1375) | Nup170 | S.c. | 315P chain A | high |
Organism: H.s. - Homo sapiens, M.m. - Mus musculus, S.c. - Saccharomyces cerevisiae, S.p. - Saccharomyces pombe, M.t. - Myceliophthora thermophila.
Model confidence was assessed as follows: high - human crystal structures or models based on very similar templates; medium - good quality models with confident overall sequence alignment but containing less confident regions; low - models expected to have correct fold but built based on low confidence sequence alignment.
Supplementary Material
Acknowledgments
We are grateful to Drs. Wolfgang Baumeister and Juergen Plitzko for access to the electron microscopy facility of the Max Planck Institute of Biochemistry. We thank Florian Schur, Drs. Katja Beck, John Briggs, Carsten Sachse, Ed Hurt and Frauke Melchior for their critical advice and Dr. Adrian Neal for critical reading of the manuscript. We gratefully acknowledge support from EMBL’s mechanical workshop, the Electron Microscopy and Proteomics Core Facilities, the Centre for Statistical Data Analysis and want to thank Drs. Jeroen Krijgsveld, Joanna Kirkpatrick and Bernd Klaus. K.H.B. was supported by postdoctoral fellowships from the Swiss National Science Foundation, the European Molecular Biology Organization and Marie Curie Actions. A.O. was supported by postdoctoral fellowships from the Alexander von Humboldt Foundation and Marie Curie Actions. A.L.D. was supported by the Robert Crooks Stanley Fellowship at the Stevens Institute of Technology and National Institute on Aging (NIA) grant 1R21AG047433-01. J.K. was supported by the EMBL Interdisciplinary Postdoc Programme under Marie Curie COFUND Actions. J.S.G. was supported by an Ignition Grant Initiative from Stevens Institute of Technology and NIA grant 1R21AG047433-01. M.B. acknowledges funding by EMBL and the European Research Council (309271-NPCAtlas).
Footnotes
Author contributions
A.v.A., J.K., W.A. designed and performed experiments, analyzed data, wrote the manuscript. A.v.A., J.K. and P.K. performed modeling. B.V., L.S., A.O., A.L.D., M.M., K.B., W.H., A.A., N.B., S. M. designed and performed experiments, analyzed data. J.S.G., E.L. designed experiments, oversaw the project. K.H.B designed and performed experiments, analyzed data, oversaw the project, wrote the manuscript. M.B. designed experiments, analyzed data, oversaw the project, wrote the manuscript.
Depositions
Associated with this manuscript are EM databank entries EMD-3103, EMD-3104, EMD-3105, EMD-3106, EMD-3107 and protein databank entry 5a9q.
References
- 1.Hoelz A, Debler EW, Blobel G. The Structure of the Nuclear Pore Complex. Annu Rev Biochem. 2011;80:613–643. doi: 10.1146/Annurev-Biochem-060109-151030. [DOI] [PubMed] [Google Scholar]
- 2.Vollmer B, Antonin W. The diverse roles of the Nup93/Nic96 complex proteins - structural scaffolds of the nuclear pore complex with additional cellular functions. Biological chemistry. 2014;395:515–528. doi: 10.1515/hsz-2013-0285. [DOI] [PubMed] [Google Scholar]
- 3.Hurt E, Beck M. Towards understanding nuclear pore complex architecture and dynamics in the age of integrative structural analysis. Curr Opin Cell Biol. 2015;34:31–38. doi: 10.1016/j.ceb.2015.04.009. [DOI] [PubMed] [Google Scholar]
- 4.Bui KH, et al. Integrated structural analysis of the human nuclear pore complex scaffold. Cell. 2013;155:1233–1243. doi: 10.1016/j.cell.2013.10.055. [DOI] [PubMed] [Google Scholar]
- 5.Kampmann M, Blobel G. Three-dimensional structure and flexibility of a membrane-coating module of the nuclear pore complex. Nature Structural & Molecular Biology. 2009;16:782–788. doi: 10.1038/nsmb.1618. nsmb.1618 [pii] [DOI] [PMC free article] [PubMed] [Google Scholar]
- 6.Thierbach K, et al. Protein interfaces of the conserved Nup84 complex from Chaetomium thermophilum shown by crosslinking mass spectrometry and electron microscopy. Structure. 2013;21:1672–1682. doi: 10.1016/j.str.2013.07.004. [DOI] [PubMed] [Google Scholar]
- 7.Fornerod M, van Baal S, Valentine V, Shapiro DN, Grosveld G. Chromosomal localization of genes encoding CAN/Nup214-interacting proteins--human CRM1 localizes to 2p16, whereas Nup88 localizes to 17p13 and is physically linked to SF2p32. Genomics. 1997;42:538–540. doi: 10.1006/geno.1997.4767. [DOI] [PubMed] [Google Scholar]
- 8.Werner A, Flotho A, Melchior F. The RanBP2/RanGAP1*SUMO1/Ubc9 complex is a multisubunit SUMO E3 ligase. Mol Cell. 2012;46:287–298. doi: 10.1016/j.molcel.2012.02.017. [DOI] [PubMed] [Google Scholar]
- 9.Ori A, et al. Cell type-specific nuclear pores: a case in point for context-dependent stoichiometry of molecular machines. Mol Syst Biol. 2013;9:648. doi: 10.1038/msb.2013.4. msb20134 [pii] [DOI] [PMC free article] [PubMed] [Google Scholar]
- 10.Stuwe T, et al. Nuclear pores. Architecture of the nuclear pore complex coat. Science. 2015;347:1148–1152. doi: 10.1126/science.aaa4136. [DOI] [PMC free article] [PubMed] [Google Scholar]
- 11.Bilokapic S, Schwartz TU. Molecular basis for Nup37 and ELY5/ELYS recruitment to the nuclear pore complex. Proc Natl Acad Sci U S A. 2012;109:15241–15246. doi: 10.1073/pnas.1205151109. 1205151109 [pii] [DOI] [PMC free article] [PubMed] [Google Scholar]
- 12.Seo HS, et al. Structural and functional analysis of Nup120 suggests ring formation of the Nup84 complex. Proc Natl Acad Sci U S A. 2009;106:14281–14286. doi: 10.1073/pnas.0907453106. [DOI] [PMC free article] [PubMed] [Google Scholar]
- 13.Nagy V, et al. Structure of a trimeric nucleoporin complex reveals alternate oligomerization states. Proc Natl Acad Sci U S A. 2009;106:17693–17698. doi: 10.1073/pnas.0909373106. 0909373106 [pii] [DOI] [PMC free article] [PubMed] [Google Scholar]
- 14.Alber F, et al. The molecular architecture of the nuclear pore complex. Nature. 2007;450:695–701. doi: 10.1038/nature06405. nature06405 [pii] [DOI] [PubMed] [Google Scholar]
- 15.Boehmer T, Jeudy S, Berke IC, Schwartz TU. Structural and functional studies of Nup107/Nup133 interaction and its implications for the architecture of the nuclear pore complex. Mol Cell. 2008;30:721–731. doi: 10.1016/j.molcel.2008.04.022. S1097-2765(08)00325-0 [pii] [DOI] [PMC free article] [PubMed] [Google Scholar]
- 16.Glavy JS, et al. Cell-cycle-dependent phosphorylation of the nuclear pore Nup107-160 subcomplex. Proc Natl Acad Sci U S A. 2007;104:3811–3816. doi: 10.1073/pnas.0700058104. 0700058104 [pii] [DOI] [PMC free article] [PubMed] [Google Scholar]
- 17.Laurell E, et al. Phosphorylation of Nup98 by multiple kinases is crucial for NPC disassembly during mitotic entry. Cell. 2011;144:539–550. doi: 10.1016/j.cell.2011.01.012. S0092-8674(11)00013-4 [pii] [DOI] [PubMed] [Google Scholar]
- 18.Shi Y, et al. Structural characterization by cross-linking reveals the detailed architecture of a coatomer-related heptameric module from the nuclear pore complex. Mol Cell Proteomics. 2014;13:2927–2943. doi: 10.1074/mcp.M114.041673. [DOI] [PMC free article] [PubMed] [Google Scholar]
- 19.Culjkovic-Kraljacic B, Baguet A, Volpon L, Amri A, Borden KL. The oncogene eIF4E reprograms the nuclear pore complex to promote mRNA export and oncogenic transformation. Cell reports. 2012;2:207–215. doi: 10.1016/j.celrep.2012.07.007. [DOI] [PMC free article] [PubMed] [Google Scholar]
- 20.Kim DI, et al. Probing nuclear pore complex architecture with proximity-dependent biotinylation. Proc Natl Acad Sci U S A. 2014;111:E2453–2461. doi: 10.1073/pnas.1406459111. [DOI] [PMC free article] [PubMed] [Google Scholar]
- 21.Flemming D, et al. Analysis of the yeast nucleoporin Nup188 reveals a conserved S-like structure with similarity to karyopherins. J Struct Biol. 2012;177:99–105. doi: 10.1016/j.jsb.2011.11.008. S1047-8477(11)00323-6 [pii] [DOI] [PubMed] [Google Scholar]
- 22.Theerthagiri G, Eisenhardt N, Schwarz H, Antonin W. The nucleoporin Nup188 controls passage of membrane proteins across the nuclear pore complex. Journal of Cell Biology. 2010;189:1129–1142. doi: 10.1083/Jcb.200912045. [DOI] [PMC free article] [PubMed] [Google Scholar]
- 23.Damelin M, Silver PA. In situ analysis of spatial relationships between proteins of the nuclear pore complex. Biophysical journal. 2002;83:3626–3636. doi: 10.1016/S0006-3495(02)75363-0. [DOI] [PMC free article] [PubMed] [Google Scholar]
- 24.Gaik M, et al. Structural basis for assembly and function of the Nup82 complex in the nuclear pore scaffold. J Cell Biol. 2015;208:283–297. doi: 10.1083/jcb.201411003. [DOI] [PMC free article] [PubMed] [Google Scholar]
- 25.Kucukelbir A, Sigworth FJ, Tagare HD. Quantifying the local resolution of cryo-EM density maps. Nat Methods. 2014;11:63–65. doi: 10.1038/nmeth.2727. [DOI] [PMC free article] [PubMed] [Google Scholar]
- 26.Whittle JR, Schwartz TU. Architectural nucleoporins Nup157/170 and Nup133 are structurally related and descend from a second ancestral element. J Biol Chem. 2009;284:28442–28452. doi: 10.1074/jbc.M109.023580. [DOI] [PMC free article] [PubMed] [Google Scholar]
- 27.Walther TC, et al. The cytoplasmic filaments of the nuclear pore complex are dispensable for selective nuclear protein import. J Cell Biol. 2002;158:63–77. doi: 10.1083/jcb.200202088. [DOI] [PMC free article] [PubMed] [Google Scholar]
- 28.Drin G, et al. A general amphipathic alpha-helical motif for sensing membrane curvature. Nat Struct Mol Biol. 2007;14:138–146. doi: 10.1038/nsmb1194. [DOI] [PubMed] [Google Scholar]
- 29.Ori A, Andres-Pons A, Beck M. The use of targeted proteomics to determine the stoichiometry of large macromolecular assemblies. Methods in cell biology. 2014;122:117–146. doi: 10.1016/B978-0-12-417160-2.00006-0. [DOI] [PubMed] [Google Scholar]
- 30.Zemp I, et al. Distinct cytoplasmic maturation steps of 40S ribosomal subunit precursors require hRio2. J Cell Biol. 2009;185:1167–1180. doi: 10.1083/jcb.200904048. [DOI] [PMC free article] [PubMed] [Google Scholar]
- 31.Wessel D, Flugge UI. A method for the quantitative recovery of protein in dilute solution in the presence of detergents and lipids. Analytical biochemistry. 1984;138:141–143. doi: 10.1016/0003-2697(84)90782-6. [DOI] [PubMed] [Google Scholar]
- 32.Mastronarde DN. Automated electron microscope tomography using robust prediction of specimen movements. J Struct Biol. 2005;152:36–51. doi: 10.1016/j.jsb.2005.07.007. [DOI] [PubMed] [Google Scholar]
- 33.Li X, et al. Electron counting and beam-induced motion correction enable near-atomic-resolution single-particle cryo-EM. Nat Methods. 2013;10:584–590. doi: 10.1038/nmeth.2472. [DOI] [PMC free article] [PubMed] [Google Scholar]
- 34.Schur FK, Hagen WJ, de Marco A, Briggs JA. Determination of protein structure at 8.5A resolution using cryo-electron tomography and sub-tomogram averaging. J Struct Biol. 2013;184:394–400. doi: 10.1016/j.jsb.2013.10.015. [DOI] [PubMed] [Google Scholar]
- 35.Movassagh T, Bui KH, Sakakibara H, Oiwa K, Ishikawa T. Nucleotide-induced global conformational changes of flagellar dynein arms revealed by in situ analysis. Nat Struct Mol Biol. 2010;17:761–767. doi: 10.1038/nsmb.1832. [DOI] [PubMed] [Google Scholar]
- 36.Kosinski J, Barbato A, Tramontano A. MODexplorer: an integrated tool for exploring protein sequence, structure and function relationships. Bioinformatics. 2013;29:953–954. doi: 10.1093/bioinformatics/btt062. [DOI] [PMC free article] [PubMed] [Google Scholar]
- 37.Guex N, Peitsch MC. SWISS-MODEL and the Swiss-PdbViewer: an environment for comparative protein modeling. Electrophoresis. 1997;18:2714–2723. doi: 10.1002/elps.1150181505. [DOI] [PubMed] [Google Scholar]
- 38.Kurowski MA, Bujnicki JM. GeneSilico protein structure prediction meta-server. Nucleic Acids Res. 2003;31:3305–3307. doi: 10.1093/nar/gkg557. [DOI] [PMC free article] [PubMed] [Google Scholar]
- 39.Eswar N, et al. Comparative protein structure modeling using MODELLER. Current protocols in protein science/editorial board, John E Coligan … [et al] 2007;Chapter 2 doi: 10.1002/0471140864.ps0209s50. Unit 2 9. [DOI] [PubMed] [Google Scholar]
- 40.Pettersen EF, et al. UCSF Chimera--a visualization system for exploratory research and analysis. J Comput Chem. 2004;25:1605–1612. doi: 10.1002/jcc.20084. [DOI] [PubMed] [Google Scholar]
- 41.Suhre K, Sanejouand YH. ElNemo: a normal mode web server for protein movement analysis and the generation of templates for molecular replacement. Nucleic Acids Res. 2004;32:W610–614. doi: 10.1093/nar/gkh368. [DOI] [PMC free article] [PubMed] [Google Scholar]
- 42.de Vries SJ, et al. HADDOCK versus HADDOCK: new features and performance of HADDOCK2.0 on the CAPRI targets. Proteins. 2007;69:726–733. doi: 10.1002/prot.21723. [DOI] [PubMed] [Google Scholar]
- 43.Minguez P, et al. PTMcode v2: a resource for functional associations of post-translational modifications within and between proteins. Nucleic Acids Res. 2015;43:D494–502. doi: 10.1093/nar/gku1081. [DOI] [PMC free article] [PubMed] [Google Scholar]
Associated Data
This section collects any data citations, data availability statements, or supplementary materials included in this article.


