

Abstract
Amyotrophic lateral sclerosis (ALS) is an adult-onset degeneration of motor neurons that is commonly caused by mutations in the gene encoding superoxide dismutase 1 (SOD1). Both patients and Tg mice expressing mutant human SOD1 (hSOD1) develop aggregates of unknown importance. In Tg mice, 2 different strains of hSOD1 aggregates (denoted A and B) can arise; however, the role of these aggregates in disease pathogenesis has not been fully characterized. Here, minute amounts of strain A and B hSOD1 aggregate seeds that were prepared by centrifugation through a density cushion were inoculated into lumbar spinal cords of 100-day-old mice carrying a human SOD1 Tg. Mice seeded with A or B aggregates developed premature signs of ALS and became terminally ill after approximately 100 days, which is 200 days earlier than for mice that had not been inoculated or were given a control preparation. Concomitantly, exponentially growing strain A and B hSOD1 aggregations propagated rostrally throughout the spinal cord and brainstem. The phenotypes provoked by the A and B strains differed regarding progression rates, distribution, end-stage aggregate levels, and histopathology. Together, our data indicate that the aggregate strains are prions that transmit a templated, spreading aggregation of hSOD1, resulting in a fatal ALS-like disease.
Introduction
Amyotrophic lateral sclerosis (ALS) is characterized by adult-onset degeneration of motor neurons. The resulting paresis begins focally, spreads contiguously, and causes death from respiratory failure when the breathing muscles become involved (1). A major known cause of the disease is mutations in the gene encoding superoxide dismutase 1 (SOD1) (ref. 2; ref. 3 and http://alsod.iop.kcl.ac.uk/) that confer a cytotoxic gain of function on the enzyme that is still poorly understood. Cytosolic inclusions containing aggregated SOD1 are hallmarks of ALS in both patients and Tg animal models expressing mutant human SOD1 species (hSOD1) (4). It is, however, currently unknown whether hSOD1 aggregation drives ALS pathogenesis or is a harmless collateral event.
Another unresolved question is the nature of the spreading characteristic of the disease. Recent studies have shown that SOD1 aggregation can spread from cell to cell in culture systems (5, 6). Moreover, whole extracts from end-stage hSOD1-Tg mice have been found to transmit disease to mice that express a yellow fluorescent protein–conjugated (YFP-conjugated) mutant hSOD1 (7, 8). Taken together, these findings suggest that hSOD1 aggregates may spread disease in a prion-like fashion in the CNS.
Using a binary epitope–mapping method, we have found that 2 different strains of hSOD1 aggregates, A and B, can arise in mice that express hSOD1 variants (9). They were structurally different from hSOD1 aggregates generated under a variety of conditions in vitro, suggesting that the CNS shapes the aggregation process. Here, to test the spreading hypothesis, we inoculated strain A and B hSOD1 aggregates into lumbar spinal cords of mice that express a hSOD1 Tg. We found that the aggregates initiated a templated, spreading aggregation of hSOD1 and, in parallel, fatal motor neuron disease.
Results and Discusson
Preparation and characterization of the hSOD1 aggregate seeds.
The strain A and B aggregates were prepared from terminally ill mice expressing G85R-mutant hSOD1 (hSOD1G85R) and hSOD1D90A, respectively. Spinal cords were homogenized in PBS, to which guanidinium chloride and a detergent had been added to dislodge components adhering to the aggregates and to dissolve membranes. To separate aggregates from soluble hSOD1 species, aggregates in the homogenates were centrifuged through a density cushion. The washed pellets were suspended by sonication in PBS for use as seeds. Similarly extracted spinal cords from non-Tg C57BL/6 mice were used as control seeds.
The hSOD1 aggregates in the seeds displayed typical strain A and B structures (Figure 1, A and B). Virtually all of the hSOD1 in strain A were full-length monomers (Supplemental Figure 1A; supplemental material available online with this article; doi:10.1172/JCI84360DS1), whereas 11% of the hSOD1 in strain B was truncated and 4% was present in high-molecular-weight complexes (Supplemental Figure 1D). Differential centrifugation and size-exclusion chromatography showed that over 99% and 95%, respectively, of hSOD1 in the A and B seeds was present in aggregates and fibrils (Supplemental Figure 1, B, C, E, and F). The rest consisted of folded dimers and monomers, and there was no evidence for the presence of any oligomeric species. For additional characterization, see Supplemental Figure 2.
Figure 1. Epitope-mapping patterns of seeds and aggregates formed in inoculated mice.

(A) Epitope-mapping patterns of the strain A seed (analyzed on 4 different occasions to demonstrate the method’s variability), 4 terminally ill strain A–inoculated mice, and 4 terminally ill noninoculated hSOD1G85R-Tg mice. The staining intensities with the 8 Abs were normalized against staining with the aa 57–72 Ab (set to 100%) to facilitate the comparison of patterns. (B) Patterns of the strain B seed (analyzed on 5 different occasions) and of 11 terminally ill strain B–inoculated hSOD1G85R-Tg mice. The staining intensities were normalized against staining with the aa 111–127 Ab (set to 100%). Typical strain B patterns are seen. (C) Strain A aggregate deposition in spinal cord of a hSOD1G85R mouse sacrificed 24 hours after the inoculation. The section was stained with the aa 131–153 Ab. No such staining was induced by a syringe stick alone (Supplemental Figure 4). Arrow indicates the position of the seed in the left side of the lumbar spinal cord. cc, central channel. Scale bar: 50 μm. Dotted line delineates the ventral horn.
Inoculation of hSOD1 aggregates into spinal cord initiates premature fatal motor neuron disease.
Since human and murine SOD1 species lack the ability to coaggregate (refs. 9, 10, and Supplemental Figure 3), mice expressing hSOD1 were used as recipients. The hSOD1G85R-Tg model was chosen, as it offers several advantages. The level of mutant hSOD1 is as low as the background level of murine SOD1 (11, 12). These mice have a long symptom-free period, followed by a late middle-age onset of paresis and then a rapid disease course (Figure 2A). Most important, this is paralleled by a long period during which no hSOD1 aggregates can be detected (Figure 2B). Seeding effects are therefore easy to discern.
Figure 2. Inoculation of strain A and B aggregates initiated spreading, templated hSOD1 aggregation and premature motor neuron disease.

(A) Blue line indicates the survival of mice inoculated with the strain A seed (n = 32); red line indicates the survival of mice inoculated with the strain B seed (n = 16); green line indicates the survival of mice inoculated with the control seed (n = 10); gray line indicates the survival of noninoculated mice (n = 101). (B) Strain A aggregation in whole spinal cords of mice analyzed with the epitope-mapping assay using the aa 57–72 Ab. Blue triangles represent asymptomatic, blue Xs early symptomatic, and blue circles terminally ill strain A–inoculated mice. Green and gray triangles represent asymptomatic and green and gray circles represent terminally ill control-inoculated and noninoculated mice, respectively. (C) Strain B aggregation analyzed with the aa 111–127 Ab. Symbols as in B, except that strain B–inoculated mice are shown in red. Dashed line indicates regression lines adapted from Supplemental Figure 7. Shaded areas in B and C indicate blank reactions (9).
We started with the strain A seed. Guided stereotactically, 1 μl seed suspension was inoculated into the lumbar ventral horn on the left side at the L2–L3 levels in mice that were approximately 100 days old (Figure 1C). The amount of inoculated strain A aggregates, 5 ng, was minute, which is 15-fold less than the amount of hSOD1G85R present in 1 μl (mg) spinal cord (12). After 69 days, the mice showed the first signs of disease, with paresis in the left hind leg, and after 99 days, they reached the end stage of disease (Table 1). Human noninoculated hSOD1G85R-Tg mice reached the terminal stage approximately 200 days later, as did mice inoculated with the control seed (Figure 2A and Table 1).
Table 1. Development of pathology in inoculated mice.
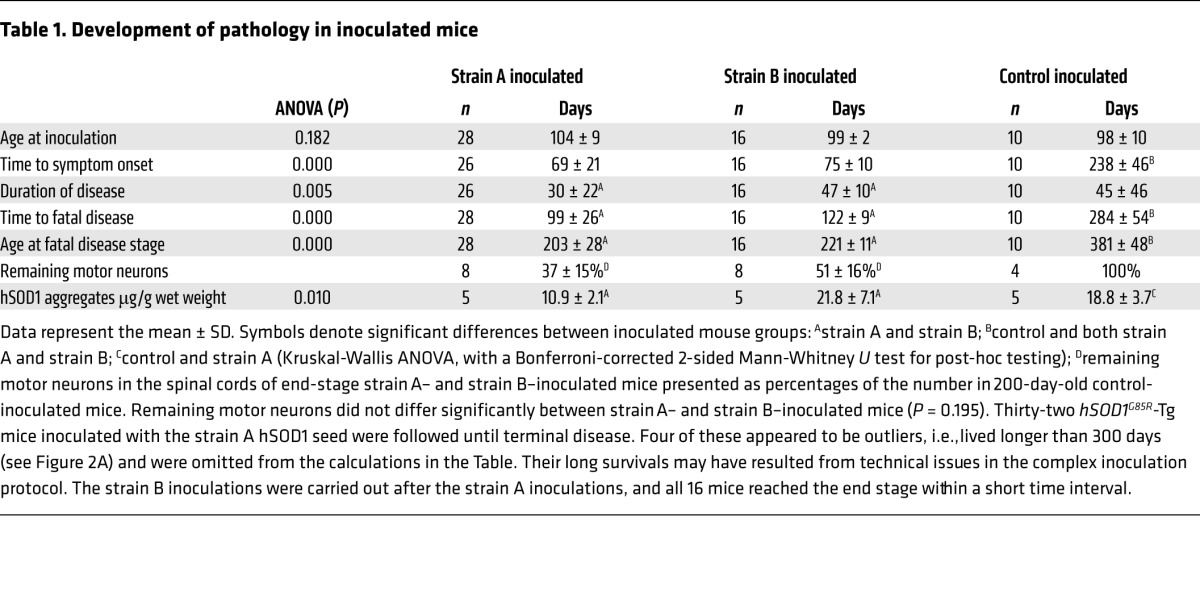
As further controls, 6 non-Tg C57BL/6 mice were inoculated with the strain A seed. Two mice had to be sacrificed after 31 and 176 days for reasons unrelated to SOD1 aggregation and ALS (Supplemental Figure 5). The remaining mice are currently 546, 546, 599, and 772 days old and healthy.
We next inoculated the strain B seed. The 1-μl inoculate contained 10 ng strain B hSOD1 aggregates. Unlike strain A, strain B aggregates never arise spontaneously in hSOD1G85R-Tg mice (9). The first symptoms appeared after 75 days, but the progression was slower than in strain A–inoculated mice, and end-stage disease was reached after 124 days (Figure 2A and Table 1).
There were major losses of motor neurons in the spinal cords of end-stage strain A– and strain B–inoculated mice (Table 1). Around the time of symptom onset, the mice started losing body weight, and at the end stage, fiber-type grouping was seen in skeletal muscle, both signs indicating denervation-induced muscle atrophy (Supplemental Figure 6). The time from peak weights to the end stage was significantly longer in the strain B–inoculated mice than in the strain A–inoculated mice.
Spread of templated aggregation along the neuraxis.
Spinal cords from strain A–inoculated hSOD1G85R-Tg mice with end-stage disease contained large amounts of aggregates with typical strain A patterns that were similar to those that arose in the noninoculated mice and that corresponded to the seed used (Figure 1A). The strain B–inoculated mice contained similarly large amounts of aggregates, but fulfilled the criteria for the B strain: the N-terminal one-third of the sequence recruited to the fibril core, with the rest apparently looping in a disordered manner into the solvent (Figure 1B and ref. 9).
The 57–72 and 111–127 Abs were used to analyze time courses of the strain A and strain B aggregations, respectively (Figure 1, A and B). Following the inoculations (Figure 2, B and C), aggregate levels were close to the detection limits. In early symptomatic mice, approximately 10 weeks after the inoculations, considerable amounts of aggregates were found. At the end stage, the levels were roughly 3-fold higher than those detected at disease onset (Figure 2, B and C). The growth of aggregation was broadly exponential, with doubling times of 10 and 15 days, respectively, in the strain A– and strain B–inoculated mice (Supplemental Figure 7).
The spinal cords of strain A–inoculated mice with end-stage disease contained half as much detergent-resistant hSOD1 aggregates as did those inoculated with strain B, which in turn were comparable to the amounts detected in control-inoculated mice (Table 1). The final amounts of A and B aggregates were approximately 300-fold larger than the amounts that were inoculated.
In the presymptomatic mice, the highest levels of aggregates were seen in lumbar spinal cord, and there was significantly more on the inoculated left side (Figure 3, A and D). No distinct left-right differences appeared in the rostral segments, nor in any segment at the later disease stages (Wilcoxon signed-rank test). Thus, the largely extracellular deposition of the seeds in the left side resulted in the aggregation spreading along the neuraxis, with essentially even left-right distributions. At the end stage, the aggregate distribution along the spinal cord had become comparatively even in strain A–inoculated mice, whereas the lumbar predominance remained in the strain B–inoculated group (Figure 3, B, and F). This difference was highly significant (Supplemental Figure 8 and Supplemental Table 1). The distribution patterns in the control-inoculated and noninoculated groups varied considerably among individual mice, but there were overall no significant differences when compared with the strain A–inoculated mice. Distinct cervical preponderances, however, only appeared in the former groups. In accord with the aggregate distributions, all strain A– and B–inoculated mice showed hind leg onsets, mostly on the left side. In contrast, 7 of the control-inoculated mice showed hind leg onsets and 3 showed foreleg onsets. All 3 of the latter displayed cervical preponderances at the end stage of disease (Supplemental Figure 8). Approximately 40% of the noninoculated mice showed foreleg onsets. The distribution patterns and onset sites in the latter groups suggest that the hSOD1 aggregations initiated at random positions along the neuraxis.
Figure 3. Propagation of hSOD1 aggregation along the neuraxis.

(A and B) Strain A–inoculated mice. (A) Results for presymptomatic mice aged 16–47 days (n = 8). Individual mice in different colors; open and closed triangles show the left (inoculation) and right sides, respectively. In some cases (white triangles and black triangles), only 1 of the sides was available. (B) Light blue and dark blue Xs indicate the left and right sides of 3 early-onset mice, respectively. Light blue circles and dark blue circles indicate the left and right sides of terminally ill mice. (C) Terminally ill noninoculated mice (gray circles) and control-inoculated mice (green circles). (D–F) Strain B–inoculated mice. (D) Presymptomatic mice aged 25–103 days (n = 8); symbols as in A. (E) Red Xs and brown Xs indicate the left and right sides of 2 early-symptomatic 87- and 114-day-old mice, respectively. (F) Red circles and brown circles indicate the left and right sides of terminally ill mice. Shaded areas in A, B, and D indicate blank reactions (9).
Brain showed 10-fold lower levels of aggregates than did spinal cord in strain A–inoculated mice, and the difference was even larger in strain B–inoculated mice (Figure 3, B and F, and Supplemental Figure 8, A and B). The hSOD1 aggregates were still sparser in cerebellum. These markedly lower levels are hardly explained only by the distance from the inoculation sites and suggest that brain and cerebellum, overall, have lower susceptibilities to hSOD1 aggregation. Factors contributing to the differences could be an enrichment of misfolded hSOD1 monomers in spinal cord (13) and the low inherent autophagic capacity of the spinal motor system (14).
Histopathology.
At symptom onset, the strain A– and B–inoculated mice showed cytoplasmic granular SOD1–immunoreactive aggregates in many neurons and glial cells as well as occasional SOD1-immunoreactive threads in the neuropil at all levels of the spinal cord (Supplemental Figure 9, A, B, D, E, G, H, J, and K). The changes were less advanced in the brainstem. Time-matched, control-inoculated mice showed less of these features.
In the end stage, the most obvious change was a vast increase in the numbers of neuropil threads. They were significantly more abundant in the strain B–inoculated mice than in the strain A–inoculated and noninoculated mice (Supplemental Figure 9, M, N, P, Q, S, T, V, and X, and Supplemental Table 2). There were also increased numbers of cells with cytoplasmic granular aggregates at the spinal level, although these numbers did not differ significantly between the A and B groups. The histopathological findings in the brain stem in the end stage of disease were more similar to those at the spinal level than to the findings at symptom onset in the mice. Histopathology, although a poor technique for quantifying aggregate amounts, thus suggests differences in tissue distribution between strain A and B aggregates.
Conclusions.
The results suggest that the 2 hSOD1 aggregate strains that arise in the CNS are ALS-inducing prions (15). Their structures are widely different, and they are found to provoke phenotypes that differ in terms of aggregation and disease progression rates, neuraxis distributions, terminal levels of aggregates, and histopathological findings. However, both cause fatal neurodegenerative conditions bearing the hallmarks of human ALS. We believe that these insights are important for the development of rational interventions against the relentlessly progressive ALS (1) for which no effective treatment exists.
Methods
Further information can be found in the Supplemental Methods.
Statistics.
Unless otherwise specified, the statistical analyses were performed using a Kruskal-Wallis ANOVA, with a Bonferroni-corrected 2-sided Mann-Whitney U test for post-hoc analyses. A P value of 0.05 or less was considered statistically significant. For comparisons of 2 groups, a 2-sided Mann-Whitney U test was used.
Study approval.
The use and maintenance of the mice and the experimental protocol described here were approved by the Umeå Regional Ethics Committee for Animal Research (Umeå, Sweden).
Author contributions
SLM and TB designed the study. EEB, JB, and PZ conducted the experiments. SLM, TB, EEB, JB, PZ, and PMA analyzed the data. SLM, TB, and PMA wrote the manuscript.
Supplementary Material
Acknowledgments
This study was supported by the Swedish Research Council; the Knut and Alice Wallenberg Foundation; the Bertil Hållsten Foundation; the Torsten and Ragnar Söderberg Foundation; the Swedish Brain Fund; the Stratneuro Initiative; the Västerbotten County Council; and the Kempe Foundations. We thank Mikael Oliveberg, Jens Danielsson, and Anna Wuolikainen for valuable discussions and Eva Bern, Karin Hjertkvist, Matthew Marklund, Åsa Larefalk, Ulla-Stina Spetz, and Agneta Öberg for their skillful technical assistance.
Footnotes
Conflict of interest: The authors have declared that no conflict of interest exists.
Reference information:J Clin Invest. 2016;126(6):2249–2253. doi:10.1172/JCI84360.
Contributor Information
Elaheh Ekhtiari Bidhendi, Email: Elaheh.Ekhtiari.Bidhendi@umu.se.
Johan Bergh, Email: johan.bergh@medbio.umu.se.
Per Zetterström, Email: per.zetterstrom@medbio.umu.se.
Peter M. Andersen, Email: peter.andersen@neuro.umu.se.
References
- 1. Charcot JM. Lecons sur les maladies du système nerveux. 2nd series, collected by Bourneville 1873. In: Charcot JM, Sigerson G, eds. Lectures On The Diseases Of The Nervous System. Vol. 2. London, United Kingdom: New Sydenham Society; 1881:163–204. [Google Scholar]
- 2.Rosen DR, et al. Mutations in Cu/Zn superoxide dismutase gene are associated with familial amyotrophic lateral sclerosis. Nature. 1993;362(6415):59–62. doi: 10.1038/362059a0. [DOI] [PubMed] [Google Scholar]
- 3.Wroe R, Wai-Ling Butler A, Andersen PM, Powell JF, Al-Chalabi A. ALSOD: the Amyotrophic Lateral Sclerosis Online Database. Amyotroph Lateral Scler. 2008;9(4):249–250. doi: 10.1080/17482960802146106. [DOI] [PubMed] [Google Scholar]
- 4.Kato S, et al. New consensus research on neuropathological aspects of familial amyotrophic lateral sclerosis with superoxide dismutase 1 (SOD1) gene mutations: inclusions containing SOD1 in neurons and astrocytes. Amyotroph Lateral Scler Other Motor Neuron Disord. 2000;1(3):163–184. doi: 10.1080/14660820050515160. [DOI] [PubMed] [Google Scholar]
- 5.Grad LI, et al. Intercellular propagated misfolding of wild-type Cu/Zn superoxide dismutase occurs via exosome-dependent and -independent mechanisms. Proc Natl Acad Sci U S A. 2014;111(9):3620–3625. doi: 10.1073/pnas.1312245111. [DOI] [PMC free article] [PubMed] [Google Scholar]
- 6.Munch C, O’Brien J, Bertolotti A. Prion-like propagation of mutant superoxide dismutase-1 misfolding in neuronal cells. Proc Natl Acad Sci U S A. 2011;108(9):3548–3553. doi: 10.1073/pnas.1017275108. [DOI] [PMC free article] [PubMed] [Google Scholar]
- 7.Ayers JI, et al. Experimental transmissibility of mutant SOD1 motor neuron disease. Acta Neuropathol. 2014;128(6):791–803. doi: 10.1007/s00401-014-1342-7. [DOI] [PubMed] [Google Scholar]
- 8.Ayers JI, Fromholt SE, O’Neal VM, Diamond JH, Borchelt DR. Prion-like propagation of mutant SOD1 misfolding and motor neuron disease spread along neuroanatomical pathways. Acta Neuropathol. 2016;131(1):103–114. doi: 10.1007/s00401-015-1514-0. [DOI] [PMC free article] [PubMed] [Google Scholar]
- 9.Bergh J, et al. Structural and kinetic analysis of protein-aggregate strains in vivo using binary epitope mapping. Proc Natl Acad Sci U S A. 2015;112(14):4489–4494. doi: 10.1073/pnas.1419228112. [DOI] [PMC free article] [PubMed] [Google Scholar]
- 10.Grad LI, et al. Intermolecular transmission of superoxide dismutase 1 misfolding in living cells. Proc Natl Acad Sci U S A. 2011;108(39):16398–16403. doi: 10.1073/pnas.1102645108. [DOI] [PMC free article] [PubMed] [Google Scholar]
- 11.Bruijn LI, et al. ALS-linked SOD1 mutant G85R mediates damage to astrocytes and promotes rapidly progressive disease with SOD1-containing inclusions. Neuron. 1997;18(2):327–338. doi: 10.1016/S0896-6273(00)80272-X. [DOI] [PubMed] [Google Scholar]
- 12.Jonsson PA, et al. Disulphide-reduced superoxide dismutase-1 in CNS of transgenic amyotrophic lateral sclerosis models. Brain. 2006;129(pt 2):451–464. doi: 10.1093/brain/awh704. [DOI] [PubMed] [Google Scholar]
- 13.Zetterstrom P, et al. Soluble misfolded subfractions of mutant superoxide dismutase-1s are enriched in spinal cords throughout life in murine ALS models. Proc Natl Acad Sci U S A. 2007;104(35):14157–14162. doi: 10.1073/pnas.0700477104. [DOI] [PMC free article] [PubMed] [Google Scholar]
- 14.Tokuda E, Brannstrom T, Andersen PM, Marklund SL. Low autophagy capacity implicated in motor system vulnerability to mutant superoxide dismutase. Acta Neuropathol Commun. 2016;4(1): doi: 10.1186/s40478-016-0274-y. [DOI] [PMC free article] [PubMed] [Google Scholar]
- 15.Watts JC, Prusiner SB. Mouse models for studying the formation and propagation of prions. J Biol Chem. 2014;289(29):19841–19849. doi: 10.1074/jbc.R114.550707. [DOI] [PMC free article] [PubMed] [Google Scholar]
Associated Data
This section collects any data citations, data availability statements, or supplementary materials included in this article.