Abstract
Tumor cell adhesion to vessel walls in the microcirculation is one critical step in cancer metastasis. In this paper, the hypothesis that tumor cells prefer to adhere at the microvessels with localized shear stresses and their gradients, such as in the curved microvessels, was examined both experimentally and computationally. Our in vivo experiments were performed on the microvessels (post-capillary venules, 30–50 μm diameter) of rat mesentery. A straight or curved microvessel was cannulated and perfused with tumor cells by a glass micropipette at a velocity of ~1mm/s. At less than 10 min after perfusion, there was a significant difference in cell adhesion to the straight and curved vessel walls. In 60 min, the averaged adhesion rate in the curved vessels (n = 14) was ~1.5-fold of that in the straight vessels (n = 19). In 51 curved segments, 45% of cell adhesion was initiated at the inner side, 25% at outer side, and 30% at both sides of the curved vessels. To investigate the mechanical mechanism by which tumor cells prefer adhering at curved sites, we performed a computational study, in which the fluid dynamics was carried out by the lattice Boltzmann method, and the tumor cell dynamics was governed by the Newton’s law of translation and rotation. A modified adhesive dynamics model that included the influence of wall shear stress/gradient on the association/dissociation rates of tumor celladhesion was proposed, in which the positive wall shear stress/gradient jump would enhance tumor cell adhesion while the negative wall shear stress/gradient jump would weaken tumor cell adhesion. It was found that the wall shear stress/gradient, over a threshold, had significant contribution to tumor cell adhesion by activating or inactivating cell adhesion molecules. Our results elucidated why the tumor cell adhesion prefers to occur at the positive curvature of curved microvessels with very low Reynolds number (in the order of 10−2) laminar flow.
Keywords: Tumor cell adhesion, Wall shear stress/gradient, Curved microvessel, In vivo single vessel experiment, Lattice Boltzmann method
1 Introduction
Cell adhesion under blood flow conditions is a very common and important phenomenon in microcirculation, such as leukocyte adhesion for the immune functions, platelet adhesion for the wound-healing functions, and tumor cell adhesion in cancer metastasis. Recently, a major conceptual development that has been made in cell adhesion is the recognition that cell adhesion is often mediated via a small number of adhesive receptor–ligand bonds (Alon et al. 1995; Zhu et al. 2000). It has been reported that the successful cell arrest is strongly dependent on the balance between adhesive and anti-adhesive forces, as well as the rate at which the receptor–ligand bonds are broken (Weiss 1992; Zhu 2000).
Many in vitro studies of leukocyte adhesion identified that the cell adhesion molecules on leukocytes and endothelium govern the leukocyte adhesion under flow conditions (Munn et al. 1996). To quantify the observed phenomena, numerous numerical studies of leukocyte adhesion, i.e., the effects of leukocyte deformation or cell-cell interactions on leukocyte adhesion, have been conducted (Dong et al. 1999; Migliorini et al. 2002; Sun et al. 2003). Tumor cell adhesion to the microvasculature is also a complex process involving various types of cell adhesion molecules that located on tumor cells and endothelium (Haier and Nicolson 2001). Dong et al. (2005) examined human melanoma cell adhesion and migration under hydrodynamic conditions by using a modified Boyden chamber. Most of the previous investigations on cell adhesion were carried out in the straight chambers/vessels, owing to the simplicity in these situations.
To quantitatively understand the adhesion mechanism, several mathematical models of cell adhesion have been developed. Hammer and Apte (1992) proposed a typical ‘adhesive dynamics model’ that can simulate the effect of many parameters on cell adhesion. Since then, various simplifications, modifications, and refinements of the models were proposed to explore cell adhesion under different biophysical situations (Dong et al. 1999; Caputo and Hammer 2005). In these adhesive dynamics models, the receptor–ligand bonds stochastically form and break according to the probabilities determined by the forward and reverse reaction rates of cell adhesion molecules. A variety of reverse reaction rate laws are available to characterize the coupling of applied force and bonds dissociation. Among them, the Bell’s model (1978) was validated to be a good approximation for different states of cell adhesion in the straight microvessels, such as no adhesion, rolling, landing, and firm adhesion (Caputo and Hammer 2005).
Our new in vivo experiments in the current study demonstrated that tumor cells prefer to adhere to the curved vessels than the straight ones. When analyzing more carefully the adhesion images, we found that the tumor cell adhesion usually occurred at the conjunction of positive and negative curved segments. In our previous work, we found that both the vessel curvature and cell-cell interaction would significantly enhance this preferential adhesion in the curved vessels (Yan et al. 2010). In addition, it was reported that the higher shear stress/rate gradient at the positive curvature would be responsible for initiating cell accumulation in the curved vessels (Liu et al. 2008). Since the wall shear stress distribution would vary significantly at the conjunction in a curved vessel, this inspires us that the wall shear stress and its gradient would play an important role in tumor cell adhesion. It is understandable that the flow-induced wall shear stress would influence the molecular interactions greatly, and the complex shear stress distribution at the curvature appears to render these sites to be susceptible for cell arrest. While aforementioned studies have led to a better understanding of cell adhesion in the curved vessels, our understanding is still poor for the quantitative relationship between wall shear stresses/gradients and tumor cell adhesions. This motivates us to numerically investigate the effect of wall shear stress/gradient on tumor cell adhesion in the curved vessels. A comprehensive biophysical description of tumor cell adhesion in microvessels may eventually provide a rational basis for the development of novel therapeutic strategies to combat cancer. In this study, a modified adhesive dynamics model was developed to account for the effect of shear stress distributions on tumor cell adhesion in curved vessels. The simulation results can be used to quantitatively explain the mechanical mechanism of tumor cell adhesion in curved vessels with very low Reynolds number (in the order of 10−2) laminar flow.
2 Methods
2.1 Experimental methods
Experiments were performed on rat mesentery. All procedures have been approved by the Animal care and Use Committees at the City College of the City University of New York. Female Sprague-Dawley rats (250–300 g) were supplied by Hilltop Laboratory Animals (Scottdale, PA). Rats were anesthetized with pentobarbital sodium given subcutaneously at the initial dosage 65 mg/kg and additional 3 mg/dose as needed. After a rat was anesthetized, a midline surgical incision (2–3 cm) was made in the abdominal wall. The mesentery was gently taken out from the abdominal cavity and spread on a glass coverslip, which formed the base of the observation platform as previously described (Fu and Shen 2004). The gut was gently pinned out against a silicon elastomer barrier to maintain the spread of the mesentery. The upper surface of the mesentery was continuously superfused by a dripper with mammalian Ringer solution at 35–37°C, which was regulated by a controlled water bath and monitored regularly by a thermometer probe (Fu and Shen 2004). The microvessels chosen for the study were straight or curved post-capillary venules, with diameters of 30–50 μm. All vessels had brisk blood flow immediately before cannulation and had no marginating white cells.
The detailed method for cell adhesion experiment was described in Shen et al. (2010). Briefly, a single post-capillary venule was cannulated with a glass micropipette (~30 μm tip diameter, WPI Inc., Florida) and perfused with the 1% BSA rat Ringer solution with Calcein AM-labeled human breast cancer cells MDA-MB-231 at a mean flow velocity of ~1 mm/s, which is the normal blood circulation velocity in this type of vessels. For this perfusion velocity, there was ~1 cell/s out of the micropipette tip if the cell concentration in the pipette was 2 million/ml. A Nikon Eclipse TE-2000 inverted microscope with a 20× objective lens (NA 0.75, super, Nikon) was used to observe the adhesion process and imaged by a high performance digital 12 bit CCD camera (SensiCam QE, Cooke Corp., Romulus, MI) using InCyt Im 1 software. Adherent cells were counted offline in a vessel segment of 300–400 μm length and expressed as the number of adherent cells per 5,000 μm2 plane area (length x diameter) of the vessel segment. The measuring area was set at least 150 μm downstream from the cannulation site of the vessel to avoid entrance flow effects.
2.2 Fluid and cell dynamics
The numerical methods adopted in this study are the same as those in our previous study (Yan et al. 2010). The blood dynamics is simulated by the lattice Boltzmann method (LBM) (Chen and Doolen 1998), and the tumor cell dynamics is governed by the Newton’s law. The schematic view of adhesive dynamics model is displayed in Fig. 1. The tumor cell was idealized as a disk, the cell adhesion molecules on the surface of tumor cell were defined as receptors, and those on the surface of endothelial cells forming the microvessel wall were defined as ligands. Once the distance between a receptor and a ligand is smaller than the critical length Hc, there is a chance to form stochastic receptor–ligand bond. The tumor cell dynamics follows the Newton’s law of translation and rotation,
Fig. 1.
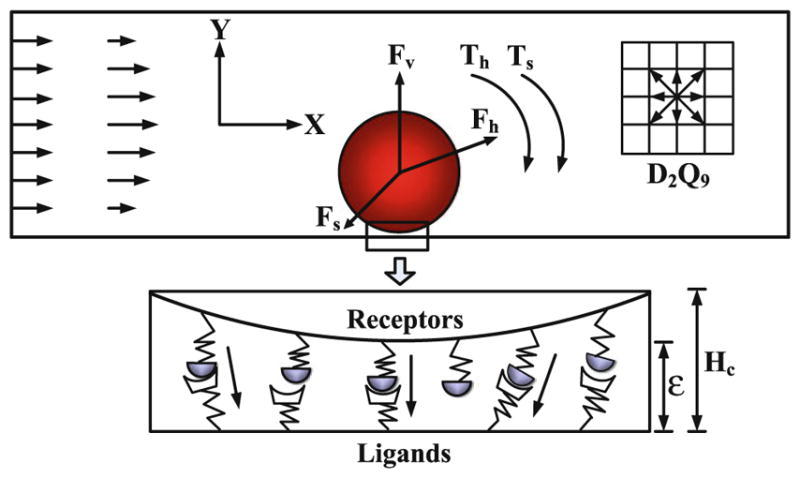
Schematic diagram of the adhesive dynamics model
| (1) |
where u⃑c is the velocity of the tumor cell, ωc is the angular velocity, m is the mass, I is the inertia, F⃑c is the total force acting on the tumor cell, Tc is the torque, and dt is the time step. Here, F⃑c = F⃑h + F⃑v + F⃑s and Tc = Th + Ts, where F⃑h is the hydrodynamic force that can be calculated by momentum exchange method (Ladd 1994), F⃑v is the repulsive van der Waals force that can be derived by the Derjaguin approximation (Bongrand and Bell 1984), F⃑s is the total spring force that contributed by the adhesive receptor–ligand bonds, and Th and Ts are the torques induced by the hydrodynamic force and spring force, respectively. At each time step, the position x⃑c and rotational angle θc of the tumor cell are determined by,
| (2) |
2.3 Modified adhesive dynamics model
The adhesive dynamics model is integrated to account for the effect of stochastic receptor–ligand bonds. The interactions between receptors and ligands are realized via the compression or expansion of the ideal adhesive springs, whose kinetic expressions relate the bond association and dissociation rates. Generally, the normal bond association rate is a reasonable value that can properly recreate experimental values for velocity and dynamics of rolling in the straight vessels (Chang et al. 2000), and the normal bond dissociation rate in the straight vessels is force dependent based on the Bell’s model (1978),
| (3) |
where kb is the Boltzmann constant, T is the temperature, is the unstressed dissociation rate, γ is the reactive compliance, and f is the spring force of each bond calculated from the Hooke’s law: f = σ(χ − λ), where σ is the spring constant, χ is the distance between receptor and ligand, and λ is the equilibrium bond length.
From the analysis of current in vivo experiments, it is found that the strong tumor cell adhesion usually occurs at the conjunction of curvatures in which the wall shear stress/gradient varies significantly. That more tumor cell adhesion occurs at the conjunction suggests that more ligands are activated there, i.e., the wall shear stress/gradient would promote the activation of ligands that would increase the association rate and decrease the dissociation rate. Therefore, we modify the Bell’s model and take into account the effect of wall shear stress on bond association/dissociation rates as follows:
| (4) |
| (5) |
and the effect of wall shear stress gradient on bond association/dissociation rates as follows:
| (6) |
| (7) |
where τ and τ0 are the wall shear stress along the curved vessel and along the straight part of a curved vessel, and dτ/dl is the wall shear stress gradient along the curved vessel. k1, k2 and k3, k4 are coefficients that represent the sensitivity of wall shear stress and its gradient to bond association/dissociation rates, respectively. The modified two adhesive dynamics models can be reduced to the general Bell’s model at k1 = k2 = k3 = k4 = 0, which indicates that the bond reaction rates have no dependence on wall shear stress/gradient. This general model has been studied in our previous work (Yan et al. 2010). In the current simulations, we assume k1, k2 and k3, k4 to be 1.0, −5.0 μm/Pa and 1.0, −50.0 μm/Pa, respectively, to match the experimental observations.
Once the modified bond association/dissociation rates are known, the expressions for the probability of bond formation and breakage tethers in a time step dt can be obtained by (Chang and Hammer 1996),
| (8) |
| (9) |
where P f and Pr are the probability of forming and breaking a bond in a time interval dt, respectively. A stochastic Monte Carlo technique is used to determine the formation and breakage of each free and bound molecule during each time step. Finally, the total spring force can be calculated by the summation of all the adhesive springs,
| (10) |
where n is the total number of bonds in each time step.
In these two modified models, we consider three cases:
Case 1: The association/dissociation rates of the receptor–ligand bonds follow Eqs. (4) and (5), which continuously vary with the ratio of wall shear stresses τ/τ0;
Case 2: The association/dissociation rates of the receptor–ligand binding follow Eqs. (6) and (7), which continuously change with the wall shear stress gradient dτ/dl;
Case 3: Only the jumps or drops in the wall shear stress gradient can trigger the change of bond association/dissociation rates. Once triggered, the association/dissociation rates will keep the maximum/minimum value as calculated by Eqs. (6) and (7) until the next wall shear stress gradient jump or drop occurs.
If the numerical results that based on these two modified adhesive dynamics models are in good agreement with the in vivo experimental observations, we can validate our assumptions that the dependencies of tumor cell adhesion on local wall shear stress/gradient in curved vessels are rational in the real biophysical situations.
3 Results
3.1 Experimental results
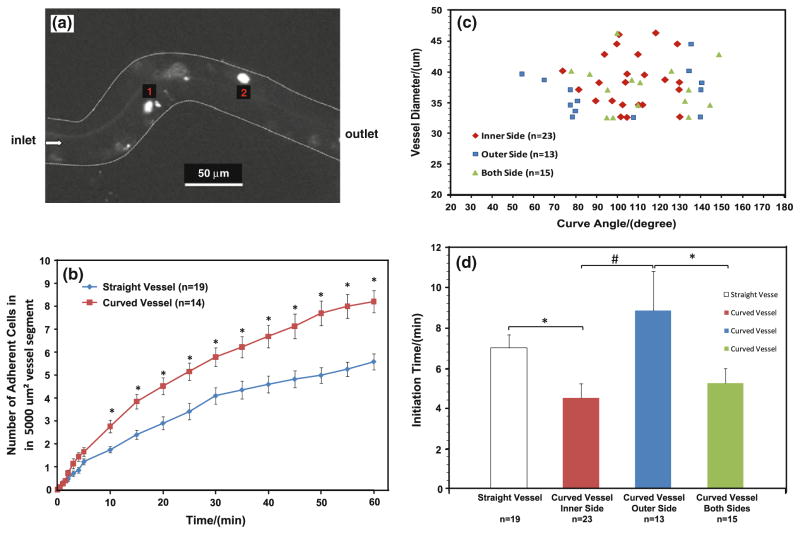
Figure 2a shows a typical photomicrograph for tumor cells adhesion in a curved microvessel after ~30 min perfusion. Figure 2b summarized the tumor cell adhesion in 14 curved vessels and 19 straight vessels. Overall, in less than 10 min, tumor cells adhered significantly more in the curved vessels than in the straight ones. For a 60 min period, the averaged adhering rate of tumor cells in the curved vessels was ~1.5 fold of that in the straight vessels (p < 0.03).
Fig. 2.
a Photomicrograph of MDA-MB-231 cancer cell adhesion to a curved post-capillary venule of diameter ~40 μm after ~30 min perfusion. The bright spots are adherent tumor cells; b comparison of tumor cell adhesion in straight and curved vessels. Data presented are mean ± SE. *p < 0.03; c location of initial tumor cell adhesion in curved vessels as a function of curve angles and vessel diameters; d comparison of initiation times for tumor cell adhesion in straight vessels, at inner, outer and both sides of curved vessels. Data presented are mean ± SE. *p < 0.05; #p < 0.01
Figure 2c presented the distribution of adhering sites as a function of the vessel diameter and the curve angle in the curved vessels. Figure 2d compared the adhesion initiation times at different sites in the curved and straight vessels. Cell adhesion started at the inner side (positive curvature) of the curved sites in 23 out of 51 curved segments (45%) and with the shortest initiation time of 4.5 ± 0.7 (mean ± SE) min; started at both sides in 15 out 51 curved segments (30%) with a insignificantly longer initiation time of 5.2 ± 0.7 min; started at the outer side (negative curvature) in 13 out of 51 curved segments (25%) with the longest initiation time of 8.9 ± 1.9 min (p < 0.05). Compared to the straight vessels with the initiation time of 7.0 ± 0.7 min, the initiation time at the inner side of the curved vessels was significantly shorter. Our results indicate that tumor cells have preference in adhering to the wall of the curved vessels and initiate at the inner side of the curved segments. Although there was no preference in cell adhesion in the size of the post-capillary venules in our range (30–50 μm diameter), there was a preference in the curve angle. Tumor cell adhesion tended to initiate in the inner or both sides of the curved segments if the curve angle is in the middle zone of 50–150 degrees (see Fig. 3 for the definition of the curve angle θ). In contrast, tumor cell adhesion tended to initiate at the outer side when the curve angle was either small or large.
Fig. 3.
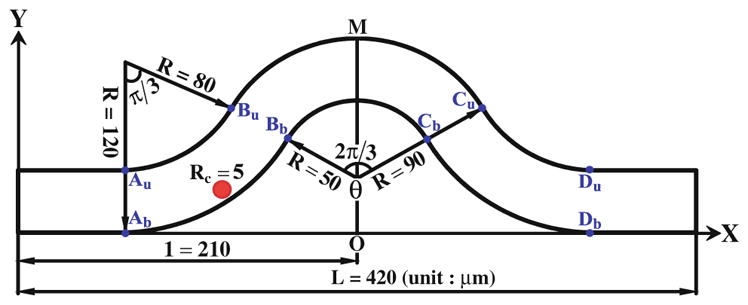
Schematic view of the curved microvessel
3.2 Computational results
From our in vivo experiments, we found that the tumor cells preferred to adhere to the curved vessels and initiate at the inner side of the curved sites. To explore the mechanical mechanism of this phenomenon, a curved microvessel with both positive and negative curvature is designed to simulate the experimental observation shown in Fig. 2a. Figure 3 demonstrates the schematic view of the 2-D curved vessel in our simulation. The vessel of diameter D = 40 μm starts with a straight segment and then a negatively bent segment of θ = π/3 bending angle, with the inner curvature radius of 80 μm and the outer radius of 120 μm, following with a positively curved segment with the inner and outer radii of 50 and 90 μm, respectively. The right half of the vessel is symmetric to the left half with the total vessel length L = 420 μm. Here, we used a cell of radius Rc = 5 μm, a typical size of a circulating tumor cell. Au, Bu, Cu, Du and Ab, Bb, Cb, Db are the conjunctions of positive and negative curvature segments, respectively. The tumor cell was driven by a pressure difference Δp = 10 Pa between the inlet and outlet. The simulation parameters and their values are tabulated in Table 1.
Table 1.
Simulation parameters and values
| Parameter | Definition | Value (reference) | |
|---|---|---|---|
| Hc | Cut-off length for formation | 40 nm (Chang et al. 2000) | |
| ρf | Plasma density | 1.03 g/cm3 (Skalak and Chien 1987) | |
| ν | Plasma kinetic viscosity | 1.2 × 10⁻⁶ m2/s (Skalak and Chien 1987) | |
| T | Temperature | 310 K (Chang and Hammer 1996) | |
| λ | Equilibrium bond length | 20 nm (Chang and Hammer 1996) | |
| kb | Boltzmann constant | 1.38 × 10⁻²³ J/K | |
| σ | Spring constant | 2 × 10⁻³ N/m (Chang and Hammer 1996) | |
|
|
Normal association rate | 84 s−1 (Chang et al. 2000) | |
|
|
Unstressed dissociation rate | 200 s−1 (Chang et al. 2000) | |
| γ | Reactive compliance | 0.75Å (Bell 1978) | |
| Nr | Receptor density | 47/μm2 (Chang and Hammer 1996) | |
| Nl | Ligand density | 1,000/μm2 (Lomakina and Waugh 2004) | |
| k1 | Sensitivity of wall shear stress to association rate | 1.0 | |
| k2 | Sensitivity of wall shear stress to dissociation rate | −5.0 | |
| k3 | Sensitivity of wall shear stress gradient to association rate | 1.0 μm/Pa | |
| k4 | Sensitivity of wall shear stress gradient to dissociation rate | −50.0 μm/Pa |
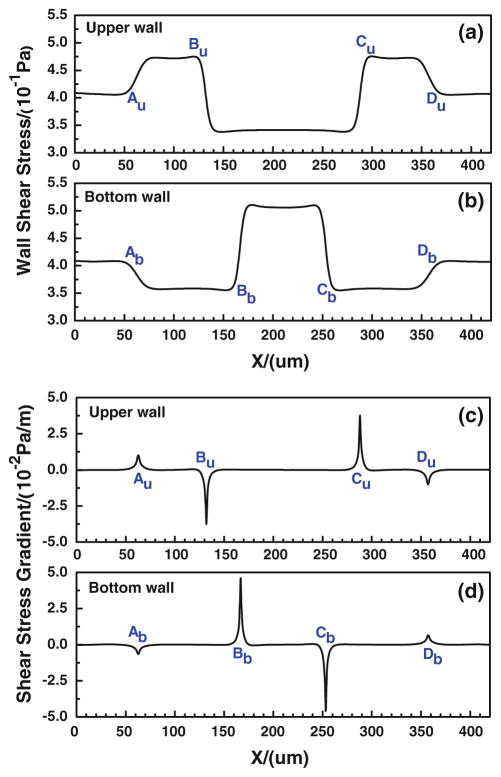
In our modified adhesive dynamics models, the wall shear stress/gradient are the stimuli for changing the bond association/dissociation rates; therefore, it is crucial to quantify the wall shear stress distribution. Figure 4a, b show the wall shear stress distribution along both the upper and bottom vessel walls, and Fig. 4c, d illustrate the corresponding wall shear stress gradient distributions. There are jumps (sudden increase) and drops (sudden decrease) in the wall shear stress/gradient at the conjunctions of the curved parts. Compared to the shear stress in the straight wall of curved vessel, the wall shear stress jumps occur at [Au, Bu] and [Cu, Du] while the drop occurs between Bu and Cu along the upper wall; along the bottom wall, the jump occurs between Bb and Cb while the drops happen at [Ab, Bb] and [Cb, Db]. As to the wall shear stress gradient, the transient jumps occur at Au and Cu while the transient drops occur at Bu and Du along the upper wall, and the transient jumps occur at Bb and Db while the transient drops occur at Ab and Cb along the bottom wall. The transient jump of the wall shear stress gradient is much higher at Cu of upper wall and at Bb of bottom wall, which are the preferred locations of tumor cell adhesion observed in our in vivo experiments (see locations 1 and 2 in Fig. 2a. If the modified adhesive dynamics models are capable of describing the effect of the wall shear stress, the calculated tumor cell adhesion would most likely occur at these two locations.
Fig. 4.
Wall shear stresses (a, b) and their gradients (c, d) at the upper and bottom walls of a curved microvessel
3.2.1 Modified adhesive dynamics model: case 1
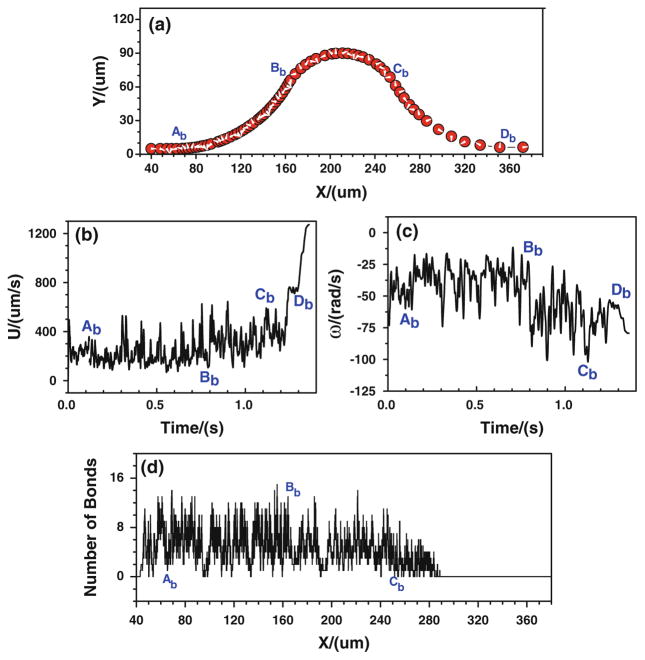
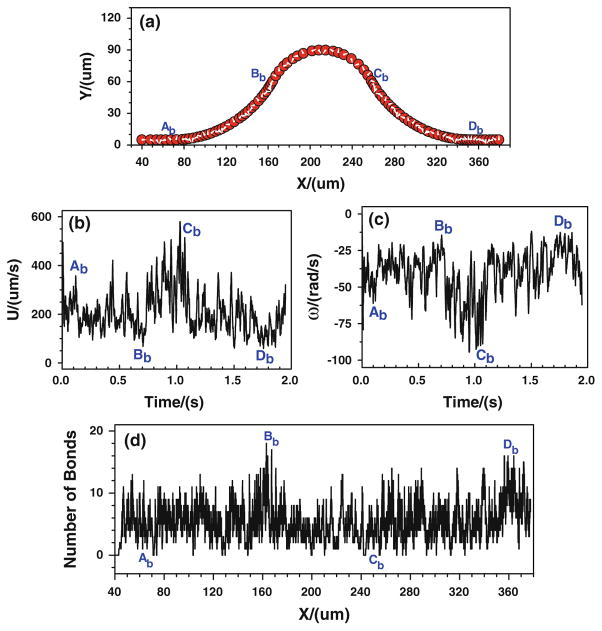
First of all, the tumor cell adhesion with the modified adhesive dynamics model under the assumptions of case 1 is carried out by the LBM. Since the curvature would affect the trajectory of the cell, to assure the cell would roll over the conjunctions, the cell is released near either the upper or the bottom wall at the entrance. Figure 5 shows the history of tumor cell adhesion and migration when the cell is released near the bottom wall. Figure 5a shows the cell trajectory with constant time step. The denser trajectory occurs between Ab and Bb due to the centrifugal effect (Yan et al. 2010); and the coarser trajectory happens between Cb and Db, indicating a faster cell motion there due to the decrease in kf and increase in kr, both of which result from the drop of wall shear stress there. From Fig. 5a, it can be found that the cell not only translates but also rotates. The rotation angle is about 20π clockwise in the entire journey. The corresponding cell velocity and angular velocity are illustrated in Fig. 5b, c, respectively. The cell speed fluctuates between 50 and 750 μm/s from t = 0 to 1.3 s, and it suddenly increases from 750 to more than 1,200 μm/s when the cell passes Db and enters into the straight part of the curved vessel. The angular velocity of the cell mostly vibrates between −75 and −10 rad/s, and it fluctuates more strongly in the positive curvature vessel between Bb and Cb, which varies between −105 and −25 rad/s. Figure 5d shows the history of bonds number at each location. The higher number of bonds means the larger opportunity of the cell arrest at the vessel wall. From Ab to Bb, the number of bonds fluctuates between 0 and 14, and the number of bonds becomes lower at [Bb, Cb], where the bond number fluctuates between 0 and 8, although there is an increase in kf and an decrease in kr that resulted from the jump of shear stress, indicating that not only the shear stress but also the curvature would play a role in cell adhesion in this positive curvature vessel segment. From x ≈ 288.0 μm, the number of bonds stays zero, suggesting that there is no cell adhesion at all and the cell moves freely in the curved vessel.
Fig. 5.
Case 1: the history of the tumor cell released near the bottom wall. a trajectory, b velocity, c angular velocity, and d number of bonds
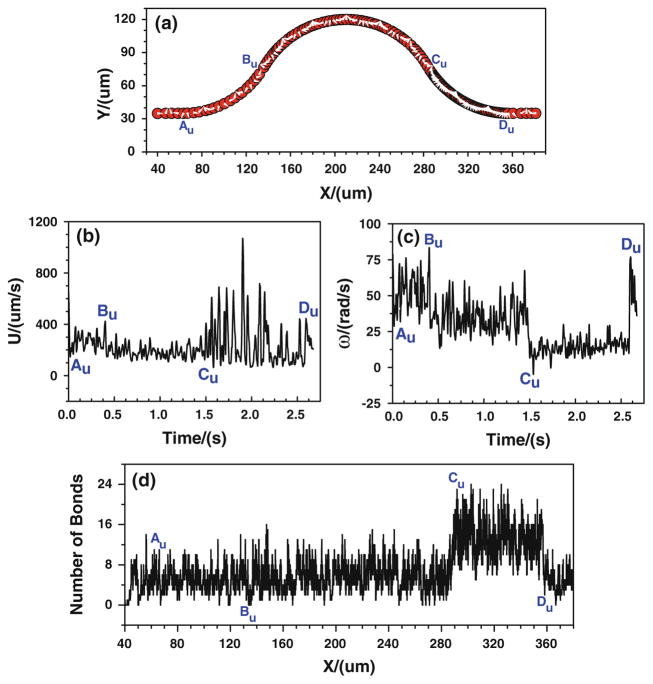
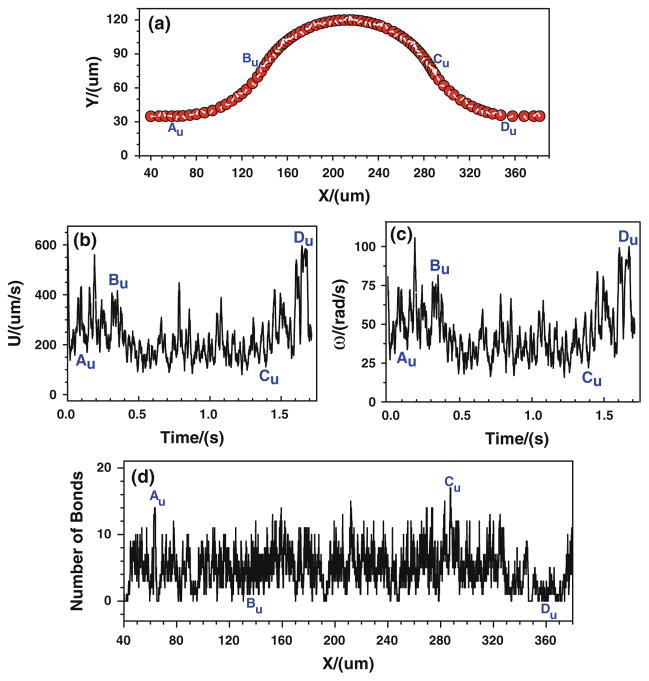
When the tumor cell is released near the upper wall, the cell trajectory is shown in Fig. 6a. It can be found that the denser trajectory occurs between Cu and Du, indicating that there is a stronger cell adhesion in the positive curvature where the local wall shear stress significantly increase. This can further be proved by the number of bonds that is displayed in Fig. 6d. The number of bonds between Cu and Du increases rapidly, and it fluctuates between 6 and 24, much larger than that of other locations where the bonds number only oscillates between 0 and 16. Figures 5, 6 indicate that under the assumptions of case 1 that the bond association/dissociation rates continuously change with the wall shear stress, the most likely locations for tumor cell adhesion are between Cu and Du, where the wall shear stress is higher. However, the shear stress effect on tumor cell adhesion is not as significant as seen in the experiments in the positive curvature between Bb and Cb.
Fig. 6.
Case 1: the history of the tumor cell released near the upper wall. a trajectory, b velocity, c angular velocity, and d number of bonds
3.2.2 Modified adhesive dynamics model: case 2
Now, the tumor cell adhesion with the modified adhesive dynamics model under the assumptions of case 2 is implemented. Figure 7 shows the history of tumor cell motion when the cell is released near the bottom wall. From the cell trajectory in Fig. 7a, the denser trajectory occurs near the conjunction Bb (x ≈ 163.0 μm), indicating a slower cell motion there due to the stronger adhesive effect caused by the large jump in the wall shear stress gradient at Bb. Another denser trajectory happens near the conjunction Cb(x ≈ 256.0 μm) where the shear stress gradient has a sudden drop. This slower cell motion is not due to the adhesive effect but due to the centrifugal effect (Yan et al. 2010). The coarser trajectory exists in the positive curvature vessel (between Bb and Cb), indicating a faster cell motion due to the centrifugal effect. The corresponding velocity history can be found in Fig. 7b. As shown in Fig. 7c, the variation of angular velocity is very similar to that of velocity. It fluctuates between −20 and −90 rad/s with an average value of about −40 rad/s, and it is larger in the positive curvature vessel than that at other locations. During the journey, the cell rotates more than 25 π as shown in Fig. 7a. The history of bonds number at each location is shown in Fig. 7d. The maximum number of the bonds occurs near the conjunction Bb(x ≈ 163.0 μm), although it is not distinctively higher than that at other locations.
Fig. 7.
Case 2: the history of the tumor cell released near the bottom wall. a trajectory, b velocity, c angular velocity, and (d) number of bonds
When the tumor cell is released near the upper wall, as shown in Fig. 8d, the number of bonds near the conjunction Cu also increases but the increase is not as high as that near Bb, because the jump in the wall shear stress gradient near Cu is less than that near Bb (Fig. 4c, d). Figures 7, 8 indicate that under the assumptions in case 2 that the association/dissociation rates of receptor–ligand binding continuously change with the wall shear stress gradient, the most likely locations for tumor cell adhesion are near Bb and Cu where the jumps in the wall shear stress gradient occur, although this effect is not as significant as seen in the experiments.
Fig. 8.
Case 2: the history of the tumor cell released near the upper wall. a trajectory, b velocity, c angular velocity, and d number of bonds
3.2.3 Modified adhesive dynamics model: case 3
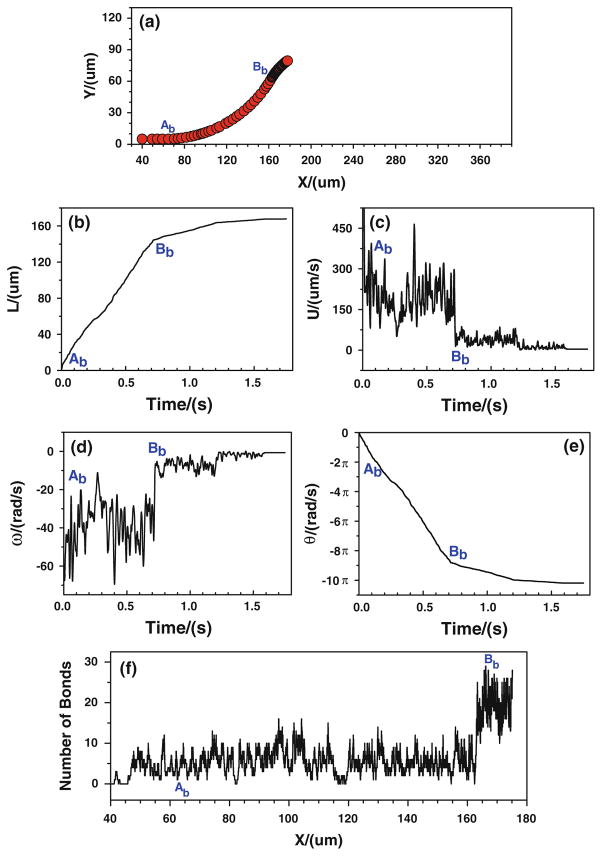
Under real physiological conditions, the association/dissociation rates of binding may not alter instantaneously with the variation of wall shear stress gradient. More likely the wall shear stress gradient jump or drop, over certain threshold, is a stimulus for triggering the change in the association/dissociation rates of binding. Once triggered, these rates will stay the same values until the next jump or drop occurs. Under the assumptions of case 3, the effect of local shear stress gradient on tumor cell adhesion is predicted. Figure 9 shows the cell trajectory, velocities, and number of bonds when the tumor cell is released near the bottom wall. When the cell approaches to the conjunction Bb (x ≈ 166.7 μm), the cell moves slower and slower, representing by a black band in the cell trajectory (Fig. 9a), a flat plateau in displacement (Fig. 9b), and a low and weak oscillation in the velocity (Fig. 9c) which eventually goes to zero. The rotational velocity experiences the similar process. When approaching to Bb, the cell rolls slower and slower and eventually it stops, as shown in Fig. 9d, e. Due to the change in the bond association and dissociation rates, the number of bond increases significantly near Bb (Fig. 9f).
Fig. 9.
Case 3: the history of the tumor cell released near the bottom wall. a trajectory, b displacement, c velocity, d angular velocity, e angle, and f number of bonds
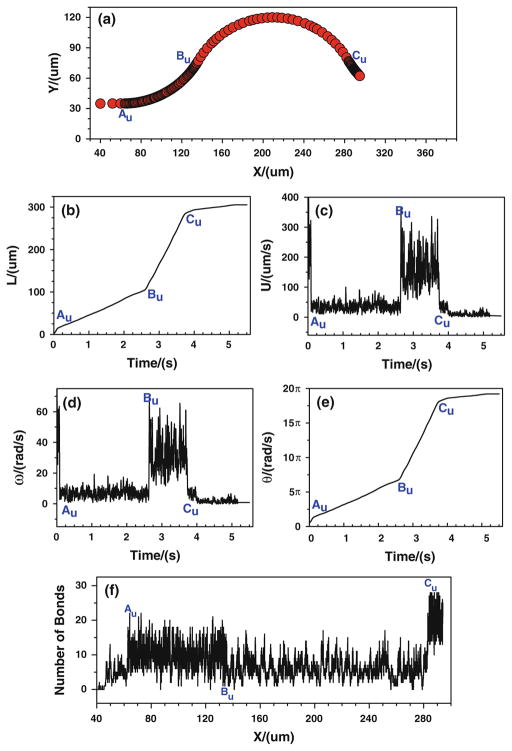
When the tumor cell is released near the upper wall, more bonds are formed from the conjunction Au to Bu, and the number of bonds decreases from Bu to Cu (Fig. 10f). Consequently, the cell moves/rolls slower from Au to Bu, and then moves/rolls faster from Bu to Cu, as illustrated in (Fig. 10a–e). When the cell is approaching to Cu, the number of bonds increases suddenly, and consequently the cell slows down and eventually stops, indicating that the strong tumor cell adhesion occurs near Cu. Figures 9, 10 suggest that under the assumptions in case 3 that the bond association/dissociation rates vary with the jumps or drops of wall shear stress gradient, the firm adhesion of tumor cell occurs at positive curvature in both the upper and bottom vessel walls, which is in good agreement with the in vivo experimental observation (see locations 1, 2 in Fig. 2a).
Fig. 10.
Case 3: the history of the tumor cell released near the upper wall. a trajectory, b displacement, c velocity, d angular velocity, e angle, and f number of bonds
4 Discussion
We have presented the tumor cell adhesion with two modified adhesive dynamics models under the assumptions of three different cases. In case 1, the bond reaction rates are assumed to continuously vary with the wall shear stress. When the tumor cell is released near the bottom wall, the larger adhesion probabilities take place between the conjunctions Ab and Bb at the outer side of vessel with a curved angle θ = 60 degree, which agree unanimously with the experimental results in Fig. 2c that tumor cell adhesion prefer to occur at the outer side when the curved angle is about 60 degree. When the tumor cell is released near the upper wall, the most likely locations for cell adhesion is found between Cu and Du at the inner side of curved vessel, owing to the significant increase of wall shear stress there. This result approximates the observation in Fig. 2a (location 2), as well as that in Fig. 2c when θ is about 70 degree.
Under the assumptions in case 2 that the bond association/dissociation rates continuously change with the wall shear stress gradient, the larger adhesion probabilities are found near Bb and Cu where the jumps of wall shear stress gradient occur; nevertheless, this influence is quite weak, indicating that the effect of transient shear stress gradient on tumor cell adhesion can be neglected unless the wall shear stress gradient is over a critical value in the curved vessels. The tendencies of simulation results in this case are similar to the in vivo observations at locations 1 and 2 in Fig. 2a.
As far as case 3 is concerned, the association/dissociation rates of receptor–ligand binding alter with the jumps or drops of wall shear stress gradient. In this case, the tumor cell is found to be firmly arrested by the vessel wall at the inner side of curved vessels when the tumor cell is released from both the bottom and upper walls. When the tumor cell is released near bottom wall, the tumor cell finally stops in the middle zones of [Bb, Cb], which are the most typical adhesion locations that seen in the experiments when the curved angle of vessel is around 120 degree. When the tumor cell is released near upper wall, the tumor cell is eventually caught by the curved vessel in the middle zones of [Cu, Du]. The predications of tumor cell adhesion along bottom and upper walls under the assumptions of case 3 are identical to the experimental observations in Fig. 2a, in which the firm adhesion occurred at locations 1 and 2. It is realized that only the firm adhesion of tumor cells can effectively contribute to cancer metastasis in the microcirculation.
In all three simulation cases corresponding to the in vivo single vessel tumor cell perfusion experiments, we have demonstrated that tumor cells adhere more easily in the curved vessel than in the straight vessel, which is in agreement with the experimental observations summarized in Fig. 2. Overall, the present revised models are capable of simulating the tumor cell adhesion phenomena in the curved microvessel by activating or inactivating cell adhesion molecules that located at the surfaces of tumor cells and endothelial cells to form receptor–ligand bonds, whose association/disassociation rates would be enhanced or weakened by the shear stresses/gradients along the vessel walls. However, to simplify the conditions, we neither considered the contribution from the circulating blood cells in the simulation nor in the experiment. We will incorporate the effect of circulating blood cells on tumor cell adhesion in the future study. Furthermore, the parameters at the molecular levels (nano-scale) used in the simulation were from the literature for available cell types, which are not the same tumor cell (micro-scale) in our in vivo experiments. We will use the parameters for the same tumor cell when they are available. The asymmetric feature of the microvessel is another factor that will be incorporated in the future 3D model.
5 Conclusions
The effect of the local wall shear stress/gradient on tumor cell adhesion in the curved microvessel has been numerically studied by the LBM. A modified adhesive dynamics model was proposed to take into the consideration of the wall shear stress/gradient in the receptor–ligand binding. Both cases when the tumor cell is released near the bottom wall and near the upper wall in a curved microvessel have been investigated. Combined with the observations from the in vivo tumor cell adhesion experiments that satisfied the simulation conditions (e.g., negligible cell-cell interaction between tumor cells due to a controlled tumor cell perfusion rate of about one cell per second in the vessel), the simulation results lead to the following conclusions:
The tumor cell adhesion requires a critical wall shear stress/gradient in the curved microvessel. Once the wall shear stress/gradient is superior to the critical value, it would trigger the bond association/dissociation rates to change; otherwise, the effect of wall shear stress/gradient on tumor cell adhesion can be neglected.
The present revised models are capable of simulating the tumor cell adhesion phenomenon in the curved microvessel. From a physiological point of view, it can be deemed that the binding affinity of cell adhesion molecules would be enhanced or weakened by the variation of wall shear stress. If the wall shear stress/gradient is positive and reaches a threshold, the endothelial cells lining the vessel wall and tumor cells would be activated to form more adhesive bonds. On the contrary, they would be inactivated by the negative wall shear stress/gradient to weaken the capability of bond formation or accelerate the breakage of the previously formed bonds.
Acknowledgments
Supports given by the Research Grants Council of the Government of the HKSAR under Grant No. PolyU 5238/08E, the Hong Kong Polytechnic University through a scholarship to WWY, CBET 0754158 from the National Science Foundation and 1SC1CA153325-01 from the National Institutes of Health of the U.S.A are gratefully acknowledged.
Contributor Information
W. W. Yan, Department of Mechanical Engineering, The Hong Kong Polytechnic University, Kowloon, Hong Kong
B. Cai, Department of Biomedical Engineering, The City College of the City University of New York, New York, NY, USA
Y. Liu, Email: mmyliu@polyu.edu.hk, Department of Mechanical Engineering, The Hong Kong Polytechnic University, Kowloon, Hong Kong
B. M. Fu, Department of Biomedical Engineering, The City College of the City University of New York, New York, NY, USA
References
- Alon R, Hammer DA, Springer TA. Lifetime of the P-selectin Carbohydrate bond and its response to tensile force in hydrodynamic flow. Nature. 1995;374:539–542. doi: 10.1038/374539a0. [DOI] [PubMed] [Google Scholar]
- Bell GI. Models for the specific adhesion of cells to cells. Science. 1978;200:618–627. doi: 10.1126/science.347575. [DOI] [PubMed] [Google Scholar]
- Bongrand P, Bell GI. Cell-cell adhesion: parameters and possible mechanisms. In: Perelson A, DeLisi C, Wiegel FW, editors. Cell surface dynamics: concepts andmodels. Marcel Dekker; NewYork: 1984. [Google Scholar]
- Caputo KE, Hammer DA. Effect of microvillus deformability on leukocyte adhesion explored using adhesive dynamics simulations. Biophys J. 2005;89:187–200. doi: 10.1529/biophysj.104.054171. [DOI] [PMC free article] [PubMed] [Google Scholar]
- Chang KC, Hammer DA. Influence of direction and type of applied force on the detachment of macromolecularly-bound particles from surfaces. Langmuir. 1996;12:2271–2282. [Google Scholar]
- Chang KC, Tees DFJ, Hammer DA. The state diagram for cell adhesion under flow: leukocyte rolling and firm adhesion. PNAS. 2000;97:11262–11267. doi: 10.1073/pnas.200240897. [DOI] [PMC free article] [PubMed] [Google Scholar]
- Chen S, Doolen GD. Lattice Boltzmann method for fluid flows. Annu Rev Fluid Mech. 1998;30:329–364. [Google Scholar]
- Dong C, Cao J, Struble EJ, Lipowksy HH. Mechanics of leukocyte deformation and adhesion to endothelium in shear flow. Ann Biomed Eng. 1999;27:298–312. doi: 10.1114/1.143. [DOI] [PubMed] [Google Scholar]
- Dong C, Slattery M, Liang SL. Micromechanics of tumor cell adhesion and migration under dynamic flow conditions. Frontiers Biosci. 2005;10:379–384. doi: 10.2741/1535. [DOI] [PMC free article] [PubMed] [Google Scholar]
- Fu BM, Shen S. Acute VEGF effect on solute permeability of mammalian microvessels in vivo. Microvasc Res. 2004;68:51–62. doi: 10.1016/j.mvr.2004.03.004. [DOI] [PubMed] [Google Scholar]
- Haier J, Nicolson GL. Tumor cell adhesion under hydrodynamic conditions of fluid flow. APMIS. 2001;109:241–262. doi: 10.1034/j.1600-0463.2001.d01-118.x. [DOI] [PubMed] [Google Scholar]
- Hammer DA, Apte SM. Simulation of cell rolling and adhesion on surfaces in shear flow: general results and analysis of selectin-mediated neutrophil adhesion. Biophys J. 1992;63:35–57. doi: 10.1016/S0006-3495(92)81577-1. [DOI] [PMC free article] [PubMed] [Google Scholar]
- Ladd ACJ. Numerical simulation of particulate suspensions via a discretized Boltzmann equation. J Fluid Mech. 1994;271:285–309. [Google Scholar]
- Liu Q, Mirc D, Fu BM. Mechanical mechanisms of thrombosis in intact bent microvessels of rat mesentery. J Biomech. 2008;41:2726–2734. doi: 10.1016/j.jbiomech.2008.06.013. [DOI] [PubMed] [Google Scholar]
- Lomakina EB, Waugh RE. Micromechanical tests of adhesion dynamics between neutrophils and immobilized iCAM-1. Biophys J. 2004;86:1223–1233. doi: 10.1016/S0006-3495(04)74196-X. [DOI] [PMC free article] [PubMed] [Google Scholar]
- Migliorini C, Qian YH, Chen HD, Brown EB, Jain RK, Munn LL. Red blood cells augment leukocyte rolling in a virtual blood vessel. Biophys J. 2002;83:1834–1841. doi: 10.1016/S0006-3495(02)73948-9. [DOI] [PMC free article] [PubMed] [Google Scholar]
- Munn LL, Melder RJ, Jain RK. Role of erythrocytes in leukocyte-endothelial interactions: mathematical model and experimental validation. Biophys J. 1996;71:466–478. doi: 10.1016/S0006-3495(96)79248-2. [DOI] [PMC free article] [PubMed] [Google Scholar]
- Shen S, Fan J, Cai B, Lv Y, Zeng M, Hao Y, Giancotti F, Fu BM. Vascular endothelial growth factor enhances mammary cancer cell adhesion to endothelium in vivo. J Exp Physiol. 2010;95:369–379. doi: 10.1113/expphysiol.2009.050260. [DOI] [PMC free article] [PubMed] [Google Scholar]
- Skalak R, Chien S. Handbook of bioengineering. McGraw-Hill; New York: 1987. [Google Scholar]
- Sun CH, Migliorini C, Munn LL. Red blood cells initiate leukocyte rolling in postcapillary expansions: a lattice Boltzmann analysis. Biophys J. 2003;85:208–222. doi: 10.1016/S0006-3495(03)74467-1. [DOI] [PMC free article] [PubMed] [Google Scholar]
- Weiss L. Biomechanical interactions of cancer-cells with the microvasculature during hematogenous metastasis. Cancer Metastasis Rev. 1992;11:227–235. doi: 10.1007/BF01307179. [DOI] [PubMed] [Google Scholar]
- Yan WW, Liu Y, Fu BM. Effects of curvature and cell-cell interaction on cell adhesion in microvessels. Biomech Model Mechanobiol. 2010;9:629–640. doi: 10.1007/s10237-010-0202-1. [DOI] [PubMed] [Google Scholar]
- Zhu C. Kinetics and mechanics of cell adhesion. J Biomech. 2000;33:23–33. doi: 10.1016/s0021-9290(99)00163-3. [DOI] [PubMed] [Google Scholar]
- Zhu C, Bao G, Wang N. Cell mechanics: mechanical response, cell adhesion, and molecular deformation. Annu Rev Biomed Eng. 2000;2:189–226. doi: 10.1146/annurev.bioeng.2.1.189. [DOI] [PubMed] [Google Scholar]


