

Abstract
Background
Population‐based studies have revealed declining acute ischemic stroke (AIS) hospitalization rates in the United States, but no study has assessed recent temporal trends in race/ethnic‐, age‐, and sex‐specific AIS hospitalization rates.
Methods and Results
Temporal trends in hospitalization for AIS from 2000 to 2010 were assessed among adults ≥25 years using the Nationwide Inpatient Sample. Age‐, sex‐, and race/ethnic‐specific and age‐adjusted stroke hospitalization rates were calculated using the weighted number of hospitalizations and US census data. From 2000 to 2010, age‐adjusted stroke hospitalization rates decreased from 250 to 204 per 100 000 (overall rate reduction 18.4%). Age‐specific AIS hospitalization rates decreased for individuals aged 65 to 84 years (846 to 605 per 100 000) and ≥85 years (2077 to 1618 per 100 000), but increased for individuals aged 25 to 44 years (16 to 23 per 100 000) and 45 to 64 years (149 to 156 per 100 000). Blacks had the highest age‐adjusted yearly hospitalization rates, followed by Hispanics and whites (358, 170, and 155 per 100 000 in 2010). Age‐adjusted AIS hospitalization rates increased for blacks but decreased for Hispanics and whites. Age‐adjusted AIS hospitalization rates were lower in women and declined more steeply compared to men (272 to 212 per 100 000 in women versus 298 to 245 per 100 000 in men).
Conclusions
Although overall stroke hospitalizations declined in the United States, the reduction was more pronounced among older individuals, women, Hispanics, and whites. Renewed efforts at targeting risk factor control among vulnerable individuals may be warranted.
Keywords: acute ischemic stroke, hospitalization, nationwide inpatient sample, stroke, trends
Subject Categories: Ischemic Stroke, Cerebrovascular Disease/Stroke, Cardiovascular Disease
Introduction
Studies have shown a recent decline in stroke as a cause of hospitalization and death.1, 2, 3, 4, 5 The declines have not been uniform across the US population; however, and certain subgroups have experienced more profound improvements in incidence and outcomes than others. Racial/ethnic disparities in acute ischemic stroke (AIS) hospitalizations have been well described for specific populations in the United States. Multiple studies in the 1990s and 2000s revealed high black–white disparities, with AIS hospitalization rates 1.5 to 2.5 times higher in blacks.6, 7, 8, 9 The disparity was less pronounced between Hispanics and whites. In the Northern Manhattan population, AIS hospitalization rates for mainly Caribbean Hispanics were 1.7 times higher8 than whites and in a mainly Mexican community in Texas, 1.2 times higher than whites.10 In Florida, on the other hand, AIS hospitalization rates among a heterogeneous Hispanic population of Cubans, Puerto Ricans, Mexicans, and South Americans were 30% lower than whites.9
Numerous studies have shown that men have higher stroke incidence than women in younger and middle‐age groups, but these differences narrow in older age groups and reverse in the elderly.11, 12, 13, 14, 15, 16 Recent studies have suggested declining stroke incidence in both men and women. An analysis of data from the National Hospital Discharge Survey revealed that age‐adjusted stroke hospitalization rates from 1988 to 2004 decreased in both men and women, a decline driven by individuals 65 years and older.17 A separate analysis using data from the Nationwide Inpatient Sample (NIS) revealed that from 1997 to 2006, US stroke hospitalization rates decreased for both men and women aged 35 to 64 years.18
In recent years, stroke incidence and hospitalizations have increased among younger individuals. From 1998 to 2007, US stroke hospitalizations increased among those 25 to 34 years and 35 to 44 years old.5 Similarly, a study in the greater Cincinnati northern Kentucky region revealed that from 1993 to 2005, stroke hospitalization rates increased among both whites and blacks younger than 55 years.19
The aims of this study were to (1) describe the hospitalization rates for AIS in the United States and (2) assess trends in race/ethnic‐, age‐, and sex‐specific rates of hospitalization between 2000 and 2010.
Methods
We analyzed data from the NIS, the largest publicly available all‐payer inpatient care database in the United States. The NIS contains data from ≈8 million de‐identified hospital stays a year and approximates a 20% stratified sample of nonfederal US hospitals.20 The majority (≥97%) of the hospitals in the United States are nonfederal and include government hospitals operated by the city, county, and state, as well as hospitals operated by for‐profit and nonprofit organizations. The database sampling strategy allows for extrapolation from the sample to represent all US hospitalizations nationwide, using sampling weights. The database is maintained by the National Healthcare Cost Utilization Project of the Agency for Healthcare Research and Quality. Detailed information on the design of the NIS is available at www.hcup-us.ahrq.gov. The study qualified for IRB waiver.
Discharge data was obtained from January 1, 2000 and through December 31, 2010. Acute ischemic stroke (AIS) was defined by the International Classification of Diseases, 9th revision primary discharge diagnosis codes for ischemic stroke (433.01, 433.11, 433.21, 433.31, 433.81, 433.91, 434.01, 434.11, 434.91, 436),21 which have a high specificity and positive predictive value for the diagnosis of AIS.22, 23 The total number of AIS admissions for adults ≥25 years of age was estimated using SAS 9.4 PROC SURVEYMEANS by accounting for sampling weight to reflect the overall US population. Age‐, sex‐, and race/ethnic‐specific AIS hospitalization rates were calculated using the weighted number of hospitalizations as the numerator and the US civilian population as the denominator. Yearly rate comparisons across years were standardized with the age distribution of the US population in 2000. For comparison across year and sex, all rates were standardized with the age distribution of the US female population in 2000, while for comparison across year and race, all rates are were standardized with the age distribution of the US white population in 2000. Since the data used are population data, the average rate of change is the average of the percent change from the prior year across all years after 2000.
Results
Overall, the age‐adjusted AIS hospitalization rate in the United States decreased from 250 to 204 per 100 000 from 2000 through 2010 (overall rate reduction 18.4%) (Table 1; Figure 1). The majority of the rate decline occurred from 2000 to 2005 (average rate of change −3.89%/year) and plateaued from 2006 to 2010 (−0.03%/year). The decline in AIS hospitalizations was driven by the ≥65‐year age group. Age‐specific AIS hospitalization rates from 2000 to 2010 decreased for individuals aged 65 to 84 years (846 to 605 per 100 000, −28.5%) and 85 years and over (2077 to 1618 per 100 000, −22.1%), but increased for individuals aged 25 to 44 years (16 to 23 per 100 000, +43.8%) and 45 to 64 years (149 to 156 per 100 000, +4.7%) (Figure 2).
Table 1.
Age‐Adjusted Acute Ischemic Stroke Hospitalization Rates Per 100 000
| 2000 | 2001 | 2002 | 2003 | 2004 | 2005 | 2006 | 2007 | 2008 | 2009 | 2010 | |
|---|---|---|---|---|---|---|---|---|---|---|---|
| Overall | 250 | 245 | 235 | 224 | 214 | 205 | 202 | 196 | 206 | 197 | 204 |
| Age categories, y | |||||||||||
| 25 to 44 | 16 | 16 | 17 | 19 | 19 | 19 | 20 | 20 | 22 | 21 | 23 |
| 45 to 64 | 149 | 145 | 147 | 144 | 142 | 134 | 140 | 138 | 149 | 142 | 156 |
| 65 to 84 | 846 | 827 | 784 | 734 | 696 | 655 | 635 | 606 | 632 | 599 | 605 |
| 85 and over | 2077 | 2081 | 1959 | 1846 | 1727 | 1775 | 1687 | 1631 | 1688 | 1601 | 1618 |
| Race | |||||||||||
| Hispanic | 217 | 211 | 215 | 232 | 185 | 181 | 189 | 159 | 158 | 176 | 170 |
| White | 177 | 165 | 148 | 141 | 135 | 137 | 129 | 121 | 147 | 146 | 155 |
| Black | 315 | 297 | 315 | 310 | 303 | 218 | 260 | 258 | 280 | 272 | 358 |
| Sex | |||||||||||
| Male | 298 | 294 | 281 | 267 | 254 | 247 | 243 | 234 | 246 | 238 | 245 |
| Female | 272 | 265 | 255 | 240 | 228 | 219 | 214 | 208 | 219 | 207 | 212 |
Figure 1.
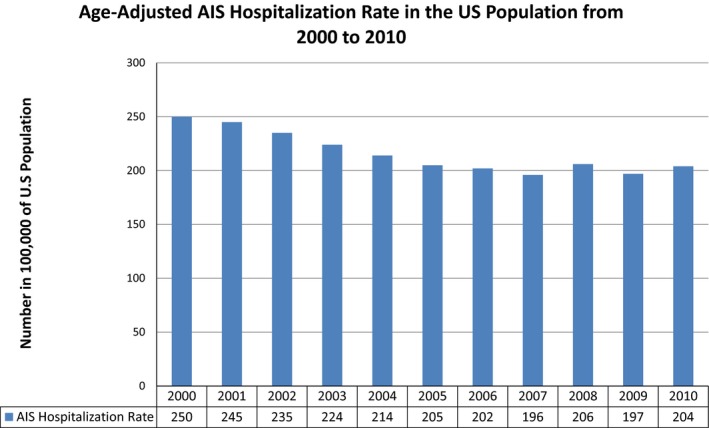
Age‐adjusted acute ischemic stroke (AIS) hospitalization rates per 100 000 in the United States from 2000 to 2010.
Figure 2.
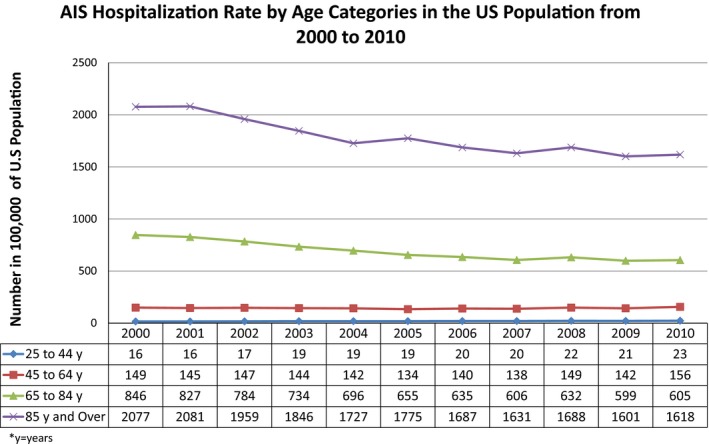
Acute ischemic stroke (AIS) hospitalization rates by age category per 100 000 in the United States from 2000 to 2010.
Blacks had the highest age‐adjusted yearly hospitalization rates, followed by Hispanics and whites (358, 170, and 155 per 100 000 in 2010). From 2000 to 2010, age‐adjusted AIS hospitalization rates decreased for both Hispanics (−21.7%) and whites (−12.4%), but increased for blacks (+13.7%). The increase in blacks was driven by a sharp rise in rates in the latter half of the decade (−6.31%/year from 2000 to 2005, +11.16%/year from 2006 to 2010). Hospitalization rates also increased for whites from 2006 to 2010 (+2.99%/year). The difference in AIS rates between Hispanics and whites decreased 13% from 2000 to 2010 (1.23 times greater in 2000 versus 1.10 in 2010), but increased 30% between blacks and whites (1.78 times greater in 2000 versus 2.31 in 2010) (Figure 3).
Figure 3.
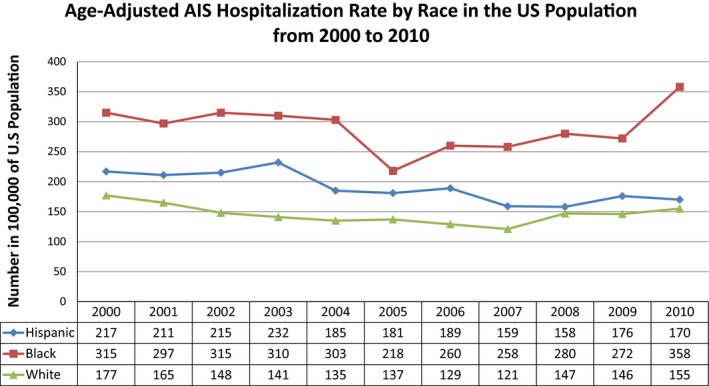
Race‐specific age‐adjusted acute ischemic stroke (AIS) hospitalization rates per 100 000 in the United States from 2000 to 2010.
Age‐adjusted AIS hospitalization rates were lower in women, and had a greater rate of decrease from 2000 to 2010 compared to men (272 to 212 per 100 000, −22.1% in women versus 298 to 245 per 100 000, −17.8% in men) (Figure 4).
Figure 4.
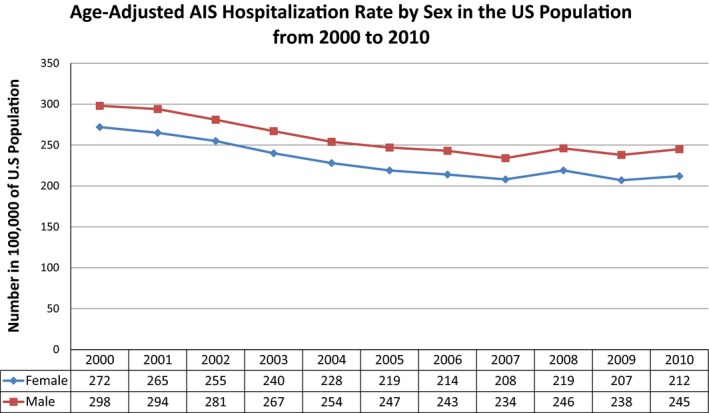
Sex‐specific age‐adjusted acute ischemic stroke (AIS) hospitalization rates per 100 000 in the United States from 2000 to 2010.
Charlson Index Comorbidity scores for patients admitted with AIS increased from 2000 to 2010 (0 to <1: 53.6% to 51.2%; ≥3: 16.7% to 22.5%) while in hospital deaths decreased (7.0% to 5.2%) (Table 2).
Table 2.
Sociodemographic and Clinical Characteristics of Hospitalized Patients in the United States With AIS From 2000 to 2010
| 2000 | 2001 | 2002 | 2003 | 2004 | 2005 | 2006 | 2007 | 2008 | 2009 | 2010 | |
|---|---|---|---|---|---|---|---|---|---|---|---|
| Age, y | |||||||||||
| 25 to 44 | 3.05% | 3.05% | 3.29% | 3.69% | 3.76% | 3.92% | 4.11% | 4.12% | 4.1% | 4.05% | 4.16% |
| 45 to 64 | 20.42% | 20.61% | 22.12% | 23.15% | 24.32% | 24.14% | 25.67% | 26.36% | 26.91% | 27.05% | 28.57% |
| 65 to 84 | 57.12% | 56.53% | 55.24% | 53.88% | 53.02% | 51.47% | 50.13% | 49.19% | 48.81% | 48.57% | 47.25% |
| Over 85 | 19.41% | 19.81% | 19.35% | 19.28% | 18.89% | 20.48% | 20.08% | 20.34% | 20.18% | 20.33% | 20.02% |
| Charlson Index | |||||||||||
| ≥0 and <1 | 53.58% | 54.44% | 54.01% | 54.82% | 54.64% | 54.04% | 54.44% | 54.44% | 52.1% | 52.04% | 51.17% |
| ≥1 and <2 | 29.71% | 29.1% | 28.7% | 28.14% | 27.86% | 27.5% | 26.23% | 25.81% | 26.76% | 25.96% | 26.36% |
| ≥3 | 16.71% | 16.46% | 17.29% | 17.04% | 17.49% | 18.45% | 19.33% | 19.75% | 21.14% | 22.01% | 22.47% |
| Discharge status | |||||||||||
| AMA | 0.35% | 0.4% | 0.43% | 0.51% | 0.53% | 0.61% | 0.66% | 0.64% | 0.65% | 0.64% | 0.68% |
| Died in hospital | 6.98% | 7% | 6.71% | 6.46% | 6.22% | 5.97% | 5.83% | 5.43% | 5.67% | 5.14% | 5.21% |
| Discharged alive, destination unknown | 0.1% | 0.11% | 0.15% | 0.1% | 0.14% | 0.1% | 0.15% | 0.13% | 0.15% | 0.12% | |
| Home health care | 9.29% | 9.67% | 9.83% | 10.36% | 11.61% | 11.33% | 11.87% | 12.16% | 12.5% | 12.37% | 12.77% |
| Other including: SNF, intermediate care, another type of facility | 43.73% | 43.85% | 43.73% | 42.42% | 44.34% | 44.25% | 43.03% | 43.01% | 42.3% | 42.58% | 42.67% |
| Routine | 36.3% | 35.65% | 36.33% | 37.4% | 34.58% | 34.97% | 35.26% | 35.22% | 35.04% | 36% | 35.38% |
| Short‐term hospital | 3.35% | 3.33% | 2.85% | 2.69% | 2.62% | 2.72% | 3.27% | 3.39% | 3.71% | 3.13% | 3.17% |
| Sex | |||||||||||
| Female | 56.62% | 56.18% | 56.07% | 55.42% | 54.89% | 54.64% | 53.96% | 54% | 53.77% | 52.9% | 52.42% |
| Male | 43.38% | 43.82% | 43.93% | 44.58% | 45.11% | 45.36% | 46.04% | 46% | 46.23% | 47.1% | 47.58% |
| Hospital bed size | |||||||||||
| Large | 59.87% | 61.21% | 61.81% | 62.33% | 63.25% | 63.62% | 61.41% | 62.25% | 65.72% | 64.49% | 66.87% |
| Medium | 28.2% | 27% | 25.49% | 26.01% | 25.33% | 25.01% | 24.65% | 25.71% | 23.22% | 24.68% | 21.7% |
| Small | 11.93% | 11.79% | 12.7% | 11.67% | 11.41% | 11.37% | 13.94% | 12.04% | 11.05% | 10.83% | 11.44% |
| Hospital region | |||||||||||
| Midwest | 22.65% | 23.35% | 23.08% | 23.23% | 24.52% | 23.83% | 23.82% | 24.08% | 22.74% | 22.59% | 21.86% |
| Northeast | 19.2% | 18.23% | 19.24% | 18.78% | 17.26% | 18.01% | 18.33% | 17.3% | 17.93% | 18.43% | 18.22% |
| South | 40.6% | 41.35% | 40.14% | 41.09% | 41.92% | 40.8% | 39.92% | 40.49% | 42.46% | 40.7% | 41.34% |
| West | 17.56% | 17.07% | 17.54% | 16.9% | 16.31% | 17.37% | 17.94% | 18.12% | 16.88% | 18.29% | 18.58% |
| Length of stay, days | 6.2±0.09 | 6.05±0.07 | 5.92±0.07 | 5.84±0.06 | 5.67±0.05 | 5.59±0.06 | 5.61±0.06 | 5.48±0.06 | 5.41±0.06 | 5.22±0.06 | 5.27±0.07 |
| Payment types | |||||||||||
| Medicaid | 4.95% | 5.09% | 5.22% | 5.66% | 5.78% | 5.68% | 6.04% | 6.11% | 6.32% | 6.64% | 7.49% |
| Medicare | 72.18% | 71.52% | 71.23% | 71.28% | 68.97% | 70.12% | 68.32% | 66.69% | 65.44% | 65.54% | 64.3% |
| No charge | 0.22% | 0.17% | 0.2% | 0.3% | 0.33% | 0.46% | 0.39% | 0.49% | 0.45% | 0.46% | 0.51% |
| Other pay | 1.55% | 1.63% | 1.73% | 1.78% | 1.98% | 1.58% | 2.26% | 2.21% | 2.29% | 2.19% | 2.35% |
| Private including HMO | 18.48% | 18.9% | 18.66% | 17.96% | 19.13% | 18.35% | 18.98% | 20.13% | 21.13% | 20.36% | 20.15% |
| Self pay | 2.63% | 2.69% | 2.96% | 3.03% | 3.81% | 3.82% | 4.01% | 4.38% | 4.37% | 4.81% | 5.21% |
| Race | |||||||||||
| Asian/Pacific | 2.28% | 2.28% | 2.63% | 2.8% | 2.43% | 2.11% | 2.41% | 2.66% | 2.63% | 2.79% | 2.48% |
| Black | 13.71% | 13.87% | 16.01% | 16.4% | 17.07% | 13.07% | 15.82% | 16.68% | 15.53% | 15.18% | 18.73% |
| Hispanic | 5.73% | 6.14% | 6.87% | 7.92% | 7.08% | 7.52% | 8.06% | 7.62% | 6.49% | 7.48% | 7.02% |
| Native American | 0.22% | 0.37% | 0.21% | 0.16% | 0.33% | 0.29% | 0.56% | 0.64% | 0.53% | 0.52% | 0.63% |
| Other race | 1.83% | 1.75% | 1.99% | 2.33% | 1.98% | 2.03% | 2.19% | 2.4% | 3.04% | 3.08% | 2.13% |
| White | 76.23% | 75.59% | 72.29% | 70.39% | 71.1% | 74.97% | 70.96% | 69.99% | 71.77% | 70.96% | 69.01% |
| Rural/Urban | |||||||||||
| Rural | 19.24% | 19.31% | 18.17% | 18.55% | 16.41% | 16.51% | 15.41% | 15.17% | 14% | 13.01% | 13.07% |
| Urban | 80.76% | 80.69% | 81.83% | 81.45% | 83.59% | 83.49% | 84.59% | 84.83% | 86% | 86.99% | 86.93% |
| Teaching/nonteaching | |||||||||||
| Nonteaching | 64.14% | 63.8% | 62.34% | 62% | 62.02% | 65.17% | 56.33% | 58.03% | 57.05% | 56.12% | 52.41% |
| Teaching | 35.86% | 36.2% | 37.66% | 38% | 37.98% | 34.83% | 43.67% | 41.97% | 42.95% | 43.88% | 47.59% |
AIS indicates acute ischemic stroke; AMA, against medical advice; HMO, Health Maintenance Organization; SNF, skilled nursing facility.
Discussion
In this national sample, age‐adjusted AIS hospitalization rates in the United States decreased 18.4% from 2000 to 2010, with the majority of the decline occurring in the first 5 years. Age‐specific AIS hospitalization rates increased among individuals younger than 65 years, while decreasing among those older than 65 years. Blacks had the highest age‐adjusted yearly hospitalization rates, followed by Hispanics and whites. From 2000 to 2010, age‐adjusted AIS hospitalization rates decreased in Hispanics and whites, but increased for blacks. Age‐adjusted AIS hospitalization rates were lower in women than men throughout the time period and women experienced a greater rate of decline than men from 2000 to 2010. Comorbidity Scores in patients hospitalized from AIS increased from 2000 to 2010 while in‐hospital deaths decreased.
The decline in AIS hospitalization from 2000 to 2010 followed a similar decline noted from 1997 to 2004 in Fang et al's analysis of stroke hospitalizations using the National Hospital Discharge Survey17 and from 1998 to 2007 in Lee et al's analysis using data from the National Inpatient Sample.5 Our analysis uniquely demonstrated a plateau in the latter half of the decade.
Our findings should be interpreted with caution, since changes in stroke hospitalization rates are affected not only by true changes in incidence, but also stroke literacy and health beliefs (influencing likelihood of seeking medical attention), prehospital recognition and triage of patients with stroke symptoms, and hospital protocols/healthcare provider literacy (affecting the likelihood of hospitalizing individuals with stroke symptoms). In addition, the new imaging‐based definition of transient ischemic attack24 and more widespread use of magnetic resonance imaging may also affect the proportion of individuals coded as transient ischemic attack versus AIS.
Nevertheless, the decline in stroke hospitalization rates could reflect reduced incidence, possibly due to cardiovascular prevention efforts, which have led to improved blood pressure and cholesterol treatment and control.25, 26, 27, 28 The decline in in‐hospital deaths despite increased Comorbidity Scores may reflect improved acute hospital care. The plateau from 2005 to 2010 could reflect either a threshold beyond which our current prevention efforts are no longer having an effect versus the various factors aforementioned.
Our findings are consistent with prior studies demonstrating higher AIS hospitalizations in blacks and Hispanics compared to whites.6, 8, 9, 10, 29 AIS hospitalization rates were greatest in blacks throughout the decade, and in 2010 were more than double the hospitalization rates of both whites and Hispanics. We have uniquely shown that over the study period, blacks exhibited increasing AIS hospitalization rates, driven by the rising rates in the latter half of the decade. Whites and Hispanics exhibited declines in AIS hospitalization rates; however, rates for whites slowly rose in the latter half of the decade as well. Differences in AIS hospitalization rates lessened between Hispanics and whites from 2000 to 2010 and increased between blacks and whites between 2000 and 2010.
Prior studies have shown disparities in stroke rates in mostly biracial populations comparing blacks to whites or Hispanics to whites; however, few studies have compared stroke hospitalization rates in multiracial populations. AIS rates were 2‐fold greater in young black versus white women and men in Baltimore County,29 higher in blacks compared to whites in the Greater Cincinnati/Northern Kentucky Stroke Study,6 and higher in Mexican Americans compared to non‐Hispanic whites in the Brain Attack Surveillance in Corpus Christi Project.10 Data from the Northern Manhattan Stroke Study showed that the annual incidence of first AIS from 1993 to 1997 was greatest in blacks, followed by Hispanics (mainly of Caribbean origin) and whites.8 The age‐adjusted AIS hospitalization rates in Florida for individuals aged 25 to 49 years was greatest in blacks, followed by whites, then Hispanics (mainly Cuban, Puerto Rican, Mexican, and South Americans in origin) regardless of sex.9
With regard to sex‐specific AIS hospitalization rates, our findings of a lower age‐adjusted AIS hospitalization rates in women compared to men in the United States is consistent with prior studies.6, 9, 17, 30, 31, 32
We found that AIS hospitalization rates decreased over 2% per year among individuals over 65 years, but increased among younger individuals. Among younger individuals, we cannot rule out that changes were due to chance since the number of events was small. Our findings are consistent with age‐specific data showing increasing incidence of stroke in the young in the Greater Cincinnati/Northern Kentucky Stroke Study19 and Lee et al's previous NIS analysis.5 Data from the National Hospital Discharge Survey from 1997 to 2004, on the other hand, corroborated our findings of lower AIS hospitalization rates among individuals over 65 years, but did not show changes in AIS hospitalization rates among individuals younger than 65 years.17
There are several limitations to the present study. First, this is an observational study; therefore, one cannot assume causal relationships. This data set, however, is useful for analyzing nationwide temporal trends.33 Second, as with any administrative data set, there exists the possibility of coding errors, including miscoding a transient ischemic attack as AIS.22 Third, due to differences in race/ethnic categories in NIS versus the census data, AIS rates are underestimated in Hispanics (due to an inflated denominator when estimating the rate). According to census data, Hispanic (ethnicity) and race are separate measurements. Thus, a person can be classified as both Hispanic and white. The population reported under Hispanics includes Hispanic white, Hispanic black, and Hispanic Asian. In NIS data, however, race and ethnicity are combined; thus, individuals are Latino or other race. Finally, we were not able to verify diagnoses, determine ischemic stroke subtype, or stroke severity. Despite these limitations, the study has several strengths including a large sample size, nationwide representation, and clinician‐based diagnosis of AIS. Further research is required to determine the causes of the disparate hospitalization rates, to better ascertain nationwide race/ethnic‐, sex‐, and age‐specific trends in incidence, and to identify strategies to target subgroup populations who are most vulnerable.
Sources of Funding
This research was supported through the Roxanna Todd Hodges Foundation as well as investigator support through Joachim Splichal (Sanossian).
Disclosures
Towfighi is supported by 1U54NS081764‐01 from the National Institute of Neurological Disorders and Stroke and 11SDG7590160 from the American Heart Association.
(J Am Heart Assoc. 2016;5:e003233 doi: 10.1161/JAHA.116.003233)
References
- 1. Ovbiagele B. Nationwide trends in in‐hospital mortality among patients with stroke. Stroke. 2010;41:1748–1754. [DOI] [PubMed] [Google Scholar]
- 2. Towfighi A, Ovbiagele B, Saver JL. Therapeutic milestone: stroke declines from the second to the third leading organ‐ and disease‐specific cause of death in the United States. Stroke. 2010;41:499–503. [DOI] [PubMed] [Google Scholar]
- 3. Towfighi A, Saver JL. Stroke declines from third to fourth leading cause of death in the United States: historical perspective and challenges ahead. Stroke. 2011;42:2351–2355. [DOI] [PubMed] [Google Scholar]
- 4. Ovbiagele B, Markovic D, Towfighi A. Recent age‐ and gender‐specific trends in mortality during stroke hospitalization in the United States. Int J Stroke. 2011;6:379–387. [DOI] [PubMed] [Google Scholar]
- 5. Lee LK, Bateman BT, Wang S, Schumacher HC, Pile‐Spellman J, Saposnik G. Trends in the hospitalization of ischemic stroke in the United States, 1998–2007. Int J Stroke. 2012;7:195–201. [DOI] [PubMed] [Google Scholar]
- 6. Kissela B, Schneider A, Kleindorfer D, Khoury J, Miller R, Alwell K, Woo D, Szaflarski J, Gebel J, Moomaw C, Pancioli A, Jauch E, Shukla R, Broderick J. Stroke in a biracial population: the excess burden of stroke among blacks. Stroke. 2004;35:426–431. [DOI] [PubMed] [Google Scholar]
- 7. Kleindorfer D, Broderick J, Khoury J, Flaherty M, Woo D, Alwell K, Moomaw CJ, Schneider A, Miller R, Shukla R, Kissela B. The unchanging incidence and case‐fatality of stroke in the 1990s: a population‐based study. Stroke. 2006;37:2473–2478. [DOI] [PubMed] [Google Scholar]
- 8. White H, Boden‐Albala B, Wang C, Elkind MS, Rundek T, Wright CB, Sacco RL. Ischemic stroke subtype incidence among whites, blacks, and hispanics: the Northern Manhattan Study. Circulation. 2005;111:1327–1331. [DOI] [PubMed] [Google Scholar]
- 9. Pathak EB, Sloan MA. Recent racial/ethnic disparities in stroke hospitalizations and outcomes for young adults in Florida, 2001–2006. Neuroepidemiology. 2009;32:302–311. [DOI] [PubMed] [Google Scholar]
- 10. Morgenstern LB, Smith MA, Lisabeth LD, Risser JM, Uchino K, Garcia N, Longwell PJ, McFarling DA, Akuwumi O, Al‐Wabil A, Al‐Senani F, Brown DL, Moye LA. Excess stroke in Mexican Americans compared with non‐Hispanic Whites: the Brain Attack Surveillance in Corpus Christi Project. Am J Epidemiol. 2004;160:376–383. [DOI] [PMC free article] [PubMed] [Google Scholar]
- 11. Lewsey JD, Gillies M, Jhund PS, Chalmers JW, Redpath A, Briggs A, Walters M, Langhorne P, Capewell S, McMurray JJ, Macintyre K. Sex differences in incidence, mortality, and survival in individuals with stroke in Scotland, 1986 to 2005. Stroke. 2009;40:1038–1043. [DOI] [PubMed] [Google Scholar]
- 12. Sealy‐Jefferson S, Wing JJ, Sanchez BN, Brown DL, Meurer WJ, Smith MA, Morgenstern LB, Lisabeth LD. Age‐ and ethnic‐specific sex differences in stroke risk. Gend Med. 2012;9:121–128. [DOI] [PMC free article] [PubMed] [Google Scholar]
- 13. Vega T, Zurriaga O, Ramos JM, Gil M, Alamo R, Lozano JE, Lopez A, Miralles MT, Vaca P, Alvarez Mdel M; Group of research for the Rp . Stroke in Spain: epidemiologic incidence and patterns; a health sentinel network study. J Stroke Cerebrovasc Dis. 2009;18:11–16. [DOI] [PubMed] [Google Scholar]
- 14. Rothwell PM, Coull AJ, Silver LE, Fairhead JF, Giles MF, Lovelock CE, Redgrave JN, Bull LM, Welch SJ, Cuthbertson FC, Binney LE, Gutnikov SA, Anslow P, Banning AP, Mant D, Mehta Z; Oxford Vascular S . Population‐based study of event‐rate, incidence, case fatality, and mortality for all acute vascular events in all arterial territories (Oxford Vascular Study). Lancet. 2005;366:1773–1783. [DOI] [PubMed] [Google Scholar]
- 15. Petrea RE, Beiser AS, Seshadri S, Kelly‐Hayes M, Kase CS, Wolf PA. Gender differences in stroke incidence and poststroke disability in the Framingham Heart Study. Stroke. 2009;40:1032–1037. [DOI] [PMC free article] [PubMed] [Google Scholar]
- 16. Hollander M, Koudstaal PJ, Bots ML, Grobbee DE, Hofman A, Breteler MM. Incidence, risk, and case fatality of first ever stroke in the elderly population. The Rotterdam Study. J Neurol Neurosurg Psychiatry. 2003;74:317–321. [DOI] [PMC free article] [PubMed] [Google Scholar]
- 17. Fang J, Alderman MH, Keenan NL, Croft JB. Declining US stroke hospitalization since 1997: National Hospital Discharge Survey, 1988–2004. Neuroepidemiology. 2007;29:243–249. [DOI] [PubMed] [Google Scholar]
- 18. Towfighi A, Markovic D, Ovbiagele B. Recent patterns of sex‐specific midlife stroke hospitalization rates in the United States. Stroke. 2011;42:3029–3033. [DOI] [PubMed] [Google Scholar]
- 19. Kissela BM, Khoury JC, Alwell K, Moomaw CJ, Woo D, Adeoye O, Flaherty ML, Khatri P, Ferioli S, De Los Rios La Rosa F, Broderick JP, Kleindorfer DO. Age at stroke: temporal trends in stroke incidence in a large, biracial population. Neurology. 2012;79:1781–1787. [DOI] [PMC free article] [PubMed] [Google Scholar]
- 20. Healthcare Cost and Utilization Project (HCUP): Nationwide Inpatient Sample (NIS) . Rockville, MD: Agency for Healthcare Research and Quality; 2000–2010. [PubMed] [Google Scholar]
- 21. Russo CA, Andrews RM. Hospital stays for stroke and other cerebrovascular diseases, 2005: statistical brief #51. Healthcare Cost and Utilization Project (HCUP) statistical briefs. Rockville, MD: Agency for Health Care Policy and Research (US); 2006. [PubMed] [Google Scholar]
- 22. Kokotailo RA, Hill MD. Coding of stroke and stroke risk factors using International Classification of Diseases, revisions 9 and 10. Stroke. 2005;36:1776–1781. [DOI] [PubMed] [Google Scholar]
- 23. Tirschwell DL, Longstreth WT Jr. Validating administrative data in stroke research. Stroke. 2002;33:2465–2470. [DOI] [PubMed] [Google Scholar]
- 24. Easton JD, Saver JL, Albers GW, Alberts MJ, Chaturvedi S, Feldmann E, Hatsukami TS, Higashida RT, Johnston SC, Kidwell CS, Lutsep HL, Miller E, Sacco RL; American Heart A, American Stroke Association Stroke C, Council on Cardiovascular S, Anesthesia, Council on Cardiovascular R, Intervention, Council on Cardiovascular N, Interdisciplinary Council on Peripheral Vascular D . Definition and evaluation of transient ischemic attack: a scientific statement for healthcare professionals from the American Heart Association/American Stroke Association Stroke Council; Council on Cardiovascular Surgery and Anesthesia; Council on Cardiovascular Radiology and Intervention; Council on Cardiovascular Nursing; and the Interdisciplinary Council on Peripheral Vascular Disease. The American Academy of Neurology affirms the value of this statement as an educational tool for neurologists. Stroke. 2009;40:2276–2293. [DOI] [PubMed] [Google Scholar]
- 25. Yoon SS, Ostchega Y, Louis T. Recent trends in the prevalence of high blood pressure and its treatment and control, 1999–2008. NCHS Data Brief. 2010;48:1–8. [PubMed] [Google Scholar]
- 26. Hyre AD, Muntner P, Menke A, Raggi P, He J. Trends in ATP‐III‐defined high blood cholesterol prevalence, awareness, treatment and control among U.S. adults. Ann Epidemiol. 2007;17:548–555. [DOI] [PubMed] [Google Scholar]
- 27. Centers for Disease C, Prevention . Vital signs: prevalence, treatment, and control of hypertension—United States, 1999–2002 and 2005–2008. MMWR Morb Mortal Wkly Rep. 2011;60:103–108. [PubMed] [Google Scholar]
- 28. Centers for Disease C, Prevention . Vital signs: prevalence, treatment, and control of high levels of low‐density lipoprotein cholesterol—United States, 1999–2002 and 2005–2008. MMWR Morb Mortal Wkly Rep. 2011;60:109–114. [PubMed] [Google Scholar]
- 29. Kittner SJ, McCarter RJ, Sherwin RW, Sloan MA, Stern BJ, Johnson CJ, Buchholz D, Seipp MJ, Price TR. Black‐white differences in stroke risk among young adults. Stroke. 1993;24:I13–I15; discussion I20‐11. [PubMed] [Google Scholar]
- 30. Sturgeon JD, Folsom AR. Trends in hospitalization rate, hospital case fatality, and mortality rate of stroke by subtype in Minneapolis‐St. Paul, 1980–2002. Neuroepidemiology. 2007;28:39–45. [DOI] [PubMed] [Google Scholar]
- 31. Appelros P, Stegmayr B, Terent A. Sex differences in stroke epidemiology: a systematic review. Stroke. 2009;40:1082–1090. [DOI] [PubMed] [Google Scholar]
- 32. Howard VJ, Kleindorfer DO, Judd SE, McClure LA, Safford MM, Rhodes JD, Cushman M, Moy CS, Soliman EZ, Kissela BM, Howard G. Disparities in stroke incidence contributing to disparities in stroke mortality. Ann Neurol. 2011;69:619–627. [DOI] [PMC free article] [PubMed] [Google Scholar]
- 33. Grimes DA, Schulz KF. Descriptive studies: what they can and cannot do. Lancet. 2002;359:145–149. [DOI] [PubMed] [Google Scholar]