Abstract
Background
Maladaptive cardiac hypertrophy is a major risk factor for heart failure, which is the leading cause of death worldwide. C‐C motif chemokine receptor 9 (CCR9), a subfamily of the G protein–coupled receptor supergene family, has been highlighted as an immunologic regulator in the development and homing of immune cells and in immune‐related diseases. Recently, CCR9 was found to be involved in the pathogenesis of other diseases such as cardiovascular diseases; however, the effects that CCR9 exerts in cardiac hypertrophy remain elusive.
Methods and Results
We observed significantly increased CCR9 protein levels in failing human hearts and in a mouse or cardiomyocyte hypertrophy model. In loss‐ and gain‐of‐function experiments, we found that pressure overload–induced hypertrophy was greatly attenuated by CCR9 deficiency in cardiac‐specific CCR9 knockout mice, whereas CCR9 overexpression in cardiac‐specific transgenic mice strikingly enhanced cardiac hypertrophy. The prohypertrophic effects of CCR9 were also tested in vitro, and a similar phenomenon was observed. Consequently, we identified a causal role for CCR9 in pathological cardiac hypertrophy. Mechanistically, we revealed a lack of difference in the expression levels of mitogen‐activated protein kinases between groups, whereas the phosphorylation of AKT/protein kinase B and downstream effectors significantly decreased in CCR9 knockout mice and increased in CCR9 transgenic mice after aortic binding surgery.
Conclusions
The prohypertrophic effects of CCR9 were not attributable to the mitogen‐activated protein kinase signaling pathway but rather to the AKT–mammalian target of rapamycin–glycogen synthase kinase 3β signaling cascade.
Keywords: AKT, cardiac dysfunction, cardiac hypertrophy, cardiovascular disease, cardiovascular research, C‐C motif chemokine receptor 9, heart failure, hypertrophy
Subject Categories: Heart Failure, Hypertrophy
Introduction
Heart failure is the leading cause of death in many nations, especially in aging populations.1 At present, heart failure is widely recognized to be a clinical syndrome resulting from cardiac hypertrophy and remodeling, which involves structural and functional changes in the left ventricle (LV) in response to internal or external cardiovascular damage or to induction by pathogenic risk factors. The most proximal initiating stimuli for cardiac hypertrophy can be broadly segregated into biomechanical stretch‐sensitive mechanisms and neurohumoral mechanisms that are associated with the release of hormones, cytokines, chemokines, and peptide growth factors via complex downstream signaling cascades.2
Although numerous studies have revealed crucial proteins and pathways involved in the process of cardiac hypertrophy, including the mitogen‐activated protein kinase (MAPK)3 and phosphatidylinositol 3 kinase–AKT–mammalian target of rapamycin (mTOR)4, 5, 6 signaling pathways, the underlying mechanism of cardiac hypertrophy remains elusive. Recently, numerous studies have reported the effects of immunologic molecules in cardiac hypertrophy.7, 8, 9 Based on the prominent roles of immune networks in the pathogenesis of various diseases, the identification of new immune regulators in cardiac hypertrophy will provide insights into the mechanism and treatment of cardiac hypertrophy and dysfunction.
Chemokines are a family of low‐molecular‐weight proteins that play an essential role in complex cellular functions. C‐C motif class chemokines consist of at least 28 members (C‐C motif chemokine ligands [CCLs] 1–28) that signal through 10 known chemokine receptors (C‐C motif chemokine receptors [CCRs] 1–10) that are a subfamily of the G protein–coupled receptor family.10, 11 Among these receptors, CCR9 has been highlighted as an immunologic regulator in the development and homing of immune cells and in immune‐related diseases since its discovery.12, 13 Interactions between CCL25 and CCR9 can induce regulatory T cell migration to the intestines, which is associated with the pathogenesis of Crohn's disease.12 Recently, researchers have also found that CCR9 is not exclusively expressed on immune cells and may be involved in the pathogenesis of other diseases such as cancer and cardiovascular diseases14, 15; however, the regulatory effects and potential mechanisms of action of CCR9 in cardiac hypertrophy are largely unknown. These clinical discoveries motivated us to investigate the potential role of CCR9 in maladaptive cardiac hypertrophy.
Materials and Methods
Ethics Statements
All experimental procedures involving human samples were approved by the human research ethics committee of Fuwai Hospital, and written informed consent was obtained before heart sample collection. All animal experiments were approved by the animal care and use committee of Fuwai Hospital and were conducted in accordance with the US National Institutes of Health guidelines.
Human Heart Sample
LVs (n=6 per group) were collected from patients with dilated cardiomyopathy (DCM) and hypertrophic cardiomyopathy.16, 17 Normal LV tissues (n=6) were obtained from donors after brain death who had passed away in accidents and whose hearts were unsuitable for heart transplantation for noncardiac reasons.2
Reagents
Antibodies against CCR9 (ab38567, 1:500 dilution) were obtained from Abcam. Antibodies against the following proteins were purchased from Cell Signaling Technology: MEK1/2 (9122, 1:1000 dilution), phosphorylated (p) MEK1/2Ser32/36 (9154, 1:1000 dilution), ERK1/2 (4695, 1:1000 dilution), p‐ERK1/2Thr202/Tyr204 (4370, 1:1000 dilution), JNK (9252, 1:1000 dilution), p‐JNKThr183/Tyr185 (4668, 1:1000 dilution), P38 (9212, 1:1000 dilution), p‐P38Thr180/Tyr182 (4511, 1:1000 dilution), AKT (4691, 1:1000 dilution), p‐AKTSer473 (4060, 1:1000 dilution), glycogen synthase kinase 3β (GSK3β; 9315, 1:1000 dilution), p‐GSK3βSer9 (9322, 1:1000 dilution), p70S6 kinase (2708, 1:1000 dilution), p‐p70S6 kinaseSer371 (9208, 1:1000 dilution), mTOR (2983, 1:1000 dilution), p‐mTORSer2448 (2971, 1:1000 dilution), PI3 kinase p85 (4257, 1:1000 dilution), and p‐PI3 kinase p85Tyr458 (4228, 1:1000 dilution). Antibodies against β‐myosin heavy chain (sc53090, 1:200 dilution) and atrial natriuretic peptide (sc20158, 1:200 dilution) were purchased from Santa Cruz Biotechnology. Antibodies against GAPDH (MB001, 1:10 000 dilution) were obtained from Bioworld Technology. The BCA protein assay kit was purchased from Pierce (Thermo Fisher Scientific). We used peroxidase‐conjugated secondary antibodies (1:10 000 dilution; Jackson ImmunoResearch Laboratories) for visualization.
Animal Models and Procedures
Generation of cardiac‐specific conditional CCR9 knockout (CCR9‐KO) mice involved generation of CCR9flox/flox (CCR9‐floxed) mice using the CRISPR/Cas9 system to insert 2 mLoxP sequences flanking the CCR9 exon 3 coding sequence (CDS) region. We designed 2 single‐guide RNAs targeting 2 locations of CCR9 using an online CRISPR design tool (http://tools.genome-engineering.org). One single‐guide RNA targeted a region upstream of the 5′ end of the CDS region, whereas the other single‐guide RNA targeted a region downstream of the 3′ end of the CDS region of CCR9. A circular donor vector containing the CDS region flanked by 2 mloxP sites and 2 homology arms of 1.5 and 1.5 kb, respectively, was used as template to repair the double‐strand breaks by homologous recombination. A total of 72 embryos and mice were generated from zygotes injected with Cas9 mRNA, single‐guide RNAs, and donor vector targeting the CDS region sites. To detect the gene modifications, we designed a pair of primers (F1/R1) to amplify the fragment containing the left arm, the right arm, and the floxed CDS region. All polymerase chain reaction products were subcloned, and 30 clones for each mouse were randomly selected for sequencing to detect the modifications. Further analyses revealed that 2 founder mice (numbers 11‐4 and 12‐11) contained floxed CDS regions on the same allele. To confirm whether the floxed allele functioned as expected, we used the genomic DNA for in vitro Cre/loxP‐mediated recombination. The primer pairs F1/R1 and F2/R2 were used to detect the deletion products and the circle product, respectively. All polymerase chain reaction products were confirmed by sequencing. Founder mouse 12‐11 was mated with a C57BL/6J female mouse to obtain CCR9‐floxed mice. We then crossed the CCR9‐floxed mice with mice carrying an α‐MHC–MerCreMer transgene (MEM‐Cre; MEM‐Cre‐Tg [Myh6‐cre/Esr1, 005650]; Jackson Laboratory, Bar Harbor, ME) to produce CCR9‐floxed/MEM‐Cre mice bearing MEM‐Cre and floxed CCR9 genes. The CCR9‐KO mice were induced using tamoxifen injections (80 mg/kg per day, T‐5648; Sigma‐Aldrich) of 6‐week old CCR9‐floxed/MEM‐Cre mice for 5 consecutive days. MEM‐Cre mice and CCR9‐floxed mice served as control groups.
Generation of cardiac‐specific conditional CCR9 transgenic (CCR9‐TG) mice involved the transgene vector pCAG‐CAT‐mCCR9, which contains a CAG gene promoter‐loxP‐CAT gene‐loxP‐mCCR9 region and was constructed from pCAG‐loxP‐CAT‐loxp‐lacZ by replacing the lacZ gene with mouse CCR9 cDNA. The transgene vector was linearized and used for pronuclear microinjection. Founder transgenic mice were identified by tail DNA amplification and then bred with C57BL/6J mice. CAG‐CAT‐mCCR9 mice (strain C57BL/6J) were mated with Myh6‐Cre mice to generate CAG‐CAT‐mCCR9/Myh6‐Cre double‐transgenic mice. The CCR9‐TG mice were induced by tamoxifen injections (80 mg/kg per day, T‐5648; Sigma‐Aldrich) of CAG‐CAT‐mCCR9/Myh6‐Cre mice aged 6 weeks for 5 consecutive days. Untreated CAG‐CAT‐mCCR9/Myh6‐Cre mice served as a control group.
Male mice aged 8 to 10 weeks (weight 24–27 g) underwent aortic banding (AB) or a sham operation. AB was performed to establish a pressure overload–induced cardiac hypertrophy model in accordance with previously described methods.16, 18 Briefly, after anesthetization with pentobarbital sodium (90 mg/kg; Sigma‐Aldrich) via an intraperitoneal injection and in the absence of any toe pinch reflex, the left chest of each mouse was opened to identify the thoracic aorta by blunting dissection at the second intercostal space. AB was achieved by tying the thoracic aorta against a 26‐gauge needle with a 7‐0 silk suture. After ligation, the needle was removed, and adequate aortic constriction was confirmed by Doppler analysis. The sham‐operated group underwent a similar procedure without aortic constriction.
For LY294002 (ab120243; Abcam) administration, LY294002 was dissolved in dimethyl sulfoxide. The agent was then administered to CCR9‐TG and nontransgenic mice daily for 4 weeks by intraperitoneal injection at a dose of 50 mg per kilogram of body weight. The same volume of dimethyl sulfoxide was used as a control.
Echocardiography Measurements
Echocardiography measurements were performed at the indicated time points to evaluate the cardiac function of the mice. First, the surviving mice were anesthetized with 1.5% to 2% isoflurane. For echocardiography, M‐mode tracings derived from the short axis of LV at the level of the papillary muscles were recorded using a Mylab30CV (Esaote) ultrasound system with a 15‐MHz probe. LV internal diameter measurements were obtained from at least 3 beats and then averaged. The LV end‐diastolic and ‐systolic diameters were measured at the largest and smallest LV areas, respectively. Fractional shortening was calculated using the following formula (in which FS indicates fractional shortening, LVEDd indicates LV end‐diastolic diameter, and LVESd indicates LV end‐systolic diameter): FS(%)=(LVEDd−LVESd)/LVEDd×100%.
Histological Analysis
At 4 weeks after AB or sham surgery, the mice were euthanized to assess hypertrophic growth and cardiac fibrosis. Paraffin‐embedded 5‐μm heart sections were stained with hematoxylin and eosin and picrosirius red. The cardiomyocyte cross‐sectional areas were calculated after staining with FITC‐conjugated wheat germ agglutinin (Invitrogen). Images were taken by fluorescence microscopy, and individual cell sizes were measured using a quantitative digital image analysis system (Image‐Pro Plus 6.0; Media Cybernetics).
Neonatal Rat Cardiomyocyte Culture and Adenovirus Infection
Neonatal rat cardiomyocytes (NRCMs) were plated onto gelatin‐coated culture dishes in DMEM/F12 medium containing 20% fetal calf serum. After 48 hours, the medium was exchanged for serum‐free DMEM/F12, and the NRCMs were subsequently treated with angiotensin II (Ang II; 1 μmol/L) or PBS. Recombinant Adenoviral CCR9 (AdCCR9) vectors were generated by introducing rat CCR9 cDNA into a replication‐defective adenoviral vector. A similar adenoviral vector encoding the GFP gene was used as a control. To downregulate CCR9 expression, rat short hairpin CCR (shCCR9) constructs were cloned into adenovirus and AdshRNAs were used as controls, and the efficiency and specificity of these adenoviruses were validated. The NRCMs were infected with the indicated adenoviruses at a multiplicity of infection of 100 particles per cell for 24 hours.
Immunofluorescence Analysis
After infection and hypertrophic stimulation, the NRCMs were fixed with 3.7% formaldehyde, followed by permeabilization with 0.1% Triton X‐100 in PBS, and blocking by a 10% BSA solution at room temperature. The cells were subsequently incubated with a primary antibody against α‐actin, followed by a fluorescent secondary antibody. The cell surface area was measured using Image‐Pro Plus 6.0 software.
Western Blotting and Quantitative Real‐time Polymerase Chain Reaction
Tissue and cell homogenates were prepared in lysis buffer. After sonication, the extracts were incubated on ice for 15 minutes, followed by centrifugation at 4°C. The denatured proteins were subjected to SDS‐PAGE (Invitrogen) and transferred to a polyvinylidene fluoride membrane (Millipore). After being blocked with 5% nonfat milk, the membrane was incubated with the indicated primary antibodies overnight at 4°C and subsequently with the peroxidase‐conjugated secondary antibodies (1:10 000 dilution; Jackson ImmunoResearch Laboratories). A ChemiDoc XRS+ (Bio‐Rad) instrument was used to detect protein signals. Total RNA was extracted using TRIzol reagent (Invitrogen), according to the manufacturer's protocol, and 2 μg RNA was reverse transcribed using a Transcriptor First Strand cDNA Synthesis Kit (Roche). Quantitative polymerase chain reaction amplification of the mRNA of the indicated genes was performed using SYBR Green (Roche).
Statistical Analysis
The data are presented as the mean±SD. Statistical analyses were performed with SPSS version 13.0 software (IBM Corp). Student 2‐tailed t tests were used for comparisons between 2 groups. Differences among ≥3 groups were compared using 1‐way ANOVA followed by a least significant difference or Tamhane's T2 post‐test. Nonparametric methods Kruskal–Wallis (≥3 groups) and Mann‐Whitney (2 groups) and Bonferroni correction were used when the number of analytic units per group was quite small (n=6 per group). P<0.05 was considered statistically significant.
Results
Upregulation of CCR9 in Failing Human Hearts and Hypertrophic Murine Hearts and Cardiomyocytes
To investigate the potential role of CCR9 in the process of cardiac hypertrophy, we initially tested whether CCR9 expression level is altered in hearts with similar pathologies. The results demonstrated that the CCR9 protein levels were increased significantly in DCM patients; the protein levels of the hypertrophic markers atrial natriuretic peptide and β‐myosin heavy chain were also increased compared with controls (Figure 1A). We obtained similar results for human hypertrophic cardiomyopathy samples (Figure 1B). For the AB‐induced hypertrophy mouse model, CCR9 protein levels were significantly increased 4 and 8 weeks after the AB operation compared with controls (Figure 1C). The CCR9 protein levels in Ang II–treated NRCMs were also markedly increased (Figure 1D). These data indicate that CCR9 might be involved in the development of cardiac hypertrophy.
Figure 1.
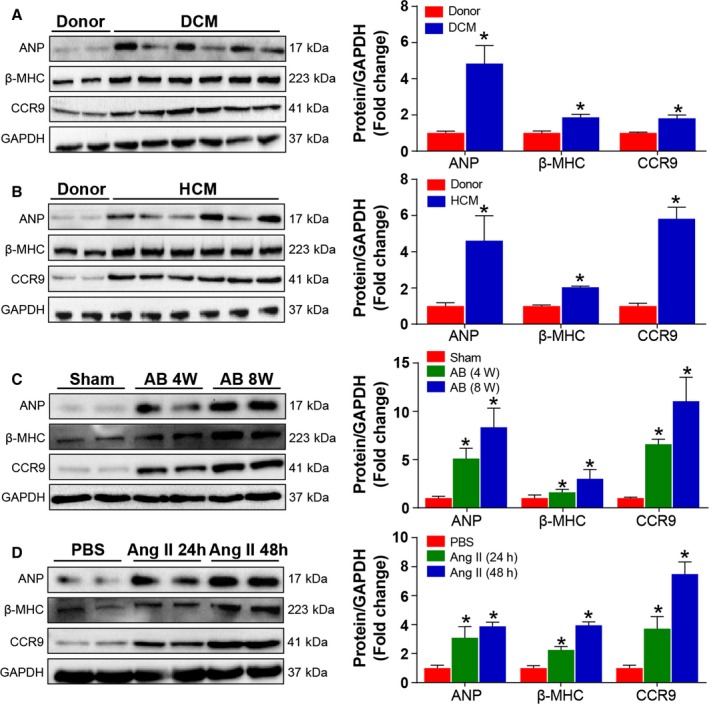
Cardiac CCR9 expression is increased in human hearts with DCM and HCM, mouse models of cardiac hypertrophy, and NRCMs treated with Ang II. A and B, Western blot and quantitative results for hypertrophic markers and CCR9 expression levels in the LVs of normal controls and DCM and HCM patients (n=6 per group; *P<0.05 vs donor hearts). C, Western blot and quantification of hypertrophic markers and CCR9 expression levels in the hearts of mice 4 and 8 weeks after sham or AB surgery (n=6 per group; *P<0.05 vs sham group). D, Western blot analysis and quantification of hypertrophic markers and CCR9 expression levels in primary cultured NRCMs treated with PBS or Ang II for 24 or 48 hours (n=6 per group; *P<0.05 vs PBS‐treated group). AB indicates aortic banding; Ang II, angiotensin II; ANP, atrial natriuretic peptide; β‐MHC, β‐myosin heavy chain; CCR9, C‐C motif chemokine receptor 9; DCM, dilated cardiomyopathy; h, hours; HCM, hypertrophic cardiomyopathy; NRCM, neonatal rat cardiomyocyte; W, weeks.
Loss of CCR9 Attenuates Pressure Overload–Induced Hypertrophy
After detecting the association between CCR9 and cardiac hypertrophy, we performed loss‐ and gain‐of‐function studies of CCR9 in vivo to examine whether alterations in CCR9 expression would affect cardiac hypertrophy. We generated conditional CCR9‐KO mice by crossing transgenic MEM‐Cre mice with CCR9‐floxed mice (Figure 2A through 2C).
Figure 2.
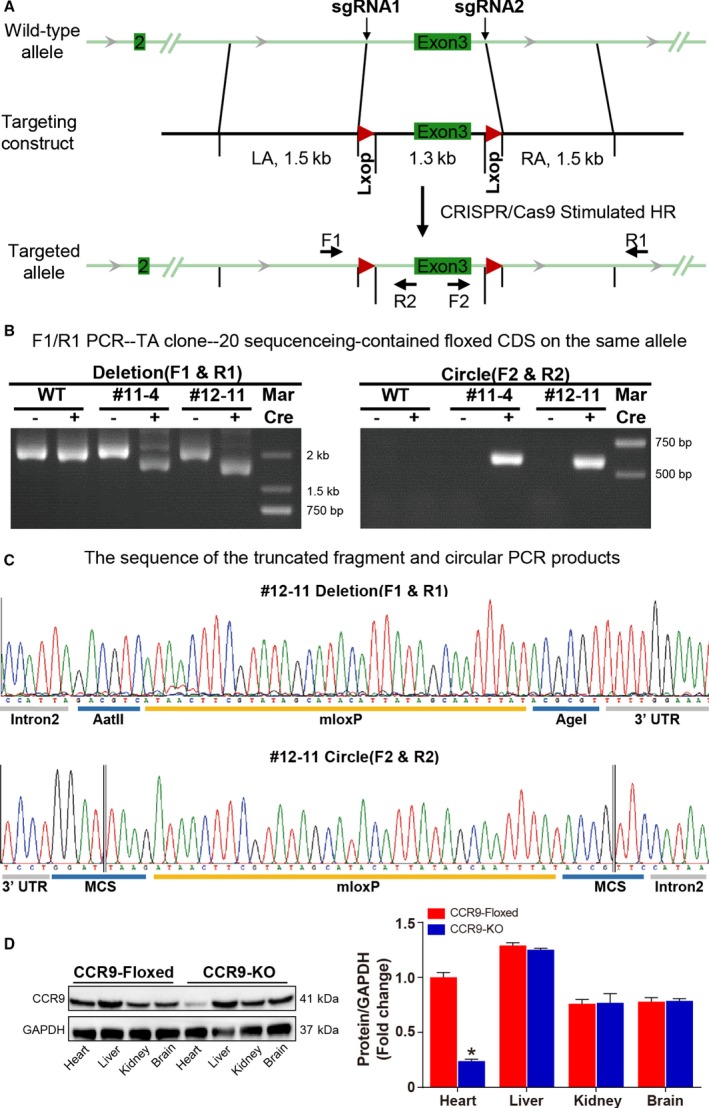
Schematic representation of the generation of cardiac‐specific conditional CCR9‐KO mice and their identification. A, Schematic illustration of cardiac‐specific conditional CCR9‐KO generation. B, Amplification of the entire region covering the floxed exon 1, exon 2, and homology arm using the F1/R1 primer (left) and the circle excised by Cre using the F2/R2 primer (right). C, DNA sequence of the truncated fragment amplified by the F1/R1 primer (upper) and the circular PCR products amplified by the F2/R2 primer (lower). D, Western blot and quantitative results for CCR9 expression levels in different tissues of CCR9‐KO and CCR9‐floxed/MEM‐Cre mice (n=6 per group; *P<0.05 vs CCR9‐floxed group). CCR9, C‐C motif chemokine receptor 9; CDS, coding sequence; HR, heart rate; KO, knockout; LA, left atrium; MCS, multiple cloning site; PCR, polymerase chain reaction; RA, right atrium; sgRNA, single‐guide RNA; UTR, untranslated region; WT, wild type.
Conditional knockout founders were identified by Western blot analysis (Figure 2D). CCR9‐KO and control (MEM‐Cre and CCR9‐floxed) groups were subsequently challenged with AB or sham operation. At 4 weeks after the operation, echocardiographic, hemodynamic, and histological analyses were performed. The results demonstrated that, compared with the control groups, the hypertrophic response was significantly blunted by CCR9 deficiency. The heart weight (HW)/body weight (BW), lung weight/BW, and HW/tibia length ratios were markedly decreased in the CCR9‐KO group compared with the controls (Figure 3A). The echocardiographic measurements indicated that AB‐treated CCR9‐KO mice were characterized by decreased LV end‐diastolic and ‐systolic diameters and increased fractional shortening, demonstrating smaller LV dimensions and elevated systolic function (Figure 3B). Histological analysis indicated that the hypertrophic response of the CCR9‐KO mice was significantly attenuated compared with controls, and these animals manifested decreased heart size and cardiomyocyte cross‐sectional area as well as alleviation of interstitial fibrosis (Figure 3C through 3E). The mRNA levels of hypertrophic and fibrotic markers were also reduced significantly in the AB‐treated CCR9‐KO group (Figure 3F). Collectively, these results indicated that CCR9 inactivation can protect the heart from pressure overload–induced cardiac hypertrophy.
Figure 3.
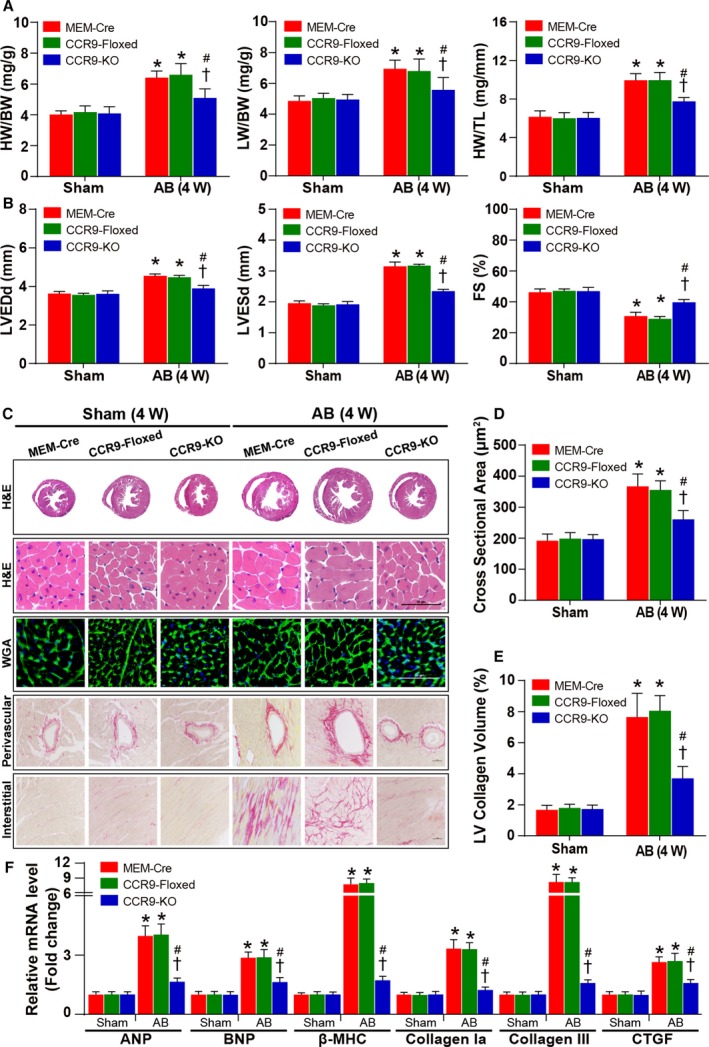
Cardiac CCR9 deficiency attenuates AB‐induced hypertrophy. A, Statistical results for HW/BW, LW/BW, and HW/TL ratios (n=8–12 per group). B, Statistical results for the echocardiographic parameters LVEDd, LVESd, and FS in the indicated groups (n=8–11 per group). C, Representative images of the histological analysis of cardiac hypertrophy, as indicated by whole‐heart short‐axis cross sections, H&E staining, and WGA staining, and representative images of cardiac interstitial fibrosis, as indicated by picrosirius red staining of the perivascular and interstitial area (scale bar=50 μm; n=5 or 6 per group). D, Statistical results for the individual cardiomyocyte cross‐sectional area (n=5 or 6 per group; at least 140 cells were measured per mouse). E, Statistical results for cardiac interstitial fibrosis (n=5 or 6 per group; at least 45 high‐power fields were counted per group). F, Quantification results for hypertrophic and fibrotic marker mRNA levels in the indicated groups (n=12 per group). *P<0.05 vs MEM‐Cre/sham or CCR9‐floxed/sham group; # P<0.05 vs CCR9‐KO/sham group; † P<0.05 vs MEM‐Cre/AB or CCR9‐floxed/AB group. AB indicates aortic banding; ANP, atrial natriuretic peptide; β‐MHC, β‐myosin heavy chain; BNP, B‐type natriuretic peptide; BW indicates body weight; CCR9, C‐C motif chemokine receptor 9; CTGF, connective tissue growth factor; FS, fractional shortening; H&E, hematoxylin and eosin; HW, heart weight; KO, knockout; LV, left ventricle; LVEDd, left ventricle end‐diastolic diameter; LVESd, left ventricle end‐systolic diameter; LW, lung weight; TL, tibia length; W, weeks; WGA, wheat germ agglutinin.
CCR9 Overexpression Exacerbates Pressure Overload–Induced Hypertrophy
Next, we generated CCR9‐TG mice with cardiac‐specific CCR9 overexpression. Initially, we analyzed the CCR9 protein levels in CCR9‐TG and control (nontransgenic) groups by Western blotting (Figure 4A). At 4 weeks after AB, the CCR9‐TG mice exhibited an enhanced hypertrophic response, with increased HW/BW, lung weight/BW, and HW/tibia length ratios (Figure 4B) and exacerbated cardiac function, as characterized by increased LV end‐diastolic and ‐systolic diameters and shortened fractional shortening compared with controls (Figure 4C). Histological analysis indicated that CCR9 overexpression increased the heart size and cardiomyocyte cross‐sectional area and significantly enhanced interstitial fibrosis relative to the controls (Figure 4D through 4F). In addition, compared with the controls, CCR9 overexpression markedly increased the mRNA levels of hypertrophic and fibrotic markers (Figure 4G). Taken together, these data suggest that CCR9 activation can deteriorate cardiac morphology and function in vivo.
Figure 4.
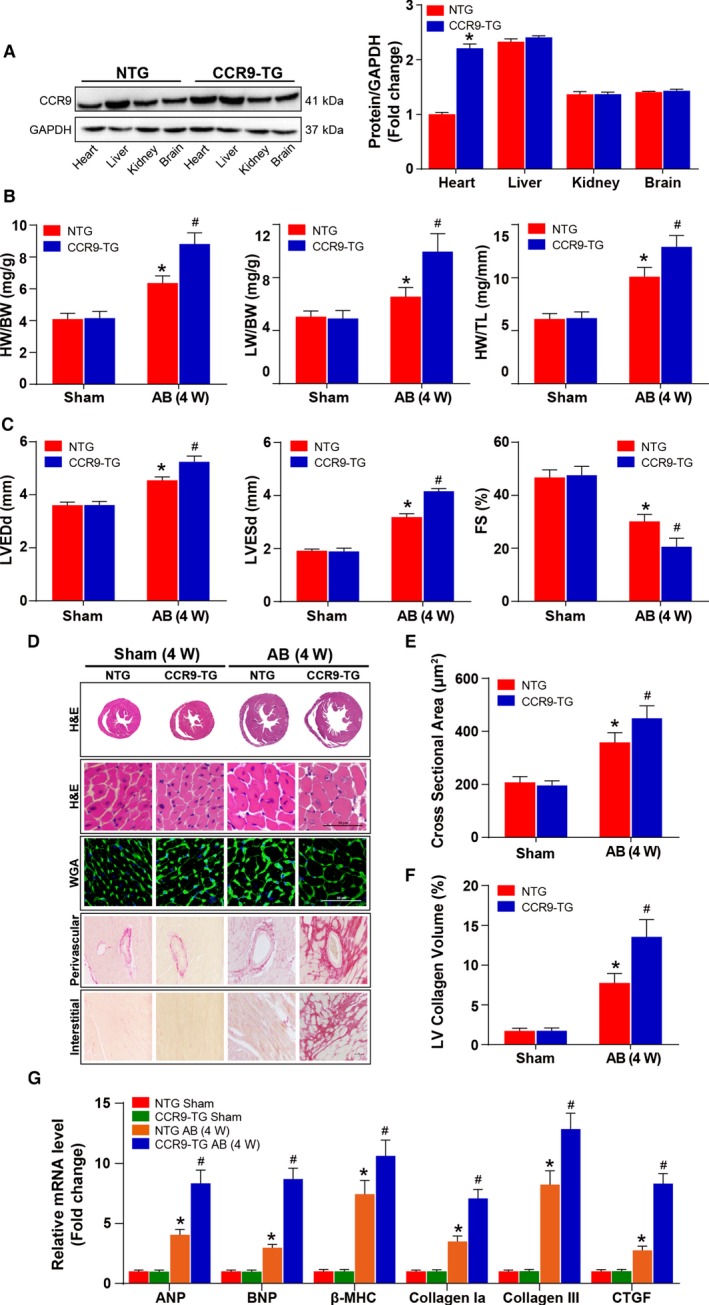
Cardiac CCR9 overexpression exacerbates AB‐induced hypertrophy. A, Representative results for Western blot, and quantification results of CCR9 expression levels in indicated groups (n=6 per group). B, Statistical results for HW/BW, LW/BW, and HW/TL ratios (n=10–12 per group). C, Statistical results for the echocardiographic parameters LVEDd, LVESd, and FS in the indicated groups (n=9–11 per group). D, Representative images of the histological analysis of cardiac hypertrophy, as indicated by the whole‐heart short‐axis cross‐section, H&E staining, WGA staining, and representative images of cardiac interstitial fibrosis as indicated by picrosirius red staining of the perivascular and interstitial area (scale bar=50 μm; n=5 or 6 per group). E, Statistical results for individual cardiomyocyte cross‐sectional area (n=5 or 6 per group; at least 150 cells were measured per mouse). F, Statistical results for cardiac interstitial fibrosis (n=5 or 6 per group; at least 45 high‐power fields were counted per group). G, Quantification results for hypertrophic and fibrotic marker mRNA levels in the indicated groups (n=12 per group). *P<0.05 vs NTG/sham group; # P<0.05 vs NTG/AB group. AB indicates aortic banding; ANP, atrial natriuretic peptide; β‐MHC, β‐myosin heavy chain; BNP, B‐type natriuretic peptide; BW indicates body weight; CCR9, C‐C motif chemokine receptor 9; CTGF, connective tissue growth factor; FS, fractional shortening; H&E, hematoxylin and eosin; HW, heart weight; LV, left ventricle; LVEDd, left ventricle end‐diastolic diameter; LVESd, left ventricle end‐systolic diameter; LW, lung weight; NTG, nontransgenic; TG, transgenic; TL, tibia length; W, weeks; WGA, wheat germ agglutinin.
CCR9 Promotes Ang II–Induced Cardiomyocyte Hypertrophy In Vitro
Having tested the potential effects of CCR9 on cardiac hypertrophy in vivo, in a better‐controlled experimental setting, we determined the functional contribution of CCR9 to cardiac hypertrophy using primary cultured NRCMs. Loss‐ and gain‐of‐function studies of CCR9 were performed with AdshCCR9 to knock down CCR9 or with AdCCR9 to overexpress the protein. Subsequently, infected NRCMs were exposed to Ang II or to PBS as a control. The CCR9 protein levels were assessed by Western blot analysis to guarantee the success of infection (Figure 5A). As shown in Figure 5B, CCR9 deficiency markedly inhibited Ang II–induced hypertrophic response, whereas CCR9 overexpression clearly enhanced the response. Consistently, the mRNA levels of hypertrophic markers decreased after CCR9 knockdown and increased after CCR9 overexpression (Figure 5C). These data implicate CCR9 as an exacerbating factor for cardiomyocyte hypertrophy in vitro.
Figure 5.
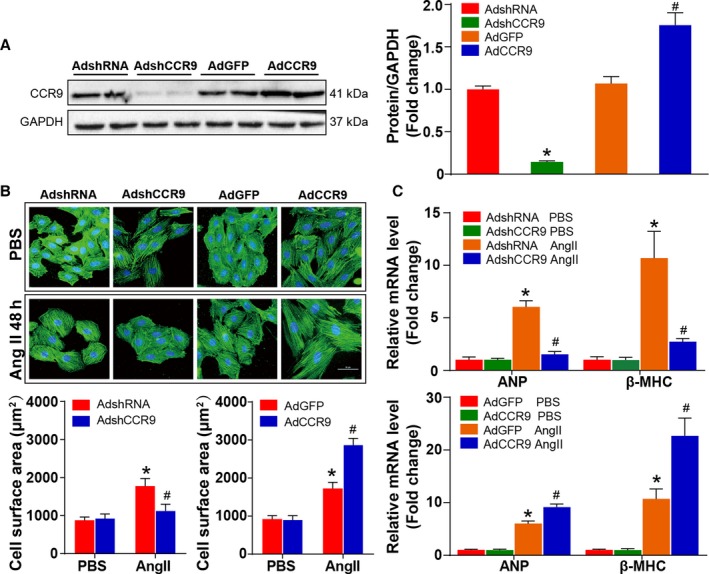
CCR9 modulates Ang II–induced cardiomyocyte hypertrophy in vitro. A, Western blot analysis and quantification results for CCR9 expression level in each group (*P<0.05 vs AdshRNA group; # P<0.05 vs AdGFP group). B, Representative images of NRCMs infected with AdshCCR9 or AdCCR9 and treated with Ang II (1 μmol/L) or PBS for 48 hours (blue: nuclear; green: α‐actin; scale bar=50 μm; n=6 per group). Cell surface area is assessed and compared in AdshCCR9 and AdCCR9 groups (n=12 per group; at least 55 cells were examined each group; *P<0.05 vs AdshRNA or AdGFP/PBS group; # P<0.05 vs AdshRNA or AdGFP/Ang II group). C, The relative levels of hypertrophic markers mRNAs in NRCMs infected with AdshCCR9 and AdCCR9 (n=12 per group; *P<0.05 vs AdshRNA or AdGFP/PBS group; # P<0.05 vs AdshRNA or AdGFP/Ang II group). AdGFP indicates Adenoviral green fluorescent protein; AdshRNA, Adenoviral short hairpin RNA; Ang II, angiotensin II; ANP, atrial natriuretic peptide; β‐MHC, β‐myosin heavy chain; CCR9, C‐C motif chemokine receptor 9; NRCM, neonatal rat cardiomyocyte.
CCR9 Overexpression Increases AKT Phosphorylation in Response to Hypertrophic Stress
CCR9 is clearly able to enhance pressure overload–induced cardiac hypertrophy; however, the underlying mechanisms by which CCR9 regulate the pathogenesis of hypertrophic response remain to be elucidated. According to previous studies, the MAPK and AKT signaling pathways play important roles in cardiac hypertrophy3, 19, 20; therefore, we initially examined whether CCR9 alterations could affect the MAPK signaling response. Notably, following AB operation, MAPK phosphorylation levels remained unaffected by both CCR9 deficiency and overexpression (Figure 6A and 6B). In contrast, AKT phosphorylation levels were significantly blunted in the CCR9‐KO group and elevated markedly in the CCR9‐TG group after AB‐induced hypertrophy compared with the controls. We observed similar phosphorylation trends for the downstream molecules of AKT (mTOR, GSK3β, and p70S6K) (Figure 7A and 7B). Consistent with the in vivo results, the phosphorylation levels of AKT and downstream molecules were decreased or increased significantly after CCR9 knockdown or overexpression in Ang II–treated NRCMs, respectively (Figure 7C and 7D). These results indicate that the prohypertrophic effects of CCR9 are attributable to activation of the AKT signaling pathway.
Figure 6.
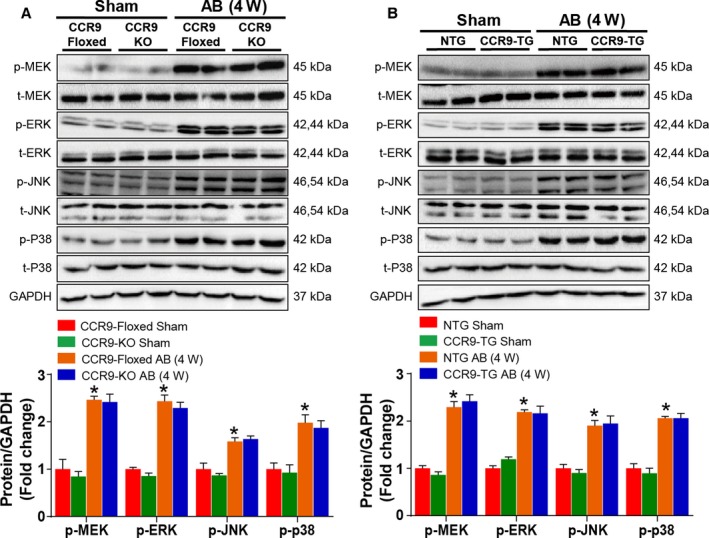
Mitogen‐activated protein kinase signaling acts downstream of CCR9. A and B, Representative results for Western blot and quantification results of the phosphorylation of MEK, ERK, JNK, and p38 and their basal volumes in the indicated groups (n=6 per group; *P<0.05 vs CCR9‐floxed/sham or NTG/sham group). AB indicates aortic banding; AdGFP indicates Adenoviral green fluorescent protein; AdshRNA, Adenoviral short hairpin RNA; CCR9, C‐C motif chemokine receptor 9; ERK, extracellular regulated protein kinase; JNK, c‐Jun N‐terminal kinase; KO, knockout; MEK, MAPK/ERK kinase; NTG, nontransgenic; p38, protein 38; TG, transgenic; W, weeks.
Figure 7.
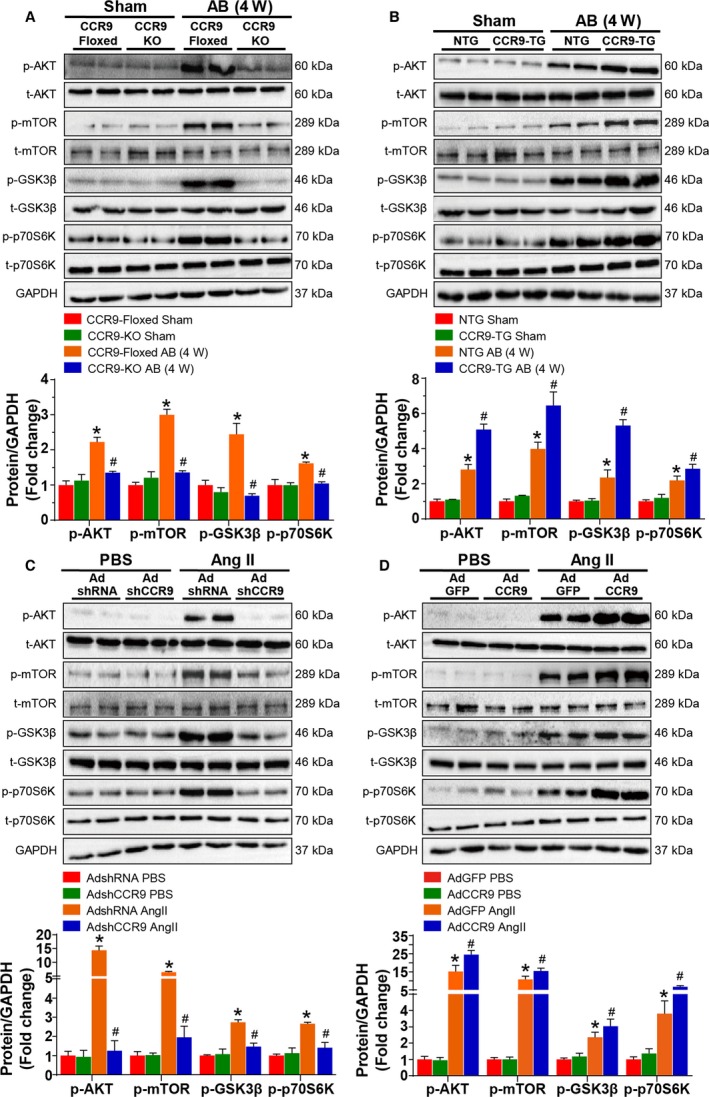
AKT signaling acts downstream of CCR9. A and B, Representative results for Western blot, and quantification results of the phosphorylation of AKT, m‐TOR, GSK3β, and p70S6K and their basal volumes in the indicated groups (n=6 per group; *P<0.05 vs CCR9‐floxed or NTG/sham group; # P<0.05 vs CCR9‐floxed or NTG/AB group). C and D, Representative results for Western blot, and quantification results of the phosphorylation of AKT, m‐TOR, GSK3β, and p70S6K and their basal volumes in the indicated groups (n=6 per group; *P<0.05 vs AdshRNA or AdGFP/PBS group; # P<0.05 vs AdshRNA or AdGFP/Ang II group). AB indicates aortic banding; Ang II, angiotensin II; CCR9, C‐C motif chemokine receptor 9; GSK3β, glycogen synthase kinase 3β; KO, knockout; mTOR, mammalian target of rapamycin; NTG, nontransgenic; TG, transgenic; W, weeks.
Inactivation of Cardiac AKT Rescues the Adverse Effect of CCR9 Overexpression on Pressure Overload–Induced Cardiac Hypertrophy
The aforementioned results suggested a strong association between CCR9 overexpression and AKT signaling activation, thus we were interested in determining whether inactivation of AKT could reverse the adverse effects of CCR9 overexpression. To conduct this study, CCR9‐TG and nontransgenic mice were treated with LY294002 to inhibit the phosphorylation of AKT or dimethyl sulfoxide for control and challenged with AB surgery. The inhibition efficiency of LY294002 was confirmed by Western blot analysis (Figure 8A). We found that after the administration of LY294002, phosphorylation levels of AKT and downstream molecules decreased significantly compared with the dimethyl sulfoxide–treated groups. In addition, AKT inactivation significantly attenuated the AB‐induced hypertrophic response characterized by reduced ratios of HW/BW, lung weight/BW, and HW/tibia length (Figure 8B); reduced LV dimension; and restored cardiac function (Figure 8C). Consistently, histological analysis, manifested by decreased heart size and cardiomyocyte cross‐sectional area as well as alleviation of interstitial fibrosis, indicated that AKT inactivation could reverse the adverse effects of CCR9 overexpression following AB surgery (Figure 8D through 8F). In addition, the mRNA levels of atrial natriuretic peptide and β‐myosin heavy chain were also downregulated because of AKT inhibition compared with the controls (Figure 8G). In summary, these data suggest that the inhibition of AKT plays an essential role in preventing hypertrophic responses following CCR9 overexpression.
Figure 8.
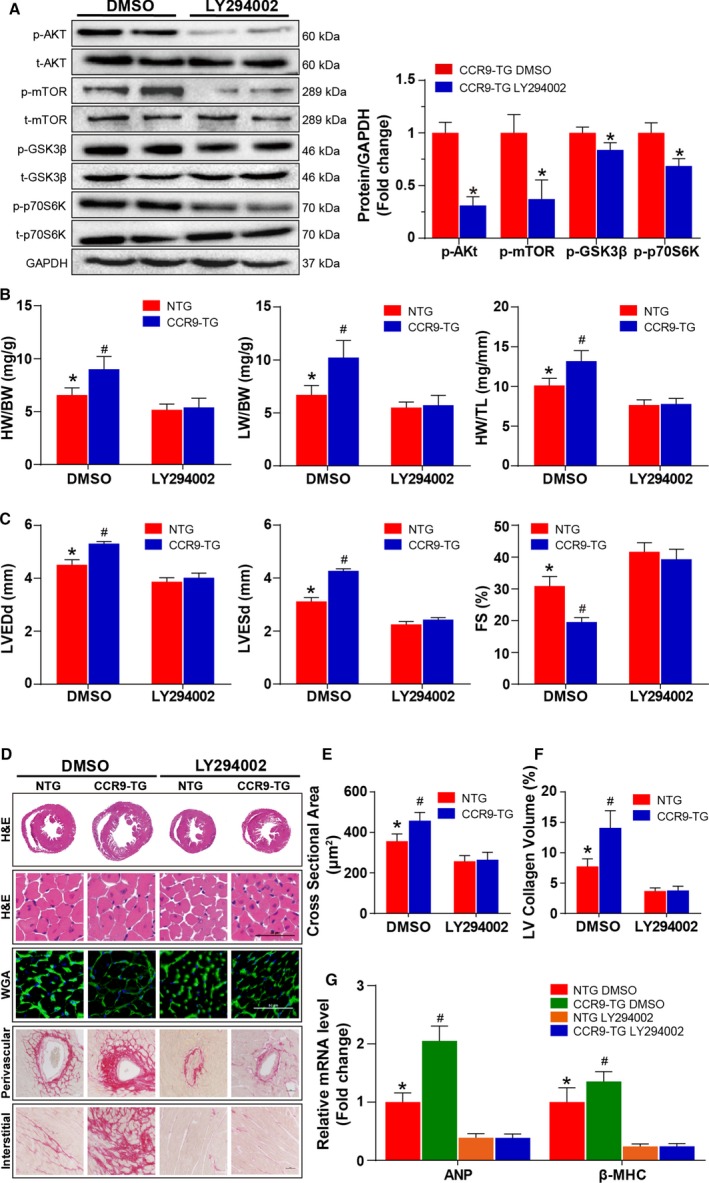
AKT inhibition blunted AB‐induced cardiac hypertrophy in vivo. A, After the administration of LY294002 or PBS, Western blot analysis and statistical results of the phosphorylation of AKT, m‐TOR, GSK3β, and p70S6K and their basal volumes in the indicated groups (n=6 per group). B, Statistical results for HW/BW, LW/BW, and HW/TL ratios (n=11 or 12 per group). C, Statistical results for the echocardiographic parameters LVEDd, LVESd, and FS in indicated groups (n=8–11 per group). D, Representative images of the histological analysis of cardiac hypertrophy, as indicated by the whole‐heart short‐axis cross section, H&E staining, WGA staining, and representative images of cardiac interstitial fibrosis as indicated by picrosirius red staining of the perivascular and interstitial area after AB (scale bar=50 μm; n=6 per group). E, Statistical results of individual cardiomyocyte cross‐sectional area (n=6 per group; at least 100 cells were measured per mouse). F, Statistical results of cardiac interstitial fibrosis (n=6 per group; at least 50 high‐power fields were counted per group). G, Quantification results of hypertrophic markers mRNA levels in the indicated groups after AB (n=12 per group). *P<0.05 vs LY294002‐treated NTG/AB group; # P<0.05 vs DMSO‐treated NTG/AB group. AB indicates aortic banding; ANP, atrial natriuretic peptide; β‐MHC, β‐myosin heavy chain; BW indicates body weight; CCR9, C‐C motif chemokine receptor 9; DMSO, dimethyl sulfoxide; FS, fractional shortening; GSK3β, glycogen synthase kinase 3β; H&E, hematoxylin and eosin; HW, heart weight; LVEDd, left ventricle end‐diastolic diameter; LVESd, left ventricle end‐systolic diameter; LW, lung weight; mTOR, mammalian target of rapamycin; NTG, nontransgenic; TG, transgenic; TL, tibia length; WGA, wheat germ agglutinin.
Discussion
As an immunologic regulator, the effect of CCR9 on diseases apart from inflammatory diseases and cancers, such as cardiovascular diseases, and especially its role in the development of cardiac hypertrophy remain poorly investigated. In this study, we identified CCR9 as an intrinsic positive regulator of maladaptive cardiac hypertrophy and demonstrated that CCR9 promotes maladaptive hypertrophy in the context of AB‐induced chronic pressure overload. We obtained inspiration from failing and hypertrophic human hearts with remarkable upregulated expression levels of CCR9. We also found that CCR9 was highly expressed in an AB‐induced murine hypertrophy model, Ang II–treated NRCMs, and failing human heart. Further investigation using loss‐ and gain‐of‐function experiments in vivo and in vitro demonstrated that CCR9 was an intrinsic prohypertrophic regulator; however, the possible mechanisms by which CCR9 enhance cardiac hypertrophy remain unclear. It is generally accepted that biomechanical stress induced by pressure overload initiates numerous signaling pathways, regulating the hypertrophic growth of cardiac myocytes and interstitial fibrosis. Numerous studies have reported that the MAPK signaling pathway plays a critical role in cardiac hypertrophy.19, 20, 21, 22 Based on this relationship, we assessed MAPK signaling pathway activation after AB operation, but the results revealed no significant difference in MAPK activation between the different groups, indicating that the prohypertrophic effects of CCR9 may not occur in a MAPK‐dependent manner.
Meanwhile, reports have also focused on the roles of the AKT signaling pathway in cardiac hypertrophy, and some reports supported the opinion that activation of the AKT signaling pathway could inhibit cardiomyocyte apoptosis and promote heart function.23, 24, 25 Nagoshi et al25 posited that the acute activation of AKT is cardioprotective and can reduce infarction size and cardiac dysfunction after ischemia–reperfusion injury. Condorelli et al26 observed that cardiac‐specific AKT overexpression significantly increased cardiomyocyte size, which was associated with increased systolic function. Meanwhile, others favored the view that AKT activation would enhance cardiac hypertrophy associated with deteriorated heart function.26, 27 In addition, the duration of AKT activation also affects cardiac hypertrophy. Shiojima et al28 argued that short‐term AKT activation induces physiological hypertrophy and a moderate increase in heart size, whereas chronic AKT activation results in pathological cardiac hypertrophy with significantly increased cardiomyocyte size.
Numerous previous studies have also studied the essential effects of CCR9 on the AKT signaling pathway and related diseases. Li and coworkers29 found that compromised CCR9–CCL25 interactions promoted apoptosis in non–small cell lung cancer cells by activating phosphatidylinositol 3 kinase/AKT in vitro, which resulted in the upregulation of antiapoptotic proteins and downregulation of apoptotic proteins. In addition, the results of breast cancer–related research demonstrated that the CCR9–CCL25 axis activates cell survival signals through AKT and subsequent GSK3β inactivation.30
We subsequently investigated whether the AKT signaling pathway is involved in cardiac hypertrophy and found that the prohypertrophic effects of CCR9 was, to some extent, attributable to the activation of the AKT signaling pathway after AB treatment. The in vivo and in vitro results indicated that inactivation of CCR9 can downregulate the phosphorylation of AKT and its downstream effectors and attenuate hypertrophy, whereas CCR9 overexpression produced opposite effects. Furthermore, the inhibition of AKT with LY294002 was able to significantly blunt the hypertrophic response in CCR9‐TG mice after AB operation. These data indicate that the prohypertrophic effects of CCR9 occur in an AKT–mTOR/GSK3β signaling‐dependent manner. In a similar murine model of AB‐induced cardiac hypertrophy, another immunologic molecule, adaptor protein SH2BB adaptor protein 3 (SH2B3), played similar roles in the development of cardiac hypertrophy. The overexpression of SH2B3 significantly aggravated hypertrophic responses on prohypertrophic stimuli, and SH2B3 deficiency attenuated cardiac hypertrophy. Further investigations demonstrated that SH2B3 regulated the hypertrophic response via the AKT–mTOR/GSK3β signaling cascade in a focal adhesion kinase–dependent manner.17 These data indicated that immunologic molecules might exert complex functions apart from immune regulation. In addition, we found that the phenotypes following AKT activation may not be the same. AKT activation induced by AB in the context of CCR9 overexpression may lead to aggravated hypertrophy and deteriorated systolic function, whereas AKT overexpression due to a transgenic approach was characterized by the promoted cardiac function.26 As a serine/threonine kinase that appears to be central in mediating various biological stimuli, AKT is important in complex cellular functions, including cell proliferation, growth, and migration. The effects of AKT on its numerous downstream targets determine its function in cardiovascular processes such as cardiomyocyte survival,31 growth and proliferation,32 atherosclerosis,33 cardiac hypertrophy, and interstitial fibrosis. The above distinguishing viewpoint might be held because AKT may modulate cardiovascular biology in alternative pathways. We cannot also rule out the involvement other proteins or signaling pathways activated by CCR9 overexpression and the influence of different settings, experimental approaches, and animals.
The hypertrophic growth of cardiomyocytes following prohypertrophic stimuli is regulated by endocrine, paracrine, and autocrine networks activating membrane‐bound receptor‐mediated signal transduction pathways.34 The increased CCR9 protein levels observed in human samples with hypertrophic cardiomyopathy, in DCM, and in murine hearts challenged with an AB operation indicated that CCR9 is a potential target for the specific treatment of cardiac hypertrophy. This research, however, has some limitations. First, the pressure overload model may represent hypertrophic cardiomyopathy to some extent; however, it is not the best representative model for DCM. Because cardiac hypertrophy is the early stage and initial pathological change of heart failure, as mentioned, and the human heart sample of DCM is derived from patients diagnosed with DCM and end‐stage heart failure, the upregulation of CCR9 in DCM may demonstrate that the induction of CCR9 may be a common pathway to heart failure resulting from hypertrophic cardiomyopathy, DCM, and pressure overload challenge. The involvement of CCR9 in human heart with DCM requires deeper and further investigations. Second, in this research we neglected the immunologic regulatory function of CCR9 in the pathogenesis of cardiac hypertrophy. This function is reported in immune response and related diseases and may be exerted in cardiac hypertrophy. Third, we should expand our research from a murine pressure overload model to other models, such as cardiac hypertrophy and ventricular remodeling after myocardial infarction.
In conclusion, this study is the first to define the role of CCR9 in cardiac hypertrophy.
Perspective
Our findings indicate that CCR9 is a novel modulator of cardiac hypertrophy in response to prohypertrophic stress. The underlying mechanism of prohypertrophic effects of CCR9 appears to involve the activation of AKT signaling. Consequently, the present study also provided novel insights into the molecular mechanisms of cardiac hypertrophy. Based on these findings, CCR9 may represent a new therapeutic target for suppressing the onset of cardiac hypertrophy.
Sources of Funding
This work was supported by the Distinguished Professor of Peking Union Medical College (No. 2012‐XH01), Innovation team of Peking Union Medical College (No. 2014‐XH01) and Natural Science Foundation of China (No. 81170130).
Disclosures
None.
Acknowledgments
We greatly thank Dr Hongliang Li (Wuhan University, Wuhan, China) for generously providing the CCR9 conditional knockout and transgenic mice and other experimental and technological assistance.
(J Am Heart Assoc. 2016;5:e003342 doi: 10.1161/JAHA.116.003342)
References
- 1. Kumarswamy R, Thum T. Non‐coding RNAs in cardiac remodeling and heart failure. Circ Res. 2013;113:676–689. [DOI] [PubMed] [Google Scholar]
- 2. Zhang Y, Liu Y, Zhu XH, Zhang XD, Jiang DS, Bian ZY, Zhang XF, Chen K, Wei X, Gao L, Zhu LH, Yang Q, Fan GC, Lau WB, Ma X, Li H. Dickkopf‐3 attenuates pressure overload‐induced cardiac remodelling. Cardiovasc Res. 2014;102:35–45. [DOI] [PMC free article] [PubMed] [Google Scholar]
- 3. Rose BA, Force T, Wang Y. Mitogen‐activated protein kinase signaling in the heart: angels versus demons in a heart‐breaking tale. Physiol Rev. 2010;90:1507–1546. [DOI] [PMC free article] [PubMed] [Google Scholar]
- 4. Abeyrathna P, Su Y. The critical role of Akt in cardiovascular function. Vascul Pharmacol. 2015;74:38–48. [DOI] [PMC free article] [PubMed] [Google Scholar]
- 5. Ghigo A, Morello F, Perino A, Damilano F, Hirsch E. Specific PI3K isoform modulation in heart failure: lessons from transgenic mice. Curr Heart Fail Rep. 2011;8:168–175. [DOI] [PubMed] [Google Scholar]
- 6. Heineke J, Molkentin JD. Regulation of cardiac hypertrophy by intracellular signalling pathways. Nat Rev Mol Cell Biol. 2006;7:589–600. [DOI] [PubMed] [Google Scholar]
- 7. Zhao GN, Jiang DS, Li H. Interferon regulatory factors: at the crossroads of immunity, metabolism, and disease. Biochim Biophys Acta. 2015;1852:365–378. [DOI] [PubMed] [Google Scholar]
- 8. Jiang DS, Wei X, Zhang XF, Liu Y, Zhang Y, Chen K, Gao L, Zhou H, Zhu XH, Liu PP, Bond Lau W, Ma X, Zou Y, Zhang XD, Fan GC, Li H. IRF8 suppresses pathological cardiac remodelling by inhibiting calcineurin signalling. Nat Commun. 2014;5:3303. [DOI] [PMC free article] [PubMed] [Google Scholar]
- 9. Zhang SM, Zhu LH, Chen HZ, Zhang R, Zhang P, Jiang DS, Gao L, Tian S, Wang L, Zhang Y, Wang PX, Zhang XF, Zhang XD, Liu DP, Li H. Interferon regulatory factor 9 is critical for neointima formation following vascular injury. Nat Commun. 2014;5:5160. [DOI] [PMC free article] [PubMed] [Google Scholar]
- 10. Youn BS, Kim YJ, Mantel C, Yu KY, Broxmeyer HE. Blocking of c‐FLIP(L)—independent cycloheximide‐induced apoptosis or Fas‐mediated apoptosis by the CC chemokine receptor 9/TECK interaction. Blood. 2001;98:925–933. [DOI] [PubMed] [Google Scholar]
- 11. White GE, Iqbal AJ, Greaves DR. CC chemokine receptors and chronic inflammation–therapeutic opportunities and pharmacological challenges. Pharmacol Rev. 2013;65:47–89. [DOI] [PubMed] [Google Scholar]
- 12. Wermers JD, McNamee EN, Wurbel MA, Jedlicka P, Rivera‐Nieves J. The chemokine receptor CCR9 is required for the T‐cell‐mediated regulation of chronic ileitis in mice. Gastroenterology. 2011;140:1526–1535.e1523. [DOI] [PMC free article] [PubMed] [Google Scholar]
- 13. Wu W, Doan N, Said J, Karunasiri D, Pullarkat ST. Strong expression of chemokine receptor CCR9 in diffuse large B‐cell lymphoma and follicular lymphoma strongly correlates with gastrointestinal involvement. Hum Pathol. 2014;45:1451–1458. [DOI] [PubMed] [Google Scholar]
- 14. Zhang Z, Qin C, Wu Y, Su Z, Xian G, Hu B. CCR9 as a prognostic marker and therapeutic target in hepatocellular carcinoma. Oncol Rep. 2014;31:1629–1636. [DOI] [PubMed] [Google Scholar]
- 15. Abd Alla J, Langer A, Elzahwy SS, Arman‐Kalcek G, Streichert T, Quitterer U. Angiotensin‐converting enzyme inhibition down‐regulates the pro‐atherogenic chemokine receptor 9 (CCR9)‐chemokine ligand 25 (CCL25) axis. J Biol Chem. 2010;285:23496–23505. [DOI] [PMC free article] [PubMed] [Google Scholar]
- 16. Chen K, Gao L, Liu Y, Zhang Y, Jiang DS, Wei X, Zhu XH, Zhang R, Chen Y, Yang Q, Kioka N, Zhang XD, Li H. Vinexin‐beta protects against cardiac hypertrophy by blocking the Akt‐dependent signalling pathway. Basic Res Cardiol. 2013;108:338. [DOI] [PubMed] [Google Scholar]
- 17. Zhu X, Fang J, Jiang DS, Zhang P, Zhao GN, Zhu X, Yang L, Wei X, Li H. Exacerbating pressure overload‐induced cardiac hypertrophy: novel role of adaptor molecule SRC homology 2‐B3. Hypertension. 2015;66:571–578. [DOI] [PubMed] [Google Scholar]
- 18. Jiang DS, Li L, Huang L, Gong J, Xia H, Liu X, Wan N, Wei X, Zhu X, Chen Y, Chen X, Zhang XD, Li H. Interferon regulatory factor 1 is required for cardiac remodeling in response to pressure overload. Hypertension. 2014;64:77–86. [DOI] [PubMed] [Google Scholar]
- 19. Lorenz K, Schmitt JP, Schmitteckert EM, Lohse MJ. A new type of ERK1/2 autophosphorylation causes cardiac hypertrophy. Nat Med. 2009;15:75–83. [DOI] [PubMed] [Google Scholar]
- 20. Streicher JM, Ren S, Herschman H, Wang Y. MAPK‐activated protein kinase‐2 in cardiac hypertrophy and cyclooxygenase‐2 regulation in heart. Circ Res. 2010;106:1434–1443. [DOI] [PMC free article] [PubMed] [Google Scholar]
- 21. Kimura TE, Jin J, Zi M, Prehar S, Liu W, Oceandy D, Abe J, Neyses L, Weston AH, Cartwright EJ, Wang X. Targeted deletion of the extracellular signal‐regulated protein kinase 5 attenuates hypertrophic response and promotes pressure overload‐induced apoptosis in the heart. Circ Res. 2010;106:961–970. [DOI] [PMC free article] [PubMed] [Google Scholar]
- 22. Ganesan J, Ramanujam D, Sassi Y, Ahles A, Jentzsch C, Werfel S, Leierseder S, Loyer X, Giacca M, Zentilin L, Thum T, Laggerbauer B, Engelhardt S. MIR‐378 controls cardiac hypertrophy by combined repression of mitogen‐activated protein kinase pathway factors. Circulation. 2013;127:2097–2106. [DOI] [PubMed] [Google Scholar]
- 23. Yao H, Han X, Han X. The cardioprotection of the insulin‐mediated PI3K/AKT/mTOR signaling pathway. Am J Cardiovasc Drugs. 2014;14:433–442. [DOI] [PubMed] [Google Scholar]
- 24. Zwadlo C, Schmidtmann E, Szaroszyk M, Kattih B, Froese N, Hinz H, Schmitto JD, Widder J, Batkai S, Bahre H, Kaever V, Thum T, Bauersachs J, Heineke J. Antiandrogenic therapy with finasteride attenuates cardiac hypertrophy and left ventricular dysfunction. Circulation. 2015;131:1071–1081. [DOI] [PubMed] [Google Scholar]
- 25. Nagoshi T, Matsui T, Aoyama T, Leri A, Anversa P, Li L, Ogawa W, del Monte F, Gwathmey JK, Grazette L, Hemmings BA, Kass DA, Champion HC, Rosenzweig A. PI3K rescues the detrimental effects of chronic Akt activation in the heart during ischemia/reperfusion injury. J Clin Invest. 2005;115:2128–2138. [DOI] [PMC free article] [PubMed] [Google Scholar]
- 26. Condorelli G, Drusco A, Stassi G, Bellacosa A, Roncarati R, Iaccarino G, Russo MA, Gu Y, Dalton N, Chung C, Latronico MV, Napoli C, Sadoshima J, Croce CM, Ross J Jr. AKT induces enhanced myocardial contractility and cell size in vivo in transgenic mice. Proc Natl Acad Sci USA. 2002;99:12333–12338. [DOI] [PMC free article] [PubMed] [Google Scholar]
- 27. Horikawa YT, Panneerselvam M, Kawaraguchi Y, Tsutsumi YM, Ali SS, Balijepalli RC, Murray F, Head BP, Niesman IR, Rieg T, Vallon V, Insel PA, Patel HH, Roth DM. Cardiac‐specific overexpression of caveolin‐3 attenuates cardiac hypertrophy and increases natriuretic peptide expression and signaling. J Am Coll Cardiol. 2011;57:2273–2283. [DOI] [PMC free article] [PubMed] [Google Scholar]
- 28. Shiojima I, Sato K, Izumiya Y, Schiekofer S, Ito M, Liao R, Colucci WS, Walsh K. Disruption of coordinated cardiac hypertrophy and angiogenesis contributes to the transition to heart failure. J Clin Invest. 2005;115:2108–2118. [DOI] [PMC free article] [PubMed] [Google Scholar]
- 29. Li B, Wang Z, Zhong Y, Lan J, Li X, Lin H. CCR9‐CCL25 interaction suppresses apoptosis of lung cancer cells by activating the PI3K/AKT pathway. Med Oncol. 2015;32:66. [DOI] [PubMed] [Google Scholar]
- 30. Johnson‐Holiday C, Singh R, Johnson EL, Grizzle WE, Lillard JW Jr, Singh S. CCR9‐CCL25 interactions promote cisplatin resistance in breast cancer cell through Akt activation in a PI3K‐dependent and FAK‐independent fashion. World J Surg Oncol. 2011;9:46. [DOI] [PMC free article] [PubMed] [Google Scholar]
- 31. Datta SR, Brunet A, Greenberg ME. Cellular survival: a play in three Akts. Genes Dev. 1999;13:2905–2927. [DOI] [PubMed] [Google Scholar]
- 32. Zhu J, Blenis J, Yuan J. Activation of PI3K/Akt and MAPK pathways regulates Myc‐mediated transcription by phosphorylating and promoting the degradation of Mad1. Proc Natl Acad Sci USA. 2008;105:6584–6589. [DOI] [PMC free article] [PubMed] [Google Scholar]
- 33. Babaev VR, Hebron KE, Wiese CB, Toth CL, Ding L, Zhang Y, May JM, Fazio S, Vickers KC, Linton MF. Macrophage deficiency of Akt2 reduces atherosclerosis in Ldlr null mice. J Lipid Res. 2014;55:2296–2308. [DOI] [PMC free article] [PubMed] [Google Scholar]
- 34. Molkentin JD, Dorn GW II. Cytoplasmic signaling pathways that regulate cardiac hypertrophy. Annu Rev Physiol. 2001;63:391–426. [DOI] [PubMed] [Google Scholar]


