Significance
Actin, spectrin, and associated molecules form a submembrane periodic skeleton structure in neurons. In this study, we demonstrate that this membrane-associated periodic skeleton (MPS) is present in a broad range of neuronal cell types cultured from the central and peripheral nervous systems of rodents. The MPS structure is preferentially formed in axons compared with dendrites and is differentially regulated at the pre- and postsynaptic sites of neurons. Our data also suggest that MPS is conserved across a wide range of invertebrate and vertebrate animal species.
Keywords: actin, spectrin, cytoskeleton, neuron, STORM
Abstract
Actin, spectrin, and associated molecules form a periodic, submembrane cytoskeleton in the axons of neurons. For a better understanding of this membrane-associated periodic skeleton (MPS), it is important to address how prevalent this structure is in different neuronal types, different subcellular compartments, and across different animal species. Here, we investigated the organization of spectrin in a variety of neuronal- and glial-cell types. We observed the presence of MPS in all of the tested neuronal types cultured from mouse central and peripheral nervous systems, including excitatory and inhibitory neurons from several brain regions, as well as sensory and motor neurons. Quantitative analyses show that MPS is preferentially formed in axons in all neuronal types tested here: Spectrin shows a long-range, periodic distribution throughout all axons but appears periodic only in a small fraction of dendrites, typically in the form of isolated patches in subregions of these dendrites. As in dendrites, we also observed patches of periodic spectrin structures in a small fraction of glial-cell processes in four types of glial cells cultured from rodent tissues. Interestingly, despite its strong presence in the axonal shaft, MPS is disrupted in most presynaptic boutons but is present in an appreciable fraction of dendritic spine necks, including some projecting from dendrites where such a periodic structure is not observed in the shaft. Finally, we found that spectrin is capable of adopting a similar periodic organization in neurons of a variety of animal species, including Caenorhabditis elegans, Drosophila, Gallus gallus, Mus musculus, and Homo sapiens.
Actin is critically involved in the regulation of neuronal polarization, differentiation, and growth of neuronal processes, cargo trafficking, and plasticity of synapses (1–3). Spectrin is an actin-binding protein that is important for the development and stabilization of axons and maintenance of neuronal polarization (4–6). In Caenorhabditis elegans, spectrin is important for the stability and integrity of axons under mechanical stress (4, 6) and for mechanosensation (6), and spectrin depletion results in axon breakage during animal locomotion (4). In Drosophila, spectrin has been shown to be involved in axonal path finding (7) and stabilization of presynaptic terminals (8). In mice, spectrin null mutations are embryonically lethal, and neurons with spectrin knockdown display defects in axonal initial segment assembly (5, 9, 10).
Actin and spectrin form a 2D polygonal lattice structure underneath the membrane of erythrocytes (11). Recently, a novel form of actin–spectrin-based submembrane skeleton structure was discovered in neuronal axons (12) using superresolution STORM imaging (13, 14). This membrane-associated periodic skeleton (MPS) has been observed in both fixed and live cultured neurons (12, 15, 16) and in brain tissue sections (12). In this structure, short actin filaments are organized into repetitive, ring-like structures that wrap around the circumference of the axon with a periodicity of ∼190 nm; adjacent actin rings are connected by spectrin tetramers, and actin short filaments in the rings are capped by adducin (12). This structure also appears to organize other associated molecules, such as ankyrin and sodium channels, into a periodic distribution in axons (12, 16). During neuronal development, MPS originates from the axonal region proximal to the soma and propagates to distal axonal terminals (16). At a relatively late stage during development, specific isoforms of ankyrin and spectrin molecules, ankyrin-G and βIV spectrin, are recruited to the axon initial segment (AIS) (17, 18), and these molecules are also assembled into the MPS structure, adopting a similar periodic distribution (16, 19). As in the AIS, this periodic structure is also present in the nodes of Ranvier (20). This periodic skeletal structure has been shown to preferentially form in axons compared with dendrites in primary neuronal cultures: actin and spectrin typically form a long-range, periodic lattice structure throughout the entire axonal shaft, except for the very distal region near the growth cone, in essentially all observed axons. In contrast, such a periodic structure was observed in only a small fraction (∼10–30%) of dendrites and typically appeared as short, isolated patches in portions of these dendrites (16, 20). The local concentration of spectrin is a key determinant for the preferential formation of MPS in axons: in wild-type neurons, βII spectrin is enriched in axons, and artificially increasing the concentration of βII spectrin through overexpression is sufficient to induce the formation of MPS in all dendrites (16). Ankyrin-B appears to be an important regulator of this structure: in ankyrin-B knockout mice, βII spectrin becomes evenly distributed between axons and dendrites, leading to the formation of the long-range MPS structure in all dendrites (16) without perturbing the MPS structure in axons (16, 21).
The ubiquitous expression of spectrin in the nervous systems of nearly all animal species (22) raises the questions of how widespread the MPS structure is in different nervous system cell types and distinct subcellular compartments and of how conserved this structure is across different animal species. A recent paper reports the presence of periodic actin structures in several nervous system cell types from rodents (23). Here we investigated these questions regarding the prevalence and conservation of the MPS structure by examining the distribution of spectrin in many different types of rodent neurons and glial cells and across a variety of organisms ranging from C. elegans to Homo sapiens. Furthermore, we examined the distribution of spectrin in presynaptic and postsynaptic compartments of axons and dendrites, respectively, to shed light on the relation between the MPS structure and synapses.
Results
The MPS Structure Is Present in Both Excitatory and Inhibitory Neurons Cultured from Mouse Cortex, Hippocampus, and Midbrain.
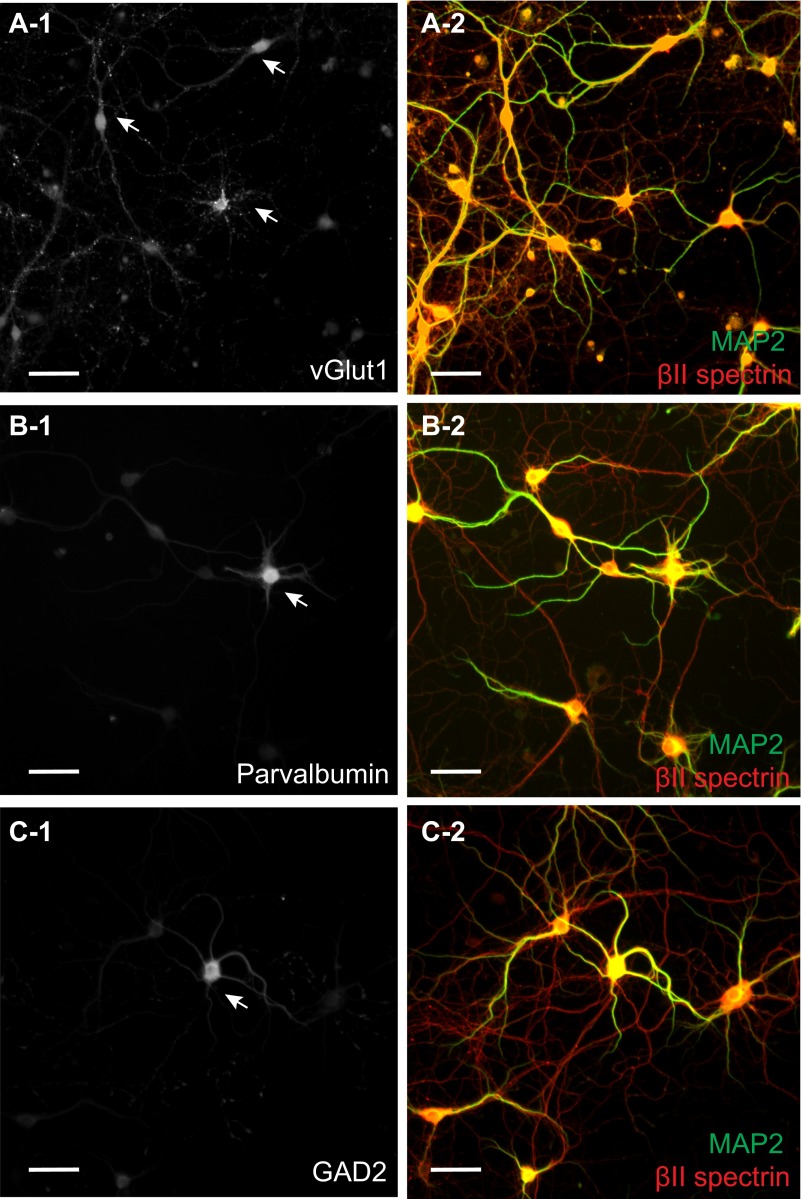
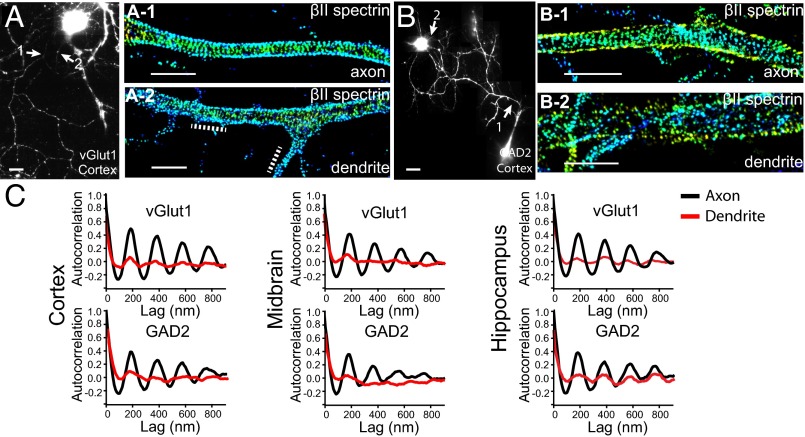
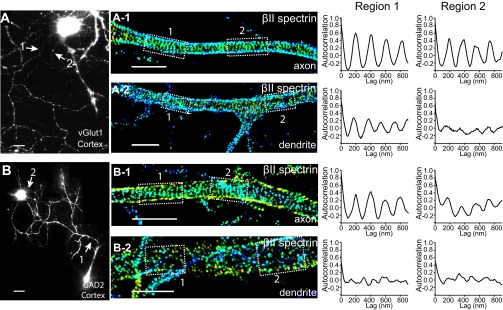
We initially observed the membrane-associated, periodic actin–spectrin structure in axons of rodent hippocampal and cortical neurons (12). The neurons observed in this earlier study are most likely excitatory pyramidal neurons. To test whether our findings extend to other excitatory neuronal types, or inhibitory neurons in the mouse brain, we first cultured neurons from three different mouse brain regions—the cortex, hippocampus, and midbrain—and distinguished excitatory and inhibitory neurons using immunofluorescence against vGlut1 and GAD2, respectively (Fig. S1). We then labeled βII spectrin in these neurons using immunofluorescence and imaged immunolabeled βII spectrin using 3D STORM imaging, a superresolution imaging method that uses stochastic switching and high-precision localization of single molecules to obtain subdiffraction-limit image resolution (13, 14). We distinguished axons from dendrites either by morphology, with the axon being a distinctly long process projecting from the soma, or by immunofluorescence, with dendrites being MAP2-positive. We observed highly periodic distributions of βII spectrin in the axons of nearly all (>90%) vGlut1+ excitatory neurons cultured from all three brain regions (Fig. 1A and Figs. S2A, S3A, and S4A). Autocorrelation analysis indicated that the spacing was around 190 nm (Fig. 1C and Figs. S2A, S3A, and S4A), consistent with the value determined previously (12, 16). βII spectrin also adopted a periodic distribution in the axons of nearly all (90%) GAD2+ inhibitory neurons from mouse cortex, hippocampus, and midbrain (Fig. 1B and Figs. S2B, S3B, and S4B). We used autocorrelation analysis to systematically quantify the degree of periodicity for βII spectrin in axons of these neurons. The amplitude of the averaged autocorrelation function of many randomly selected segments of axons provided a measure of the degree of periodicity. As shown in Fig. 1C, both the spacing and the degree of periodicity in GAD2+ inhibitory neurons were quantitatively similar to those obtained for vGlut1+ excitatory neurons.
Fig. S1.
Immunolabeling of excitatory and inhibitory neurons with specific markers. (A-1 and A-2) Hippocampal neurons were fixed at DIV 10 and immunostained against vGlut1 (A-1: an excitatory neuron maker) as well as MAP2 (A-2: green) and βII spectrin (A-2: red). The specificity of vGlut1 staining is evident from the fluorescent intensity contrast observed between the arrow-marked neurons and other neurons in the field of view (A-1). (B-1 and B-2) Similar to A-1 and A-2 except that the neurons were immunostained against parvalbumin, an inhibitory neuron marker. (C-1 and C-2) Similar to A-1 and A-2 except the neurons were immunostained against GAD2, an inhibitory neuron marker. (Scale bar: 50 µm.)
Fig. 1.
The MPS structure is present in both excitatory and inhibitory neurons from mouse cortex, midbrain, and hippocampus. Cultured neurons were immunostained with vGlut1 or GAD2 to label the excitatory and inhibitory neurons, respectively. (A) Reconstructed conventional image of a vGlut1+ cortical neuron shown together with 3D STORM images of βII spectrin in an axonal (A-1) and dendritic (A-2) region. The axonal (A-1) and dendritic (A-2) regions correspond to the regions indicated by arrows in A. Dotted lines in A-2 indicate patches of periodic pattern in the dendritic shaft. In 3D STORM images, localizations at different z values are depicted in different colors. (B, B-1, and B-2) Similar to A, A-1, and A-2 but for a GAD2+ cortical neuron. (C) Averaged autocorrelation functions calculated from multiple, randomly selected axonal (black) and dendritic (red) regions in neurons cultured from cortex (n = 18 for axons and n = 9 for dendrites of GAD2+ neurons; n = 9 for axons and n = 8 for dendrites of vGlut1+ neurons), midbrain (n = 8 for axons and n = 7 for dendrites of GAD2+ neurons; n = 13 for axons and n = 11 for dendrites of vGlut1+ neurons), and hippocampus (n = 6 for axons and n = 8 for dendrites of GAD2+ neurons; n = 8 for axons and n = 9 for dendrites of vGlut1+ neurons), respectively. (Scale bar: 20 µm for conventional images and 2 µm for STORM images.)
Fig. S2.
βII spectrin is organized into a periodic structure in both excitatory and inhibitory neurons from mouse cortex. Cultured neurons from mouse cortex were immunostained with vGlut1 or GAD2 to label the excitatory and inhibitory neurons, respectively. (A) Reconstructed conventional image of a vGlut1+ cortical neuron. (A-1 and A-2) 3D STORM images of βII spectrin in an axonal (A-1) and dendritic (A-2) region indicated by arrows in A. (Right panels) Autocorrelation functions of the selected boxed regions in the STORM images. (B, B-1, and B-2) Similar to A, A-1, and A-2 but for a GAD2+ inhibitory neuron. (Scale bar: 20 µm for conventional images and 2 µm for STORM images.)
Fig. S3.
βII spectrin is organized into a periodic structure in both excitatory and inhibitory neurons from mouse hippocampus. Cultured neurons from mouse hippocampus were immunostained with vGlut1 or GAD2 to label the excitatory and inhibitory neurons, respectively. (A) Reconstructed conventional image of a vGlut1+ hippocampal neuron. 3D STORM images of βII spectrin in an axonal (A-1) and dendritic (A-2) region indicated by arrows in A. (Right panels) Autocorrelation functions of the selected boxed regions in the A-1 and A-2 STORM images. (B, B-1, and B-2) Similar to A, A-1, and A-2, but for a GAD2+ inhibitory neuron. (Scale bar: 20 µm for conventional images and 2 µm for STORM images.)
Fig. S4.
βII spectrin is organized into a periodic structure in both excitatory and inhibitory neurons from mouse midbrain. Cultured neurons from mouse midbrain were immunostained with vGlut1 or GAD2 to label the excitatory and inhibitory neurons, respectively. (A) Reconstructed conventional image of a vGlut1+ midbrain neuron. (A-1 and A-2) 3D STORM images of βII spectrin in an axonal (A-1) and dendritic (A-2) region indicated by arrows in A. (Right panels) Autocorrelation functions of the selected boxed regions in the A-1 and A-2 STORM images. (B, B-1, and B-2) Similar to A, A-1, and A-2 but for a GAD2+ inhibitory neuron. (Scale bar: 20 µm for conventional images and 2 µm for STORM images.)
In contrast, βII spectrin exhibited a much less regular distribution in dendritic shafts from the same neurons: unlike in axons, where βII spectrin adopted a long-range, periodic pattern throughout nearly the entire axonal shaft, the βII spectrin distribution exhibited a periodic pattern only occasionally in a small fraction of dendritic shafts, often as short, isolated patches (Fig. 1A-2 and Figs. S2A-2 and S4 A-2 and B-2). This observation is similar to what we observed previously in mouse hippocampal neurons (16). The average amplitudes of the autocorrelation functions derived from many randomly selected segments of dendrites were much smaller than those observed for axons in both excitatory and inhibitory neurons from all three brain regions (Fig. 1C), quantitatively showing that the degree of periodicity in dendrites was much less than that in axons.
The MPS Structure Is Present in Multiple Specific Subtypes of Excitatory and Inhibitory Neurons in the Mouse Central Nervous System.
The proteins vGlut1 and GAD2 are general markers for glutamatergic excitatory and GABAergic inhibitory neurons, respectively. Next, we selected some morphologically and functionally distinct subtypes of excitatory and inhibitory neurons from the mouse brain for further investigation. Specifically, for excitatory neurons, we imaged cerebellar granule cells, dopaminergic neurons from the midbrain, and pontine nuclei excitatory neurons. For inhibitory neurons, we imaged Golgi cells and Purkinje cells from cerebellum, as well as Parvalbumin-positive cells from the cortex, midbrain, and hippocampus. Granule cells and Purkinje cells were chosen because of their distinct morphologies. Granule cells are among the smallest cells in the brain, and Purkinje cells are unique in their large size and elaborate dendritic branches (24). Dopaminergic neurons release the neurotransmitter dopamine and represent a type of excitatory neuron distinct from glutamatergic neurons (24). Parvalbumin cells belong to a specific subtype of GABAergic inhibitory neurons (24). In addition, we imaged olfactory neurons from the olfactory bulb.
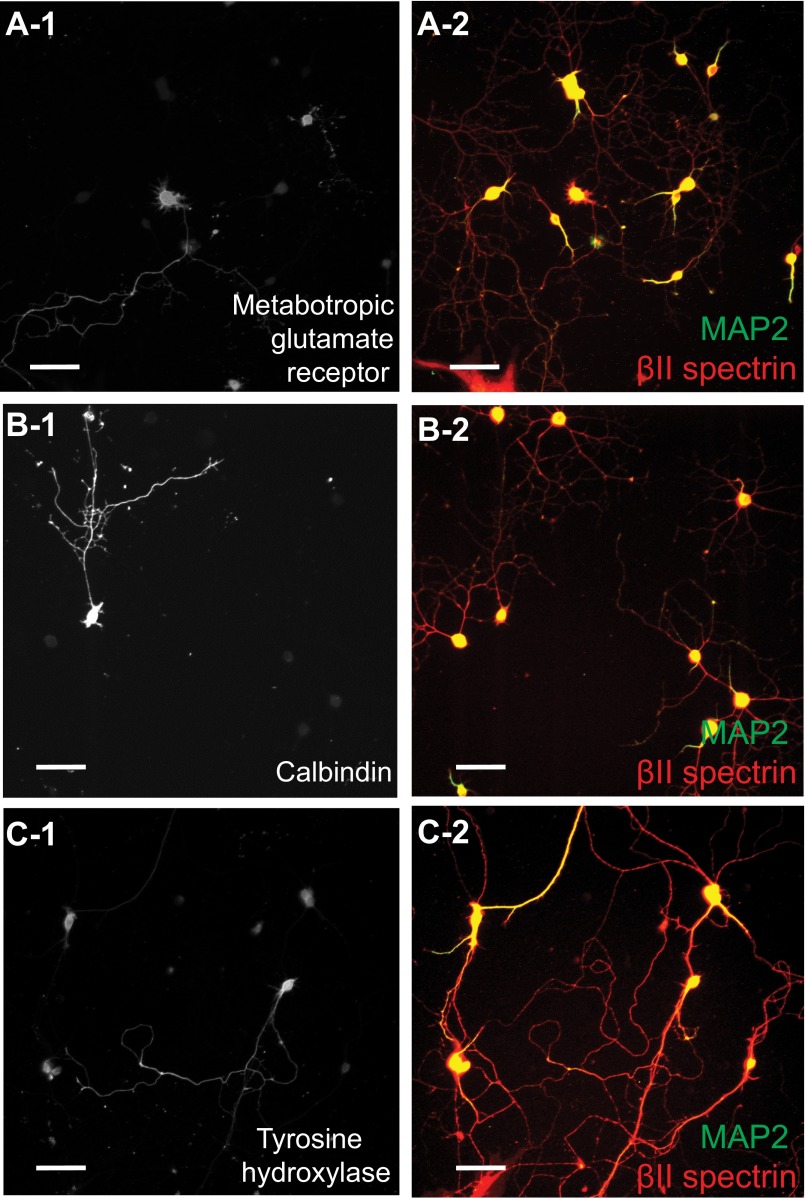
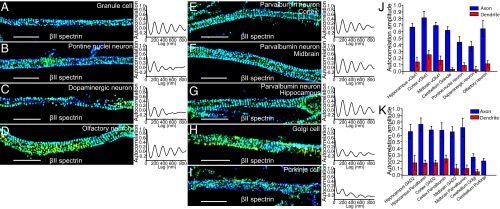
Cultured dopaminergic neurons, olfactory neurons, Golgi cells, Purkinje cells, and Parvalbumin cells were identified using immunostaining against tyrosine hydroxylase (25), olfactory marker protein (26), metabotropic glutamate receptors (27), calbindin (28), and parvalbumin, respectively (Figs. S1 and S5), whereas granule cells cultured from cerebellum were distinguished by their lack of calbindin staining and relatively small soma size. We also used the general neuronal markers MAP2 and NeuN to exclude glial cells from our analysis. All neuronal subtypes were cultured for at least 10 d in vitro until a distinctly long axon had projected from the soma to ensure sufficient axon specification. The neurons were then fixed and immunostained with βII spectrin for STORM imaging. Axons were again distinguished from dendrites by either their morphology or lack of MAP2 staining. As shown in Fig. 2 A–I, all of these neuronal subtypes exhibited a periodic distribution of βII spectrin in their axons with a spacing of ∼190 nm. Autocorrelation analyses showed that the degree of periodicity (i.e., autocorrelation amplitude) was similar among most of these excitatory and inhibitory neurons (Fig. 2 J and K). Two exceptions were Golgi and Purkinje cells, which showed less regularity (Fig. 2 H, I, and K). This is probably due to a relatively slow development process for these cultured cerebellar neurons as evidenced by less elaborate dendrites observed for these neurons in vitro (29, 30). In addition, all of these specific neuronal subtypes showed a substantially higher propensity for MPS formation in axons with only occasional presence of periodic patterns in dendrites; concordantly, quantitative autocorrelation analyses showed substantially lower average autocorrelation amplitudes in dendrites (Fig. 2 J and K). Together, our data suggest that the MPS structure is prevalent in morphologically and functionally diverse excitatory and inhibitory neuronal types.
Fig. S5.
Identification of some specific subtypes of neurons from mouse central nervous system using specific markers. Neurons from different regions of the central nervous system were cultured for at least 10 days in vitro and then immunostained with a specific neuronal marker (A-1, B-1, and C-1) as well as MAP2 (green; A-2, B-2, and C-2) and βII spectrin (red; A-2, B-2, and C-2). (A-1 and A-2) Golgi cells from cerebellum are marked by metabotropic glutamate receptor staining. (B-1 and B-2) Purkinje cells from cerebellum are marked by calbindin staining. (C-1 and C-2) Dopaminergic neurons from midbrain are marked by tyrosine hydroxylase staining. (Scale bar: 50 µm.)
Fig. 2.
MPS is present in multiple subtypes of inhibitory and excitatory neurons in the mouse central nervous system. (A–I) Representative STORM images of βII spectrin for a typical axonal region (Left panels in A–I) and averaged autocorrelation functions from multiple axons (Right panels A–I) for cultured cerebellar granule cells (A; n = 7 for averaged autocorrelation calculation), Pontine nuclei neurons (B; n = 7), dopaminergic neurons (C; n = 9), olfactory neurons (D; n = 16), Parvalbumin neurons from cortex (E; n = 9), Parvalbumin neurons from midbrain (F; n = 6), Parvalbumin neurons from hippocampus (G; n = 13), Golgi cells (H; n = 8), and Purkinje cells (I; n = 7) from cerebellum. (J and K) Averaged autocorrelation amplitudes of axons (blue) versus dendrites (red) for the neuronal subtypes we imaged in the mouse central nervous system. Error bars are SEM. (Scale bar: 2 µm.)
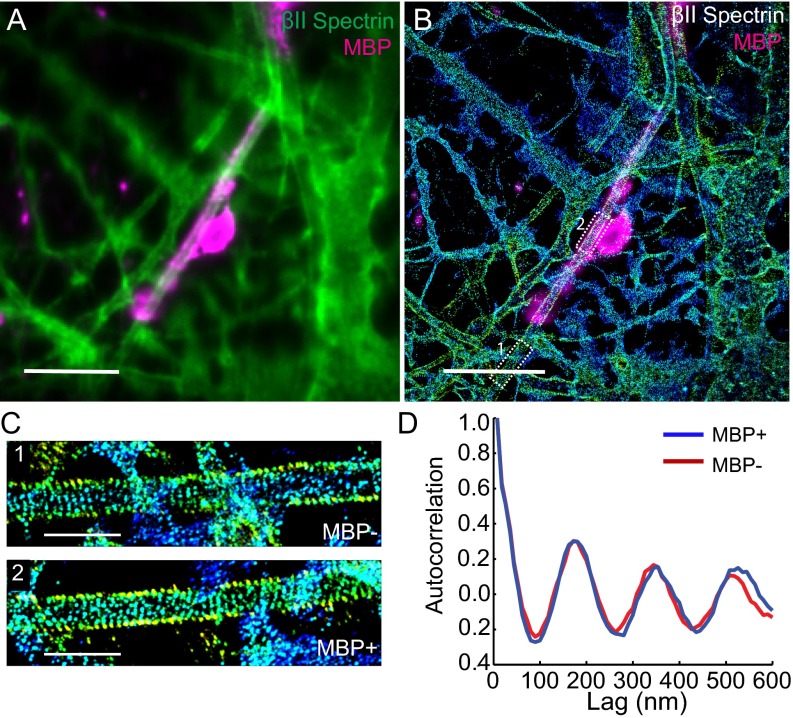
As many neurons are myelinated in the brain, we next examined whether myelination had any effect on the formation of MPS using a previously developed neuron–glia coculture system (31). Myelin sheaths were identified using an antibody against myelin basic protein (MBP). As shown by STORM images and autocorrelation analysis, βII spectrin was periodically distributed in both MBP-positive and MBP-negative axonal segments with a nearly identical degree of periodicity (Fig. S6), suggesting that myelination has little impact on the formation of the periodic membrane skeleton in vitro, consistent with the observation of the periodic structure in myelinated sciatic nerves (23).
Fig. S6.
In vitro myelination does not affect the formation of the MPS structure. Hippocampal neurons were cultured for 2 wk before adding the glia cells. After coculturing for 6 wk, the cells were fixed and immunostained with βII spectrin (green) and MBP (myelination marker, magenta). (A) Conventional image of neurons showing a myelinated axon (shown in magenta). (Scale bar: 10 µm.) (B) 3D STORM image of βII spectrin in the same area as in A. The myelin sheath was shown in magenta and imaged at the conventional resolution. βII spectrin adopts a highly periodic structure in both the myelinated and unmyelinated regions along the axon. (Scale bar: 10 µm.) (C) Zoom-in 3D STORM image of βII spectrin from the two boxed regions from B). (Scale bar: 2 µm.) (D) Averaged autocorrelation functions of βII-spectrin distribution calculated from multiple MBP+ and MBP− axons (n = 7 each).
The MPS Structure Is Present in Mouse Peripheral Sensory and Motor Axons.
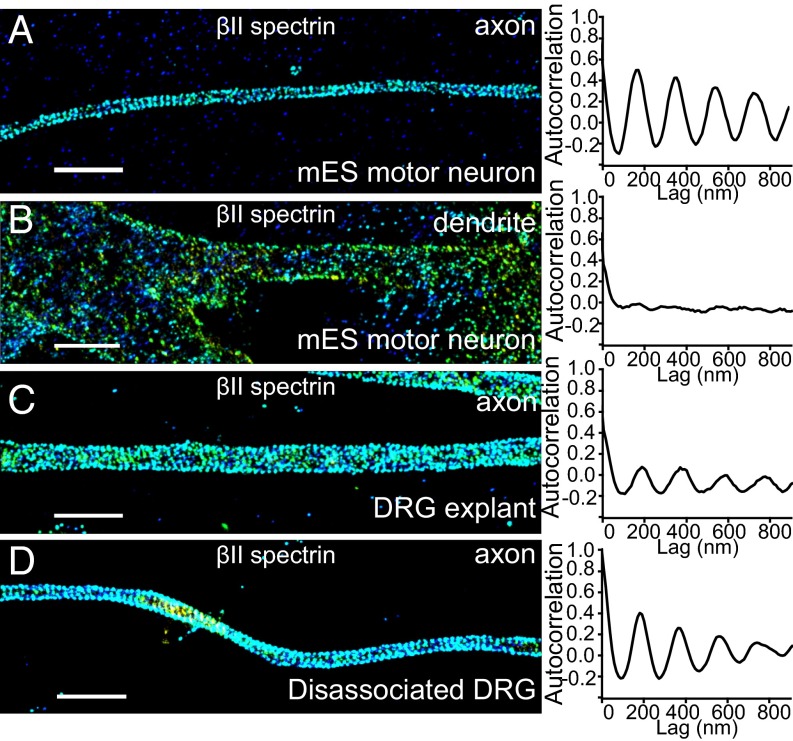
The aforementioned results were all from neurons restricted to the mouse central nervous system. We next examined whether MPS was also present in peripheral neurons by studying two representative types: motor neurons and dorsal root ganglia (DRG) sensory neurons. Motor neurons were derived from mouse embryonic stem (mES) cells, and differentiated motor neurons were identified by Hb9 staining (32). βII spectrin was again detected by immunostaining and STORM imaging. The distribution of βII spectrin was highly periodic in the axons, but mostly nonperiodic in the dendrites of mES-derived motor neurons (Fig. 3 A and B). Different from motor neurons, DRG sensory neurons are pseudounipolar neurons that have axons but lack dendrites (24). We imaged immunostained βII spectrin in explants of DRG sensory neurons (Fig. 3C) and in dissociated DRG sensory neurons (Fig. 3D); the periodic distribution of βII spectrin was clearly evident in the axons of these neurons as well.
Fig. 3.
MPS is present in mouse peripheral sensory and motor axons. (A) Representative STORM images of βII spectrin for a typical axonal region (Left) and averaged autocorrelation functions from multiple axons (Right, n = 12) for mES-derived motor neurons. (B) Same as in A but for dendrites in mES-derived motor neurons (n = 11). (C and D) Same as A but for axons in DRG neurons (C, explants, n = 13; D, dissociated DRG culture, n = 10). (Scale bar: 2 µm.)
The Distribution of βII Spectrin in Presynaptic Boutons and Dendritic Spine Necks.
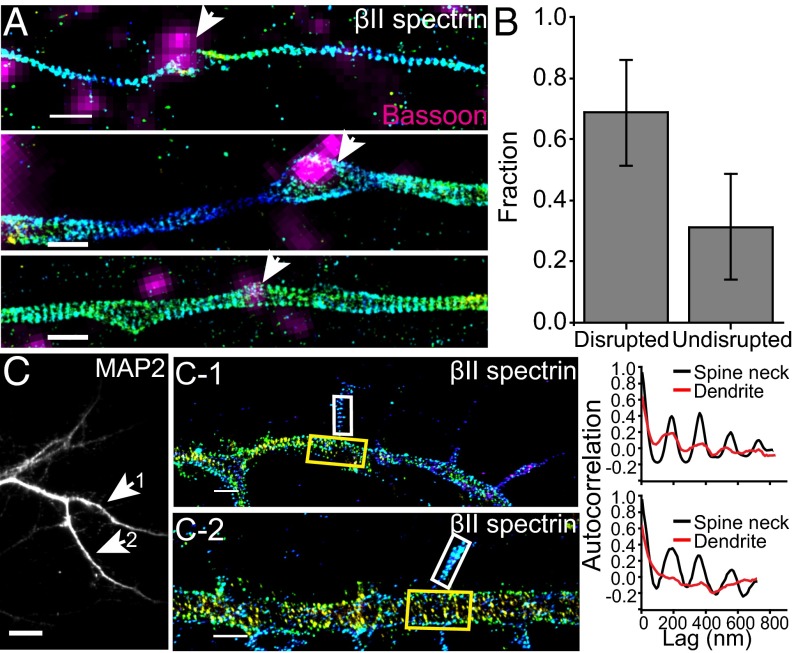
We next extended our investigation to two neuronal compartments in axons and dendrites related to synapses: axonal boutons (presynaptic) and dendritic spines (postsynaptic). Spectrin is expressed in synapses and plays important roles in synapse stabilization and spine morphogenesis (8, 33, 34). To image βII spectrin in presynaptic boutons, we transiently expressed a GFP-tagged βII spectrin (or GFP-tagged αII spectrin) construct (16) in a sparse subpopulation of cultured hippocampal neurons, immununolabeled GFP-tagged spectrin with anti-GFP, and performed STORM imaging at day in vitro (DIV) 14. The presynaptic boutons were marked by immunofluorescence of Bassoon and imaged at the diffraction-limited resolution. Such transient expression was performed to allow for the spectrin labeling in only a sparse subset of neurons, thereby preventing the presynaptic spectrin signal from being obscured by postsynaptically distributed spectrin. Interestingly, despite the presence of MPS in nearly all axons, the periodic structure was disrupted at most (∼70%) of the presynaptic sites imaged (Fig. 4 A and B). Next, we imaged βII spectrin distribution in the dendritic spines of cultured hippocampal neurons at DIV 18, using immunofluorescence against endogenous βII spectrin, and observed the periodic structure of βII spectrin in a significant fraction (at least 25%) of the spine necks (Fig. 4C). Notably, the periodic pattern was observed even in some of the spine necks stemming from the shaft regions that exhibited an irregular βII spectrin distribution (Fig. 4C-2).
Fig. 4.
The distribution of βII spectrin in axonal boutons and dendritic spines. (A) Representative STORM images of βII spectrin in axons that contain presynaptic boutons marked by a presynaptic marker, Bassoon (magenta). βII spectrin is labeled by expressing GFP-βII spectrin (or GFP-αII spectrin) in a sparse subset of cultured neurons, and hence some bassoon-positive regions do not overlap with the GFP-positive axon. (Top and Middle) Examples of bassoon-positive presynaptic boutons (indicated by arrow) within which the periodic pattern of spectrin is disrupted. (Bottom) An example of bassoon-positive presynaptic bouton (indicated by arrow) within which the period pattern of spectrin is not disrupted. (B) Bar graph depicting relative fraction of boutons in which the periodic structure is disrupted or undisrupted. (C) The dendritic region of a cultured mouse hippocampal neuron immunostained with MAP2, a dendrite marker. (C-1 and C-2) STORM images of two selected regions showing periodic patterns of immunolabeled endogenous βII spectrin in spine necks (Left panels) with autocorrelation functions (Right panels) calculated from the boxed spine neck region (white boxes) and dendritic shaft (yellow boxes). (Scale bar: 10 µm for conventional images and 1 µm for STORM images.)
The Distribution of βII Spectrin in Glial Processes.
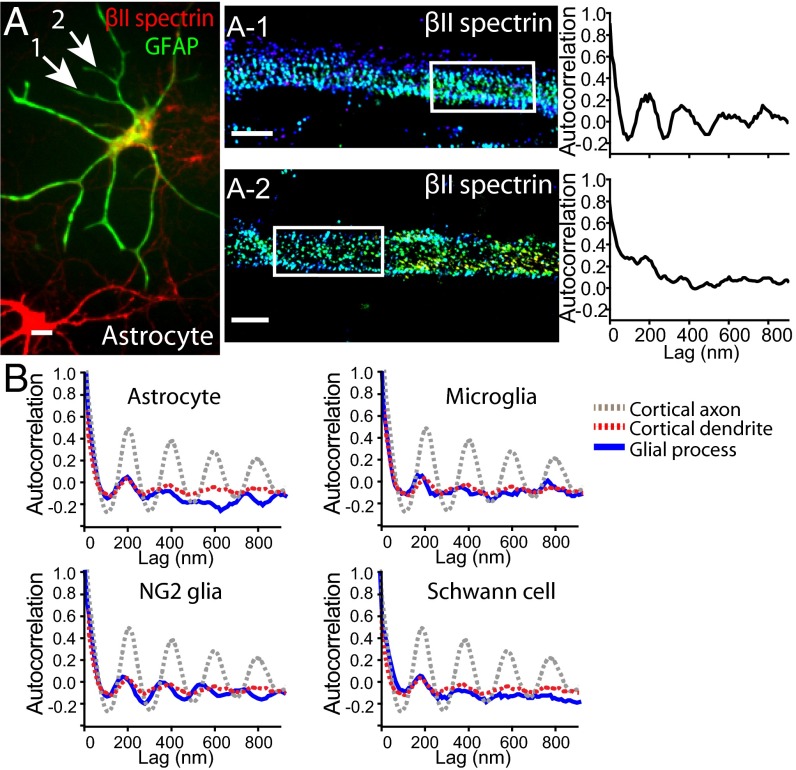
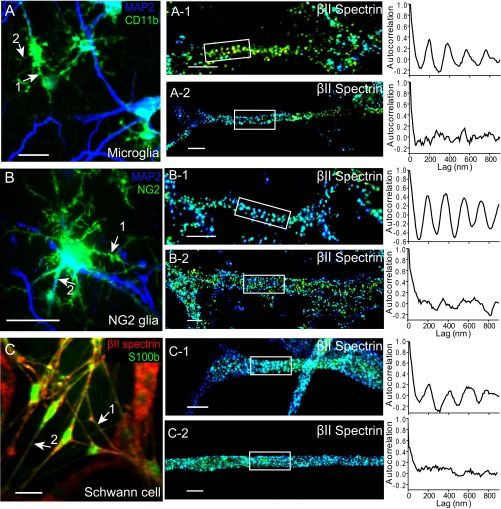
We next examined whether the MPS structure also forms in glial-cell processes. Glial cells express βII spectrin, but at a lower level than neurons (35, 36). We cultured glial cells from mouse brain or rat sciatic nerve tissues, used specific immunomarkers to identify four different glial types, including astrocytes, microglia, NG2 glia, and Schwann cells, and imaged their endogenous βII spectrin distribution using immunolabeling and STORM. The βII spectrin distribution appeared to be largely irregular in most of the processes of all four glial types imaged, although patches of periodic βII spectrin patterns could be observed in a small fraction of these processes (Fig. 5A and Fig. S7), similar to the appearance of βII spectrin in dendrites. Autocorrelation analysis showed that the degree of periodicity of the βII spectrin distributions in the glial-cell processes was similar among all four glial types and also similar to that observed in neuronal dendrites, but much smaller than that observed in neuronal axons (Fig. 5B).
Fig. 5.
Sparse presence of the periodic βII spectrin structure in glial cell processes. (A) An astrocyte stained for the astrocyte marker GFAP (green) and βII spectrin (red). (A-1 and A-2) STORM images of βII spectrin from two processes of that astrocyte (indicated by arrows) displaying relatively periodic (A-1) or irregular (A-2) spectrin distribution. (Right panels) Autocorrelation analysis of the boxed regions. (B) Averaged autocorrelation functions (blue) calculated from multiple randomly selected processes of astrocytes, microglia cells, NG2 glia, and Schwann cells (n = 10 for astrocytes, n = 9 for microglia, n = 8 for NG2 glia, n = 9 for Schwann cells). For comparison, the dotted gray and red curves show the averaged autocorrelation functions of βII spectrin distribution in axons and dendrites of cortical vGlut1+ neurons, respectively (reproduced from Fig. 1C). (Scale bar: 20 µm for conventional image and 1 µm for STORM images.)
Fig. S7.
The distribution of βII spectrin in the processes of microglia, NG2 glia and Schwann cells. (A) Conventional image of neurons and microglial cells stained with the microglia marker CD11b (green) and MAP2 (blue). The microglial cells in the field of view appear green. (A-1 and A-2) Selected 3D STORM images of βII spectrin from the process of a microglial cell (indicated by arrows in A) displaying relatively periodic (A-1) or irregular (A-2) spectrin distribution. (Right) Autocorrelation functions from the boxed regions. (B, B-1, and B-2) Similar to A, A-1, and A-2 but for a NG2+ glial cell labeled by NG2 (green). MAP2 staining is shown in blue. (C, C-1, and C-2) Similar to A, A-1, and A-2 but for Schwann cells labeled with the Schwann cell marker S100b (green). βII-spectrin staining is shown in red. (Scale bar: 20 µm for conventional images and 1 µm for STORM images.)
The MPS Structure Was Observed in Neurons from Multiple Invertebrate and Vertebrate Animal Species.
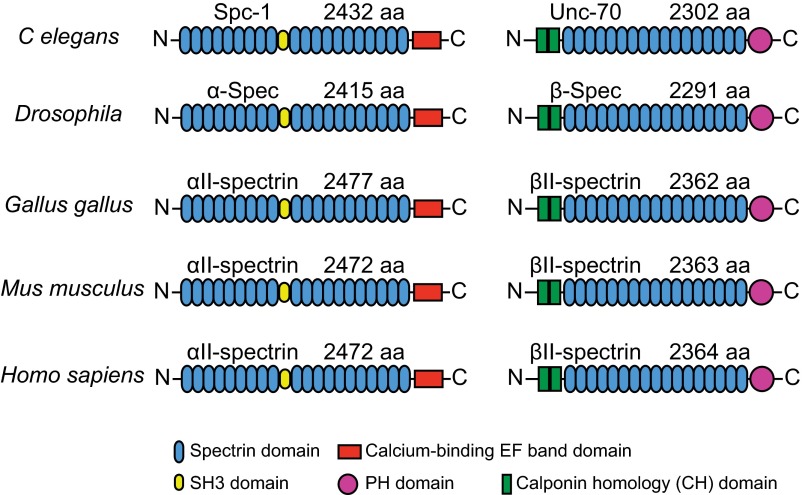
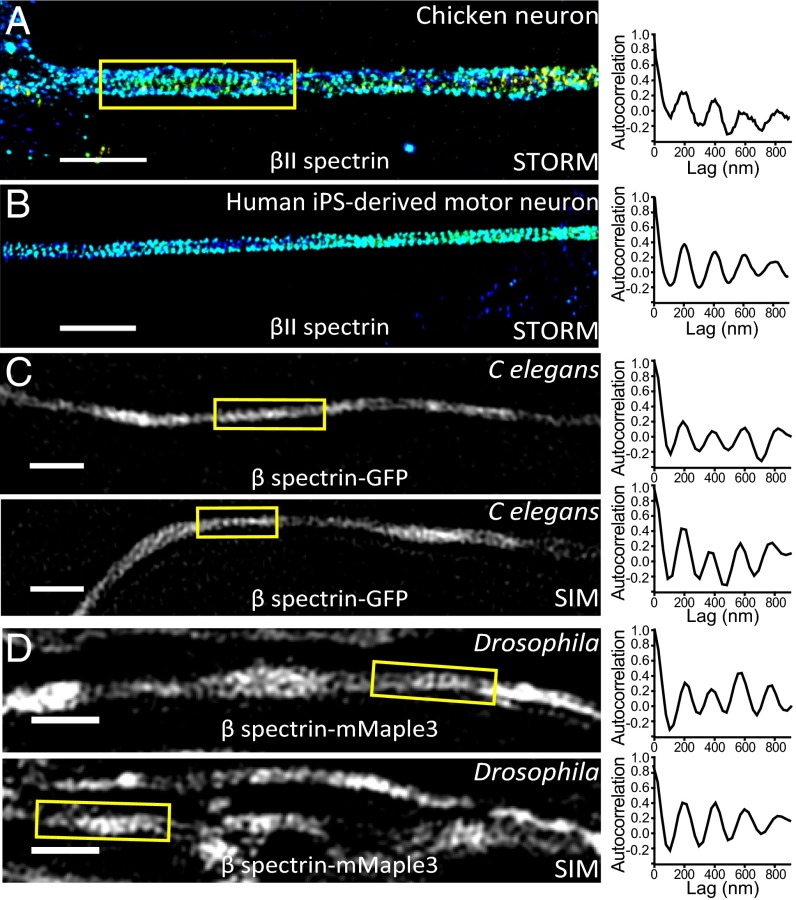
Spectrin tetramers are evolutionarily conserved with the lengths and major structural domains of the αII and βII spectrin homologs preserved across the metazoan kingdom (Fig. S8) (11, 22). Next, we examined whether MPS can also form in other animal species in addition to rodents. We first studied two additional vertebrate species, Gallus gallus (chicken), a nonmammalian vertebrate, and H. sapiens. We examined the endogenous βII spectrin distribution using immunofluorescence labeling and STORM imaging in cultured chicken neurons and human induced pluripotent stem (iPS) cell-derived motor neurons. βII spectrin exhibited a long-range, periodic pattern along the axonal shafts with a spacing of ∼190 nm in both chicken neurons and human iPS-derived motor neurons (Fig. 6 A and B). Next we extended our studies to two invertebrate systems: C. elegans and Drosophila. To this end, we created fluorescent fusion proteins of β spectrin for C. elegans (UNC-70) and Drosophila (dβ-spectrin) and overexpressed these fusion constructs with neuronal-specific promotors in C. elegans and in glutamatergic neurons of Drosophila larva (SI Materials and Methods). We used structure illumination microscopy (SIM) (37) to image these neurons in vivo either in the whole animal (C. elegans) or in brain tissues (Drosophila), rather than in cultured neurons. In both C. elegans and Drosophila neurons, the expressed β-spectrin proteins adopted a periodic structure with a spacing of ∼190–200 nm (Fig. 6 C and D), consistent with the conserved lengths and domain structures of spectrin tetramers across different species. These results indicate that the MPS structure can form not only in vertebrate neurons but also in invertebrate neurons. However, we note that, although overexpression of βII spectrin does not appear to perturb the formation of the MPS structure in rodent axons, such overexpression does promote MPS formation in dendrites of rodent neurons (16). Therefore, future experiments on imaging endogenous spectrin are needed to confirm whether the MPS structure is formed by endogenous proteins in C. elegans and Drosophila. Because spectrin is expressed in many neuronal and nonneuronal cells, the resulting high background makes such imaging experiments difficult using immunofluorescence. Using genome editing to introduce fluorescent tags to the endogenous spectrin in specific populations of neurons provides a promising solution.
Fig. S8.
Structural domain organization of α and β spectrin across different species. The structural domains of αII and βII spectrin homologs, including spectrin domain (blue), SH3 domain (yellow), calcium-binding EF band domain (red), PH domain (magenta), and calponin homology (CH, green) domain from C. elegans, Drosophila, G. gallus, Mus musculus, and H. sapiens. Also shown are the lengths of these proteins in terms of the number of amino acids (aa).
Fig. 6.
The observation of MPS in neurons across different animal species. (A) Representative STORM image of immunolabeled βII spectrin in the axon of a cultured chicken neuron (Left) and the autocorrelation function calculated from the boxed region in this image (Right). (Scale bar: 2 µm.) (B) Representative STORM image of immunolabeled βII spectrin in the axon of a human iPS-derived motor neuron (Left) and the autocorrelation function calculated from this image (Right). (Scale bar: 2 µm.) (C) Two representative SIM images of β spectrin (UNC-70)-GFP in C. elegans neurons imaged directly in the animals (Left), and the corresponding autocorrelation functions of the boxed regions (Right). (Scale bar: 1 µm.) (D) Two representative SIM images of β spectrin-mMaple3 in Drosophila neurons imaged in Drosophila brain tissues (Left) and the corresponding autocorrelation functions of the boxed regions (Right). (Scale bar: 1 µm.)
SI Materials and Methods
All experimental procedures were performed in accordance with the Guide for the Care and Use of Laboratory Animals of the National Institutes of Health. The protocol was approved by the Institutional Animal Care and Use Committee of Harvard University.
Neuronal and Glial Cultures.
To culture neurons from hippocampus, cortex, middle brain, pontine nuclei, cerebellum, basal ganglion, and olfactory bulb, the brain tissues were dissected out from the indicted brain regions of wild-type neonatal embryonic day 18 (E18) mouse embryos (timed pregnant Carworth Farms Swiss Webster mice from Charles River Laboratories). Briefly, the brain tissues were isolated and digested with 0.25% trypsin–EDTA (1×) (T4549, Sigma) at 37 °C for 15 min, washed in HBSS solution (Life Technologies, 14175–079) three times, and then transferred to the NB medium consisting of Neurobasal medium (Life Technologies, 12349–015) supplemented with 37.5 mM NaCl, 2% (vol/vol) B27 supplement (Life Technologies, 17504–044), 1% Glutamax (Life Technologies, 35050–061), and 1% penicillin–streptomycin (Life Technologies, 15140–122). After washing once with NB media, the tissues were pipetted up and down in NB medium until the tissues were mostly dissociated. Dissociated cells were then counted and plated onto poly-d-lysine–coated 12- or 18-mm coverslips (NeuVitro, GG-12–1.5-pdl and GG-18–1.5-pdl). Cerebellum cultures were maintained either in NB medium or in DMEM/F-12 medium (Life Technologies, 11330–057) supplemented with 1% N2 supplement (Life Technologies, 17502–048), 1% Glutamax (Life Technologies, 35050–061), 10 mg/mL gentamicin (Sigma-Aldrich, G1397), and 100 nM tri-iodothyronine (T3; Sigma, T6397), and we observed a modest increase of survival rate for Purkinje cells when cultured in the DMEM/F-12 based medium, as reported previously (30).
Four types of glia cells were imaged. Our neuronal cultures from the central nervous system (cortical neuron culture) contained a small fraction of astrocytes, microglia, and NG2 glia when imaged between 20 and 30 DIV. We used antibodies to specifically identify these glia cells for imaging. Schwann cells were purchased from ScienCell (R1700) and maintained in Schwann Cell Medium (ScienCell, 1701). The dissociated Schwann cells were cultured on poly-d-lysine–coated 18-mm coverslips for 8 d before fixation and imaging analysis.
To culture mouse embryonic stem cell (ESC)-derived motor neurons, mouse ESCs were grown to 70–80% confluence in 10-cm plates (Falcon) in mouse ESC medium. To form embryoid bodies, cells were washed once with PBS and then incubated with 1 mL of 0.25% trypsin (GIBCO) for 5–10 min at room temperature (21–25 °C). Cells were then resuspended in 10 mL of DM1 medium consisting of DMEM:nutrient mixture F-12 (DMEM/F:12, GIBCO, Invitrogen) supplemented with 10% (vol/vol) knockout serum (GIBCO), penicillin, streptomycin, glutamine (GIBCO), and 2-mercaptoethanol (GIBCO), counted and plated at a concentration of 200,000 cells/ml in petri dishes (Falcon). Two days later, embryoid bodies were split from one dish into four petri dishes containing DM1 medium supplemented with RAc (100 nM; stock: 1 mM in DMSO, Sigma) and Shh (300 nM, R&D Systems). Medium was changed after 3–4 d. On day 7 the embryoid bodies were dissociated in single-cell suspensions. The embryoid bodies were pelleted in a 15-mL Falcon tube, washed once with PBS, and incubated in Earle’s balanced salt solution with 20 units of papain and 1,000 units of DNase I (Worthington Biochemical) for 30–60 min at 37 °C. The mixture was then triturated with a 10-mL pipette and centrifuged for 5 min at 300 × g. The resulting cell pellet was washed with PBS and resuspended in F12 medium [F12 medium (GIBCO) with 5% (vol/vol) horse serum (GIBCO), B-27 supplement (GIBCO), N2 supplement (GIBCO)] supplemented with neurotrophic factors (GDNF, CNTF, NT3, and BDNF (10 ng/mL, R&D Systems). The cells were counted and plated on poly-d-lysine/laminin culture slides (BD Biosciences) and cultured over a layer of primary glial cells using banker methodology.
To culture induced pluripotent stem (iPS) cell lines and differentiate them into motor neurons, iPS cells were maintained on gelatinized tissue-culture plastic on a monolayer of neomycin-selected mouse embryonic fibroblasts (Millipore) in human iPS cell media consisting of DMEM/F:12 (Invitrogen) supplemented with 20% (vol/vol) Knockout Serum Replacer (Invitrogen), 110 μM β-mercaptoethanol (Sigma), l-glutamine and nonessential amino acids (NEAA; Invitrogen), and 20 ng/mL basic fibroblast growth factor (bFGF; Invitrogen). To generate motor neurons, undifferentiated iPS cells were incubated with 10 μM Rho-associated kinase inhibitor Y27632 (Calbiochem) for 2 h, then passaged using trypsin, triturated, and placed into ultra-low adherent culture dishes (Corning) for the seeding of embryoid bodies (EBs). For the first 11 d, cells were kept in suspension in hiPS cell media without bFGF supplement. At day 11, EBs were switched to neural induction medium (DMEM/F:12 supplemented with l-glutamine, NEAA, N2 supplement, Invitrogen). Then at day 12, EBs were incubated using retinoic acid (1 μM, Sigma) and purmorphamine (10 μM, Calbiochem) and kept in induction medium for another 2 wk. Finally, at day 28, EBs were dissociated with 0.05% papain (Wothington), electroporated with HB9 (9Kb)-promoter-GFP when needed using a Lonza Nucleofector, and plated onto poly-d-lysine-laminin–coated (BD Biosciences) glass at 5 × 10 E5 cells/mL. To prepare cells for imaging, cells were allowed to settle on glass coverslips that were then flipped over primary glial monolayers to sustain neuronal development and maturity. Plated neurons were cultured in DMEM: F12 medium supplemented with N2, B27 (Invitrogen), retinoic acid (Sigma), d-glucose, and 40 ng/mL of BDNF, GDNF, CNTF, and NT3. Medium was changed every other day, and all iPS-derived motor neurons were kept for a period of 1–4 wk.
For sensory neuron cultures, eight-well chambered coverglass slides (LabTech) were coated with 40 μg/mL of poly-d-lysine at room temperature overnight and then with 1 μg/mL of N-cadherin (R&D) and 5 μg/mL of fibronectin (R&D) at room temperature overnight. DRG were dissected from CD1 mouse embryos at stage E11.5–E12.5 in ice-cold l-15 medium (Gibco). On DIV 0, DRG explants or dissociated DRG neurons were plated in Neurobasal medium supplemented with 2% (vol/vol) B-27, 2 mM glutamine, 100 U/mL penicillin, 100 μg/mL streptomycin, 0.75% glucose, and 20 ng/mL NGF (Promega). Different growth factors were added at the following concentrations: 20 ng/mL NGF (Promega) for TrkA-positive axons, 20 ng/mL BDNF (PeproTech) for TrkB-positive axons, 20 ng/mL NT-3 (PeproTech) for TrkC-positive axons, and 200 ng/mL GDNF (R&D) for Ret-positive axons. On DIV 1, a final concentration of 5 μM 5-fluoro-2′-deoxyuridine and 5 μM uridine was added to the cultures to suppress the proliferation of nonneuronal cells. All cultures were harvested after DIV 5 for further staining and imaging analysis.
To culture chicken neurons, fertile eggs (Charles River Laboratory, 10100329) were maintained in a ventilated incubator at 38 °C for 11 d. We then dissected the cortex and dissociated the neurons using the same protocol as for mouse neurons. Chicken neuronal cultures were maintained in a chicken tissue culture medium consisting of Basal Medium Eagles with 2.5% (vol/vol) FCS, supplemented with chicken embryo extract (Charles River Laboratory, 10100802).
In Vitro Myelination Culture.
The protocol for myelin induction in a neuron–glia coculture was modified from a previously reported procedure (31). Briefly, hippocampal neurons from E18 rat brains were dissociated, seeded as described above, and maintained in NB medium. After 2 wk in vitro, we harvested glia cells from the cerebellum of E18 rats, and ∼100,000 glia cells were seeded onto each 18-mm coverslip containing ∼60,000 hippocampal neurons. The neuron–glia cocultures were later maintained in the coculture medium. To make 40 mL coculture medium, 19.5 mL Neurobasal media (Life Technologies, 12349–015) and 19.5 mL DMEM–high glucose media (Life Technologies, 11965–082) were mixed and supplemented with 400 μL Glutamax (Life Technologies, 35050–061), 400 μL 100 mM sodium pyruvate (Life Technologies, 11360–070), 400 μL 0.5 mg/mL insulin (Sigma-Aldrich, I6634), 400 μL 100× Sato, 400 μL 100× T3, 800 μL B-27 (Life Technologies, 17504–044), 40 μL 5 mg/mL N-acetyl cysteine (Sigma-Aldrich, A8199), 40 μL 10 μg/mL biotin (Sigma-Aldrich, B4639), and 40 μL 1000× Cellgro Trace Element B (Life Technologies, MT99-175-C1). The cocultures were fed twice a week with freshly made coculture medium until STORM imaging.
Antibodies.
The following primary antibodies were used in this study: guinea pig anti-MAP2 antibody (Synaptic Systems, 188002); mouse anti-βII spectrin antibody (BD Biosciences, 612563); rabbit anti-GFP antibody (Abcam, ab290); guinea pig anti-vGlut1 antibody (Synaptic Systems, 135304); rabbit anti-calbindin antibody (Swant, CB38); rabbit anti-tyrosine hydroxylase antibody (Abcam, ab6211); rabbit anti-GAD2 antibody (Synaptic Systems, 198103); rabbit anti-GAD1/GAD2 antibody (Abcam ab11070); goat anti-parvalbumin antibody (Santa Cruz, sc-7449); rabbit anti-parvalbumin antibody (Abcam, ab11427); rabbit anti-metabotropic glutamate receptor antibody (Abcam, ab6438); rat anti-MBP antibody (Millipore, Mab386); rabbit anti-OMP antibody (Santa Cruz, sc-67219); rabbit anti-NG2 antibody (Millipore, AB5320); rabbit anti-CD11b (Novus Biologicals, NB110-89474); rabbit anti-S100b (Abcam, ab41548); rabbit anti-GFAP (Encor, RPCA-GFAP), and rabbit anti-NeuN (Millipore, MABN140). The following secondary antibodies were used in this study: Alexa Fluor 647 donkey anti-mouse (Invitrogen, A31571), Alexa Fluor 647 donkey anti-rabbit (Invitrogen, A31573), Alexa Fluor 568 donkey anti-rabbit (Invitrogen, A10042), Alexa Fluor 488 donkey anti-rabbit (Invitrogen, A21206), Alexa Fluor 488 goat anti-guinea pig (Invitrogen, A11073), Alexa Fluor 568 donkey anti-goat (Invitrogen, A11057). For STORM imaging, Alexa Fluor 647 donkey anti-mouse (Invitrogen, A31571) or secondary antibodies custom-labeled with Alexa Fluor 647 and Alexa Fluor 405 (39) were used.
Immunofluorescence.
Cultured neurons were fixed at various days in vitro between DIV 10 and 18, as indicated in the main text, using 4% (wt/vol) paraformaldehyde in PBS for 15–30 min. Fixed neuron samples were then permeabilized with 0.2% vol/vol Triton X-100 in PBS for 5 min and blocked in blocking buffer (3% wt/vol BSA in PBS) for 1 h and subsequently stained with primary antibodies in blocking buffer overnight at 4 °C . The samples were washed three times and then stained with secondary antibodies (described above) in blocking buffer for ∼1 h at room temperature.
STORM Imaging.
The STORM setup was based on an Olympus IX-71 inverted optical microscope as described previously (40). A 405-nm (CUBE 405–50C; Coherent) and a 657-nm (RCL-300–656; CrystaLaser) laser were introduced into the sample through the back port of the microscope. A translation stage allowed the laser beams to be shifted toward the edge of the objective so that the emerging light reached the sample at incidence angles slightly smaller than the critical angle of the glass-water interface, thus illuminating only the fluorophores within a few micrometers of the coverslip surface. T660LPXR (Chroma) was used as the dichroic mirror, and an ET705/72M band-pass filter (Chroma) was used as the emission filter. For 3D STORM imaging, a cylindrical lens was inserted into the imaging path so that images of single molecules were elongated in x and y for molecules on the proximal and distal sides of the focal plane (relative to the objective), respectively (14).
The sample was imaged in PBS buffer containing 100 mM cysteamine, 5% (wt/vol) glucose, 0.8 mg/mL glucose oxidase (Sigma-Aldrich), and 40 μg/mL catalase (Roche Applied Science). During imaging, continuous illumination of 657-nm laser (∼2 kW/cm2) was used to excite fluorescence from Alexa Flour 647 molecules and switched them into the dark state. Continuous illumination of the 405-nm laser was used to reactivate the fluorophores to the emitting state. The power of the activation lasers (typical range 0–1 W/cm2) was adjusted during image acquisition so that, at any given instant, only a small, optically resolvable fraction of the fluorophores in the sample was in the emitting state.
A typical STORM image was generated from a sequence of about 20,000–40,000 image frames at a frame rate of 60 Hz. The recorded STORM movie was analyzed according to previously described methods (13, 14). The centroid positions and ellipticities of the single-molecule images provided lateral and axial positions of each activated fluorescent molecule, respectively (14). Superresolution images were reconstructed from the molecular coordinates by depicting each location as a 2D Gaussian peak. Autocorrelation analyses were performed on the molecule list of selected imaging areas, as described (12, 16). The autocorrelation amplitude is defined as the difference between the first peak and the average of the two first valleys of the autocorrelation curve.
SIM Imaging for C. elegans and Drosophila.
Transgenic C. elegans expressing GFP-tagged UNC-70 (β spectrin) was made using the entire genomic region of unc-70 followed by GFP. The following transgenic strain was generated: wyEx5181 [Pitr-1::unc-70::gfp], injected at 5 ng/ul into N2 Bristol strain worms and maintained on OP50 Escherichia coli nematode growth medium plates. Pitr-1 is a DA9 neuron-specific promoter, although it can also be turned on in a few other neuronal types in C. elegans. The following Drosophila strains were used: OK371-Gal4 and nSyb-Gal4 (Bloomington Drosophila Stock Center). We generated the dβ-Spectrin::mMaple3 construct by Gibson Assembly (New England BioLabs). The Drosophila β-spectrin (construct is a gift from C. Klämbt, Universität Münster, Münster, Germany) was amplified using the following primers: 5ʹ-TTCGTTAACAGATCTGCCAAAACATGACGACGGAC and 3ʹ-ATCCGCGGCTTTTTCTTTAAAGT AAAAAACGATCTG. The mMaple3 sequence was amplified using the following primers: 5ʹ-AAAGAAAAAGCCGCGGATGGTGAGCAAAGGCGAG and 3ʹ-GATCCTCTAGAGGTACCTACTT ATAGAGTTCGTCCATGC (41). The resulting fragments were then subcloned into the pUAST vector using NotI and KpnI restriction endonucleases (New England BioLabs), and transgenic flies were generated using standard methods by BestGene Inc.
To image C. elegans neurons, we fixed C. elegans with 4% (wt/vol) PFA for 30 min, washed with PBS twice, and sandwiched the worms between a microscopic slide and a coverslip in PBS for SIM imaging. To image Drosophila neurons, we dissected brains from Drosophila larvae, fixed them with 4% (wt/vol) PFA for 20 min, and washed with PBS twice. Brains were sandwiched between a microscopic slide and a coverslip for SIM imaging. SIM imaging was performed on a Zeiss Elyra Super-Resolution Microscopy in the Center for Biological Imaging at Harvard University. The principle for SIM imaging is described in ref. 37. SIM imaging analyses were performed with the software provided for the Zeiss Elyra system.
Discussion
We have recently discovered that actin, spectrin, and associated molecules form a membrane-associated periodic skeletal structure in the axons of rodent neurons (12). Here, we show that this actin–spectrin-based MPS structure is prevalent in a wide spectrum of neuronal cell types cultured from the rodent central and peripheral nervous systems, including excitatory and inhibitory neurons in cortex, hippocampus, and midbrain, and many specific neuronal subtypes, such as granule cells, pontine nuclei neurons, dopaminergic neurons, olfactory neurons, Parvalbumin cells, Golgi cells, Purkinje cells, motor neurons, and sensory neurons. While we were finalizing this paper, an independent study recently reported the presence of periodic actin structure in several neuronal types in the rodent central and peripheral nervous systems (23), and the list of cell types reported in ref. 23 partially overlap with the neuronal types investigated here. Using specific neuronal markers to distinguish neuronal cell types, we further showed that, in all these neuronal types, the MPS structure preferentially forms in axons compared with dendrites. Interestingly, despite the prevalent presence of MPS in nearly all axons, we showed that this periodic structure is disrupted in most presynaptic boutons. This observation suggests the possibility that MPS may inhibit synapse formation, and thus needs to be disrupted for bouton formation, and that the small fraction of boutons that maintained the periodic structure might be relatively immature synapses. On the other hand, the periodic structure is formed in a significant fraction of dendritic spine necks, including ones that stemmed from the dendritic shafts lacking the MPS structure, suggesting a specific mechanism to promote the formation of this periodic structure in the spine neck. We also examined four types of rodent glial cells, including astrocytes, microglia, NG2 glia, and Schwann cells and observed isolated patches of periodic spectrin distributions in a small fraction of glial-cell processes, consistent with the observation of periodic actin and spectrin distributions in rodent oligodendrocytes (23). It is interesting to note that this periodic structure appeared to be absent in the majority of glial-cell processes in our images, and our quantitative analysis showed that the degree of periodicity for spectrin distributions in glial processes was similar to that observed in neuronal dendrites and much smaller than that observed in neuronal axons. Because the expression level of βII spectrin in glial cells is similar to that in dendrites and lower than that in axons (35, 36), this observation is consistent with the notion that local concentrations of βII spectrin are a key determinant for MPS formation (16). Taken together, these results suggest that the MPS structure might have some tendency to self-assemble, but the axon is a specialized cellular compartment where the MPS structure forms with a much higher propensity. Whether this substantially higher propensity of MPS formation in neuronal axons observed in all examined cultured nervous system cell types can be extended to in vivo systems awaits future investigations. Finally, we found that spectrin is capable of adopting a periodic distribution in neurons from a wide variety of animal species across both invertebrates and vertebrates, ranging from C. elegans to H. sapiens, suggesting that the MPS structure is an evolutionarily conserved structure in neurons across different species. The high prevalence of this structure in the axons of diverse neuronal types and animal species suggests that the actin–spectrin-based MPS is a key functional component of the axon. Indeed, such a periodic skeletal structure formed by actin rings connected by flexible spectrin tetramers provides a robust and flexible support for the axonal membrane, which could be particularly important for maintaining the integrity of axons under mechanical stress and can explain why spectrin depletion results in axon buckling and breakage during animal locomotion (4, 6). The ability of this periodic submembrane skeleton to organize membrane proteins, such as ion channels (12), into a periodic distribution might also impact the generation and/or propagation of action potentials as well as other signaling pathways at the axonal membrane.
Materials and Methods
All experimental procedures were performed in accordance with the Guide for the Care and Use of Laboratory Animals of the National Institutes of Health (38). The protocol was approved by the Institutional Animal Care and Use Committee of Harvard University.
Procedures for cell culture, antibodies, and immunofluorescence are described in SI Materials and Methods. STORM imaging was performed as previously described (12, 14). Briefly, labeled cells were imaged with continuous illumination of a 657-nm laser for imaging and 405 nm for activation of the photoswitchable dyes in an oblique-incidence geometry on an Olympus IX-71 inverted microscope. STORM images were generated from a sequence of about 20,000∼40,000 image frames at a frame rate of ∼60 Hz. SIM imaging (37) was performed on a Zeiss Elyra superresolution microscope at the Center for Biological Imaging at Harvard University. SIM imaging analyses were performed with the provided software for the Zeiss Elyra system. Autocorrelation analyses were performed as previously described (12, 16). The autocorrelation amplitude is defined as the difference between the first peak (at ∼190 nm) and the average of the two first valleys of the autocorrelation curve. See SI Materials and Methods for more details.
Acknowledgments
The preprint of this paper has been posted on bioRxiv (dx.doi.org/10.1101/045856) for discussion and we thank a wide community of colleagues for participating in the discussion. This work is supported in part by the Howard Hughes Medical Institute (X.Z., K.S., and M.R.F.); National Institutes of Health Grants NS089786 (to M.T.-L.), NS048392 (to K.S.), and NS053538 (to M.R.F.); and the ALS Association (T.M.). R.Z. is an HHMI Fellow of the Life Sciences Research Foundation. Z.W. is supported in part by a Bristol-Myers Squibb Postdoctoral Fellowship at the Rockefeller University. X.Z., K.S., and M.R.F. are Howard Hughes Medical Institute investigators.
Footnotes
The authors declare no conflict of interest.
This article contains supporting information online at www.pnas.org/lookup/suppl/doi:10.1073/pnas.1605707113/-/DCSupplemental.
References
- 1.Luo L. Actin cytoskeleton regulation in neuronal morphogenesis and structural plasticity. Annu Rev Cell Dev Biol. 2002;18:601–635. doi: 10.1146/annurev.cellbio.18.031802.150501. [DOI] [PubMed] [Google Scholar]
- 2.Cingolani LA, Goda Y. Actin in action: The interplay between the actin cytoskeleton and synaptic efficacy. Nat Rev Neurosci. 2008;9(5):344–356. doi: 10.1038/nrn2373. [DOI] [PubMed] [Google Scholar]
- 3.Stiess M, Bradke F. Neuronal polarization: The cytoskeleton leads the way. Dev Neurobiol. 2011;71(6):430–444. doi: 10.1002/dneu.20849. [DOI] [PubMed] [Google Scholar]
- 4.Hammarlund M, Jorgensen EM, Bastiani MJ. Axons break in animals lacking beta-spectrin. J Cell Biol. 2007;176(3):269–275. doi: 10.1083/jcb.200611117. [DOI] [PMC free article] [PubMed] [Google Scholar]
- 5.Galiano MR, et al. A distal axonal cytoskeleton forms an intra-axonal boundary that controls axon initial segment assembly. Cell. 2012;149(5):1125–1139. doi: 10.1016/j.cell.2012.03.039. [DOI] [PMC free article] [PubMed] [Google Scholar]
- 6.Krieg M, Dunn AR, Goodman MB. Mechanical control of the sense of touch by β-spectrin. Nat Cell Biol. 2014;16(3):224–233. doi: 10.1038/ncb2915. [DOI] [PMC free article] [PubMed] [Google Scholar]
- 7.Hülsmeier J, et al. Distinct functions of alpha-Spectrin and beta-Spectrin during axonal pathfinding. Development. 2007;134(4):713–722. doi: 10.1242/dev.02758. [DOI] [PubMed] [Google Scholar]
- 8.Pielage J, Fetter RD, Davis GW. Presynaptic spectrin is essential for synapse stabilization. Curr Biol. 2005;15(10):918–928. doi: 10.1016/j.cub.2005.04.030. [DOI] [PubMed] [Google Scholar]
- 9.Tang Y, et al. Disruption of transforming growth factor-beta signaling in ELF beta-spectrin-deficient mice. Science. 2003;299(5606):574–577. doi: 10.1126/science.1075994. [DOI] [PubMed] [Google Scholar]
- 10.Stankewich MC, et al. Cell organization, growth, and neural and cardiac development require αII-spectrin. J Cell Sci. 2011;124(Pt 23):3956–3966. doi: 10.1242/jcs.080374. [DOI] [PMC free article] [PubMed] [Google Scholar]
- 11.Bennett V, Lorenzo DN. Spectrin- and ankyrin-based membrane domains and the evolution of vertebrates. Curr Top Membr. 2013;72:1–37. doi: 10.1016/B978-0-12-417027-8.00001-5. [DOI] [PubMed] [Google Scholar]
- 12.Xu K, Zhong G, Zhuang X. Actin, spectrin, and associated proteins form a periodic cytoskeletal structure in axons. Science. 2013;339(6118):452–456. doi: 10.1126/science.1232251. [DOI] [PMC free article] [PubMed] [Google Scholar]
- 13.Rust MJ, Bates M, Zhuang X. Sub-diffraction-limit imaging by stochastic optical reconstruction microscopy (STORM) Nat Methods. 2006;3(10):793–795. doi: 10.1038/nmeth929. [DOI] [PMC free article] [PubMed] [Google Scholar]
- 14.Huang B, Wang W, Bates M, Zhuang X. Three-dimensional super-resolution imaging by stochastic optical reconstruction microscopy. Science. 2008;319(5864):810–813. doi: 10.1126/science.1153529. [DOI] [PMC free article] [PubMed] [Google Scholar]
- 15.Lukinavičius G, et al. Fluorogenic probes for live-cell imaging of the cytoskeleton. Nat Methods. 2014;11(7):731–733. doi: 10.1038/nmeth.2972. [DOI] [PubMed] [Google Scholar]
- 16.Zhong G, et al. Developmental mechanism of the periodic membrane skeleton in axons. eLife. 2014;3:e04581. doi: 10.7554/eLife.04581. [DOI] [PMC free article] [PubMed] [Google Scholar]
- 17.Jenkins SM, Bennett V. Ankyrin-G coordinates assembly of the spectrin-based membrane skeleton, voltage-gated sodium channels, and L1 CAMs at Purkinje neuron initial segments. J Cell Biol. 2001;155(5):739–746. doi: 10.1083/jcb.200109026. [DOI] [PMC free article] [PubMed] [Google Scholar]
- 18.Yang Y, Ogawa Y, Hedstrom KL, Rasband MN. betaIV spectrin is recruited to axon initial segments and nodes of Ranvier by ankyrinG. J Cell Biol. 2007;176(4):509–519. doi: 10.1083/jcb.200610128. [DOI] [PMC free article] [PubMed] [Google Scholar]
- 19.Leterrier C, et al. Nanoscale architecture of the axon initial segment reveals an organized and robust scaffold. Cell Reports. 2015;13(12):2781–2793. doi: 10.1016/j.celrep.2015.11.051. [DOI] [PubMed] [Google Scholar]
- 20.D’Este E, Kamin D, Göttfert F, El-Hady A, Hell SW. STED nanoscopy reveals the ubiquity of subcortical cytoskeleton periodicity in living neurons. Cell Reports. 2015;10(8):1246–1251. doi: 10.1016/j.celrep.2015.02.007. [DOI] [PubMed] [Google Scholar]
- 21.Lorenzo DN, et al. A PIK3C3-ankyrin-B-dynactin pathway promotes axonal growth and multiorganelle transport. J Cell Biol. 2014;207(6):735–752. doi: 10.1083/jcb.201407063. [DOI] [PMC free article] [PubMed] [Google Scholar]
- 22.Bennett V, Baines AJ. Spectrin and ankyrin-based pathways: Metazoan inventions for integrating cells into tissues. Physiol Rev. 2001;81(3):1353–1392. doi: 10.1152/physrev.2001.81.3.1353. [DOI] [PubMed] [Google Scholar]
- 23.D’Este E, et al. Subcortical cytoskeleton periodicity throughout the nervous system. Sci Rep. 2016;6:22741. doi: 10.1038/srep22741. [DOI] [PMC free article] [PubMed] [Google Scholar]
- 24.Kandel ER. Principles of Neural Science. 5th Ed, 1709 pp McGraw-Hill; New York: 2013. [Google Scholar]
- 25.Daubner SC, Le T, Wang S. Tyrosine hydroxylase and regulation of dopamine synthesis. Arch Biochem Biophys. 2011;508(1):1–12. doi: 10.1016/j.abb.2010.12.017. [DOI] [PMC free article] [PubMed] [Google Scholar]
- 26.Lee AC, He J, Ma M. Olfactory marker protein is critical for functional maturation of olfactory sensory neurons and development of mother preference. J Neurosci. 2011;31(8):2974–2982. doi: 10.1523/JNEUROSCI.5067-10.2011. [DOI] [PMC free article] [PubMed] [Google Scholar]
- 27.Neki A, et al. Metabotropic glutamate receptors mGluR2 and mGluR5 are expressed in two non-overlapping populations of Golgi cells in the rat cerebellum. Neuroscience. 1996;75(3):815–826. doi: 10.1016/0306-4522(96)00316-8. [DOI] [PubMed] [Google Scholar]
- 28.Whitney ER, Kemper TL, Rosene DL, Bauman ML, Blatt GJ. Calbindin-D28k is a more reliable marker of human Purkinje cells than standard Nissl stains: A stereological experiment. J Neurosci Methods. 2008;168(1):42–47. doi: 10.1016/j.jneumeth.2007.09.009. [DOI] [PubMed] [Google Scholar]
- 29.Furuya S, Makino A, Hirabayashi Y. An improved method for culturing cerebellar Purkinje cells with differentiated dendrites under a mixed monolayer setting. Brain Res Brain Res Protoc. 1998;3(2):192–198. doi: 10.1016/s1385-299x(98)00040-3. [DOI] [PubMed] [Google Scholar]
- 30.Tabata T, et al. A reliable method for culture of dissociated mouse cerebellar cells enriched for Purkinje neurons. J Neurosci Methods. 2000;104(1):45–53. doi: 10.1016/s0165-0270(00)00323-x. [DOI] [PubMed] [Google Scholar]
- 31.Gardner A, Jukkola P, Gu C. Myelination of rodent hippocampal neurons in culture. Nat Protoc. 2012;7(10):1774–1782. doi: 10.1038/nprot.2012.100. [DOI] [PMC free article] [PubMed] [Google Scholar]
- 32.Arber S, et al. Requirement for the homeobox gene Hb9 in the consolidation of motor neuron identity. Neuron. 1999;23(4):659–674. doi: 10.1016/s0896-6273(01)80026-x. [DOI] [PubMed] [Google Scholar]
- 33.Pielage J, Fetter RD, Davis GW. A postsynaptic spectrin scaffold defines active zone size, spacing, and efficacy at the Drosophila neuromuscular junction. J Cell Biol. 2006;175(3):491–503. doi: 10.1083/jcb.200607036. [DOI] [PMC free article] [PubMed] [Google Scholar]
- 34.Gao Y, et al. β-III spectrin is critical for development of purkinje cell dendritic tree and spine morphogenesis. J Neurosci. 2011;31(46):16581–16590. doi: 10.1523/JNEUROSCI.3332-11.2011. [DOI] [PMC free article] [PubMed] [Google Scholar]
- 35.Goodman SR, Lopresti LL, Riederer BM, Sikorski A, Zagon IS. Brain spectrin(240/235A): A novel astrocyte specific spectrin isoform. Brain Res Bull. 1989;23(4-5):311–316. doi: 10.1016/0361-9230(89)90214-1. [DOI] [PubMed] [Google Scholar]
- 36.Susuki K, et al. Schwann cell spectrins modulate peripheral nerve myelination. Proc Natl Acad Sci USA. 2011;108(19):8009–8014. doi: 10.1073/pnas.1019600108. [DOI] [PMC free article] [PubMed] [Google Scholar]
- 37.Gustafsson MG, et al. Three-dimensional resolution doubling in wide-field fluorescence microscopy by structured illumination. Biophys J. 2008;94(12):4957–4970. doi: 10.1529/biophysj.107.120345. [DOI] [PMC free article] [PubMed] [Google Scholar]
- 38. Committee for the Update of the Guide for the Care and Use of Laboratory Animals (2011) Guide for the Care and Use of Laboratory Animals (National Academies Press, Washington, DC), 8th Ed, p XXV.
- 39.He J, et al. Dual function of CD81 in influenza virus uncoating and budding. PLoS Pathog. 2013;9(10):e1003701. doi: 10.1371/journal.ppat.1003701. [DOI] [PMC free article] [PubMed] [Google Scholar]
- 40.Jones SA, Shim SH, He J, Zhuang X. Fast, three-dimensional super-resolution imaging of live cells. Nat Methods. 2011;8(6):499–508. doi: 10.1038/nmeth.1605. [DOI] [PMC free article] [PubMed] [Google Scholar]
- 41.Wang S, Moffitt JR, Dempsey GT, Xie XS, Zhuang X. Characterization and development of photoactivatable fluorescent proteins for single-molecule-based superresolution imaging. Proc Natl Acad Sci USA. 2014;111(23):8452–8457. doi: 10.1073/pnas.1406593111. [DOI] [PMC free article] [PubMed] [Google Scholar]


