

Abstract
Background
RNA viruses are characterized by high rate of mutations mainly due to the lack of proofreading repair activities associated with its RNA-dependent RNA-polymerase (RdRp). In case of arboviruses, this phenomenon has lead to the existence of mixed population of genomic variants within the host called quasi-species. The stability of strains within the quasi-species lies on mutations that are positively selected which in turn depend on whether these mutations are beneficial in either or both hosts. Coevolution of amino acids (aa) is one phenomenon that leads to establishment of favorable traits in viruses and leading to their fitness.
Results
Fourteen CHIKV clinical samples collected over three years were subjected to RT-PCR, the four non-structural genes amplified and subjected to various genetic analyses. Coevolution analysis showed 30 aa pairs coevolving in nsP1, 23 aa pairs coevolving in nsP2, 239 in nsP3 and 46 aa coevolving pairs in nsP4 when each non-structural protein was considered independently. Further analysis showed that 705 amino acids pairs of the non-structural polyproteins coevolved together with a correlation coefficient of ≥0.5. Functional relevance of these coevolving amino acids in all the nonstructural proteins of CHIKV were predicted using Eukaryotic Linear Motifs (ELMs) of human.
Conclusions
The present study was undertaken to study co-evolving amino acids in the non-structural proteins of chikungunya virus (CHIKV), an important arbovirus. It was observed that several amino acids residues were coevolving and shared common functions.
Keywords: Chikungunya virus, Coevolution, Nonstructural proteins, Eukaryotic linear motifs
Background
Coevolution at the molecular level is an established phenomenon exhibited by organisms in order to optimize their physiological performance and serve as an effective determinant of fitness [1, 2]. Coevolution refers to synchronized changes that organisms or proteins undergo and can occur with respect to pathogen-host [3], as well as within the organism [4, 5], often revealing functional coordination regarding the interacting pairs. One of the most compelling examples of coevolution of host and pathogen can be witnessed in the retrovirus, mainly because of their tolerance to mutagenesis [6]. Studies in HIV have shown that drug resistance is manifested by coevolution of proteins in the virus under drug selective pressure [7, 8]. Selection advantage of coevolution may ultimately result in recombination events [9].
Chikungunya virus (CHIKV) is a re-emerging arbovirus belonging to family Togaviridae. Known to exist as mixed populations of genomic variants, known as quasispecies, these variants confer phenotypic plasticity and adaptability to new environments [10, 11]. In spite of this, strong purifying selection plays a role in evolution of arboviruses [12]. Owing to its complicated life cycle that includes its survival in two disparate hosts, one invertebrate and the other vertebrate, several studies have be devoted to understand arbovirus fitness determinants [13–15] including host-specific fitness benefits [16, 17].
Owing to their small genome sizes, viruses lack the machinery for their replication and other processes and are mostly dependent on the host for these functions. In order to perform their functions, viruses have mastered motif mimicry based hijacking strategy wherein small motifs of the virus mimic host protein motifs. Recognized as Eukaryotic Linear Motif (ELM) or mini motif or Short Linear Motif (SLiM), these linear motifs function independent of the tertiary structure of the host protein and are also needed for post-translational modifications, cell signaling, cellular trafficking and play important role in virus maturation [18, 19].
A recent study describes homologous recombination in CHIKV where non-structural protein nsP3 is reported to be site for recombination [20]. The current study was undertaken to study the coevolving aa in the replication machinery of CHIKV, namely the non-structural proteins, nsP1, nsP2, nsP3 and nsP4. Further, using Eukaryotic Linear Motifs (ELM) [18], we predicted the functional relevance of the coevolving aa pairs. The results obtained in the present study revealed important intra-molecular coevolving aa residues of the replication complex of CHIKV. The study provided insights to functional significance of some of the coevolving aa with respect to human protein motifs.
Methods
Sample collection
Fourteen patients from Safdarjung Hospital, New Delhi were recruited for the present study after obtaining their informed consent (Table 1). Blood was drawn from these patients, sera separated and subjected to ELISA for testing the presence of chikungunya virus IgM antibodies using IgM capture ELISA kits supplied by National Institute of Virology (NIV), Pune. The sera samples were amplified once in C6/36 cells and once in VERO cells.
Table 1.
Details of chikungunya samples used in the study
| CHIKV ID | Year of sample collection | IgM status | RT-PCR |
|---|---|---|---|
| IND-10-DEL1 | 2010 | Negative | Positive |
| IND-10-DEL2 | 2010 | Negative | Positive |
| IND-10-DEL3 | 2010 | Negative | Positive |
| IND-10-DEL4 | 2010 | Negative | Positive |
| IND-10-DEL5 | 2010 | Negative | Positive |
| IND-10-DEL6 | 2010 | Negative | Positive |
| IND-10-DEL8 | 2010 | Positive | Positive |
| IND-10-DEL9 | 2010 | Negative | Positive |
| IND-10-DEL10 | 2010 | Negative | Positive |
| IND-10-DEL11 | 2010 | Positive | Positive |
| IND-10-DEL12 | 2010 | Negative | Positive |
| IND-11-DEL01 | 2011 | Negative | Positive |
| IND-12-DEL02 | 2012 | Negative | Positive |
| IND-12-DEL15 | 2012 | Not Done | Positive |
VNA extraction, RT-PCR, cloning and plasmid sequencing
Viral nucleic acid (VNA) was extracted from the stored samples using High Pure Viral Nucleic Acid kit (Roche, Germany). Non-structural genes of CHIKV (nsP1, nsP2, nsP3 and nsP4) were amplified individually using Titanium One–step RT-PCR Kit (Clontech, USA), using primers listed in Table 2. The whole genome of CHIKV was amplified for three samples using gene specific primers (Table 2). The amplified products were purified using SureExtract PCR clean up/gel extraction kit (Nucleopore, India), cloned in pGEM-T Easy vector and sequenced. The sequences have been submitted to NCBI (GenBank) with Accessions numbers KU365282-KU365292.
Table 2.
Primers used for gene amplification
| Primer name | Sequence |
|---|---|
| nsP1 FP | GTAATGGATCCTGTGTACGTGG |
| nsP1 RP | TGCACCCGCTCTGTCCT |
| nsP2 FP | GTAATGGGAATAATAGAGACTCCGAGA |
| nsP2 RP | TCCTGCTCGGGTGGCCTG |
| nsP3 FP | GTAATGGGATGTGCACCGTCGTACCGG |
| nsP3 RP | TTACTCGTCGTCCGTGTCTG |
| nsP4 FP | GTAATGGGACGACTAGACAGGGCAGGTG |
| nsP4 RP | AGGACCGCCGTACAAAGTTA |
| E1 FP | GTAATGGCGTACGAACACGTAACAG |
| E1 RP | TTAGTGCCTGCTGAACGACAC |
| E2 FP | GTAATGGGAAGCACCAAGGACAACTTCAAT |
| E2 RP | TTTAGCTGTTCTGATGCAGC |
| E3 FP | GTAATGGGATGGAGTCTTGCCATCCCAGT |
| E3 RP | GCGTCGCTGGCGGTGG |
| Capsid FP | GTAATGGAGTTCATCCCAACCC |
| Capsid RP | CTCTTCGGCTCCCTCAG |
| 6K FP | GTAATGGCGGCCACATACCAAGAG |
| 6K RP | GCTCACAGTGTGGGCAC |
Sequence and phylogenetic analysis
CHIKV gene sequences were trimmed and taken for further analysis. Phylogenetic analysis of 14 sequences of Delhi samples and 195 available complete genome and non-structural polyprotein sequences (nsP1, nsP2, nsP3 and nsP4) of CHIKV was performed using MEGA version 6 [21] MAFFT [22] was used to perform multiple aa sequence alignment. For the construction of phylogenetic tree, neighbor-joining algorithm and Poisson distribution distance model were utilized. Reliability of the analysis was evaluated using bootstrap test with 1500 replications. Amino acid sequence analysis was performed on all the nonstructural proteins of all Delhi strains and compared with the sequences from India and rest of the world available in various public databases.
Molecular sequence evolution analysis
All analysis involved 196 aa sequences (consisting of one consensus sequence representing all Delhi samples and 195 already available sequences). MEGA 6 software was used to conduct Evolutionary analyses using the Poisson correction model. The rate variation among sites was modeled with a gamma distribution (shape parameter = 1). Substitution pattern and rates were estimated under the Jones-Taylor-Thornton [23] model (+G). A discrete Gamma distribution was used to model evolutionary rate differences among sites (5 categories, [+G]). Mean evolutionary rates of substitutions per site in these categories and the aa frequencies were also calculated. For estimating Maximum likelihood (ML) values, a tree topology was automatically computed. The maximum Log likelihood for this computation was also calculated. Nucleotide diversity and Tajima test statistic [24] were deduced using MEGA6 and the selection pressure on polyprotein was deduced.
Coevolution analysis
Coevolution analysis of the replication complex of chikungunya virus was done using Coevolution analysis using Protein Sequences (CAPS) [25] software (considering default setting for intra-molecular coevolution analysis without making use of any structural information (as there is no structural information present for chikungunya virus proteins in the public domain). It was used to identify groups of coevolving pairs with correlation coefficient >0.5 (Correlation Value). All the aa within each group coevolving with all the others within the same group were identified. Cytoscape [26] was used to generate networks of coevolving aa sites.
Eukaryotic Linear Motifs (ELM) analysis
Eukaryotic Linear Motifs (ELM) of all the non-structural proteins of chikungunya virus (CHIKV) were predicted separately using Eukaryotic Linear Motif resource server (ELM). As the virus purified from clinical samples were sequenced and used in this study, we predicted human’s linear motifs in CHIKV non-structural proteins. The ELM GO terms were retrieved from the ELM database and were used for predicting functional significance of the coevolving pairs. Currently, the database has 1594 ELM instances of Homo sapiens and GO terms related to these instances. The motif probability cutoff was taken as 100 (default value) and Homo sapiens was selected as the preferred species to predict the conserved peptide linear motif of human in chikungunya virus non-structural proteins. The motifs were filtered based on cell compartment terms. The ELMs with p-value ≤ 0.001 were considered for further analysis.
Results
Patient samples were collected from Delhi region, India for three consecutive years 2010-2012. The year 2010 saw a major outbreak of chikungunya in Delhi following which there has been a steady decline of cases. The 14 samples used in this study were mainly IgM negative (n = 11), while two samples were IgM positive and IgM status was not available for one sample. All the 14 samples were positive for CHIKV by Real-Time Quantitative Reverse Transcription PCR (qRT-PCR). The samples were passaged once each in C6/36 and VERO cells; the nsPs amplified end to end, cloned in pGEM-T easy vectors and sequenced using Sanger’s dideoxy sequencing. The sequences were trimmed and aligned with 195 nsPpolyprotein sequences from the Genbank database. A total of 29 sequences from Indian strains and 166 sequences from across the globe were taken for further analysis.
Sequence and phylogenetic analysis of Delhi samples
Amino acid sequence analysis was performed on the complete gene sequences of nsP1 (535aa), nsP2 (798aa), nsP3 (530aa), nsP4 (611aa). It was observed that all the sequences were high level of identity (99 %) amongst each other. With respect to the East/Central/South African (ECSA) prototype, S27, several variations were observed in the Delhi sequences. The nsPs sequences from other parts of the country, namely, Andhra Pradesh, Gujarat, Karnataka, Kerala, Maharashtra, Rajasthan, Tamil Nadu and West Bengal were also taken for this analysis. In-depth aa sequences analysis highlighted a total of 25 variations in the non-structural proteins. Details of all the mutations are provided in Table 3a-d.
Table 3.
Amino acid variations in Delhi samples in comparison with ESCA lineage and other Indian samples
| a: Amino acid variations of Delhi samples in nsP1 | ||||||||||||
| Name of protein | Sample Site | 128 | 253 | 314 | 376 | 488 | ||||||
| CHIKV nsp1 | S27- African Prototype | T | K | M | T | Q | ||||||
| Andhra Pradesh | K | K | L/M | M | R | |||||||
| (n = 5) | ||||||||||||
| Gujarat | K | K | L/M | M | R | |||||||
| (n = 5) | ||||||||||||
| Karnataka | K | K | L | M | R | |||||||
| (n = 3) | ||||||||||||
| Kerala | K | K | L/M | M | R | |||||||
| (n = 9) | ||||||||||||
| Rajasthan | K | K | M | M | R | |||||||
| (n = 2) | ||||||||||||
| Tamil Nadu | K | K | M | M | R | |||||||
| (n = 1) | ||||||||||||
| West Bengal | T | T | M | T | Q | |||||||
| (n = 1) | ||||||||||||
| Maharashtra | T/K | T/K | M | M | R | |||||||
| (n = 3) | ||||||||||||
| Delhi | K | K | M | M | R | |||||||
| (n = 14) | ||||||||||||
| b: Amino acid variations of Delhi samples in nsP2 | ||||||||||||
| Name of protein | Sample Site | 48 | 54 | 181 | 237 | 238 | 329 | 374 | 411 | 539 | 708 | 793 |
| CHIKV nsp2 | S27- African Prototype | V | N | V | L | L | K | H | N | L | L | A |
| Andhra Pradesh | V | N | V | L | L | K | Y | N | L | L | V | |
| (n = 5) | ||||||||||||
| Gujarat | V | N | V | L | L | K | Y | N | L | L | V | |
| (n = 5) | ||||||||||||
| Karnataka | V | N | V/A | L | L | K | Y | N | L | L | V | |
| (n = 3) | ||||||||||||
| Kerala | A/V | N | V | R/L | P/L | E/K | Y | D/N | L/S | P/L | V | |
| (n = 9) | ||||||||||||
| Rajasthan | V | N | V | L | L | K | Y | N | L | L | V | |
| (n = 2) | ||||||||||||
| Tamil Nadu | V | N | V | L | L | K | Y | N | L | L | V | |
| (n = 1) | ||||||||||||
| West Bengal | V | S | V | L | L | K | H | N | L | L | A | |
| (n = 1) | ||||||||||||
| Maharashtra | V | S/N | V | L | L | K | H/Y | N | L | L | V/A | |
| (n = 3) | ||||||||||||
| Delhi | V | N | V | L | L | K | Y | N | L | L | V | |
| (n = 14) | ||||||||||||
| c: Amino acid variations of Delhi samples in nsP3 | ||||||||||||
| Name of protein | Sample Site | 175 | 217 | 341 | 353 | 501 | ||||||
| CHIKV nsp3 | S27- African Prototype | V | Y | T | I | L | ||||||
| Andhra Pradesh | I | H | T/M | I | L | |||||||
| (n = 5) | ||||||||||||
| Gujarat | I | H | T | I | S/L | |||||||
| (n = 5) | ||||||||||||
| Karnataka | I | H | T | I | S/L | |||||||
| (n = 3) | ||||||||||||
| Kerala | I | H | T | I | L | |||||||
| (n = 9) | ||||||||||||
| Rajasthan | I | H | T | I | L | |||||||
| (n = 2) | ||||||||||||
| Tamil Nadu | I | H | M | I | L | |||||||
| (n = 1) | ||||||||||||
| West Bengal | V | Y | T | T | L | |||||||
| (n = 1) | ||||||||||||
| Maharashtra | I/V | Y/H | T | I/T | L | |||||||
| (n = 3) | ||||||||||||
| Delhi | I | H | T | I | L | |||||||
| (n = 14) | ||||||||||||
| d: Amino acid variations of Delhi samples in nsP4 | ||||||||||||
| Name of protein | Sample Site | 43 | 85 | 90 | 235 | |||||||
| CHIKV nsp4 | S27- African Prototype | A | R | S | Q | |||||||
| Andhra Pradesh | A | R | S | Q | ||||||||
| (n = 5) | ||||||||||||
| Gujarat | A | R | S | Q | ||||||||
| (n = 5) | ||||||||||||
| Karnataka | A | R | S | Q | ||||||||
| (n = 3) | ||||||||||||
| Kerala | A | R | S | Q | ||||||||
| (n = 9) | ||||||||||||
| Rajasthan | A | R | S | Q | ||||||||
| (n = 2) | ||||||||||||
| Tamil Nadu | A | R | S | Q | ||||||||
| (n = 1) | ||||||||||||
| West Bengal | L | K | A | R | ||||||||
| (n = 1) | ||||||||||||
| Maharashtra | L/A | K/R | A/S | R/Q | ||||||||
| (n = 3) | ||||||||||||
| Delhi | A | R | S | Q | ||||||||
| (n = 14) | ||||||||||||
Phylogenetic analysis of the samples for all the nsPs revealed that they belonged to ECSA I subgroup 1 that belongs to Indian Ocean Lineage (IOL) (Fig. 1).
Fig. 1.
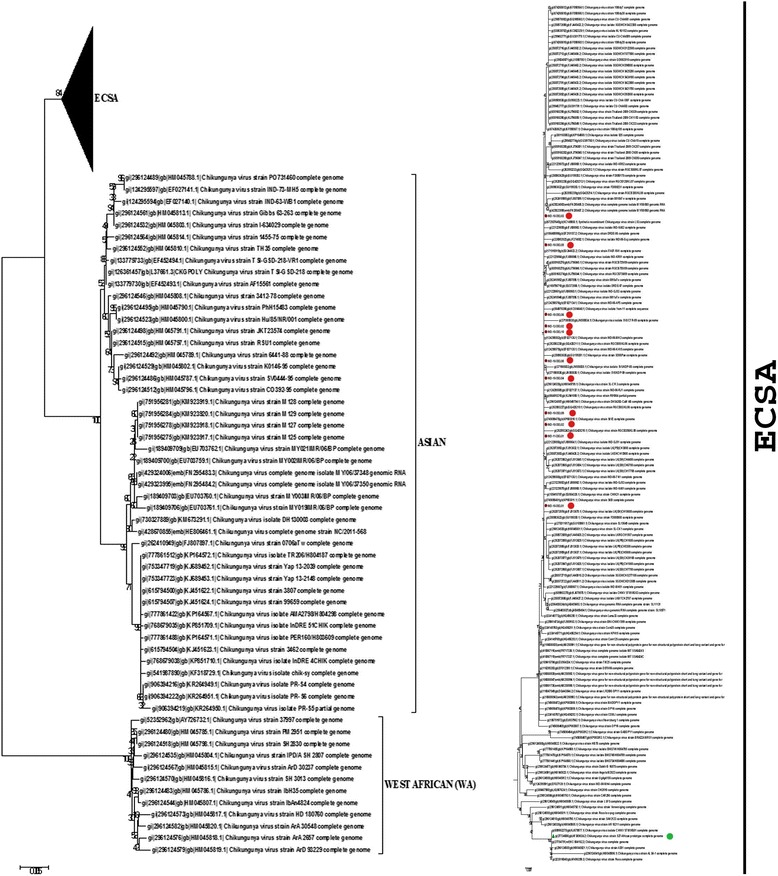
Phylogenetic analysis of nsPs. Total 209 nsP sequences (14 of CHIKV Delhi samples and 195 available in public domain) were aligned using MEGA 6.0 software to construct phylogenetic tree based on Neighbor-joining algorithm and Poisson distribution distance model. Bootstrap values were kept 1500 to ensure reliability. a Phylogenetic analysis of the Delhi sequences was done and its placement in CHIKV genotype group was determined. b Inset of ECSA clade. All samples used for the study belonged to the ECSA clade.  : represent samples from Delhi region and
  : represents S27- African Prototype used as control for the study
Estimation of evolutionary parameters based on phylogenetic analysis
Evolutionary parameters of two ECSA subgroups with the Delhi samples were checked using pairwise genetic divergence between groups. The analysis confirmed the occurrence of Delhi samples in the ECSA subgroup 1 as the genetic divergence between the two groups was 0.001 ± 0.000. Similarly the genetic divergence between ECSA subgroup 2 and Delhi samples was observed to be 0.010 ± 0.002.
Furthermore, overall value of the shape parameter for discrete Gamma Distribution was estimated to be 0.2609. Mean evolutionary rates in these categories were 0.00, 0.03, 0.21, 0.83, 3.93 substitutions per site. The aa frequencies are 7.69 % (A), 5.11 % (R), 4.25 % (N), 5.13 % (D), 2.03 % (C), 4.11 % (Q), 6.18 % (E), 7.47 % (G), 2.30 % (H), 5.26 % (I), 9.11 % (L), 5.95 % (K), 2.34 % (M), 4.05 % (F), 5.05 % (P), 6.82 % (S), 5.85 % (T), 1.43 % (W), 3.23 % (Y), and 6.64 % (V). Also, for estimating maximum Log likelihood (ML) values, a tree topology was automatically computed. The ML for this computation was -4169.220. Neutrality of mutation in sequence sequences was determined using Tajima’s Neutrality Test (Table 4). Negative Tajima test statistic signifies an excess of low frequency polymorphisms, indicating population size expansion (e.g., after a bottleneck or a selective sweep) and/or purifying selection.
Table 4.
Tajima’s neutrality test
| M (number of sequences) | S (Number of segregating sites | ps (ps = S/n) | Θ (Θ = ps/a1) | Π (nucleotide diversity) | D (Tajima test statistics) |
|---|---|---|---|---|---|
| 196 | 112 | 0.111888 | 0.019656 | 0.011574 | -1.29759 |
Coevolution analysis
Coevolution analysis was performed using multiple sequence alignment of both individual non-structural proteins (nsPs) and polyprotein of the complete nsPs. A total of 209 sequences, 195 CHIKV sequences present in the public domain and 14 CHIKV sequences obtained from Delhi was used in this analysis. The first round of analysis involved the complete sequences to identify the coevolving pairs. Subsequently, the mutation status of these pairs was examined in the Delhi samples. Details of the analysis for each of the nsPs and the whole polyprotein are described below.
nsP1: nsP1 has 535 aa (aa) and the whole protein was taken for coevolution analysis. It was observed that 30 aa pairs involving 23 aa residues coevolved at a correlation >0.5, of which, seven aa pairs showed a correlation of 0.9-1.0 (Fig. 2a). Mutations were seen in all aa pairs coevolving with a correlation of 0.9-1.0. With respect to individual residues, aa residue at position three had the maximum number of five partners, of which, the most significant correlation (>0.9) was seen with aa residue 472(R).
nsP2: nsP2 has 798 aa (aa) and the whole protein was taken for coevolution analysis. It was observed that 23 aa pairs involving 18 aa residues coevolved at a correlation >0.5, of which, seven aa pairs showed a correlation of 0.9-1.0 (Fig. 2b). Mutations were observed in all aa pairs that coevolved at a correlation >0.9. With respect to individual residues, aa residue at position 170 had the maximum number of five partners, of which, the most significant correlations (>0.9) were seen with aa residue 510(K) and 463(S).
nsP3: nsP3 has 530 aa (aa) and the whole protein was taken for coevolution analysis. It was observed that 239 aa pairs involving 41 aa residues coevolved at a correlation >0.5, of which, 49 aa pairs showed a correlation of 0.9-1.0 (Fig. 2c). Mutations were seen in all aa pairs with a correlation of 0.9-1.0. With respect to individual residues, aa residue at position 361 had the maximum number of 18 partners, of which, the most significant correlations (>0.9) was seen with seven aa residue (Fig. 2c)
nsP4: nsP4 has 661 aa (aa) and the whole protein was taken for coevolution analysis. It was observed that 46 aa pairs involving 21 aa residues coevolved at a correlation >0.5, of which, 19 aa pairs showed a correlation of 0.9-1.0 (Fig. 2d). It was observed that all these 19 aa pairs were found mutated with respect to the Delhi samples. With respect to individual residues, aa residue at position 15 had the maximum number of nine partners, of which, the most significant correlations (>0.9) was seen with five aa residue (Fig. 2d)
Polyprotein: The entire polyprotein of the non-structural proteins has 2475 amino acid (aa) and was taken for coevolution analysis. It was observed that 705 aa pairs involving 138 aa residues coevolved at a correlation >0.5, of which, 232 aa pairs showed a correlation of 0.9-1.0 (Fig. 3). It is noteworthy that nsP3 has the highest number of coevolving residues i.e. 27 followed by 18, 16 and 13 coevolving residues in nsP4, nsP2 and nsP1 respectively. With respect to individual residues, aa residue at position 519 of nsP1 and at position 999 of nsP2 had the maximum number of 19 and 18 partners respectively coevolving at the most significant correlations (>0.9) (Fig. 3).
Fig. 2.
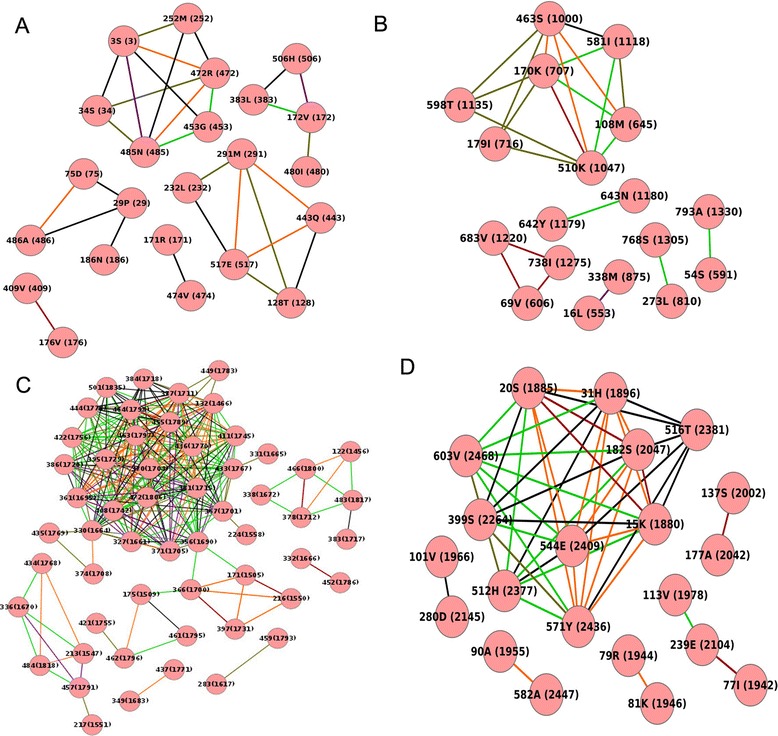
Coevolution analysis of nsPs. a-d MSA of all CHIKV nsP sequences (total 209) were analyzed using CAPS software to study coevolving aa within individual nsPs. Mutated aa pairs with correlation value above 0.5 were used for construction of network using Cytoscape software. Edge color varies with correlation value: red (1.0), orange (~0.9), purple (~0.8), light green (~0.7), black (~0.6) and dark green (~0.5). Node names include aa residue positions in individual nsP (as well as in polyprotein)
Fig. 3.
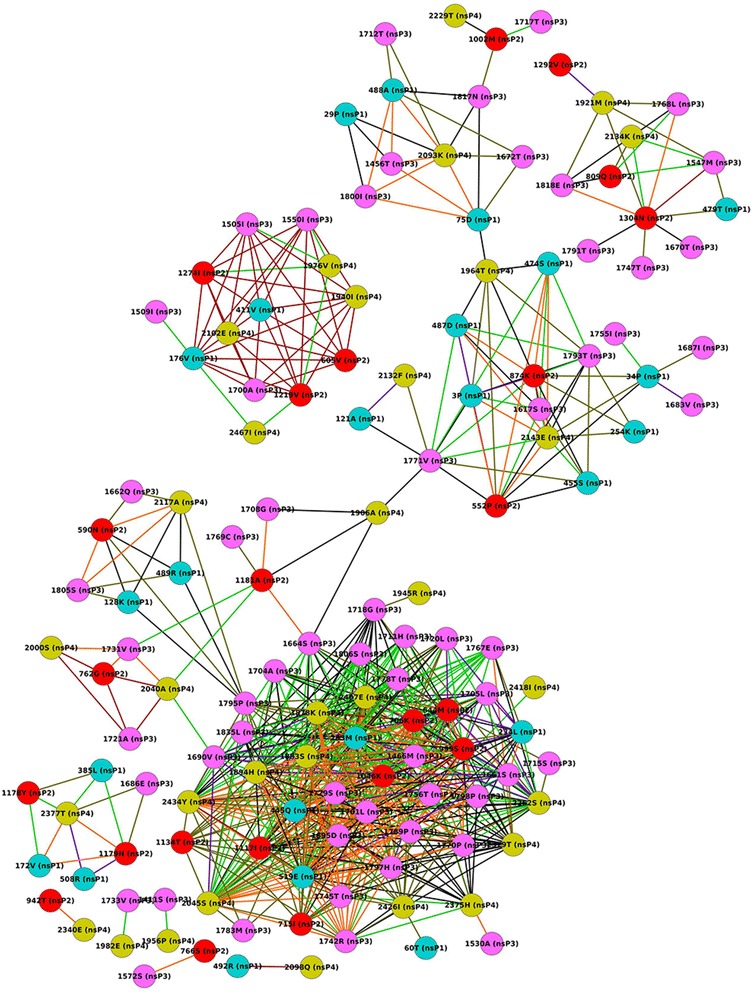
Coevolution analysis of non-structural polyprotein. Complete polyprotein was analyzed for inter-molecular coevolving aa residues using CAPS software and network was generated similarly using Cytoscape software. Edge color varies with correlation value: red (1.0), orange (~0.9), purple (~0.8), light green (~0.7), black (~0.6) and dark green (~0.5) and individual nsPs have been differently colored (nsP1: blue, nsP2: red, nsP3: pink, nsP4: green)
ELM studies
The linear motifs in this study were predicted using The Eukaryotic Linear Motif resource for Functional Sites in Proteins web server. The ELM instances present in the database are classified under different classes. In total, there are 240 different classes of motif with 2700 experimentally validated classes, like cleavage sites (CLV), Degradation sites (DEG), Docking sites (DOC), Ligand binding sites (LIG), Post-translational modification sites (MOD) and Targeting sites (TRG). The ELMs of all non-structural proteins of CHIKV were predicted and further correlated with the intra-molecular coevolving sites of each non-structural protein. For the sake of stringency and functional relevance, coevolving sites with correlation cutoff value ≥ 0.9 were only used for deducing their functional significance. The results of the aa residues of coevolving pair and their respective ELMs are shown in Table 5a-d. After filtering, total of seven pairs of coevolving residues of nsP1, fifteen pairs of nsP2, 83 pairs of nsP3 and 27 coevolving pairs of nsP4 were used for analysis. It is interesting to note that nsP3 despite of being the smallest protein (530 aa) in comparison to other non-structural protein was showing high number of coevolving pairs; this is may be due to the presence of hyper variable region towards its C-terminal. Many common motifs were found between the aa residues of coevolving pair. With respect to nsP1, it was seen that 13 residues with correlation value > =0.9, showed ELMs with the humans (Table 5a). nsP2 has 13 residues (Table 5b), nsP3 showed 23 (Table 5c) and nsP4 has 14 residues (Table 5d) with correlation value above threshold and also has ELMs.
Table 5.
The tables show the predicted ELMs for the coevolving residues along with the coevolving positions of amino acid residue of non-structural proteins of Chikungunya virus. The coevolving amino acid residues are written in the bracket “()”
| a: ELMs for coevolving residues in nsP1 where, | |
| Position (residue) | ELMsa |
| 3(S) | LIG_WD40_WDR5_VDV_1, LIG_LIR_Gen_1, DEG_Nend_UBRbox_2 |
| 75(D) | DRK,CLV_NRD_NRD_1 |
| 172(V) | DOC_MAPK_1 |
| 176(V) | DOC_MAPK_1 |
| 291(M) | MOD_ProDKin_1, MOD_PKA_1, MOD_PKA_1, DOC_WW_Pin1_4 |
| 383(L) | LIG_SH2_STAT5 |
| 409(V) | DOC_CYCLIN_1 |
| 453(G) | MOD_GSK3_1 |
| 472(R) | TRG_LysEnd_APsAcLL_1,DOC_CYCLIN_1, CLV_PCSK_SKI1_1 |
| 485(N) | MOD_GlcNHglycan |
| 486(A) | MOD_GlcNHglycan |
| 506(H) | DEG_APCC_DBOX_1 |
| 517(E) | LIG_TRAF2_1 |
| b: ELMs for coevolving residues in nsP2 | |
| Position (residue) | Motifsb |
| 16(L) | MOD_GSK3_1,LIG_FHA_1 |
| 170(K) | LIG_SH3_1,LIG_SH3_3 |
| 273(L) | DOC_MAPK_1 |
| 338(M) | LIG_SUMO_SIM_par_1 |
| 463(S) | MOD_GSK3_1 |
| 510(K) | MOD_ProDKin_1,LIG_14-3-3_3,DOC_WW_Pin1_4 |
| 54(S) | LIG_Integrin_isoDGR_1 |
| 642(Y) | MOD_NEK2_1,MOD_GlcNHglycan |
| 683(V) | LIG_LIR_LC3C_4,LIG_SUMO_SIM_anti_2 |
| 69(V) | TRG_LysEnd_APsAcLL_1,LIG_SH3_3,LIG_eIF4E_1 |
| 768(S) | MOD_NEK2_1 |
| c: ELMs for coevolving residues in nsP3 | |
| Position (residue) | Motifsc |
| 122(T) | LIG_14-3-3_2,MOD_NEK2_1,MOD_PKA_2 |
| 132(M) | CLV_C14_Caspase3-7,MOD_GSK3_1 |
| 327(S) | LIG_TRAF2_1,MOD_CK1_1,MOD_CK2_1,MOD_GSK3_1,MOD_PKA_2 |
| 330(S) | MOD_GlcNHglycan,LIG_TRAF2_1,MOD_CK1_1,MOD_CK2_1,MOD_GSK3_1,MOD_PKA_2 |
| 332(Q) | MOD_GlcNHglycan,LIG_TRAF2_1,MOD_CK1_1,MOD_CK2_1,MOD_GSK3_1 |
| 349(V) | MOD_PLK |
| 361(D) | CLV_C14_Caspase3-7 |
| 377(H) | MOD_GSK3_1 |
| 378(T) | MOD_GSK3_1 |
| 381(S) | MOD_GSK3_1 |
| 395(S) | LIG_SH3_3 |
| 397(V) | LIG_SH3_3 |
| 408(R) | CLV_PCSK_SKI1_1,MOD_N-GLC_1,DOC_CYCLIN_1,DOC_MAPK_1,MOD_PKB_1,TRG_ER_diArg_1 |
| 411(T) | CLV_PCSK_SKI1_1,MOD_N-GLC_1,DOC_CYCLIN_1,DOC_MAPK_1,MOD_CK2_1,MOD_PKB_1 |
| 434(L) | DEG_APCC_DBOX_1 |
| 436(P) | DEG_APCC_DBOX_1 |
| 437(A) | DEG_APCC_DBOX_1 |
| 452(Q) | DOC_PP2B_LxvP_1 |
| 455(P) | MOD_CK2_1 |
| 462(N) | LIG_SH3_3,MOD_CK1_1 |
| 463(H) | LIG_SH3_3 |
| 464(P) | LIG_EVH1_2,LIG_SH3_3,MOD_GSK3_1 |
| 466(I) | LIG_EVH1_2,MOD_GSK3_1 |
| d: ELMs for coevolving residues in nsP4 | |
| Position (residue) | Motifsd |
| 113(V) | MOD_CK2_1,MOD_GSK3_1,MOD_PKA_2 |
| 137(S) | DOC_USP7_1,MOD_GSK3_1 |
| 15(K) | DOC_MAPK_1,MOD_GSK3_1,MOD_PKA_2 |
| 182(S) | LIG_14-3-3_3,MOD_CK1_1,MOD_GSK3_1 |
| 20(S) | DOC_MAPK_1,MOD_GSK3_1,MOD_PKA_2 |
| 512(H) | MOD_GSK3_1,MOD_NEK2_1 |
| 571(Y) | MOD_CK2_1 |
| 582(A) | LIG_SUMO_SIM_anti_2 |
| 603(V) | DOC_MAPK_1,MOD_NEK2_2 |
| 77(I) | LIG_Actin_WH2_2 |
| 79(R) | CLV_PCSK_FUR_1,DOC_MAPK_1,LIG_Actin_WH2_2 |
| 81(K) | CLV_PCSK_FUR_1,CLV_PCSK_PC1ET2_1,DOC_MAPK_1,LIG_Actin_WH2_2 |
| 90(A) | LIG_FHA_1,LIG_SH2_STAT5,LIG_SH3_3,MOD_ProDKin_1,DOC_WW_Pin1_4 |
a LIG_WD40_WDR5_VDV_1 WDR5 WD40 repeat (blade 5,6)-binding ligand, LIG_LIR_Gen_1 Atg8 protein family ligands, DEG_Nend_UBRbox_2 N-degron, CLV_NRD_NRD_1 NRD cleavage site, DOC_MAPK_1 MAPK docking motifs, MOD_ProDKin_1 MAPK Phosphorylation Site, MOD_PKA_1 PKA Phosphorylation site, DOC_WW_Pin1_4 WW domain ligands, LIG_SH2_STAT5 SH2 ligand, DOC_CYCLIN_1 Cyclin recognition site, MOD_GSK3_1 GSK3 phosphorylation site, TRG_LysEnd_APsAcLL_1 Endosome-Lysosome-Basolateral sorting signals, CLV_PCSK_SKI1_1 PCSK cleavage site, MOD_GlcNHglycan Glycosaminoglycan attachment site, DEG_APCC_DBOX_1 APCC-binding Destruction motifs, LIG_TRAF2_1 TRAF2 binding site
b MOD_GSK3_1 GSK3 phosphorylation site, LIG_FHA_1 FHA phosphopeptide ligands, LIG_SH3_1 SH3 ligand, LIG_SH3_3 SH3 ligand, DOC_MAPK_1 MAPK docking motifs, LIG_SUMO_SIM_par_1 SUMO interaction site, MOD_ProDKin_1 MAPK Phosphorylation Site, LIG_14-3-3_3 14-3-3 ligand, DOC_WW_Pin1_4 WW domain ligands, LIG_Integrin_isoDGR_1 Integrin binding sites, MOD_NEK2_1 NEK2 phosphorylation site, MOD_GlcNHglycan Glycosaminoglycan attachment site, LIG_LIR_LC3C_4 Atg8 protein family ligands, LIG_SUMO_SIM_anti_2 SUMO interaction site, TRG_LysEnd_APsAcLL_1 Endosome-Lysosome-Basolateral sorting signals, LIG_eIF4E_1 eIF4E binding motif
c LIG_14-3-3_2 14-3-3 ligand, MOD_NEK2_1 NEK2 phosphorylation site, MOD_PKA_2 PKA Phosphorylation site, MOD_GSK3_1 GSK3 phosphorylation site, LIG_TRAF2_1 TRAF2 binding site, MOD_CK1_1 CK1 Phosphorylation site, MOD_PLK Plk phosphorylation site, LIG_SH3_3 SH3 ligand, MOD_N-GLC_1 N-glycosylation site, DOC_CYCLIN_1 Cyclin recognition site, MOD_PKB_1 PKB Phosphorylation site, TRG_ER_diArg_1 di Arginine retention/retrieving signal, DOC_PP2B_LxvP_1 Calcineurin (PP2B)-docking motif LxvP, LIG_EVH1_2 EVH1 ligands
d MOD_CK2_1 CK2 Phosphorylation site, MOD_GSK3_1 GSK3 phosphorylation site, MOD_PKA_2 PKA Phosphorylation site, DOC_USP7_1 USP7 binding motif, LIG_14-3-3_3 14-3-3 ligand, MOD_CK1_1 CK1 Phosphorylation site, MOD_NEK2_1 NEK2 phosphorylation site, LIG_Actin_WH2_2 Actin-binding motifs, CLV_PCSK_FUR_1 PCSK cleavage site, LIG_FHA_1 FHA phosphopeptide ligands, LIG_SH2_STAT5 SH2 ligand, LIG_SH3_3 SH3 ligand, MOD_ProDKin_1 MAPK Phosphorylation Site, DOC_WW_Pin1_4 WW domain ligands
Discussion
One approach to identify beneficial mutations is by studying coevolving aa that result in establishment of novel and divergent strains within a short period of time. Functional attributes of these coevolving aa are associated with their interactions with host proteins [27]. Much advances have been made in studying protein coevolution at the molecular level making use of both sequence information as well as protein structure information of the interacting proteins of both the host and the virus [28]. In case of CHIKV, as the complete structures of nsPs are presently not available, we made use of sequence information to deduce the coevolving aa within the individual nsPs and between the nsPs in the polyprotein. Clinical samples collected over three consecutive years after a major outbreak were studied for coevolving aa in their nonstructural proteins. Analyzing the coevolving aa on the basis of their correlation coefficient values, our results have revealed that aa pairs having more than 0.9 correlation value have lesser number of coevolving partners thereby emphasizing the stringency of the technique. Of special mention is the analysis of the coevolving aa in nsP3 sequences from across the globe. While analyzing this protein, we observed that there were a variety of deletions in aa positions 376-382. Eighteen sequences isolated in the year 2014, mainly from South America (KR264951.1-KR264951.1, KP851709.1-KP851710.1, KJ451624.1) and Micronesia (KJ689452.1-KJ689453.1, KJ451622.2-KJ451623.1) showed deletion of four aa in position 379-382, whereas one sample each from Germany (KM673291.1), New Caledonia (HE806461.1), China (KF318729.1), Indonesia (FJ807897.1) two from Malaysia (FN295483.3, FN295484.2) and three from Brazil (KP164570.1-KP164571.1, KP164567.1) collected between 2006-2013 showed deletions in position 376-382. GO term analysis of this region using Eukaryotic Linear Motifs (ELMs) revealed that this motif present in the hyper variable region of nsP3 might be playing a role in protein aa phosphorylation and could be important for virus stability. Wet lab experiments are required to clearly understand the importance of this deletion both to the virus and to the host.
Viruses are dependent on host factors and enzymes for their replication and other processes due to the lack of their own protein processing machinery. Utilizing ELMs for studying the functional relevance of the CHIKV nsPs coevolving aa revealed interesting insights to the interactions of these proteins with the host. A total of 23 aa residues (27 coevolving pairs) that showed correlation co-efficiency of 0.9-1.0 were analyzed for their functional significance. Network of coevolving aa pairs and their predicted functionality is represented in Fig. 4. Amino acid 464(P) of nsp3 was predicted to be coevolving with maximum number of partners, namely, six other residues of nsP3 protein. It was observed that most of these pairs (464(P)-377(H), 464(P)-132(M), 464(P)-381(S) and 464(P)-327(S) were associated with motifs that participated in protein aa phosphorylation and protein serine/threonine kinase activity and has been experimentally validated in other systems [29, 30]. Additionally, this residue when paired with 327(S) was predicted to play a role in signal transduction represented by motif LIG_EVH1_2 and LIG_TRAF2_1. Herpesviruses proteins have been shown to be recruited through these motifs in TGFβ signaling and NF kb activation [31, 32]. Pairing of this aa with residue 395S were seen to be involved in several functions, namely, cell communication, SH3-binding domain, focal adhesion and signal transduction. Other functions of the coevolving pairs of nsP3 include cell communication and cell growth and maintenance (395(S)- 463(H)), cell cycle, proteolysis and peptidolysis (361(D)-411(T), 361(D)-408(R)), Wnt receptor signaling pathway, regulation of circardian rhythm, response to UV, protein kinase CK2 activity (411(T)-455(P)). transferringglycosyl group and activation of MAPK pathway (411(T)-408(R)). Involvement of kinases in virus activation through these motifs have been studied in papillomaviruses [33, 34].
Fig. 4.
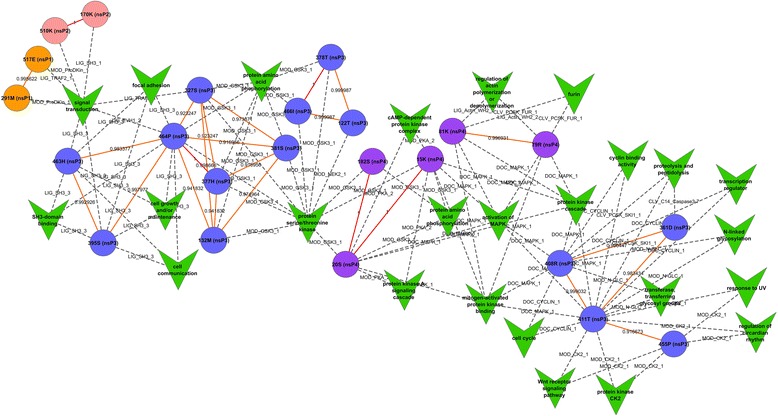
The figure represents the correlation between ELMs GO terms and coevolving pairs. The nodes are colored according to the respective protein and colored solid edges represent the correlation coefficient value. Values are also written along with the edge. Dash-lines represent the relation between coevolving pair and their respective ELM functions. The ELM names are also shown in the figure
With respect to nsP4, three coevolving pairs (five aa residues) were found to participate in functions like furin process, regulation of actin polymerization and depolymerization (79(R)-81(K)), cAMP-dependent protein kinase complex (20(S)-15(K)) and protein aa phosphorylation (20(S)-15(K), 20(S)-182(S)) (Fig. 4). Both nsP1 and nsP2 has one pair each of coevolving aa residues sharing common functions. 291(M)-517(E) coevolving pair of nsP1 and 170(K)-510(K) coevolving residues of nsP2 were predicted to play a role in signal transduction process (Fig. 4).
Conclusions
Our study has provided insight on the coevolving aa in the nonstructural proteins of CHIKV. Further, we have also attempted to predict the functional relevance of these aa with respect to the host using ELMs. It should be noted, however, correlation between coevolving pair of aa and ELMs in case of CHIKV require experimental validation.
Acknowledgements
We are thankful to the organizing committee of 20th International Bioinformatics workshop on Virus Evolution and Molecular Epidemiology (VEME), Trinidad and Tobago, West Indies for imparting beneficial knowledge for carrying out the Bioinformatics analysis.
Authors’ contributions
SS and RKB planned the study. KM performed the cloning. JJ and JS analyzed the results. SS, JJ and JS wrote the manuscript. All authors read and approved the final manuscript.
Competing interests
The authors declare that they have no competing interests.
Financial support
Financial support for this study was received from the Department of Biotechnology, Ministry of Science and Technology (BT/PR14725/AGR/36/672/2010), India. JJ received financial support from Department of Biotechnology, Ministry of Science and Technology, India (DBT/CTEP/02/201500843) to attend VEME workshop, 2015 and their support is duly acknowledged.
References
- 1.Burton RS, Rawson PD, Edmands S. Genetic architecture of physiological phenotypes: empirical evidence for coadapted gene complexes. Am Zool. 1999;39:451–462. doi: 10.1093/icb/39.2.451. [DOI] [Google Scholar]
- 2.Jothi R, Cherukuri PF, Tasneem A, Przytycka TM. Co-evolutionary analysis of domains in interacting proteins reveals insights into domain-domain interactions mediating protein-protein interactions. J Mol Biol. 2006;362:861–875. doi: 10.1016/j.jmb.2006.07.072. [DOI] [PMC free article] [PubMed] [Google Scholar]
- 3.Sironi M, Cagliani R, Forni D, Clerici M. Evolutionary insights into host-pathogen interactions from mammalian sequence data. Nat Rev Genet. 2015;16:224–236. doi: 10.1038/nrg3905. [DOI] [PMC free article] [PubMed] [Google Scholar]
- 4.Barreiro LB, Quintana-Murci L. From evolutionary genetics to human immunology: how selection shapes host defence genes. Nat Rev Genet. 2010;11:17–30. doi: 10.1038/nrg2698. [DOI] [PubMed] [Google Scholar]
- 5.Areal H, Abrantes J, Esteves PJ. Signatures of positive selection in Toll-like receptor (TLR) genes in mammals. BMC Evol Biol. 2011;11:368. doi: 10.1186/1471-2148-11-368. [DOI] [PMC free article] [PubMed] [Google Scholar]
- 6.Zhang C, Cornette JL, Berzofsky JA, DeLisi C. The organization of human leucocyte antigen class I epitopes in HIV genome products: implications for HIV evolution and vaccine design. Vaccine. 1997;15:1291–1302. doi: 10.1016/S0264-410X(97)00040-6. [DOI] [PubMed] [Google Scholar]
- 7.Theys K, Deforche K, Libin P, Camacho RJ, Van Laethem K, et al. Resistance pathways of human immunodeficiency virus type 1 against the combination of zidovudine and lamivudine. J Gen Virol. 2010;91:1898–1908. doi: 10.1099/vir.0.022657-0. [DOI] [PubMed] [Google Scholar]
- 8.Rhee SY, Liu TF, Holmes SP, Shafer RW. HIV-1 subtype B protease and reverse transcriptase amino acid covariation. PLoS Comput Biol. 2007;3:e87. doi: 10.1371/journal.pcbi.0030087. [DOI] [PMC free article] [PubMed] [Google Scholar]
- 9.Drummond DA, Silberg JJ, Meyer MM, Wilke CO, Arnold FH. On the conservative nature of intragenic recombination. Proc Natl Acad Sci U S A. 2005;102:5380–5385. doi: 10.1073/pnas.0500729102. [DOI] [PMC free article] [PubMed] [Google Scholar]
- 10.Coffey LL, Beeharry Y, Borderia AV, Blanc H, Vignuzzi M. Arbovirus high fidelity variant loses fitness in mosquitoes and mice. Proc Natl Acad Sci U S A. 2011;108:16038–16043. doi: 10.1073/pnas.1111650108. [DOI] [PMC free article] [PubMed] [Google Scholar]
- 11.Pfeiffer JK, Kirkegaard K. Increased fidelity reduces poliovirus fitness and virulence under selective pressure in mice. PLoS Pathog. 2005;1:e11. doi: 10.1371/journal.ppat.0010011. [DOI] [PMC free article] [PubMed] [Google Scholar]
- 12.Jerzak G, Bernard KA, Kramer LD, Ebel GD. Genetic variation in West Nile virus from naturally infected mosquitoes and birds suggests quasispecies structure and strong purifying selection. J Gen Virol. 2005;86:2175–2183. doi: 10.1099/vir.0.81015-0. [DOI] [PMC free article] [PubMed] [Google Scholar]
- 13.Weaver SC, Brault AC, Kang W, Holland JJ. Genetic and fitness changes accompanying adaptation of an arbovirus to vertebrate and invertebrate cells. J Virol. 1999;73:4316–4326. doi: 10.1128/jvi.73.5.4316-4326.1999. [DOI] [PMC free article] [PubMed] [Google Scholar]
- 14.Brault AC, Powers AM, Holmes EC, Woelk CH, Weaver SC. Positively charged amino acid substitutions in the e2 envelope glycoprotein are associated with the emergence of venezuelan equine encephalitis virus. J Virol. 2002;76:1718–1730. doi: 10.1128/JVI.76.4.1718-1730.2002. [DOI] [PMC free article] [PubMed] [Google Scholar]
- 15.Brault AC, Huang CY, Langevin SA, Kinney RM, Bowen RA, et al. A single positively selected West Nile viral mutation confers increased virogenesis in American crows. Nat Genet. 2007;39:1162–1166. doi: 10.1038/ng2097. [DOI] [PMC free article] [PubMed] [Google Scholar]
- 16.Fitzpatrick KA, Deardorff ER, Pesko K, Brackney DE, Zhang B, et al. Population variation of West Nile virus confers a host-specific fitness benefit in mosquitoes. Virology. 2010;404:89–95. doi: 10.1016/j.virol.2010.04.029. [DOI] [PMC free article] [PubMed] [Google Scholar]
- 17.Jerzak GV, Bernard K, Kramer LD, Shi PY, Ebel GD. The West Nile virus mutant spectrum is host-dependant and a determinant of mortality in mice. Virology. 2007;360:469–476. doi: 10.1016/j.virol.2006.10.029. [DOI] [PMC free article] [PubMed] [Google Scholar]
- 18.Dinkel H, Van Roey K, Michael S, Kumar M, Uyar B, et al. ELM 2016-data update and new functionality of the eukaryotic linear motif resource. Nucleic Acids Res. 2015;p.gkv1291. [DOI] [PMC free article] [PubMed]
- 19.Davey NE, Trave G, Gibson TJ. How viruses hijack cell regulation. Trends Biochem Sci. 2011;36:159–169. doi: 10.1016/j.tibs.2010.10.002. [DOI] [PubMed] [Google Scholar]
- 20.Casal PE, Chouhy D, Bolatti EM, Perez GR, Stella EJ, et al. Evidence for homologous recombination in Chikungunya Virus. Mol Phylogenet Evol. 2015;85:68–75. doi: 10.1016/j.ympev.2015.01.016. [DOI] [PubMed] [Google Scholar]
- 21.Tamura K, Stecher G, Peterson D, Filipski A, Kumar S. MEGA6: Molecular evolutionary genetics analysis version 6.0. Mol Biol Evol. 2013;30:2725–2729. doi: 10.1093/molbev/mst197. [DOI] [PMC free article] [PubMed] [Google Scholar]
- 22.Kutoh E. Probable linagliptin-induced liver toxicity: a case report. Diabetes Metab. 2014;40:82–84. doi: 10.1016/j.diabet.2013.09.009. [DOI] [PubMed] [Google Scholar]
- 23.Jones DT, Taylor WR, Thornton JM. The rapid generation of mutation data matrices from protein sequences. Comput Appl Biosci. 1992;8:275–282. doi: 10.1093/bioinformatics/8.3.275. [DOI] [PubMed] [Google Scholar]
- 24.Tajima F. Statistical method for testing the neutral mutation hypothesis by DNA polymorphism. Genetics. 1989;123:585–595. doi: 10.1093/genetics/123.3.585. [DOI] [PMC free article] [PubMed] [Google Scholar]
- 25.Fares MA, McNally D. CAPS: coevolution analysis using protein sequences. Bioinformatics. 2006;22:2821–2822. doi: 10.1093/bioinformatics/btl493. [DOI] [PubMed] [Google Scholar]
- 26.Shannon P, Markiel A, Ozier O, Baliga NS, Wang JT, et al. Cytoscape: a software environment for integrated models of biomolecular interaction networks. Genome Res. 2003;13:2498–2504. doi: 10.1101/gr.1239303. [DOI] [PMC free article] [PubMed] [Google Scholar]
- 27.Thompson JN. The coevolutionary process. University of Chicago Press; 1994 Nov 15.
- 28.de Juan D, Pazos F, Valencia A. Emerging methods in protein co-evolution. Nat Rev Genet. 2013;14:249–261. doi: 10.1038/nrg3414. [DOI] [PubMed] [Google Scholar]
- 29.Welcker M, Singer J, Loeb KR, Grim J, Bloecher A, et al. Multisite phosphorylation by Cdk2 and GSK3 controls cyclin E degradation. Mol Cell. 2003;12:381–392. doi: 10.1016/S1097-2765(03)00287-9. [DOI] [PubMed] [Google Scholar]
- 30.Liu C, Li Y, Semenov M, Han C, Baeg G-H, et al. Control of β-catenin phosphorylation/degradation by a dual-kinase mechanism. Cell. 2002;108:837–847. doi: 10.1016/S0092-8674(02)00685-2. [DOI] [PubMed] [Google Scholar]
- 31.Callebaut I. An EVH1/WH1 domain as a key actor in TGFβ signalling. FEBS Lett. 2002;519:178–180. doi: 10.1016/S0014-5793(02)02751-5. [DOI] [PubMed] [Google Scholar]
- 32.Lee H, Choi J-K, Li M, Kaye K, Kieff E, et al. Role of cellular tumor necrosis factor receptor-associated factors in NF-kB activation and lymphocyte transformation by herpesvirus saimiri STP. J Virol. 1999;73:3913–3919. doi: 10.1128/jvi.73.5.3913-3919.1999. [DOI] [PMC free article] [PubMed] [Google Scholar]
- 33.Sharrocks AD, Yang S-H, Galanis A. Docking domains and substrate-specificity determination for MAP kinases. Trends Biochem Sci. 2000;25:448–453. doi: 10.1016/S0968-0004(00)01627-3. [DOI] [PubMed] [Google Scholar]
- 34.Ma T, Zou N, Lin BY, Chow LT, Harper JW. Interaction between cyclin-dependent kinases and human papillomavirus replication-initiation protein E1 is required for efficient viral replication. Proc Natl Acad Sci. 1999;96:382–387. doi: 10.1073/pnas.96.2.382. [DOI] [PMC free article] [PubMed] [Google Scholar]