Abstract
It has been hypothesized that the ribosome gains additional fidelity during protein translation by probing structural differences in tRNA species. We measure the translocation kinetics of different tRNA species through ~3 nm diameter synthetic nanopores. Each tRNA species varies in the time scale with which it is deformed from equilibrium, as in the translocation step of protein translation. Using machine-learning algorithms, we can differentiate among five tRNA species, analyze the ratios of tRNA binary mixtures, and distinguish tRNA isoacceptors.
Keywords: nanopores, tRNA, single molecule, RNA, SVM
Graphical abstract
In the 1950s, Crick put forth the adaptor hypothesis to explain how genetic information contained in the cell is used to maintain and express cellular machinery. Though this hypothesis was made without any knowledge of the ribosome or other complex machinery involved in protein synthesis, it did correctly predict the existence of tRNA and its role as the molecule that links the genetic code to amino acids.1 Crick’s original hypothesis predicted that base-pairing interactions were responsible for all of the decoding carried out during what we now call the translation step. However, although it was confirmed that mRNA (mRNA) codes for a sequence of specific amino acids that are identified by complementary tRNA codons, the hypothesis that specificity is conferred solely by codon–anticodon pairing has been disproven.2 Discoveries of the Hirsh repressor3 and other mutations far from the anticodon region4–6 have shown that additional factors are involved in tRNA recognition, although the nature of this added specificity is still debated. Possible sources for additional discrimination include tRNA-specific fluctuations7 and flexibility,8 post-transcriptional modifications,9 variability in internal base-pairing within the tRNA,6 and ternary interactions between tRNA, EF-Tu, and the ribosome.4,8,10–12
The sequence and post-transcriptional modifications of each tRNA are highly conserved within a biological species. Studies have been conducted to investigate the effects of these posttranscriptional modifications on tRNA and how these effects contribute to the fidelity of decoding.13–15 A recent report suggests that each tRNA adopts a unique decoding conformation within the ribosome due to these factors.14 The results of this study imply that molecular stiffness can affect the tRNA conformation and dynamics, which in turn may play a mechanistic role in enhancing recognition by the ribosome.
Although the traditional L-shaped secondary structure of tRNA is well conserved for most tRNAs, as indicated by the few available crystal structures,16–18 very little is known about the mechanical properties of tRNA and how these properties vary for different tRNAs and with different post-translational modifications. Both solid-state and protein nanopores have been shown to be effective tools for studying the structural and mechanical properties of RNA molecules.19–28 Nanopore-based discrimination of two tRNA species has recently been demonstrated by unzipping tRNA molecules that are ligated to a synthetic DNA adapter molecule.28 In this study, a φ29 DNA polymerase that binds to the DNA/tRNA hybrid serves as a barrier for unzipping the molecule as it is pulled through an α-hemolysin nanopore. Though this technique can distinguish two tRNA species with ~87% accuracy, the need for complete unzipping of the ligated tRNA molecules does not enable the study of tRNA tertiary structure in its natively folded state.
Though many works have used nanopores to study RNA, the vast majority of these did not probe natively folded RNA molecules, instead relying on linearizing the molecules in question. We have recently utilized small solid-state nanopores as a label-free single molecule method to recognize drug-induced unbending of the hepatitis C internal ribosome entry site (IRES) structural motif from its native confirmation, which disrupts its ability to bind to the ribosome.25 In the current report, we perform high bandwidth (4.17 MHz sampling, 500 kHz low-pass filtering)29,30 measurements of the ion current signals produced when single, natively folded tRNA molecules are electrophoretically deformed during their passage through a 3 nm pore. By employing a support-vector machine (SVM), we show that signals from tRNA translocation across the pore can be used to classify molecules with accuracies that greatly exceed random guesses. Further, the SVM can be retrained in order to obtain a similar tRNA identification quality for data acquired using different nanopores. Improvements to the SVM and experimental hardware may allow a larger set of tRNAs to be distinguished, potentially the entire complement of tRNA contained within an organism.
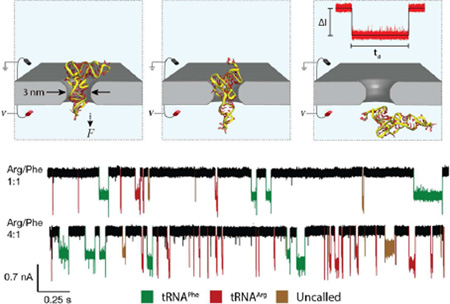
In order to study the flexibility of individual tRNA molecules, we fabricated nanopores with ~3 nm diameters and 5–10 nm effective thickness (for full details please refer to the Materials and Methods section). This geometry is wide enough to easily accommodate the tRNA acceptor stem, but full passage through the pore requires deformation at the tRNA elbow region We employed a transmembrane voltage bias to electrophoretically drive tRNA molecules through the nanopore. Primary analysis of the nanopore data is performed by identifying the stochastic set of downward pulses that correspond to tRNA passage through the pore. A pulse can be described by its dwell time, td, and the mean blockade amplitude, ΔI. We anticipate that the more structurally stable tRNAs will exhibit longer dwell times, as conformational changes are required to allow passage through the pore. However, aside from dwell time and current blockade amplitude, there are other indicators of molecular properties that may be contained within the signal during tRNA immobilization in the pore (and not specifically contained in td or ΔI). Therefore, we employ machine-learning techniques to identify additional, unique signal features for each tRNA pulse that include descriptors of the overall peak shape and portions of the noise spectrum within the blockade pulse. The methodology for implementation of these techniques/algorithms has been described fully elsewhere.31,32
Device Characterization
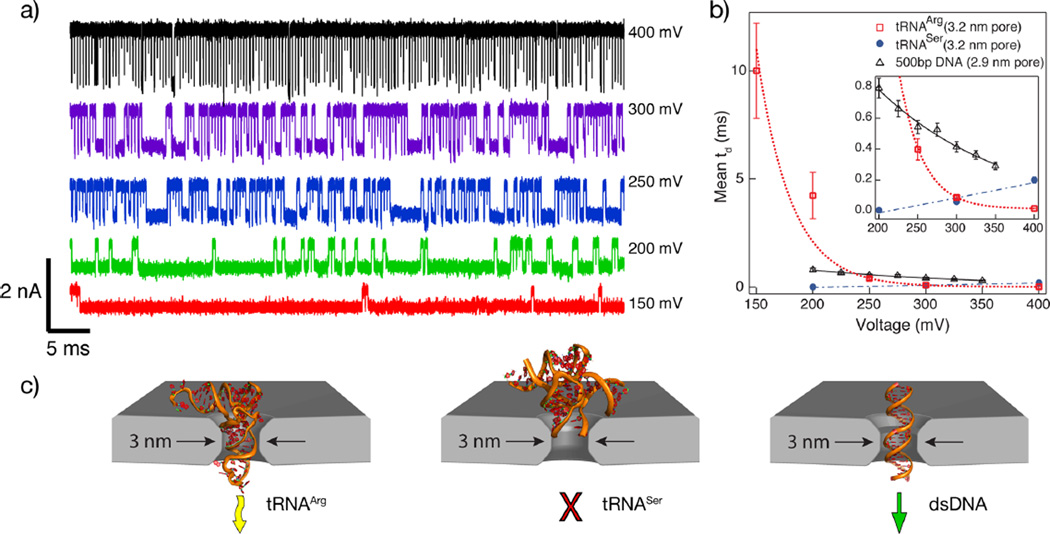
To illustrate the steep dependence of electrophoretic force on tRNA deformation kinetics, we first measured the dwell time dependence of tRNAArg on applied voltage in the range 150–400 mV (experiment performed in order of decreasing voltage). Figure 1a displays a concatenated representative set of pulses detected at different applied voltages. Clearly, tRNAArg dwell times drastically increase as voltage is decreased. We find that the tRNA dwell times fit log-normal distributions (see Figure SI2 for distributions and fits), and we use these fits to find the most-probable td values, which are plotted in Figure 1b. For comparison, we also plot data obtained for S. cerevisiae tRNASerGCU and a 500 bp sample of linear double-stranded DNA (dsDNA). As already previewed in Figure 1a, for the tRNAArg sample, we find a strong exponential dependence of td on voltage, indicative of a large free energy barrier associated with the bending of a tRNA molecule as it is electrophoretically forced through the pore.33 In contrast, tRNASer, which possesses a long (14-nucleotide) variable loop,34 exhibits dwell times that increase with applied voltage.35 This behavior, reproduced several times in different pores with similar geometry, is characteristic of failed attempts to cross the pore due to steric constraints. Finally, as expected, dsDNA dwell times decrease with voltage, as shown in a prior study using a similar geometry pore.36 However, the voltage dependence on dwell times for DNA is much less pronounced than for tRNAArg, which suggests that tRNA transport is impeded by the free energy barrier associated with deformation. Figure 1c schematically depicts PDB-derived cartoons of the three molecules superimposed with the nanopore geometry (DNA length is truncated), indicating the proposed mechanisms that are suggested by our voltage dependence measurements.
Figure 1.
(a) Concatenated event traces for tRNAArg displaying events at the indicated voltages. Each event is shown with ~250 µs of data before and after the event. (b) Mean dwell times as a function of applied voltage for tRNAArg. Data for tRNASer and 500 bp DNA are included for comparison (see text). (c) Schematic showing the PDB cartoon structures of the three control molecules positioned inside a ~3 nm diameter pore (yellow arrow = translocation with unbending, red cross = no translocation, green arrow = unhindered translocation).
Measuring Stability of tRNA Species
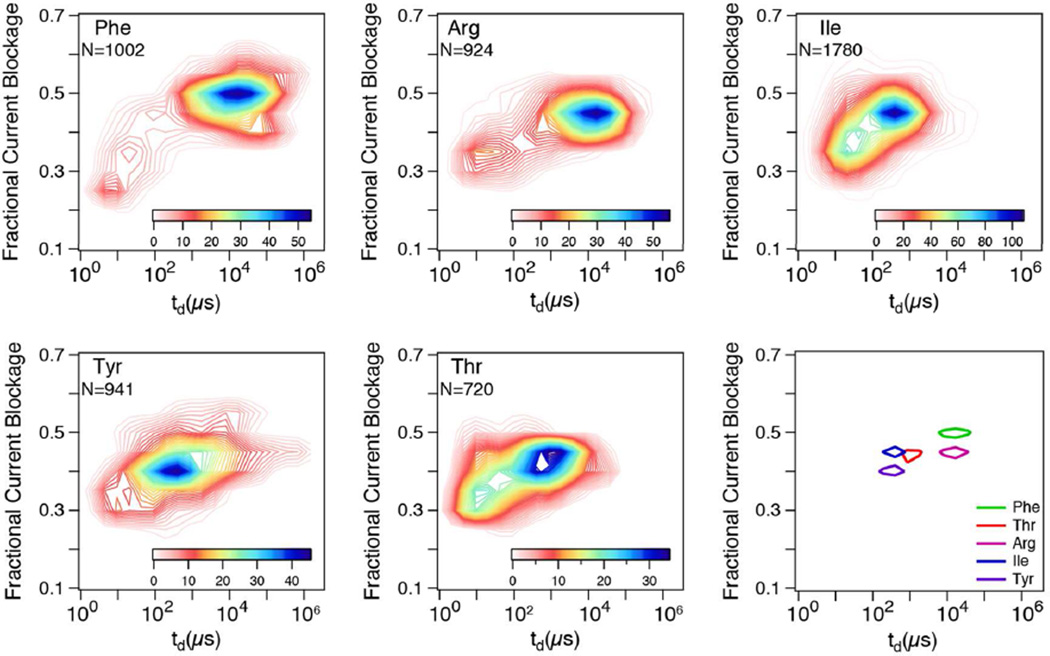
Next, we examined the transport of five different tRNAs using an applied voltage of 200 mV, at which the force is large enough to efficiently drive tRNAs into the nanopore but low enough to produce long dwell times that can aid in molecular identification (see Figure SI3 for sample events). Two-dimensional contour plots of fractional current blockade (ΔI/Io, where Io is the open pore current) vs dwell time are shown for the five different tRNAs, along with a graph that compares the most-probable position for each tRNA (see Figure 2). The plots show substantial differences in the most-probable dwell times for all tRNAs, which we attribute to different degrees of stability intrinsic to each tRNA, (tRNAPhe > tRNAArg > tRNAThr > tRNA Ile ≈ tRNATyr). Further, the relative peak positions were consistent across multiple experiments using different pores at different voltages (see Figure SI4 for example), with peak locations being independent of the order in which the molecules were tested. However, though each of the tRNAs tested has its characteristic dwell time and current blockade level, the large levels of overlap in populations indicate that these two parameters are insufficient for accurate single pulse identification of individual tRNAs.
Figure 2.
Contour plots depicting the distributions of fractional current blockage vs td for five tRNA samples electrophoresed through the same nanopore (~3 nm diameter, ~10 nm thickness) using an applied voltage of 200 mV. The final panel shows the locations of the contour peaks for each tRNA.
SVM Based Single-Pulse tRNA Speciation
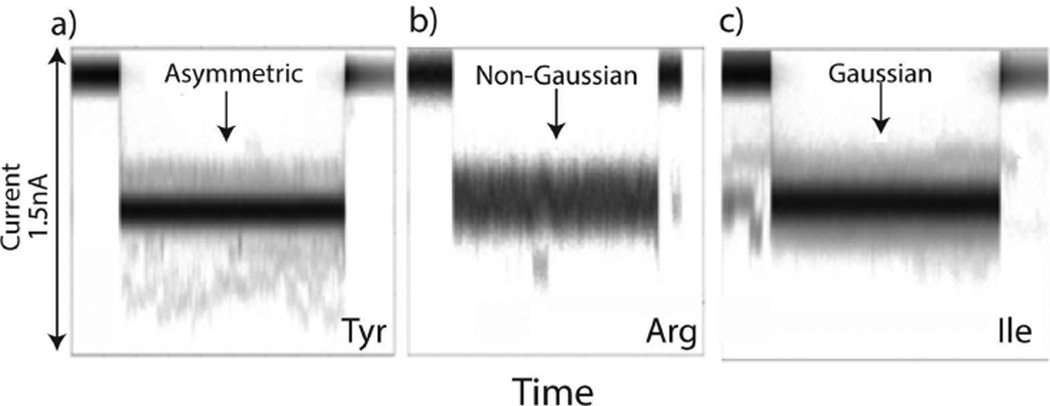
To illustrate the limitations of two-parameter analysis, we present in Figure 3 sets of overlaid current pulses for three different tRNA species, where signal intensity represents the relative frequency (time coordinates of pulses was rescaled to allow overlay). The blurry appearance of the images is due to incomplete overlap of data points in the sets. Clearly, the noise within the pulse is larger than baseline current noise, and is a function of the analyte type (asymmetric for tRNATyrQUA, non-Gaussian for tRNAArg and Gaussian for tRNAIleUAU). In addition to the visible differences among the tRNA signals in Figure 3, there are other parameters contained within the signals that are not necessarily distinguishable in raw data format. Therefore, we applied a support vector machine (SVM) to the data, as previously reported for analysis of tunneling signals obtained from amino acids31 and DNA bases.32 The first step was to characterize the events for the machine analysis. A library of vectors (e.g., signal features) for describing peaks has been developed32 for tunnel current signals that describe the shape of the peaks. These features include, for example, signal amplitudes, noise spectra, and Fourier components. Using a shotgun method, we determined the most powerful features for describing the differences in tRNAs, with the criterion that the distributions of a given feature vary little between different experiments on the same analyte, while varying significantly when compared to distributions obtained from other analytes (i.e., σintragroup/σintergroup < 0.8 where σ is the standard deviation). This criterion eliminates signal features that are subject to systematic error as well as features that are insensitive to analyte chemistry.
Figure 3.
Noise characteristics for different tRNA species. Translocation events are overlaid (with up to 10% of time-rescaling to align the start and end of each event) and the gray scale density corresponds to the number of overlapping data points. (a) tRNATyr displaying asymmetric noise, n = 666, 〈td〉 = 0.5 ± 0.05 ms, (b) tRNAArg displaying non-Gaussian noise, n = 551, 〈td〉 = 5 ± 0.5 ms, (c) tRNAIle displaying Gaussian noise, n = 746, 〈td〉 = 0.7 ± 0.07 ms.
Once a number of candidate parameters have been selected, we trained the SVM using a representative fraction of the data sets and evaluated the training accuracy using the remainder of the data sets. We then employed adaptive feature selection37 to determine which signal features contribute most to the correct assignment of an event to a specific tRNA. In this method, features are removed from the analysis a few at a time in order to determine the most essential combination of features.
We consistently found that a subset of the acquired data is common to all tRNA species and cannot be classified easily by the SVM. These data include noise, pore blockade events, and what are most likely unsuccessful attempts of the tRNA to cross the membrane. Thus, some level of data filtering is required, as follows: The first stage of filtering uses an overlapping one-class SVM to determine which events are similar to all the others. In this method, each analyte is used to train a one-class SVM, and then all the data are run through the entire set of one-class SVM’s. Data that fall into nearly all of the classes, which comprises 30–60% of the candidate events, are suspect and removed. To create a second filter, a single one-class SVM algorithm was trained with all the known training data. This filter, which eliminates another 10% of the candidate events, makes it possible to identify events that are unknown with respect to the training set. Finally, we found that a major contribution to systematic errors came from time-dependent drift in the pore characteristics. Therefore, a least-squares regression algorithm was implemented for time correction. Figure SI5 shows the distributions of two signal features (pulse amplitude and peak width) for tRNAArg as measured over the course of an hour. The distributions noticeably drift with time; this is likely a result of slight changes in the pore geometry over time. Accordingly, we developed a linear interpolation algorithm to correct the distribution changes using data recorded from one analyte as a function of time. The feature selection routine was also made more sensitive to those parameters that vary with time, allowing removal of those that perform badly after the drift removal routine. A final and important factor to consider is that each pore produces its own noise signal in interaction with the target molecules. This framework is not general enough to allow the SVM training from one nanopore to be used on another nanopore. Each nanopore requires its own training and selection of features, and all experiments in this paper were handled in accordance with this limitation.
Table 1 details the accuracies with which the SVM can identify an analyte from a single pulse. Random calling would result in 20% of the assignments being called correctly, but as can be seen here, the SVM can attain an average single-pulse accuracy (with drift correction) of 69%. This corresponds to an accuracy of 88% if analysis is constrained to pairs of tRNAs, comparable to the accuracies reported by Smith et al.28 Thus, each single molecule event can be called with accuracy significantly better than random without resorting to statistical analysis of many events to distinguish between analytes. This is a powerful consequence of the use of machine learning.
Table 1.
Accuracies with Which Each Individual Event Is Assigned from the Pool of Five tRNAs, Both with and without Drift Correction.a
| tRNA species | uncorrected accuracy (%) | time-corrected accuracy (%) |
|---|---|---|
| all (average) | 39 | 69 |
| Arg | 55 | 80 |
| Tyr | 18 | 61 |
| Ile | 60 | 84 |
| Phe | 2 | 39 |
| Thr | 13 | 51 |
The signal features used in this analysis are listed in Table SI1.
Determining Contents of a tRNA Mixture
As a proof-of-principle application of this approach, we measured concentration ratios of binary tRNA mixtures. This experiment serves as validation of the SVM-based assignment of individual events. Though SVM studies of amino acids using tunneling signals have shown exceptionally high signal calling accuracies, quantitative mixture analysis has been difficult to achieve, likely due to intermolecular interactions resulting from high analyte concentrations.31 To test the limits of our detection method, we selected two tRNAs with the highest degree of overlap in their dwell time and current blockade values. As a result, the two tRNA species are differentiated based upon signal components that, with rare exception,38 have been largely ignored in previous nanopore experiments.
To perform discrimination in a binary tRNA mixture, tRNAPhe was first added to our standard buffer to a final concentration of ~40 nM. Next, tRNAArg was titrated into the buffer in 40 nM increments up to a final concentration of 160 nM (corrected for dilution); data points were acquired with a bias voltage of 400 mV following each titration step. Then, machine-learning algorithms were applied to these traces to assign identity to each event in the trace. By calculating the assigned ratios of tRNAArg to tRNAPhe events, apparent analyte molar ratios were measured. Presumably due to differences in capture rate efficiencies for the two molecules, apparent and actual molar ratios are unlikely to have 1:1 correspondence, but linear increases in molar ratio should result in linear increases in the apparent ratios. This makes it possible to obtain the molar ratio of unknown samples by calibrating the system with a mixture sample of a known ratio.
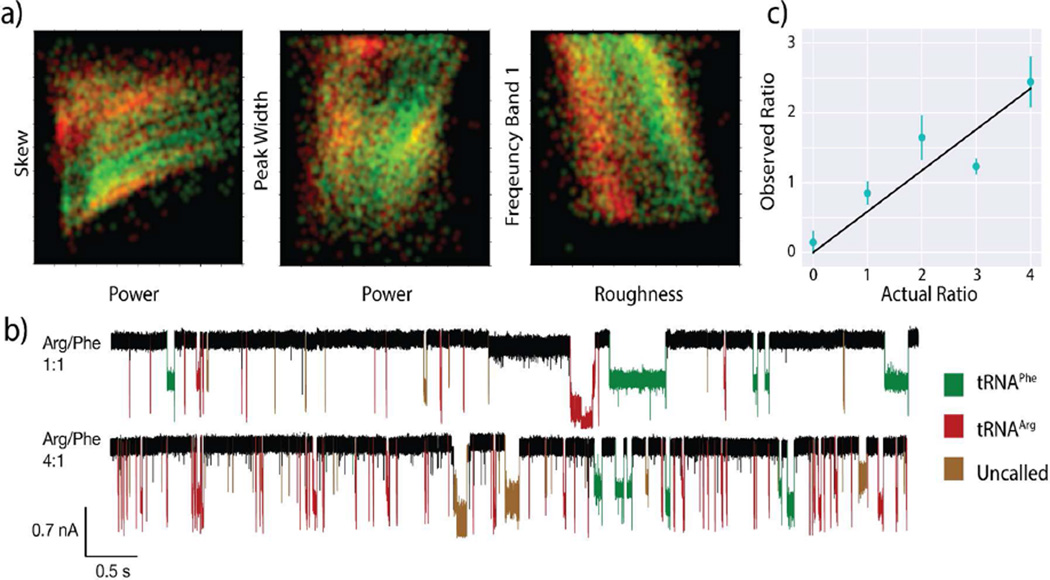
A standard comparison of dwell times and current blockades shows little to no difference between the two tRNAs (see Figure SI6) as previously described. Clearly, SVM analysis is required for accurate single-molecule discrimination. The SVM was trained with pure samples presented to the nanopores both before and after the mixtures were run, and then it was tested on the mixtures. Examples of the different SVM parameters used and the separation they provide are shown in Figure 4a. These color plots show probability densities for two analytes (green tRNAPhe, red tRNAArg) for two parameter values (listed on the axes of the plots and described in the caption). These are measured distributions, where the probability density at any pair of values of the two parameters is indicated by the brightness of the point. The plots are color-mixed, so that nonoverlapped data appear as pure red or pure green, whereas overlapped data generate yellow points. The SVM operates with many parameters simultaneously, dividing up the corresponding multidimensional space into “red” or “green” regions using multidimensional partitions (the support vectors). In the analysis shown, seven features were used to attain an accuracy (true/positive rate) of 91% for tRNAArg and 82% for tRNAPhe (see Table SI2 for a full list of parameters). These 2D comparisons provide better separation between the two analytes than the traditional dwell time and current blockade. The SVM is able to separate these parameters in 7-dimensional space, leading to our exceptional accuracy numbers. Current traces with the resulting SVM calling identity can be seen in Figure 4b. The measured tRNA ratios correlate well with the known compositions of the mixtures (Figure 4c). As expected, the slope of the line is not equal to 1.0, reflecting differences in capture efficiency for the two molecules, though this slope may also be affected by pipetting errors.
Figure 4.
Detection of tRNA species in binary mixtures. (a) Several of the SVM signal features displayed in false-color 2D plots (see text and Table SI2). All units are normalized and shown from 0 to 1. tRNAPhe is shown in red, tRNAArg in green, and areas of overlap are shown in yellow. Signal feature definitions: skew (statistical skew of a peak), power (integrated area of event current), peak width (total time of event), frequency band 1 (noise spectrum between (0–208) kHz), roughness (standard deviation of current values within an event). (b) Current vs time traces for both the 1:1 and 4:1 tRNAArg/tRNAPhe mixtures. Events are colored according to SVM calling. The number of tRNAArg calls increases greatly with its relative concentration, whereas the number of tRNAPhe does not appreciably change. (c) Measured ratio of tRNAArg to tRNAPhe signals vs the known molar ratio in solution. The ratios do not show 1:1 correspondence due to differences in the capture efficiency for the two molecules, but the linear correlation shows that the identity of single molecule events can be assigned with reasonable accuracy. Error bars were assigned by dividing each data set into many different subsets. The subsets were divided by time within the experiment to identify sampling errors, and then again using a number of different feature sets. The comparison between all the different assigned ratios determines the classification error, and controls for the standard problems of over- and underfitting of the SVM.
Differentiation of tRNA Isoacceptors
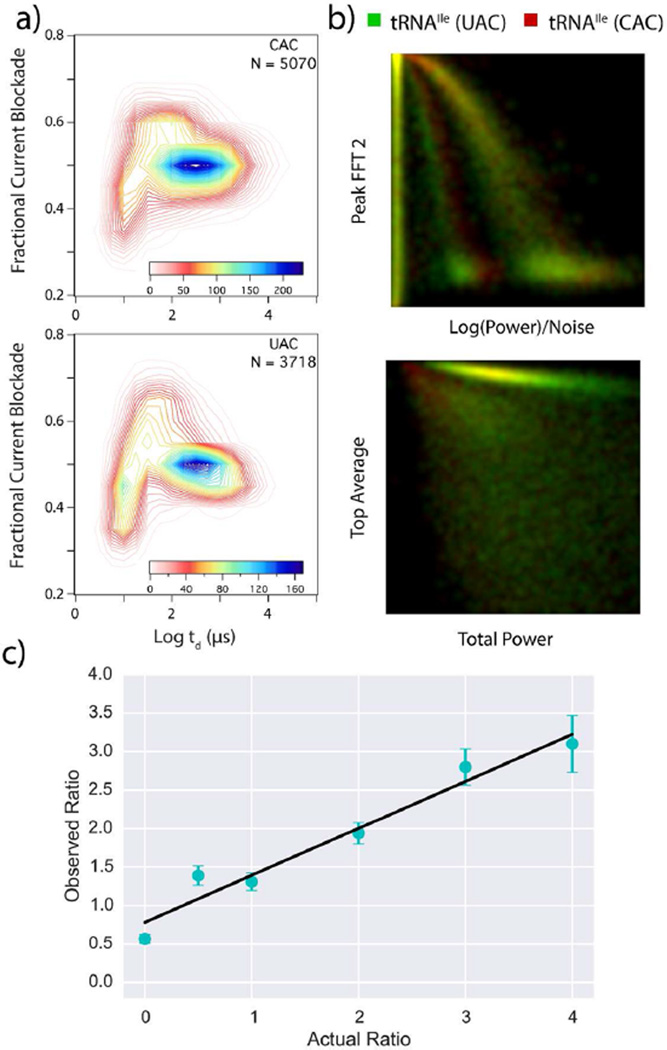
As a final exercise the approach described here was tested for its ability to discriminate between tRNA isoacceptors. For this study, we collected translocation data from tRNAValUAC and tRNAValCAC, followed by translocation data from mixtures of the two analytes in various ratios as described previously. Data from the individual analytes are then taken once more to calibrate the time-correction algorithm of the SVM (examples of the time evolution of parameters are presented in Figure SI7. Figure 5a shows data collected from each of the pure control samples. The two molecules are virtually indistinguishable using the standard dwell time vs current blockade analysis. In contrast, Figure 5b shows examples of the separation attained by 2D projections of some of the parameters used in the SVM analysis. Though these projections still do not show perfect separation of the two tRNAs, particular regions where the tRNA identity can be distinguished do begin to appear. These two isoacceptors do not separate well with any two parameters, but by projecting the data into 6-dimensional space the SVM analysis is able to achieve superior separation. After calibrating on a subset of the data from the two pure isoacceptors, the remainder of the pulses from the two samples are randomized to test the accuracy of the SVM. When the calibrated SVM is given a single translocation pulse it is able to identify the corresponding isoacceptor with an accuracy of 93% (see Table SI3 for list of SVM parameters used for mixture analysis). After the system is calibrated with the pure samples the SVM is tested for its ability to sense differences in analyte ratios from several different mixtures. The results of the mixture analysis can be seen in Figure 5c. Once again, the called ratio does not exhibit a 1:1 correspondence with the actual ratio. This difference is likely due to differences in capture rates for the two analytes. For ~1 ng/µL analyte concentrations, capture rates of 166 events/s and 112 events/s were observed for CAC and UAC, respectively. The capture rate for the UAC isoacceptor in the pure tRNA experiments was found to be ~0.67× the capture rate of the CAC isoacceptor. This is comparable to the slope of 0.61 displayed by the SVM predicted ratio vs actual ratio plot in Figure 5c, though the capture rates may also be skewed by pipetting errors and solution heterogeneity.
Figure 5.
Comparison of the UAC and CAC tRNAIle isoacceptors. (a) Contour plots showing both isoacceptors, >3000 events were recorded for each at an applied voltage of 500 mV. (b) Two-dimensional projections using four of the SVM features. All units are normalized and shown from 0 to 1. UAC (green) and CAC (red). SVM analysis yields calling accuracy of 93% for individual pulses. Signal feature definitions: peal FFT 2 (power spectrum value at 18 kHz), log(power)/noise (the log of the sum of the power spectrum, divided by the noise spectrum of the nanopore system), top average (sum of the ionic current values within a translocation pulse), total power (log of the sum of the power spectrum) (c) Measured ratio of UAC to CAC signals vs the known molar ratio in solution. The ratios do not show 1:1 correspondence due to differences in the capture efficiency for the two molecules, but the linear correlation convincingly shows that the identity of single molecule events can be assigned). The error in the ratios was determined by segmenting the peaks by time (~5 s intervals). The ratios between the various analytes were then determined for each segment, normalized and the percent error was determined.
We have shown that each tRNA species tested here displays a characteristic peak in its dwell time value and that the relative position of these peaks remains consistent across all devices. In addition, SVM studies show that each specific tRNA produces a characteristic noise spectrum upon passage through the nanopore, possibly due to nanosecond to microsecond thermal fluctuations that are characteristic of specific tRNAs.7 The results demonstrate that solid-state nanopores may be used as an effective tool for studying differences in tRNA flexibility. Computer simulations may reveal a relationship between tRNA dynamics and dwell times. The results also indicate that the ribosome might monitor tRNA flexibility in achieving translational fidelity. In this connection, it would be of interest to determine whether there is a link between dwell time and the angle formed by the elbow region of ribosome-bound tRNA. With further studies on a complete set of tRNA species, it may be possible to identify the sources the different types of noises we have observed (asymmetric, Gaussian, non-Gaussian) with specific tRNA structural and dynamic features (vibrational modes, post-transcriptional modifications, etc.).
Finally, we have shown by using machine-learning algorithms and probing many different parameters of the ionic current that we can identify individual tRNA molecules as they translocate pores. These algorithms greatly increase the ability of the device to classify even single blockade events, allowing classification accuracies up to 90%. The time correction allows classification to occur even with changes in the local reading environment of the pore. This system is effective for differentiating between tRNA isoacceptors that are charged by the same amino acid and could possibly be extended to resolve tRNA isodecoders, as well as identical tRNAs that are postranscriptionally modified to different extents. Our technique can be generalized to many other sensing modalities where signals exhibit time-dependent drift. Further optimization and accuracy could be achieved by utilizing a number of features that very specifically target data generated by tRNA translocation events. Additionally, adding Mg2+, which has been shown to increase tRNA stability and prolong the nanopore translocation process,28 would increase the amount of data that could be acquired for each translocation.
Materials and Methods
Nanopores were fabricated on ~20 nm thick silicon nitride freestanding membranes supported by a Si chip using a JEOL 2010FEG transmission electron microscope, as previously described.39 Fabricated nanopores were cleaned using hot piranha solution and, following copious rinsing with deionized water, were assembled in a custom PTFE cell equipped with homemade Ag/AgCl electrodes.
To provide a seal for the device and reduce device capacitance, we applied an elastomeric gasket between the chip and cell.40 We introduced solution containing 0.40 M KCl, 1 mM EDTA, and 10 mM Tris-buffered to pH 7.9 to both sides of the chip such that the nanopore forms a fluid channel joining the two chambers. In order to ensure a steady baseline current, we measured current traces for each device before the addition of tRNA molecules. Next, we added a purified sample of an individual tRNA species to the buffer on the cis side and applied a positive bias to the trans side while continuously monitoring the ion current until we detected a substantial number of molecular deformation events (n > 719). We then thoroughly flushed the cis chamber to remove all tRNA as indicated by absence of events. We then repeated the process for all tRNA samples. Data was acquired at 4.17 MHz using a Chimera Instruments VC100 and low-pass filtered at 500 kHz to provide a suitable signal-to-noise ratio for event detection.
Current blockage and dwell time analysis of the traces were performed using Pythion, custom software written in the Wanunu lab (https://github.com/rhenley/Pyth-Ion/).
SVM data analysis was performed using custom code written in the Lindsay lab. The code is available online at https://github.com/ochensati/SVM_DNA_TunnelVision
In the experiments that contain mixtures of different tRNAs, we first obtained characteristic traces for tRNAArg (mixture of isoacceptors) and tRNAPheGAA, both isolated from S. cerevisiae. We then collected data from different molar mixtures of the two samples and implemented our SVM algorithms to detect changes in the relative concentrations based on single-pulse tRNA calling.
Samples of tRNAArg (a mixture of isoacceptors) from S. cerevisiae, and tRNATyrQUA from E. coli were purchased from Chemical Block. tRNAPheAAG from S. cerevisiae was purchased from Sigma-Aldrich. tRNAIleUAU, tRNAThrCGU, tRNASerGCU, tRNAValUAC, and tRNAValCAC were isolated from bulk S. cerevisiae tRNA (Roche Diagnostics) following procedures described in Barhoom et al., 2013. Analytical scale aminoacylations with radioactive amino acids resulted in the following aminoacylation efficiencies: 0.54 Arg/tRNAArg, 0.45 Tyr/tRNATyr, 0.28 Phe/tRNAPhe, 0.68 Ile/tRNAIle, 0.62 Thr/tRNAThr, 0.72 Ser/tRNASerGCU, 0.69 Val/tRNAValUAC, and 0.63 Val/tRNAValCAC. Purity and intactness of the tRNAs were verified by denaturing gel electrophoresis (Figure SI9).
Supplementary Material
Acknowledgments
We acknowledge support from the National Institutes of Health for this work (HG006873, MW; HG 006323, SML; GM080376, BSC).
Footnotes
ASSOCIATED CONTENT
Supporting Information
- Supporting Information contains experimental schematic, details on voltage dependence of tRNA molecules, sample events, additional data sets, time dependence of various parameters, raw current traces, full list of SVM parameters for each investigation, and PAGE gel of five tRNAs. (PDF)
The authors declare no competing financial interest.
REFERENCES
- 1.Crick FH. Symp. Soc. Exp Biol. 1958;12:138–163. [PubMed] [Google Scholar]
- 2.Loftfield RB. Biochem. J. 1963;89(1):82–92. doi: 10.1042/bj0890082. [DOI] [PMC free article] [PubMed] [Google Scholar]
- 3.Hirsh D. Nature. 1970;228(5266):57. doi: 10.1038/228057a0. [DOI] [PubMed] [Google Scholar]
- 4.Ortiz-Meoz RF, Green R. RNA. 2010;16(10):2002–2013. doi: 10.1261/rna.2232710. [DOI] [PMC free article] [PubMed] [Google Scholar]
- 5.Schultz DW, Yarus M. J. Mol. Biol. 1994;235(5):1381–1394. doi: 10.1006/jmbi.1994.1095. [DOI] [PubMed] [Google Scholar]
- 6.Smith D, Yarus M. J. Mol. Biol. 1989;206(3):503–511. doi: 10.1016/0022-2836(89)90497-x. [DOI] [PubMed] [Google Scholar]
- 7.Lee TH, Blanchard SC, Kim HD, Puglisi JD, Chu S. Proc. Natl. Acad. Sci. U. S. A. 2007;104(34):13661–13665. doi: 10.1073/pnas.0705988104. [DOI] [PMC free article] [PubMed] [Google Scholar]
- 8.Cochella L, Green R. Science. 2005;308(5725):1178–1180. doi: 10.1126/science.1111408. [DOI] [PMC free article] [PubMed] [Google Scholar]
- 9.Dineshkumar TK, Thanedar S, Subbulakshmi C, Varshney U. Microbiology. 2002;148(12):3779–3787. doi: 10.1099/00221287-148-12-3779. [DOI] [PubMed] [Google Scholar]
- 10.Schrader JM, Uhlenbeck OC. Nucleic Acids Res. 2011;39(22):9746–9758. doi: 10.1093/nar/gkr641. [DOI] [PMC free article] [PubMed] [Google Scholar]
- 11.Yikilmaz E, Chapman SJ, Schrader JM, Uhlenbeck OC. Biochemistry. 2014;53(35):5710–5720. doi: 10.1021/bi500533x. [DOI] [PMC free article] [PubMed] [Google Scholar]
- 12.Schrader JM, Chapman SJ, Uhlenbeck OC. Proc. Natl. Acad. Sci. U. S. A. 2011;108(13):5215–5220. doi: 10.1073/pnas.1102128108. [DOI] [PMC free article] [PubMed] [Google Scholar]
- 13.Novoa EM, Pavon-Eternod M, Pan T, Ribas de Pouplana L. Cell. 2012;149(1):202–213. doi: 10.1016/j.cell.2012.01.050. [DOI] [PubMed] [Google Scholar]
- 14.Schmeing TM, Voorhees RM, Kelley AC, Ramakrishnan V. Nat. Struct. Mol. Biol. 2011;18(4):432–436. doi: 10.1038/nsmb.2003. [DOI] [PMC free article] [PubMed] [Google Scholar]
- 15.Cantara WA, Bilbille Y, Kim J, Kaiser R, Leszczynska G, Malkiewicz A, Agris PF. J. Mol. Biol. 2012;416(4):579–597. doi: 10.1016/j.jmb.2011.12.054. [DOI] [PubMed] [Google Scholar]
- 16.Shi H, Moore PB. RNA. 2000;6(08):1091–1105. doi: 10.1017/s1355838200000364. [DOI] [PMC free article] [PubMed] [Google Scholar]
- 17.Basavappa R, Sigler PB. EMBO J. 1991;10(10):3105–3111. doi: 10.1002/j.1460-2075.1991.tb07864.x. [DOI] [PMC free article] [PubMed] [Google Scholar]
- 18.Rich A, RajBhandary UL. Annu. Rev. Biochem. 1976;45(1):805–860. doi: 10.1146/annurev.bi.45.070176.004105. [DOI] [PubMed] [Google Scholar]
- 19.Cracknell JA, Japrung D, Bayley H. Nano Lett. 2013;13(6):2500–2505. doi: 10.1021/nl400560r. [DOI] [PMC free article] [PubMed] [Google Scholar]
- 20.van den Hout M, Skinner GM, Klijnhout S, Krudde V, Dekker NH. Small. 2011;7(15):2217–2224. doi: 10.1002/smll.201100265. [DOI] [PubMed] [Google Scholar]
- 21.Butler TZ, Gundlach JH, Troll MA. Biophys. J. 2006;90(1):190–199. doi: 10.1529/biophysj.105.068957. [DOI] [PMC free article] [PubMed] [Google Scholar]
- 22.Kasianowicz JJ, Brandin E, Branton D, Deamer DW. Proc. Natl. Acad. Sci. U. S. A. 1996;93(24):13770–13773. doi: 10.1073/pnas.93.24.13770. [DOI] [PMC free article] [PubMed] [Google Scholar]
- 23.van den Hout M, Vilfan ID, Hage S, Dekker NH. Nano Lett. 2010;10(2):701–707. doi: 10.1021/nl903925a. [DOI] [PubMed] [Google Scholar]
- 24.Wanunu M, Dadosh T, Ray V, Jin J, McReynolds L, Drndic M. Nat. Nanotechnol. 2010;5(11):807–814. doi: 10.1038/nnano.2010.202. [DOI] [PubMed] [Google Scholar]
- 25.Shasha C, Henley RY, Stoloff DH, Rynearson KD, Hermann T, Wanunu M. ACS Nano. 2014;8(6):6425–6430. doi: 10.1021/nn501969r. [DOI] [PMC free article] [PubMed] [Google Scholar]
- 26.Wanunu M, Bhattacharya S, Xie Y, Tor Y, Aksimentiev A, Drndic M. ACS Nano. 2011;5(12):9345–9353. doi: 10.1021/nn203764j. [DOI] [PMC free article] [PubMed] [Google Scholar]
- 27.Gerland U, Bundschuh R, Hwa T. Phys. Biol. 2004;1(1–2):19–26. doi: 10.1088/1478-3967/1/1/002. [DOI] [PubMed] [Google Scholar]
- 28.Smith AM, Abu-Shumays R, Akeson M, Bernick DL. Front. Bioeng. Biotechnol. 2015;3:91. doi: 10.3389/fbioe.2015.00091. [DOI] [PMC free article] [PubMed] [Google Scholar]
- 29.Balan A, Machielse B, Niedzwiecki D, Lin J, Ong P, Engelke R, Shepard KL, Drndic M. Nano Lett. 2014;14(12):7215–7220. doi: 10.1021/nl504345y. [DOI] [PubMed] [Google Scholar]
- 30.Venta K, Shemer G, Puster M, Rodriguez-Manzo JA, Balan A, Rosenstein JK, Shepard K, Drndic M. ACS Nano. 2013;7(5):4629–4636. doi: 10.1021/nn4014388. [DOI] [PMC free article] [PubMed] [Google Scholar]
- 31.Zhao Y, Ashcroft B, Zhang P, Liu H, Sen S, Song W, Im J, Gyarfas B, Manna S, Biswas S, Borges C, Lindsay S. Nat. Nanotechnol. 2014;9(6):466–473. doi: 10.1038/nnano.2014.54. [DOI] [PMC free article] [PubMed] [Google Scholar]
- 32.Chang S, Huang S, Liu H, Zhang P, Liang F, Akahori R, Li S, Gyarfas B, Shumway J, Ashcroft B, He J, Lindsay S. Nanotechnology. 2012;23(23):235101. doi: 10.1088/0957-4484/23/23/235101. [DOI] [PMC free article] [PubMed] [Google Scholar]
- 33.Mathe J, Visram H, Viasnoff V, Rabin Y, Meller A. Biophys. J. 2004;87(5):3205–3212. doi: 10.1529/biophysj.104.047274. [DOI] [PMC free article] [PubMed] [Google Scholar]
- 34.Heyman T, Agoutin B, Fix C, Dirheimer G, Keith G. FEBS Lett. 1994;347(2–3):143–146. doi: 10.1016/0014-5793(94)00524-9. [DOI] [PubMed] [Google Scholar]
- 35.Wanunu M, Sutin J, McNally B, Chow A, Meller A. Biophys. J. 2008;95(10):4716–4725. doi: 10.1529/biophysj.108.140475. [DOI] [PMC free article] [PubMed] [Google Scholar]
- 36.Carson S, Wilson J, Aksimentiev A, Wanunu M. Biophys. J. 2014;107(10):2381–2393. doi: 10.1016/j.bpj.2014.10.017. [DOI] [PMC free article] [PubMed] [Google Scholar]
- 37.Grandvalet Y, Canu S. Adaptive Scaling for Feature Selection in SVMs. Adv. Neural Inf. Process. Syst. 2002:553–560. [Google Scholar]
- 38.Vercoutere W, Winters-Hilt S, Olsen H, Deamer D, Haussler D, Akeson M. Nat. Biotechnol. 2001;19(3):248–252. doi: 10.1038/85696. [DOI] [PubMed] [Google Scholar]
- 39.Kim MJ, Wanunu M, Bell DC, Meller A. Adv. Mater. 2006;18(23):3149–3153. [Google Scholar]
- 40.Tabard-Cossa V, Trivedi D, Wiggin M, Jetha NN, Marziali A. Nanotechnology. 2007;18(30):305505. [Google Scholar]
Associated Data
This section collects any data citations, data availability statements, or supplementary materials included in this article.


