

SUMMARY
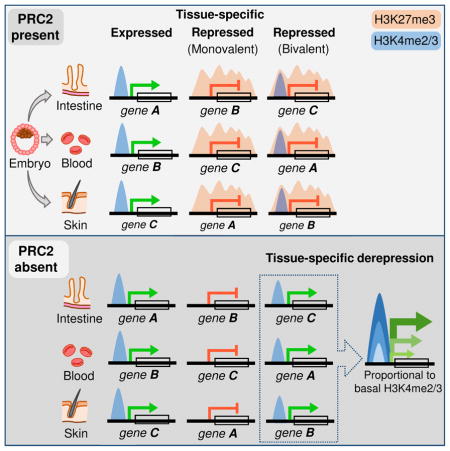
Bivalent promoters in embryonic stem cells (ESCs) carry methylation marks on two lysine residues, K4 and K27, in histone3 (H3). K4me2/3 is generally considered to promote transcription and Polycomb Repressive Complex 2 (PRC2) places K27me3, which is erased at lineage-restricted genes when ESCs differentiate in culture. Molecular defects in various PRC2-null adult tissues lack a unifying explanation. We find that epigenomes in adult mouse intestine and other self-renewing tissues show fewer and distinct bivalent promoters compared to ESCs. Groups of tissue-specific genes that carry bivalent marks are repressed despite the presence of promoter H3K4me2/3. These are the predominant genes de-repressed in PRC2-deficient adult cells, where aberrant expression is proportional to the H3K4me2/3 levels observed at their promoters in wild-type cells. Thus, in adult animals PRC2 specifically represses genes with acquired, tissue-restricted promoter bivalency. These findings provide new insights into specificity in chromatin-based gene regulation.
Graphical Abstract
INTRODUCTION
Polycomb repressive complex 2 (PRC2)-mediated trimethylation of H3K27 is associated with transcriptional silencing (Margueron and Reinberg, 2011). Mammalian PRC2 contains the enzymes EZH1 or EZH2 and two proteins – EED and SUZ12 – that are required to assemble the active complex (Kuzmichev et al., 2002; Pasini et al., 2004). Mouse embryos lacking PRC2 die soon after gastrulation (Faust et al., 1998; Pasini et al., 2004) and much of the current understanding of mammalian PRC2 activity rests on studies in embryonic stem cells (ESCs). However, ESCs and early embryos have unique, globally permissive chromatin (Meshorer et al., 2006; Zhu et al., 2013) and their regulatory processes may differ from those in adult tissues.
In PRC2-deficient ESCs, some genes ordinarily restricted to specific tissues may activate prematurely (Boyer et al., 2006; Pasini et al., 2007). Promoters of these genes are commonly ‘bivalent,’ meaning that they carry the activation-associated histone mark H3K4me3 in addition to H3K27me3, and lose one or the other mark as ESCs differentiate (Azuara et al., 2006; Bernstein et al., 2006; Mikkelsen et al., 2007). H3K27me3 domains also appear or expand in differentiated cells concomitant with gene silencing (Hawkins et al., 2010), which suggests that PRC2-mediated repression, established during development, controls spatio-temporal gene activity. However, promoter bivalency and its functional significance are not readily evident in fetal or adult somatic cells (Alder et al., 2010; Cui et al., 2009; Lien et al., 2011; Mohn et al., 2008) and may be confined to early mammalian embryos (Voigt et al., 2013). Moreover, ESCs cultured in the presence of serum differ from those maintained in a ‘ground state’ by inhibition of MEK and GSK3 kinases (Ying et al., 2008) and only 31% of genes showing bivalency in the presence of serum do so under these ‘2i conditions’, where H3K27me3 levels are significantly lower at many genes (Marks et al., 2012). Moreover, genes are minimally perturbed in ESCs cultured in 2i medium, where PRC2 seems to maintain – rather than initiate – repression of some genes, and blockade of transcription recruits H3K27me3 at other genes, implying that the mark may reflect – and not cause – their repression (Riising et al., 2014). Thus, although PRC2-mediated H3K27me3 is widely regarded as a universal restraint on gene transcription, its functions and requirements in vivo remain uncertain and may be confined to selected genes.
PRC2 deficiency in individual mouse tissues causes specific and limited defects. Impaired progenitor cell replication in PRC2-null blood, skin, and other tissues is attributed to activation of genes that inhibit the cell cycle, such as Cdkn2a, because concomitant loss of single Cdkn genes rescues the overt defect (Delgado-Olguin et al., 2012; Ezhkova et al., 2011; Hidalgo et al., 2012; Juan et al., 2011; Xie et al., 2014). Strikingly few other genes – and different genes in different tissues – are deregulated. Because transcriptional aberration in mutant cells has not been evaluated systematically with respect to basal tissue-specific histone marks, the basis for the limited and diverse outcomes is unclear and PRC2 function in adult somatic tissues lacks a cogent unifying model. To derive such a model, we assessed PRC2 function in the epithelium of the adult mouse intestine, where cycling Lgr5+ crypt stem cells (ISC) and transit-amplifying cells support the continual turnover of terminally differentiated villus cells (Barker et al., 2007).
We found that about 2,000 genes have constitutively heavy H3K27me3 marks in both crypt and villus cells, similar to the numbers strongly marked in mouse blood and skin. At least half these genes in each case lack H3K27me3 in one or both other tissues and their promoters carry different levels of H3K4me3 and H3K4me2; most of these genes are not identified as bivalent in ESCs grown in serum or under 2i conditions. Promoter bivalency in the adult intestine does not position genes for expression in differentiated villus cells. Rather, H3K27me3 is necessary to maintain their constitutive silence, as genes with acquired tissue-specific bivalency are virtually the only targets of PRC2-dependent repression in the intestine, skin and blood. Aberrant gene activation in each case is proportional to the levels of promoter H3K4me2/3 marks. Thus, hundreds of genes in each adult tissue carry concomitant H3K4me2/3 and H3K27me3, and PRC2 is required in adult cells specifically to preclude expression of these genes.
RESULTS
A limited role for H3K27me3 dynamics in intestinal crypt-villus differentiation
In the adult mouse intestinal epithelium, H3K27me3 is especially abundant in villus cells; EZH2 levels are highest in the crypts, where it is present in all replicating cells, including Lgr5+ ISC at the crypt base and transit-amplifying cells in higher tiers (Figure S1A). ChIP-seq for H3K27me3 on pure populations of villus cells and Lgr5+ ISC gave robust, reproducible data (Figure S1B–C). Peaks called by SICER (Zang et al., 2009) gave the expected distribution in promoters, gene bodies and intergenic regions (Figure S1B), with average peak width ~6.5 kb. The range of H3K27me3 levels was wide: In unsupervised k-means clustering (k=5), two groups of genes showed exceptionally high H3K27me3, with marks present at the promoters and bodies of 551 genes in cluster 1 and mainly at the promoters of 1,777 genes in cluster 2 (Figure S1D). Most marked genes identified by SICER fell in clusters 1 or 2 and were shared among duplicate (ISC) or triplicate (villus) samples (Figure S1D). Promoters in clusters 3 and 4 carried on average at least 3-fold less H3K27me3 than those in clusters 1 and 2 (Figure S1E), whereas cluster 5 showed almost no H3K27me3, either in this analysis or by ChIP-seq peak calling.
H3K27me3 profiles were remarkably similar in ISC and villus cells (Figure S1B), even at heavily marked genes, and RNA-seq analysis of the same cell populations indicated that most genes in clusters 1 and 2 are silent in both compartments (Figure 1A). Because these profiles could conceal a subtle dynamic relationship of H3K27me3 to changes in mRNA, we used DiffReps (Shen et al., 2013) to identify 864 genes with different H3K27me3 levels (q <0.001) anywhere in the gene, including promoters, and CuffDiff (Trapnell et al., 2012) to identify ~4,000 genes with different transcript levels (≥3-fold, q <0.05) in ISC and villus cells. Most differences in H3K27me3 were low in magnitude and/or confidence and occurred at genes that did not change in expression (Figure 1B). Only 109 of 1,932 genes (5.6%) that were activated in villus cells – e.g., Cdkn2b (Figure 1C) – showed significantly less marking than in ISC. Three independent ChIP-seq experiments (Figure S1C) did not reveal H3K27me3 loss at hundreds of other genes that were activated as strongly in villus cells, but showed reproducible and modest changes at genes that are equally active in ISC and villus cells (Figure 1B–D). Therefore, the poor association between H3K27me3 loss and mRNA gain does not reflect assay insensitivity. Rather, most genes activated in villus cells lack H3K27me3 in either cell type (Figure 1D).
Figure 1. H3K27me3 in adult mouse intestinal stem and villus cells.

See also Figure S1.
(A) H3K27me3 distribution in ISC and villus cells over the 2,328 genes most heavily marked in intestinal cells (clusters 1 and 2 from Figure S1D). H3K27me3 on gene bodies (5 equal-sized bins) ±2 kb is represented on the brown scale and RNA levels on the blue-red scale. Each row represents the same gene in ISCs and villus cells, with typically undetectable to low mRNA.
(B) Scatter plot of 3,879 transcripts differentially expressed (≥3-fold, q<0.05) in purified villus cells (y-axis) and Lgr5+ ISC (x-axis), represented by grey dots outside the dotted lines. H3K27me3 gains and losses in villus cells compared to ISCs (determined using DiffReps, q<0.001) are overlaid in red and blue, respectively.
(C) ChIP- and RNA-seq traces at Cdkn2b, showing significant H3K27me3 loss accompanying increased mRNA expression in villus cells compared to ISC. In contrast, Pkd2I2 illustrates gain of H3K27me3 in villus cells, with insignificant change in mRNA expression.
(D) Genes that lose H3K27me3 during differentiation among those that show higher mRNA (≥3-fold, q<0.05) in villus cells over ISC (arranged in order of log2 fold-gain of mRNA). For all 1,932 genes upregulated in villus cells, the pie charts show the fraction of genes with SICER-identified peaks in ISC or villus cells.
(E) Gains of H3K27me3 in villus cells (arranged in descending order, reads/bp X1000) were concentrated among genes expressed selectively in ISC, including Lgr5, as illustrated in the adjoining ChIP- and RNA-seq data tracks.
Conversely, 248 of the 637 genes (39%) that showed significantly more H3K27me3 in villus cells than in ISC – including Lgr5, Ascl2 and Myc – are highly active in ISC and repressed in villus cells (Figure 1E). Together, these findings imply that PRC2 has little role in restraining villus genes in ISC, but may mediate silencing of genes such as Lgr5 and Ascl2 once ISC begin to differentiate. The highly similar H3K27me3 profiles in ISC and villus cells raise the additional possibility of a larger role in tissue-specific gene control than in regulating genes within a tissue.
Tissue-restricted patterns of H3K27me3 and bivalent promoters in adult somatic cells
To compare the distribution of H3K27me3 marks in the intestine with that in other mouse tissues, we applied the same unsupervised k-means clustering as above (Figure S1D) to public ChIP-seq data from self-renewing cells that originate in distinct germ layers: matrix cells in the skin (Lien et al., 2011) and lineage marker-depleted Sca1+ Kit+ (LSK) cells in blood (Hasemann et al., 2014). About 2,000 genes were heavily marked in each case (Figure S2A) and a total of 3,578 genes belonged in the top 2 clusters in the intestine, skin or blood. Only 976 of these genes were heavily marked and transcriptionally inactive in all three tissues, constituting a group that is particularly enriched for early developmental functions (Figure S2B) and which we designate as Group 1 (denoted by a dotted brown bar in Figure 2A). A larger fraction of genes (Group 2) was robustly marked in just one or two tissues and largely devoid of H3K27me3 in the other(s). For example, 743 genes were uniquely marked in intestinal cells; RNA levels in each case were negatively correlated with high H3K27me3 (Figure 2A).
Figure 2. Differential bivalent domains in adult mouse tissues.

See also Figure S2.
(A) H3K27me3 (amber), mRNA (green), and promoter H3K4me3 (blue) profiles in adult intestinal villus, blood (Hasemann et al., 2014) and skin (Lien et al., 2011) cells. Genes strongly marked in any of the 3 tissues were collated (Figure S2A–B) and clustered on the basis of H3K27me3 levels in one or more tissues. H3K27me3 is represented on gene bodies (5 equal-sized bins) ±2 kb and H3K4me3 is represented ±1.5 kb from the TSS (center).
(B) Average H3K27me3 (left) and H3K4me3 (right) levels in intestinal villus cells at genes that are strongly marked with H3K27me3 in all 3 tissues (Group1, dotted brown); carry H3K27me3 in the intestinal epithelium and up to one other tissue (Group 2a, solid brown); or lack H3K27me3 in intestinal cells (Group 2b, blue).
(C) ChIP- (H3K27me3 and H3K4me3) and RNA-seq tracks of representative genes.
(D) mRNA levels among genes from the three groups in villus cells and ISC. Boxes demarcate the 25th and 75th percentiles, whiskers represent the 1.5X interquartile range.
Although H3K4me2/3 has previously been noted at H3K27me3-bearing promoters in some fetal, adult and ESC-derived cells (Abraham et al., 2013; Barski et al., 2007; Liu et al., 2013; Mikkelsen et al., 2007), the distribution and functions of bivalency have not been established. Notably, the genes we identify as heavily marked with H3K27me3 in the 3 adult tissues showed distinct patterns of promoter H3K4me3 marking (Figure 2A). Genes in Group 1 carried little to no H3K4me3 in any tissue. Those in the second group, which were marked with H3K27me3 in just one or two tissues, showed high average H3K4me3 and mRNA levels in the others. In Figure 2A, a solid brown bar denotes genes that carry H3K27me3 in intestinal - but not in blood and/or skin - cells (Group 2a), and the blue bar denotes genes marked with H3K27me3 in blood and/or skin – but not in intestinal – cells (Group 2b). Whereas H3K27me3 levels were comparably high at promoters in Groups 1 and 2, levels of H3K4me3 varied widely and were on average considerably higher in Group 2, even in the index tissue with high H3K27me3 (shown for the intestine in Figure 2B). For example, Barx1, a silent gene from Group 1, has high H3K27me3 and virtually no H3K4me3 at the promoter in villus cells, whereas Sox9, an expressed gene from Group 2b, lacks H3K27me3 in intestinal cells but has considerable H3K4me3 (Figure 2C). Genes from Group 2a, such as Tlr2, are distinct in showing significant trimethylation at H3K27 and H3K4. This is the defining feature of promoter bivalency in ESCs (Bernstein et al., 2006), where these nominally opposing marks appear on the same nucleosome in the same cells (Bernstein et al., 2006; Voigt et al., 2012). Unlike H3K4me3 levels at bivalent genes in ESCs, which are uniformly high (Bernstein et al., 2006), the levels in adult intestinal cells ranged from 30 density units – similar to expressed genes – to weak signals that eluded detection by peak-calling; similar variation was evident in blood and skin cells (Figure 2A). Genes with heavy H3K27me3 are tightly repressed, whether or not the promoter carries H3K4me3, as Figure 2D shows for intestinal stem and villus cells. Thus, bivalent domains in the adult intestine do not poise genes for expression in differentiated cells.
To verify that H3K27me3 marking and bivalency are consistent across stages in crypt-villus differentiation, we examined two intermediate transit-amplifying populations: crypt enterocyte and secretory progenitors (Kim et al., 2014). To detect modified histones at the resolution of single nucleosomes, we digested chromatin with micrococcal nuclease and, in lieu of H3K4me3, we performed ChIP-seq for H3K4me2, a mark known to be highly correlated with H3K4me3 at promoters (Barski et al., 2007; Heintzman et al., 2007; Mohn et al., 2008), as we confirmed (Figure S2C). Genes in Groups 1 and 2a, as defined in ISC and villus cells, showed the strongest H3K27me3 signals in both types of crypt progenitors and H3K4me2 was clearly present at Group 2a promoters (Figure 3A). Moreover, H3K4me2 levels varied exactly as they did in ISC and villus cells, with the average signal in Group 2a intermediate between those in Groups 1 and 2b (Figure S3A). Thus, silent genes with promoter H3K4me2/3 carry tissue-restricted H3K27me3 marks that are stable in four distinct intestinal cell populations.
Figure 3. Acquired tissue-specific bivalency in adult tissues.

See also Figures S2 to S4.
(A) H3K27me3 (amber) and corresponding H3K4me2 (blue) profiles in enterocyte and secretory progenitors in intestinal crypts. Clustering is based on genes heavily marked with H3K27me3 in the 3 adult tissues (Figure 2A). H3K27me3 is shown on gene bodies (5 equal-sized bins) ±2 kb and H3K4me2 is represented ±1.5 kb from the TSS (center).
(B) H3K27me3 profiles in undifferentiated ESCs (data taken from (Subramanian et al., 2013)) of the same genes as in A. Pie charts show the fraction of genes bearing H3K27me3 in ESCs in each of the 3 groups denoted by brackets.
(C–D) Overlap of genes carrying H3K27me3 (C) or regarded as bivalent in ESCs (D, www.dailab.sysu.edu.cn/bgdb), with those marked in the adult mouse duodenum. ChIP-seq data tracks in C illustrate one of 1,035 genes - Casc4 - with intestinal bivalency (promoter H3K27me3 and H3K4me3) and no evidence of PRC2 activity in ESCs.
Bivalent promoters in adult tissues differ from those in ESCs
To determine if H3K27me3-marked genes and bivalent domains in adult tissues are also targets of PRC2 regulation in early embryos, we used unsupervised k-means clustering as above (k=5) to identify genes heavily marked in undifferentiated ESCs grown in the presence of serum (Subramanian et al., 2013). The 2,159 genes in clusters 1 and 2 correspond to most of the genes at which SICER identified peaks (Figure S3B). H3K27me3 was absent from 434 of those genes (20.1%) in any of the 3 adult tissues and from 602 genes (27.8%) in at least one tissue (Figure S3C–D), revealing broad erasure of some H3K27me3 marks and tissue-selective erasure of others during development. About half the marked ESC promoters remained so in at least one adult tissue, but these genes were not evenly distributed. Among genes in Group 1 – i.e., those marked and silent in all 3 adult tissues – 82% have high H3K27me3 in ESCs; in contrast, 77% of genes marked only in the adult intestine – and 48% of genes marked in the intestine and one other tissue – lack H3K27me3 in ESCs (Figure 3B–C).
To verify this late acquisition of H3K27me3 in adult tissues, we pooled all putative PRC2 targets identified in various ChIP-seq analyses of H3K27me3 (Das et al., 2014; Shpargel et al., 2014; Subramanian et al., 2013) or SUZ12 (Riising et al., 2014) in undifferentiated ESCs grown in serum or 2i conditions. Even this liberal set of 8,173 candidate target genes in ESCs excluded at least 751 of the 3,578 genes (21%) that carry H3K27me3 selectively in adult tissues (Figure S3E). The canonical definition of bivalency in ESCs (www.dailab.sysu.edu.cn/bgdb) also applies to only 44% of genes showing high H3K27me3 in the adult intestine (Figure 3D). Moreover, the functions of genes with shared and tissue-restricted bivalency differ markedly: Transcription factors that regionalize and pattern the embryo predominate among PRC2 targets in ESCs, whereas genes marked mainly in adult tissues serve diverse functions, such as organogenesis and cytoskeletal organization (intestine), receptor tyrosine kinase signaling (blood), and excretion (skin) (Figure S4). Thus, hundreds of genes in various somatic tissues acquire bivalent domains some time after early embryogenesis.
PRC2 loss in vivo impairs cell proliferation and preferentially activates genes with acquired tissue-restricted H3K27me3
To define this dependency, we disrupted Eed, a gene required for PRC2 assembly and catalytic activity (Montgomery et al., 2005). Crosses between EedFl/Fl (Xie et al., 2014) and VillinCreER (el Marjou et al., 2004) mice yielded EedFl/Fl;VillinCreER mice, which allowed inducible, epithelium-specific activation of Cre recombinase in the small intestine. Following tamoxifen exposure, H3K27me3 first became restricted to villus tips, i.e., to cells born before Eed deletion, and total loss ensued within 4 days (Figures 4A and S5A). This loss reflected absence of EZH2 (Figure S5B), indicating that enzymes in the PRC2 complex are unstable in the absence of EED. MKI67 staining and BrdU incorporation revealed markedly reduced crypt cell replication (Figures 4B and S5C), and villi were consequently stunted and dysmorphic (Figures 4C and S5A). In the wake of widespread crypt failure, a few crypts began to fill with replicating cells (Figure 4B–C, arrowheads), increased gradually in abundance, and produced normal villi alongside stunted Eed-null villi. Presence of EZH2 and H3K27me3 in these intact villi (Figures 4A and S5B, arrowheads) indicates that they originate in cells that escaped biallelic Eed deletion; the selective advantage of such wild-type crypts over mutant crypts is well established in other mouse models (Bettess et al., 2005; van der Flier et al., 2009). Alkaline phosphatase activity, a marker of cell maturity, was confined to the tips of Eed−/− villi, revealing delayed or aberrant - not precocious - enterocyte maturation (Figure 4D).
Figure 4. Intestinal epithelial defects in the absence of PRC2.

See also Figure S5. Tissue sections from Eed+/+ and Eed−/− (various days after tamoxifen exposure) mouse duodenum. All scale bars, 100 μm.
(A) H3K27me3 immunostains, showing epithelium-specific loss (outside the dotted line), with preservation of signal in the lamina propria.
(B) Ki67 immunostains, showing reduced crypt cell replication. Arrowheads indicate EED-proficient (H3K27me3+, replication-competent) crypts.
(C) Hematoxylin & eosin (H&E) stains, showing stunted, dysplastic villi amidst rare, scattered EED-proficient crypts and intact villi.
(D) Alkaline phosphatase stains, showing mature enterocytes confined to Eed−/− villus tips.
mRNA-seq analysis revealed that transcripts expressed (reads per kb per million sequence tags, RPKM >1) in wild-type villus epithelium – including abundant transcripts such as Alpi and Villin – were largely undisturbed in Eed−/− intestinal villus cells (Figure 5A). Indeed, considering all dysregulated genes (q <0.05), those expressed in Eed+/+ villi changed by barely 2-to 3-fold, with RNA gains and losses occurring in roughly equal proportion (Figure 5A–B). Moreover, genes expressed in Eed+/+ villi and modestly perturbed in Eed−/− cells generally lack H3K27me3 marking in wild-type cells and, when occasionally present, the levels are low (Figure 5B). Therefore, these minor disturbances likely reflect indirect or secondary effects of PRC loss. Furthermore, only 20 of the 248 ISC-specific genes that gain H3K27me3 upon silencing in wild-type villus cells (Figure 1E) showed elevated expression in Eed−/− villi (Figure S5D), indicating that PRC2 is not required to repress most of these genes. Rather, PRC2 loss prominently affected genes that are silent (RPKM <1) and carry heavy H3K27me3 marks in the wild-type intestine (Figure 5B); activation of these genes in Eed−/− villi indicates that they are the principal, direct targets of PRC2 repression in vivo. They include Cdkn2a (RPKM gain 142.86), a known PRC2 target that singularly explains replication arrest in other PRC2-null tissues (Ezhkova et al., 2011; Hidalgo et al., 2012; Xie et al., 2014) and hence likely also in intestinal crypts; the linked gene Cdkn2b, which is dynamically marked and regulated in the wild-type epithelium (Figure 1B–C), was unperturbed (Figure S5E).
Figure 5. Gene deregulation in PRC2-null intestinal villi and other mouse tissues.

(A) Differential gene expression in purified Eed+/+ (x-axis) and Eed−/− (y-axis) villus epithelium, determined from triplicate RNA-seq analysis 4 days after tamoxifen exposure. Dots represent unaffected (grey) and altered (q <0.05, blue) transcripts.
(B) Relation of mRNA changes in Eed−/− villus cells (all blue dots in A) to basal expression and H3K27me3 marks in wild-type villi. Most dysregulated genes that are expressed in wild-type intestinal villi lack H3K27me3 and are as likely to rise as to fall (pie chart) in mutant villi; hence, these effects are likely indirect. In contrast, genes that are barely or not expressed in wild-type villi (e.g., Barx1, Tbx15, etc.) typically carried significant H3K27me3 in wild-type villi and these effects are likely direct. Box plot shows H3K27me3 ChIP-seq signal density (TSS ±500 bp) at the genes we consider to be affected directly or indirectly by PRC2 loss. Boxes represent the 25th and 75th percentiles, and whiskers represent the 10th and 90th percentiles.
(C) Transcripts absent in the wild-type tissue and increased >3-fold in PRC2-null intestine (this study), blood (Xie et al., 2014) or skin (Ezhkova et al., 2011). Cdkn2a and Tbx15 are the only genes that meet these criteria in all 3 tissues. Violin plots show H3K27me3 signal density (black bar = median) in the 3 tissues at genes activated specifically in each.
(D) Activation in Eed−/− intestinal villus cells of up-regulated genes (direct targets, very few of which showed reduced expression) marked with H3K27me3 in all wild-type tissues or only in the intestine. Boxes represent the 25th and 75th percentiles and whiskers represent the 1.5X interquartile range. Significance in B and D was determined using the Mann-Whitney test.
Notably, Cdkn2a was one of only 2 genes aberrantly activated >3-fold in each of the three adult tissues we considered (Tbx15 was the other), and different genes were prominently derepressed in PRC2-null skin or blood (Figure 5C, top). Moreover, the average mRNA gain in Eed−/− villi was significantly higher for genes that carry H3K27me3 only in the intestine than for genes marked in all tissues (Figure 5D). Thus, the principal targets of PRC2 are not the few genes that acquire H3K27me3 during intestinal crypt-villus differentiation or the large number that is constitutively marked in multiple tissues, but genes with intestine-restricted H3K27me3. Genes selectively reactivated in blood or skin also were those bearing high tissue-specific H3K27me3 in each case (Figure 5C, bottom).
Activation-associated H3K4me2/3 at promoters underlies gene responses to PRC2 loss
Genes carrying equally strong H3K27me3 marks in wild-type intestines were activated to different degrees in Eed−/− villi, where mRNA gains ranged from <1 RPKM (e.g., Zic2, gain 0.37) to dozens (e.g., Phld3a, gain 48.4) (Figure 5A). This variation was not spurious because even tiny increases (e.g., Emx2, gain 0.22 RPKM) were highly similar across triplicate samples that showed high overall concordance (Figures 6A and S6). Among genes strongly marked with H3K27me3 in wild-type intestines, average mRNA levels for genes located within 100 kb of highly deregulated genes were similar to those that remained silent (Figure S7A). Moreover, although all four Hox clusters are broadly and strongly marked with H3K27me3 in adult wild-type tissues, different tissues activate distinct Hox genes, and genes in the same Hox cluster showed striking differences in mRNA expression in the mutant intestine (Figure S7B). Thus, proximity to active genes did not overtly influence PRC2 dependency in vivo. Instead, the extent of aberrant gene activity was commensurate with the levels of H3K4me2 and H3K4me3 at the promoter in wild-type intestinal villi (Figure 6B). Genes such as Nkx6.1 with high H3K4me2/3 were substantially derepressed, genes such as Aqp6 lacking promoter H3K4me2/3 remained silent, and genes such as Nr2f1 with intermediate H3K4me2/3 marking were activated modestly (Figure 6C).
Figure 6. Basal H3K4me3 levels at bivalent promoters are crucial determinants of PRC2 dependency in the adult intestine.

See also Figure S6.
(A) RNA-seq tracks illustrating the wide range of gene activation in Eed−/− villus epithelium. Note the different y-axis scales for 3 representative examples. Small gains in absolute mRNA levels (e.g., Emx2, others in Figure S6) are consistent across triplicate samples.
(B) Wild-type H3K27me3, H3K4me3 and H3K4me2 signal densities at promoters (TSS ±1.5 kb) of genes activated in PRC2-null intestinal villi. Genes are arrayed in descending order of mRNA gain in mutant cells, as reflected in the left heatmap. All these genes show similar H3K27me3 marking in the wild-type intestine and the degree of gene activation is proportional to the level of promoter H3K4me3.
(C) Illustrative ChIP- and RNA-seq tracks from points on the spectrum of gene deregulation.
To confirm that mRNA increases in PRC2-null cells are a function of H3K4me3 marking in wild-type cells, we divided all the genes aberrantly activated in mutant villus cells into quintiles of the absolute gain in mRNA levels. Average promoter H3K4me3 signals were proportional to these quintiles of mRNA gain, whereas H3K27me3 levels were identical in all quintiles (Figure 7A). Activation of H3K27me3-marked genes in PRC2-null blood and skin cells (Ezhkova et al., 2011; Xie et al., 2014) also mirrored promoter H3K4me3 levels in the respective wild-type tissues (Figures 7B and S7C). Conversely, we arranged all genes heavily marked with H3K27me3 in the intestine (clusters 1–2 in Figure S1D) according to the level of promoter (TSS ±0.5 kb) H3K4me3 in wild-type intestines (Figure 7C). As expected, genes in Group 1, which lack H3K4me3 in any tissue (Figure 2A), sorted to the left and genes in Group 2a, which show variable promoter H3K4me3 marks in the wild-type intestine, sorted to the right. Genes aberrantly activated in Eed−/− intestinal villi mapped mainly to the latter group and transcript levels were directly proportional to native H3K4me3 marking in wild-type cells (Figures 7C and S7D).
Figure 7. Relation of basal H3K4me3 levels and RNA Pol-II binding to the transcriptional consequences of PRC loss in adult mouse tissues.

See also Figure S7.
(A) Average H3K4me3 and H3K27me3 profiles at genes activated in Eed−/− intestinal villi, separated into quintiles of absolute increase in mRNA levels.
(B) Average H3K4me3 profiles for the top, middle, and bottom quintiles of genes activated in PRC2-null blood (Xie et al., 2014) and skin (Ezhkova et al., 2011), determined from published microarray data. Heatmaps are shown in Figure S7.
(C) Gene deregulation in PRC2-null villus epithelial cells (absolute mRNA gain, y-axis) is highly correlated with the level of promoter H3K4me3 in wild-type intestine (x-axis). Genes in Group 1 carry little to no H3K4me3 and accordingly concentrate toward the left (violin plots); few such genes (examples named) are activated. In contrast, genes in Group 2a express in nearly linear relation to basal H3K4me3 levels. The dotted line shows curve fit using non-linear regression. Figure S7D shows the same analysis restricted to transcripts increased at P <0.05.
(D) H3K27me3 (amber), mRNA (green – from Figure 2A), H3K4me3 (blue – from Figure 2A), and Pol2 (purple) ChIP-seq signal densities (centered on TSSs ±10 kb or 1.5 kb) in wild-type mouse intestinal villus cells. Genes are clustered and grouped exactly as in Figure 2A. Genes active in villus cells (Group 2b) show Pol2 occupancy, whereas genes with H3K27me3 acquired in the intestine and up to two (Group 1) or one other tissue (Group 2a) lack RNA expression or Pol2 binding.
(E) Average Pol2 occupancy at genes in Groups 1 (high H3K27me3 in all 3 tissues), 2a (high H3K27me3 in the intestine and up to 1 other tissue, and 2b (no intestinal H3K27me3). ChIP- and RNA-seq tracks from representative genes in Groups 2a and 2b.
These data reveal that transcriptional consequences of PRC2 loss in adult somatic cells in vivo are virtually confined to genes with acquired tissue-specific bivalency and directly reflect native promoter H3K4me2/3 levels. Of note, ChIP-seq showed Pol2 occupancy at transcribed genes that lack H3K27me3 (Group 2b) but not at H3K27me3-marked genes, irrespective of the absence (Group 1) or presence (Group 2a) of H3K4me3 (Figure 7D–E). Thus, H3K27me3 may preclude transcription of tissue-restricted bivalent genes in part by preventing Pol2 recruitment.
DISCUSSION
Findings in ESCs are commonly extended to implicate H3K27me3 as a transcriptional repressor in other contexts. Even in ESCs, however, PRC2 seems dispensable to initiate gene silencing and H3K27me3 appears at many genes that are repressed in response to other factors (Riising et al., 2014). Moreover, poising of promoters for activation in differentiating cells may be a phenomenon unique to ESCs under specific conditions and bivalent domains lack a proven role in adult tissues (Lien et al., 2011). Indeed, it has remained unclear if H3K27me3 and other histone marks are necessary to silence genes or merely signify the lack of transcriptional activity. Our study clarifies PRC2’s role and target genes in adult somatic tissues.
Bivalent domains in the adult intestinal epithelium are distinct from those in ESCs
Several features distinguish the bivalent promoters we identify in adult cells from those previously described in undifferentiated ESCs. First, more than half of the 1,322 bivalent genes in the small intestine – and similar fractions in skin and blood – lack significant H3K27me3 in at least one other adult tissue; different genes carry bivalent marks in different organs; and only 23% of genes marked with H3K27me3 exclusively in the intestine are also marked in ESCs. Thus, bivalency acquired during development is extensive and tissue-restricted. Second, promoter bivalency is largely invariant in ISCs, crypt progenitors, and terminally mature villus cells, and loss of PRC2 does not cause precocious gene activity or accelerate enterocyte differentiation. Thus, promoter bivalency is not a progenitor-cell attribute that poises genes for expression in differentiated cells, but rather a feature that distinguishes tissues from each other. Third, whereas H3K4me3 and H3K27me3 levels are equally high at bivalent promoters in ESCs (Bernstein et al., 2006), H3K4me2/3 signals in adult cells vary widely in the face of uniformly high H3K27me3, and gene activity in the absence of PRC2 is highly correlated with the basal level of H3K4me2/3. We conclude that the latter marks – or some feature associated with them – make genes vulnerable to transcription and that PRC2 suppresses this latent tendency. Fourth, Pol2 is present at bivalent promoters in ESCs (Marks et al., 2012) but not at those in intestinal villus cells. Finally, tissue-specific bivalent genes in at least 3 adult tissues derived from different germ layers make up the vast majority of genes that depend on PRC2 for tight repression. Genes with strong H3K27me3 marks in all 3 tissues (Group 1) typically lack concomitant H3K4me2/3, and even in this group, the few genes with barely detectable H3K4me2/3 are weakly reactivated in Eed−/− intestines, commensurate with low H3K4me2/3. Only a handful of genes – including certain Hox genes – are reactivated despite low levels of H3K4me2/3 marking in wild-type cells.
Intestine-restricted bivalency arises some time after the ESC stage, at genes that serve in tissue morphogenesis, organelle biogenesis and cytoskeletal organization (Figure S4). Bivalent marks specific to the skin and blood also appear at genes with plausible roles in development of those tissues. Therefore, these genes were likely active during organogenesis and some persistent transcription factor or chromatin modification might leave them susceptible to transcription in adults. We propose that tissue-specific control mechanisms recruit PRC2 to place H3K27me3 at these genes in order to avoid mRNA expression that is dispensable and possibly deleterious. It is worth noting in this light that, although deletion of Cdkn2a restores the proliferative potential of PRC2-deficient blood cells (Hidalgo et al., 2012), other defects remain, leading to stem-cell exhaustion, for example (Xie et al., 2014). Thus, Cdkn2a is not the only target of PRC2 repression in adult tissues and PRC2-dependent silencing functions include preventing transcription of selected developmental genes in adult cells. Irrespective of whether target promoters carry H3K4me2/3 fortuitously or as vestiges of tissues’ particular ontogeny, our findings argue that the two opposing marks lie in the same cells, not in different subpopulations.
As it is unclear exactly when in development genes acquire bivalency, it is difficult to study how PRC2 may be recruited at bivalent genes. Unmethylated CpG islands (CGI) are thought to be an important means of PRC2 recruitment (Mohn et al., 2008; Riising et al., 2014; Voigt et al., 2013) and could have a role at ISC-specific genes, such as Lgr5, that acquire H3K27me3 during crypt differentiation. At these 248 genes, only 186 of the 489 sites (38%) that gain H3K27me3 lie in CGI, corresponding to 155 genes (62%). Thus, PRC2 can be recruited to some sites independent of CGI or spreads H3K27me3 into these sites from distant CGI.
PRC2 requirements in adult somatic tissues
This study helps distinguish PRC2 requirements from its incidental activities in adult tissues in vivo. Although most intestinal genes heavily marked with H3K27me3 are constitutively silent, thousands of other silent genes carry little to no H3K27me3. Furthermore, genes dynamically regulated during crypt-villus differentiation generally lack reciprocal changes in H3K27me3 and are unaffected by PRC2 loss; even most of the 248 genes that get silenced and simultaneously acquire H3K27me3 in wild-type villus cells do not depend on PRC2 for this silencing. Thus, H3K27me3 is not an obligate repressive mark during intestinal self-renewal and behaves at many genes as a marker, rather than a cause, of transcriptional inactivity. Even among genes that carry H3K27me3 in multiple adult tissues (Group 1), few become active in the absence of PRC2, at least in adults in the time frame of our experiments. It is unclear why these genes remain silent. Absence of promoter H3K4me3 may be sufficient to avoid activation or other repressive effectors, such as methylated DNA, may prevail in the absence of H3K27me3. PRC2 is, however, required to repress genes with tissue-restricted bivalency, and our findings imply that H3K27me3 actively opposes some feature, such as recruitment of Pol2, that might predispose those genes to transcriptional activity.
Drugs that inhibit the PRC2 complex are currently being developed to treat certain cancers. Our findings in vivo offer a platform to anticipate drug toxicities and to design pharmacodynamic markers. Because crypt cell replication is as vulnerable to PRC2 loss as other self-renewing tissues (Delgado-Olguin et al., 2012; Ezhkova et al., 2011; Schwarz et al., 2014; Xie et al., 2014), EZH2 inhibitors may induce intestinal toxicity. Moreover, different genes have bivalent promoters in various tissues and repression of genes with high native H3K4me2/3 in wild-type cells is especially dependent on PRC2. mRNA expressed from such genes in readily accessible cells, such as adult leukocytes or the oral mucosa, may serve as a useful gauge of drug activity.
EXPERIMENTAL PROCEDURES
Mice
Lgr5EGFP-IRES-CreER (Barker et al., 2007) and wild-type C57BL/6 mice were purchased from The Jackson Laboratories; VillinCreER-T2 mice (el Marjou et al., 2004) were a gift from Sylvie Robine (Institut Pasteur, France); EedFl mice were described previously (Xie et al., 2014). Mice 8 weeks or older received 2 mg tamoxifen by intraperitoneal injections for 5 consecutive days and, in some studies, 1 mg bromodeoxyuridine 60 min before euthanasia. RNA was collected from the proximal 1/3 small intestine (duodenum) 4 days after the end of tamoxifen treatment.
Cell isolation
Mouse duodeni were washed in phosphate-buffered saline (PBS) and rotated in 5 mM EDTA in PBS (pH 8) at 4ºC for 40 min, with man ual shaking every 10 min. Suspensions were passed through 70 μm filters (B–D Falcon). Villus epithelium retained on the filters was washed in PBS before extraction of RNA or chromatin. Lgr5EGFP-IRES-CreER mouse intestines were depleted of villi by scraping with glass slides. Duodenal fragments were rotated in 5 mM EDTA in PBS (pH 8) at 4ºC, with manual shaking every 10 min for 40 min and a change of EDTA solution after 30 min. Isolated crypt epithelium was disaggregated over 30 min in 4% TrypLE solution (Invitrogen) at 37ºC and GFP hi cells were isolated by flow cytometry (BD FACSAria II SORP), as described previously (Kim et al., 2014). Isolation of crypt progenitors is described in the Extended Experimental Procedures.
ChIP-seq and data analysis
~3x10⁶ GFPhi mouse ISCs and ~5x10⁶ wild-type crypt progenitors or villus epithelial cells were used for ChIP-seq analysis of H3K27me3 and H3K4me3, and data were normalized, as described in the Supplemental Experimental Procedures. H3K27me3-enriched regions were identified by SICER version 1.1 (Zang et al., 2009), using 200-bp sliding windows, a gap size of 600 bp, input material for background subtraction, and a false discovery rate (FDR) of 0.01. Regions (broad peaks) were assigned to genes if they overlapped anywhere from 2 kb upstream of the TSS to 2 kb downstream of the TES, thus identifying 6719 marked genes in villus cells and 6428 marked genes in ISC. Nucleosomes carrying H3K4me3 or H3K27me3 in crypt progenitors and H3K4me3 in adult villi were determined with Nucleosome Positioning from Sequencing (NPS) (Zhang et al., 2008), using default parameters.
Differential ChIP signals were identified using DiffReps version 1.55.4 (Shen et al., 2013) using H3K27me3-ChIP and ChIP-Input (background) with default parameters, FDR <0.001 as a cut-off, and Negative Binomial test for statistical analysis. To calculate H3K27me3 density, genes were fitted to 10 kb length, divided in 5 equal bins. Scores were used to group genes by unsupervised K-means clustering in the DeepTools package (Ramirez et al., 2014) and plotted as heatmaps, representing each gene in 7 bins (−2 kb, 5 bins from TSS to TES, and +2 kb). Violin plots of H3K27me3 signal density and genes in Groups 1 or 2a (Figures 5C and 7C) were generated using ggplot2 tools in R (http://ggplot2.org). H3K4me2/3 and H3K27me3 densities were determined over 1.5 kb in both directions from TSSs using 10-bp windows and plotted as TSS-centred heatmaps. H3K4me3 read counts over the TSS ±0.5 kb were used to determine the relation of wild-type H3K4me3 signals to gene activation in Eed−/− intestinal villi (Figure 7C). Aggregate read density profiles of H3K27me3, H3K4me3, and Plo2 were generated using SitePro (Liu et al., 2011) and ggplot2 tools in the R package. Venn diagrams were created using BioVenn (Hulsen et al., 2008).
mRNA-seq
Total RNA was extracted using Trizol (Life Technologies) and 1 μg was used to prepare libraries with TruSeq RNA Sample Preparation Kit V2 (Illumina RS-122-2001). Single-end sequences obtained on Illumina HiSeq 2000 (50-bp reads) or NextSeq 500 (75-bp reads) instruments were aligned to the mouse genome (Mm9, NCBI build 37) using TopHat version 2.0.6. Library information appears in Table S1. mRNA levels of genes in triplicate samples were calculated as reads per kb of transcript per 1M mapped reads (RPKM) using Cufflinks version 2.0.2 (Trapnell et al., 2012). We determined differential gene expression using CuffDiff version 2.2.1 with FDR threshold 0.05 and generated heatmaps using GENE-E (Broad Institute).
Re-analysis of published data
ChIP- and RNA-seq data sets we used from the skin (matrix cells), blood (LSK cells), and undifferentiated ESCs are listed in the Supplemental Experimental Procedures. Raw data (FASTQ or BAM files) were processed similar to our data from intestinal cells, re-aligned to the mouse genome (Mm9, NCBI build 37), and H3K27me3-marked regions were identified using SICER. Genes in each tissue were grouped by k-means clustering (k=5) using DeepTools and the 2 clusters with highest H3K27me3 were considered for tissue-specific gains and losses. To avoid bias from different conditions and sources of data, comparisons of H3K27me3 (Figure 5C) and H3K4me3 (Figure 7A–B) marking were conducted separately on genes within each tissue. Gene expression in PRC2-deficient skin and blood cells (Ezhkova et al., 2011; Xie et al., 2014) had been determined on Affymetrix Mouse Genome 430 2.0 arrays. Given the lower transcript coverage (~13K genes) and lower sensitivity to detect differences, compared to RNA-seq, Figure 5C only considers genes that are represented on these arrays, marked by H3K27me3 in the native tissue, and altered >3-fold in the absence of PRC2 activity.
Supplementary Material
Highlights.
Distinct groups of promoters in adult tissues carry both H3K4me3 and H3K27me3 marks
Tissue-specific H3K27me3 appears late in development and keeps genes silent
Many other genes with stable or dynamic H3K27me3 are unaffected by loss of this mark
Bivalent genes are derepressed in PRC2-null cells in proportion to H3K4me3 levels
Acknowledgments
Supported by the Intestinal Stem Cell Consortium (U01DK103152) of the NIDDK and NIAID; the DFCI-Novartis Drug Discovery Program; NIH awards R01DK081113 (RAS), R01HG005085 (GCY), F32DK103453 (UJ), K99HG008399 (LP), and P50CA127003; and gifts from the Lind family. We thank Sylvie Robine for Villin-CreER-T2 mice and Gary Struhl, Jian Xu, Myles Brown, HoMan Chan, Veronica Saenz-Vash, and Huili Zhai for valuable discussions. Data (Suppl. Table S1) are deposited in the Gene Expression Omnibus (GSE71713). The authors declare no conflicts of interest.
Footnotes
AUTHOR CONTRIBUTIONS
U.J., K.N. and R.A.S. designed the studies; U.J., K.N. and M.S. acquired data; U.J., N.K.O., L.P. and G-C.Y. performed computational analyses; S.H.O. provided EedFl/Fl mice; R.A.S. supervised the study; U.J. and R.A.S. drafted the manuscript.
Publisher's Disclaimer: This is a PDF file of an unedited manuscript that has been accepted for publication. As a service to our customers we are providing this early version of the manuscript. The manuscript will undergo copyediting, typesetting, and review of the resulting proof before it is published in its final citable form. Please note that during the production process errors may be discovered which could affect the content, and all legal disclaimers that apply to the journal pertain.
References
- Abraham BJ, Cui K, Tang Q, Zhao K. Dynamic regulation of epigenomic landscapes during hematopoiesis. BMC Genomics. 2013;14:193. doi: 10.1186/1471-2164-14-193. [DOI] [PMC free article] [PubMed] [Google Scholar]
- Alder O, Lavial F, Helness A, Brookes E, Pinho S, Chandrashekran A, Arnaud P, Pombo A, O’Neill L, Azuara V. Ring1B and Suv39h1 delineate distinct chromatin states at bivalent genes during early mouse lineage commitment. Development. 2010;137:2483–2492. doi: 10.1242/dev.048363. [DOI] [PMC free article] [PubMed] [Google Scholar]
- Azuara V, Perry P, Sauer S, Spivakov M, Jorgensen HF, John RM, Gouti M, Casanova M, Warnes G, Merkenschlager M, et al. Chromatin signatures of pluripotent cell lines. Nat Cell Biol. 2006;8:532–538. doi: 10.1038/ncb1403. [DOI] [PubMed] [Google Scholar]
- Barker N, van Es JH, Kuipers J, Kujala P, van den Born M, Cozijnsen M, Haegebarth A, Korving J, Begthel H, Peters PJ, et al. Identification of stem cells in small intestine and colon by marker gene Lgr5. Nature. 2007;449:1003–1007. doi: 10.1038/nature06196. [DOI] [PubMed] [Google Scholar]
- Barski A, Cuddapah S, Cui K, Roh TY, Schones DE, Wang Z, Wei G, Chepelev I, Zhao K. High-resolution profiling of histone methylations in the human genome. Cell. 2007;129:823–837. doi: 10.1016/j.cell.2007.05.009. [DOI] [PubMed] [Google Scholar]
- Bernstein BE, Mikkelsen TS, Xie X, Kamal M, Huebert DJ, Cuff J, Fry B, Meissner A, Wernig M, Plath K, et al. A bivalent chromatin structure marks key developmental genes in embryonic stem cells. Cell. 2006;125:315–326. doi: 10.1016/j.cell.2006.02.041. [DOI] [PubMed] [Google Scholar]
- Bettess MD, Dubois N, Murphy MJ, Dubey C, Roger C, Robine S, Trumpp A. c-Myc is required for the formation of intestinal crypts but dispensable for homeostasis of the adult intestinal epithelium. Mol Cell Biol. 2005;25:7868–7878. doi: 10.1128/MCB.25.17.7868-7878.2005. [DOI] [PMC free article] [PubMed] [Google Scholar]
- Boyer LA, Plath K, Zeitlinger J, Brambrink T, Medeiros LA, Lee TI, Levine SS, Wernig M, Tajonar A, Ray MK, et al. Polycomb complexes repress developmental regulators in murine embryonic stem cells. Nature. 2006;441:349–353. doi: 10.1038/nature04733. [DOI] [PubMed] [Google Scholar]
- Cui K, Zang C, Roh TY, Schones DE, Childs RW, Peng W, Zhao K. Chromatin signatures in multipotent human hematopoietic stem cells indicate the fate of bivalent genes during differentiation. Cell Stem Cell. 2009;4:80–93. doi: 10.1016/j.stem.2008.11.011. [DOI] [PMC free article] [PubMed] [Google Scholar]
- Das PP, Shao Z, Beyaz S, Apostolou E, Pinello L, De Los Angeles A, O’Brien K, Atsma JM, Fujiwara Y, Nguyen M, et al. Distinct and combinatorial functions of Jmjd2b/Kdm4b and Jmjd2c/Kdm4c in mouse embryonic stem cell identity. Mol Cell. 2014;53:32–48. doi: 10.1016/j.molcel.2013.11.011. [DOI] [PMC free article] [PubMed] [Google Scholar]
- Delgado-Olguin P, Huang Y, Li X, Christodoulou D, Seidman CE, Seidman JG, Tarakhovsky A, Bruneau BG. Epigenetic repression of cardiac progenitor gene expression by Ezh2 is required for postnatal cardiac homeostasis. Nat Genet. 2012;44:343–347. doi: 10.1038/ng.1068. [DOI] [PMC free article] [PubMed] [Google Scholar]
- el Marjou F, Janssen KP, Chang BH, Li M, Hindie V, Chan L, Louvard D, Chambon P, Metzger D, Robine S. Tissue-specific and inducible Cre-mediated recombination in the gut epithelium. Genesis. 2004;39:186–193. doi: 10.1002/gene.20042. [DOI] [PubMed] [Google Scholar]
- Ezhkova E, Lien WH, Stokes N, Pasolli HA, Silva JM, Fuchs E. EZH1 and EZH2 cogovern histone H3K27 trimethylation and are essential for hair follicle homeostasis and wound repair. Genes Dev. 2011;25:485–498. doi: 10.1101/gad.2019811. [DOI] [PMC free article] [PubMed] [Google Scholar]
- Faust C, Lawson KA, Schork NJ, Thiel B, Magnuson T. The Polycomb-group gene eed is required for normal morphogenetic movements during gastrulation in the mouse embryo. Development. 1998;125:4495–4506. doi: 10.1242/dev.125.22.4495. [DOI] [PubMed] [Google Scholar]
- Hasemann MS, Lauridsen FK, Waage J, Jakobsen JS, Frank AK, Schuster MB, Rapin N, Bagger FO, Hoppe PS, Schroeder T, et al. C/EBPalpha is required for long-term self-renewal and lineage priming of hematopoietic stem cells and for the maintenance of epigenetic configurations in multipotent progenitors. PLoS Genet. 2014;10:e1004079. doi: 10.1371/journal.pgen.1004079. [DOI] [PMC free article] [PubMed] [Google Scholar]
- Hawkins RD, Hon GC, Lee LK, Ngo Q, Lister R, Pelizzola M, Edsall LE, Kuan S, Luu Y, Klugman S, et al. Distinct epigenomic landscapes of pluripotent and lineage-committed human cells. Cell Stem Cell. 2010;6:479–491. doi: 10.1016/j.stem.2010.03.018. [DOI] [PMC free article] [PubMed] [Google Scholar]
- Heintzman ND, Stuart RK, Hon G, Fu Y, Ching CW, Hawkins RD, Barrera LO, Van Calcar S, Qu C, Ching KA, et al. Distinct and predictive chromatin signatures of transcriptional promoters and enhancers in the human genome. Nat Genet. 2007;39:311–318. doi: 10.1038/ng1966. [DOI] [PubMed] [Google Scholar]
- Hidalgo I, Herrera-Merchan A, Ligos JM, Carramolino L, Nunez J, Martinez F, Dominguez O, Torres M, Gonzalez S. Ezh1 is required for hematopoietic stem cell maintenance and prevents senescence-like cell cycle arrest. Cell Stem Cell. 2012;11:649–662. doi: 10.1016/j.stem.2012.08.001. [DOI] [PubMed] [Google Scholar]
- Hulsen T, de Vlieg J, Alkema W. BioVenn - a web application for the comparison and visualization of biological lists using area-proportional Venn diagrams. BMC Genomics. 2008;9:488. doi: 10.1186/1471-2164-9-488. [DOI] [PMC free article] [PubMed] [Google Scholar]
- Juan AH, Derfoul A, Feng X, Ryall JG, Dell’Orso S, Pasut A, Zare H, Simone JM, Rudnicki MA, Sartorelli V. Polycomb EZH2 controls self-renewal and safeguards the transcriptional identity of skeletal muscle stem cells. Genes Dev. 2011;25:789–794. doi: 10.1101/gad.2027911. [DOI] [PMC free article] [PubMed] [Google Scholar]
- Kim TH, Li F, Ferreiro-Neira I, Ho LL, Luyten A, Nalapareddy K, Long H, Verzi M, Shivdasani RA. Broadly permissive intestinal chromatin underlies lateral inhibition and cell plasticity. Nature. 2014;506:511–515. doi: 10.1038/nature12903. [DOI] [PMC free article] [PubMed] [Google Scholar]
- Kuzmichev A, Nishioka K, Erdjument-Bromage H, Tempst P, Reinberg D. Histone methyltransferase activity associated with a human multiprotein complex containing the Enhancer of Zeste protein. Genes Dev. 2002;16:2893–2905. doi: 10.1101/gad.1035902. [DOI] [PMC free article] [PubMed] [Google Scholar]
- Lien WH, Guo X, Polak L, Lawton LN, Young RA, Zheng D, Fuchs E. Genome-wide maps of histone modifications unwind in vivo chromatin states of the hair follicle lineage. Cell Stem Cell. 2011;9:219–232. doi: 10.1016/j.stem.2011.07.015. [DOI] [PMC free article] [PubMed] [Google Scholar]
- Liu L, Cheung TH, Charville GW, Hurgo BM, Leavitt T, Shih J, Brunet A, Rando TA. Chromatin modifications as determinants of muscle stem cell quiescence and chronological aging. Cell Rep. 2013;4:189–204. doi: 10.1016/j.celrep.2013.05.043. [DOI] [PMC free article] [PubMed] [Google Scholar]
- Liu T, Ortiz JA, Taing L, Meyer CA, Lee B, Zhang Y, Shin H, Wong SS, Ma J, Lei Y, et al. Cistrome: an integrative platform for transcriptional regulation studies. Genome Biol. 2011;12:R83. doi: 10.1186/gb-2011-12-8-r83. [DOI] [PMC free article] [PubMed] [Google Scholar]
- Margueron R, Reinberg D. The Polycomb complex PRC2 and its mark in life. Nature. 2011;469:343–349. doi: 10.1038/nature09784. [DOI] [PMC free article] [PubMed] [Google Scholar]
- Marks H, Kalkan T, Menafra R, Denissov S, Jones K, Hofemeister H, Nichols J, Kranz A, Stewart AF, Smith A, et al. The transcriptional and epigenomic foundations of ground state pluripotency. Cell. 2012;149:590–604. doi: 10.1016/j.cell.2012.03.026. [DOI] [PMC free article] [PubMed] [Google Scholar]
- Meshorer E, Yellajoshula D, George E, Scambler PJ, Brown DT, Misteli T. Hyperdynamic plasticity of chromatin proteins in pluripotent embryonic stem cells. Dev Cell. 2006;10:105–116. doi: 10.1016/j.devcel.2005.10.017. [DOI] [PMC free article] [PubMed] [Google Scholar]
- Mikkelsen TS, Ku M, Jaffe DB, Issac B, Lieberman E, Giannoukos G, Alvarez P, Brockman W, Kim TK, Koche RP, et al. Genome-wide maps of chromatin state in pluripotent and lineage-committed cells. Nature. 2007;448:553–560. doi: 10.1038/nature06008. [DOI] [PMC free article] [PubMed] [Google Scholar]
- Mohn F, Weber M, Rebhan M, Roloff TC, Richter J, Stadler MB, Bibel M, Schubeler D. Lineage-specific polycomb targets and de novo DNA methylation define restriction and potential of neuronal progenitors. Mol Cell. 2008;30:755–766. doi: 10.1016/j.molcel.2008.05.007. [DOI] [PubMed] [Google Scholar]
- Montgomery ND, Yee D, Chen A, Kalantry S, Chamberlain SJ, Otte AP, Magnuson T. The murine polycomb group protein Eed is required for global histone H3 lysine-27 methylation. Curr Biol. 2005;15:942–947. doi: 10.1016/j.cub.2005.04.051. [DOI] [PubMed] [Google Scholar]
- Pasini D, Bracken AP, Hansen JB, Capillo M, Helin K. The polycomb group protein Suz12 is required for embryonic stem cell differentiation. Mol Cell Biol. 2007;27:3769–3779. doi: 10.1128/MCB.01432-06. [DOI] [PMC free article] [PubMed] [Google Scholar]
- Pasini D, Bracken AP, Jensen MR, Lazzerini Denchi E, Helin K. Suz12 is essential for mouse development and for EZH2 histone methyltransferase activity. EMBO J. 2004;23:4061–4071. doi: 10.1038/sj.emboj.7600402. [DOI] [PMC free article] [PubMed] [Google Scholar]
- Ramirez F, Dundar F, Diehl S, Gruning BA, Manke T. deepTools: a flexible platform for exploring deep-sequencing data. Nucleic Acids Res. 2014;42:W187–191. doi: 10.1093/nar/gku365. [DOI] [PMC free article] [PubMed] [Google Scholar]
- Riising EM, Comet I, Leblanc B, Wu X, Johansen JV, Helin K. Gene silencing triggers polycomb repressive complex 2 recruitment to CpG islands genome wide. Mol Cell. 2014;55:347–360. doi: 10.1016/j.molcel.2014.06.005. [DOI] [PubMed] [Google Scholar]
- Schwarz D, Varum S, Zemke M, Scholer A, Baggiolini A, Draganova K, Koseki H, Schubeler D, Sommer L. Ezh2 is required for neural crest-derived cartilage and bone formation. Development. 2014;141:867–877. doi: 10.1242/dev.094342. [DOI] [PubMed] [Google Scholar]
- Shen L, Shao NY, Liu X, Maze I, Feng J, Nestler EJ. diffReps: detecting differential chromatin modification sites from ChIP-seq data with biological replicates. PLoS One. 2013;8:e65598. doi: 10.1371/journal.pone.0065598. [DOI] [PMC free article] [PubMed] [Google Scholar]
- Shpargel KB, Starmer J, Yee D, Pohlers M, Magnuson T. KDM6 demethylase independent loss of histone H3 lysine 27 trimethylation during early embryonic development. PLoS Genet. 2014;10:e1004507. doi: 10.1371/journal.pgen.1004507. [DOI] [PMC free article] [PubMed] [Google Scholar]
- Subramanian V, Mazumder A, Surface LE, Butty VL, Fields PA, Alwan A, Torrey L, Thai KK, Levine SS, Bathe M, et al. H2A.Z acidic patch couples chromatin dynamics to regulation of gene expression programs during ESC differentiation. PLoS Genet. 2013;9:e1003725. doi: 10.1371/journal.pgen.1003725. [DOI] [PMC free article] [PubMed] [Google Scholar]
- Trapnell C, Roberts A, Goff L, Pertea G, Kim D, Kelley DR, Pimentel H, Salzberg SL, Rinn JL, Pachter L. Differential gene and transcript expression analysis of RNA-seq experiments with TopHat and Cufflinks. Nat Protoc. 2012;7:562–578. doi: 10.1038/nprot.2012.016. [DOI] [PMC free article] [PubMed] [Google Scholar]
- van der Flier LG, van Gijn ME, Hatzis P, Kujala P, Haegebarth A, Stange DE, Begthel H, van den Born M, Guryev V, Oving I, et al. Transcription factor achaete scute-like 2 controls intestinal stem cell fate. Cell. 2009;136:903–912. doi: 10.1016/j.cell.2009.01.031. [DOI] [PubMed] [Google Scholar]
- Voigt P, LeRoy G, Drury WJ, 3rd, Zee BM, Son J, Beck DB, Young NL, Garcia BA, Reinberg D. Asymmetrically modified nucleosomes. Cell. 2012;151:181–193. doi: 10.1016/j.cell.2012.09.002. [DOI] [PMC free article] [PubMed] [Google Scholar]
- Voigt P, Tee WW, Reinberg D. A double take on bivalent promoters. Genes Dev. 2013;27:1318–1338. doi: 10.1101/gad.219626.113. [DOI] [PMC free article] [PubMed] [Google Scholar]
- Xie H, Xu J, Hsu JH, Nguyen M, Fujiwara Y, Peng C, Orkin SH. Polycomb repressive complex 2 regulates normal hematopoietic stem cell function in a developmental-stage-specific manner. Cell Stem Cell. 2014;14:68–80. doi: 10.1016/j.stem.2013.10.001. [DOI] [PMC free article] [PubMed] [Google Scholar]
- Ying QL, Wray J, Nichols J, Batlle-Morera L, Doble B, Woodgett J, Cohen P, Smith A. The ground state of embryonic stem cell self-renewal. Nature. 2008;453:519–523. doi: 10.1038/nature06968. [DOI] [PMC free article] [PubMed] [Google Scholar]
- Zang C, Schones DE, Zeng C, Cui K, Zhao K, Peng W. A clustering approach for identification of enriched domains from histone modification ChIP-Seq data. Bioinformatics. 2009;25:1952–1958. doi: 10.1093/bioinformatics/btp340. [DOI] [PMC free article] [PubMed] [Google Scholar]
- Zhang Y, Shin H, Song JS, Lei Y, Liu XS. Identifying positioned nucleosomes with epigenetic marks in human from ChIP-Seq. BMC Genomics. 2008;9:537. doi: 10.1186/1471-2164-9-537. [DOI] [PMC free article] [PubMed] [Google Scholar]
- Zhu J, Adli M, Zou JY, Verstappen G, Coyne M, Zhang X, Durham T, Miri M, Deshpande V, De Jager PL, et al. Genome-wide chromatin state transitions associated with developmental and environmental cues. Cell. 2013;152:642–654. doi: 10.1016/j.cell.2012.12.033. [DOI] [PMC free article] [PubMed] [Google Scholar]
Associated Data
This section collects any data citations, data availability statements, or supplementary materials included in this article.