

Abstract
Objectives
Preventing postoperative recurrence after ileocolonic resection (ICR) for Crohn's disease (CD) is challenging. Defining the disturbances of the microbial composition and community structure after ICR and their link with early disease recurrence is crucial.
Design
Microbiota composition (fingerprinting and 16S rDNA sequencing) and community structure (correlation networks of bacterial species) were assessed from ileal mucosa sampled in 20 patients undergoing ICR and 6 months later during endoscopy from above (neoterminal ileum) and below (subanastomotic colon) the surgical anastomosis.
Results
ICR had a dramatic effect on gut microbial ecosystem. At surgery, CD mucosa harboured a dysbiotic microbiota with high proportions of α/β Proteobacteria and Bacilli. Six months later, half of the patients had recurrent lesions at ileocolonoscopy and presented higher numbers of Lachnospiraceae. Recurrence of endoscopic lesions was associated with enrichment in Enterococcus durans while patients in remission had increased proportions of Dorea longicatena and Bacteroides plebeius. Structural differences were striking between recurrence and remission microbiota; while the microbiota of patients with CD recurrence exhibited a loose community structure, the microbiota of patients in remission displayed communities that were robustly correlated to each other. Microbiota colonising the neoterminal ileum and subanastomotic colon 6 months after ICR only differed in patients with recurrence.
Conclusions
ICR modifies the gut microbiome. Remission after 6 months was associated with homogenous bacterial distribution around the anastomosis. Community structure and bacterial networks highlight target species, including Faecalibacterium prausnitzii and Ruminococcus gnavus, which may allow precise modulations of the overall microbial ecosystem towards remission pattern.
Keywords: INFLAMMATORY BOWEL DISEASE, SURGICAL RESECTION, MOLECULAR BIOLOGY, INTESTINAL MICROBIOLOGY, BACTERIAL INTERACTIONS
Significance of this study.
What is already known on this subject?
Recurrence of Crohn's disease (CD) after ileocolonic resection (ICR) is frequent.
Luminal flux and gut microbiota are involved in this setting.
What are the new findings?
ICR for CD strongly modifies the gut mucosal microbiota.
Spatial homogeneity in bacterial composition around the anastomosis is associated with maintenance of endoscopic remission.
Microbial community structure and bacterial species assemblages are cohesive during remission while a loose structure, together with a cluster of bacteria from the Proteobacteria phylum, is associated with endoscopic recurrence.
How might it impact on clinical practice in the foreseeable future?
Bacterial recolonisation following ICR might pave the way towards remission or recurrence.
Community structure and bacterial networks highlight target species that may allow precise modulations of the overall microbial ecosystem towards remission pattern.
Introduction
Crohn's disease (CD) is a chronic inflammatory disease of the intestine with an increasing incidence worldwide.1 It is a multifactorial disease where host genetic impairments and environmental triggers lead to the onset and maintenance of inappropriate host immune responses at the gut mucosa interface.
More than 70 genetic loci have been linked to CD phenotype transmission,2 and interestingly, most of them involve several key host defences (NOD2, IL23R, ATG16L1, FUT2). Environmental factors, especially smoking habits, are also involved. Results obtained from experimental mouse models3 have shed light on different mechanisms emphasising a failure in the host–microbiota crosstalk. Host–microbiota interactions sustain numerous physiological functions such as the maturation of host intestinal/immune cells (lymphoid tissue, Paneth cells) and the settlement of a commensal microbiota, thereof any alteration of this intimate relationship might modify the natural makeup of the ‘healthy’ microbiome. The use of immunologically impaired animal models has emphasised the importance of this relationship. For instance, TRUC mice (T-bet−/− RAG2−/− UC model) are able to shape an aberrant microbiota leading to disease4 5 and the transfer of their microbiota to a wild type host was shown as well to induce colitis.5 6
Corticosteroids, thiopurines and monoclonal antibodies against tumour necrosis factor-α are efficient to modulate inflammatory activity, but surgery is still frequently required.7 Strikingly, severe inflammatory lesions recur in the neoterminal ileum in the months following surgery in more than half of the patients operated on to remove the inflamed ileum.8 9 The crucial link between gut microbiota and CD recurrence was first suspected in this context two decades ago.10 11 In five patients with CD who had undergone resection with a diverting loop ileostomy proximal to an ileocolonic anastomosis, lesions recurred in the neoterminal ileum only once the bowel continuity was restored, which suggested that the microbiota and/or other components of the faecal stream may play a role.
The importance of the human gut microbiome in health and disease has been recognised for decades.12–15 In CD, it seems of great interest to investigate the mucosal microbiota that differs from faecal samples16 as it is in close contact to the disease process. In this study, we aimed at (i) assessing the impact of the ileocolonic resection (ICR) on the mucosa-associated microbiota, (ii) observing whether alterations differed between patients in remission or in recurrence after ICR, (iii) highlighting bacterial biomarkers of early recurrence of inflammatory lesions, and finally, (iv) deciphering bacterial community structure at the mucosal level in patients.
Microbial profiling and in-depth sequencing techniques were applied to analyse the gut microbiota. Since ecological constraints in the gut (chemical, immunological or trophic) are crucial in shaping the microbiota assembly and necessary for the development of a structured and functional ecosystem, we analysed the microbiota for its composition, diversity and structure in patients suffering from CD before and 6 months following operation to track out any change in microbiota composition and decipher the microbial recolonisation process following ICR.
Patients and methods
Patients and samples
Twenty patients with active CD were included in this study. They were part of a double-blind, randomised, placebo-controlled, 6-month clinical study,17 aiming at assessing the efficacy of the probiotic strain Lactobacillus johnsonii LA1 to decrease the endoscopic recurrence rate 6 months after surgery. CD was diagnosed on the basis of standard clinical, radiographic, endoscopic and pathological criteria. The patients had to be addressed to clinical centres for ileal or ICR. Patients who received antibiotics during the previous three months or receiving antibiotics for >2 weeks after surgery were not eligible. Other exclusion criteria included (i) total or subtotal colectomy, intestinal bypass or stricturoplasty, stomy, carcinoma resection, or abscess drainage; (ii) treatment with aminosalicylates or immunosuppressants >3 weeks following surgery; (iii) any other disease or condition that might interfere with the study assessments (as judged by the investigator); and (iv) child-bearing potential in women not using effective contraception; and pregnant or lactating women.
At time of surgery (month 0 (M0)), patients provided faecal samples before colonic cleansing. Biopsies were sampled using biopsy pinches from the fresh resected tissue at the ileal level in macroscopically ulcerated regions. Tissue specimens were also collected (4 cm2 surface). Patients were examined 6 months after ICR (month 6 (M6)), provided faecal samples and an ileocolonoscopy was performed. Biopsies were sampled from the neoterminal ileum (above the anastomosis) and the subanastomotic colon (below the anastomosis). Endoscopic status was determined (recurrence of inflammatory lesions (REC); remission (REM)). Endoscopic recurrence was defined by a Rutgeerts score >2.18 All samples were immediately dry frozen in nitrogen or dry ice and further kept at −80°C before analysis. At 1-year follow-up, endoscopic and clinical recurrence was assessed by clinicians.
DNA preparation
Total DNA was extracted from faeces and biopsy samples as previously described.19 DNA concentration and integrity were determined spectrophotometrically and bacterial 16S rRNA gene was amplified using either primers targeting the V6-V8 region (GCclamp-U968 and L1401) for fingerprinting20 or the V3-V4 region for sequencing (V3fwd: 5′-TACGGRAGGCAGCAG-3′, V4rev: 5′-GGACTACCAGGGTATCTAAT-3′).21
Fingerprinting of the dominant microbiota
Sequence-specific fingerprints were obtained with Temporal Temperature Gradient Gel Electrophoresis (TTGE) as previously described.19 TTGE profiles were analysed with Gel Compar software V.2.0 (Applied Maths, Kortrijk, Belgium). Similarity indexes (Pearson correlation method with unweighted pair group method with arithmetic mean (UPGMA) method) were calculated for each pair of profiles. Means were compared using paired Student's t test when the variances were equal, and otherwise using Wilcoxon's test.
Microbial composition assessment by high-throughput sequencing
Ten patients (ie, 46 samples: 26 mucosal samples and 20 faecal samples; see online supplementary table S1) were selected from the main cohort and their microbiota composition was further deeply analysed by 454 pyrosequencing using GS-FLX-Titanium technology following manufacturer's instructions (Roche) for mucosal samples or MiSeq (Illumina) for faecal samples. Faecal samples from one patient provided low number of sequences and were discarded. Sequences were trimmed for adaptors and PCR primers removal and binned for a minimal sequence length of 250 bases and an average minimal base quality threshold set at 25. Resulting sequences (in average 2915 for mucosal samples and 16 532 for faecal samples) were clustered at 97% of identity using QIIME22 and usearch (V.5.2.32) pipeline.23 Operational taxonomic units (OTUs) with abundance lower than four reads were discarded. Chimera detection and removal were assessed using GOLD reference database and uchime.23 OTUs were assigned to closest taxonomic neighbours using SEQMATCH and up to date 16S rRNA gene RDP database (release 10, update 30).24 Alpha diversity (Shannon index) was analysed on the OTU table rarefied to 1000 reads.
All statistical analyses were performed using R program,25 ade426 and igraph packages.27 Statistics was assessed using either a Wilcoxon's test or the analysis of variance (p<0.05). If required, p values were adjusted for multiple testing effects using the Bonferroni correction. Principal component and between-class analyses were performed to map each sample based on their overall microbial composition and to assess similarities between individual's microbiota. Robustness of each clustering result was assessed using a Monte Carlo rank test (p<0.05). The network analysis was carried out with SparCC28 (bootstrap n=500) on the most abundant OTUs (maximum abundance of a particular OTU within a sample ≥0.125%). SparCC correlation scores ≤−0.5 or ≥0.5 with a p≤0.001 were kept for networks inference. The analysis was conducted as described in the igraph package. Network visualisation was performed using the Fruchterman–Reingold layout algorithm. Clusters were detected with cluster_louvain() function.29 The robustness of each cluster was tested (Wilcoxon test) by comparing the number of OTU edges within a defined cluster to the number of OTU edges outside this cluster.
Results
Twenty patients were included in the study. Six months after surgery, 10 patients had developed recurrence of CD lesions (REC) visible during endoscopic examination while the other half remained in endoscopic remission (REM) according to the Rutgeerts score. A total of 337 OTUs was detected in mucosal samples with an average of 88±34 OTUs per sample, while 1225 OTUs constituted the faecal microbiota with an average of 327±124 OTUs per sample. Bacterial phylotypes (or OTUs) were defined as groups of sequences sharing at least 97% of similarity and OTUs’ representative sequences were phylogenetically affiliated to their closest relative bacterial species.
ICR for CD affects the mucosal microbiota, which is also depicted in faecal samples
ICR had a striking effect on gut microbial composition. Bacterial profiles of the dominant mucosal microbiota at 6 months after ICR (M6) differed markedly from the profiles observed at time of surgery (M0). The average TTGE pairwise similarity percentages were 55.1%±25.0% between ileal mucosa at M0 and the neoterminal ileum at M6, and 48.1%±28.9% between ileal mucosa at M0 and subanastomotic colon at M6. The composition of mucosal microbiota, analysed by 16S rRNA gene pyrosequencing, was strongly affected by ICR (figure 1). Samples collected at M0 were significantly enriched in bacteria belonging to α-/β-Proteobacteria and Bacilli (Streptococcus), whereas M6 samples had higher proportions of Clostridia (see online supplementary table S2 and supplementary figure S1). Lachnospiraceae family displayed the largest variation between M0 and M6 with percentages ranging from 7.39%±2.79% (M0) to 31.01%±7.82% (REC) and 27.17%±4.78% (REM). Top-down taxonomic analysis emphasised that Dorea and Blautia genera accounted mostly for this variation. Strikingly, Porphyromonadaceae levels were also increased in M6 samples, but only in patients with endoscopic recurrence. At OTU level, 27 bacterial species were differentially abundant between M0 and M6 sampling times (table 1; M0=17 OTUs and M6=10 OTUs).
Figure 1.
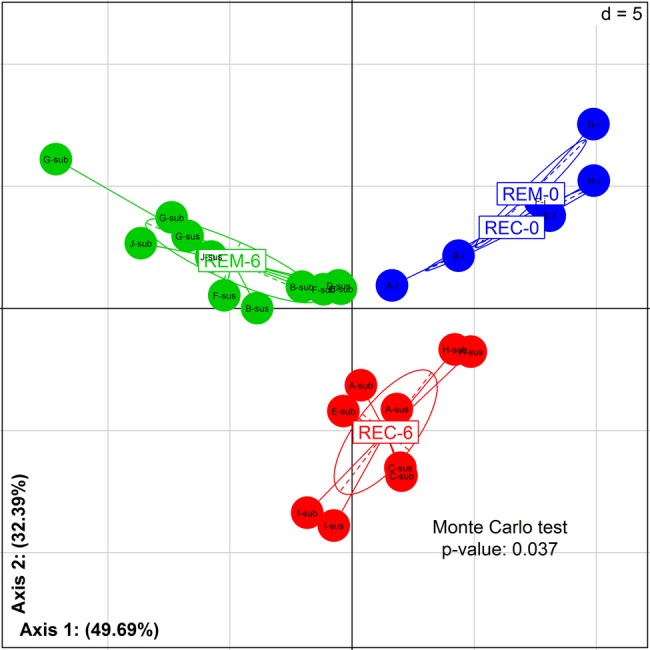
Impact of ileocolonic resection on mucosal microbiota: initial stage compared with 6 months later. Between class analysis (axis 1 and 2) visualising results from the principal component analysis based on the operational taxonomic unit composition in the microbiota of patients before and after surgery (M0 vs M6). Samples were clustered according to remission/recurrence (REM/REC) and sampling times (M0 and M6). Robustness of the clustering result was assessed using a Monte Carlo ranking test. Samples at M0 (REM-0/REC-0) are in blue. Samples at 6 months for patients in remission (REM-6) are in green. Samples at 6 months for patients in recurrence (REC-6) are in red. At M6: sus, neoterminal ileum; sub, subanastomotic colon.
Table 1.
Differentially represented OTUs between samples collected at time 0 and 6 months after ICR
| OTUs | Closest species (% of sequence similarity) | Time 0 | REC6 | REM6 | p Value |
|---|---|---|---|---|---|
| 28 | Streptococcus mitis (100%) | 11.41±5.6 | 1.63±1.0 | 0.44±0.2 | 0.009 |
| 58 | Undibacterium oligocarboniphilum (100%) | 4.58±2.5 | 0.8±0.3 | 0.30±0.1 | 0.021 |
| 68 | Sphingomonas melonis (100%) | 1.81±1.0 | 0.41±0.2 | 0.11±0.1 | 0.027 |
| 64 | Gemella haemolysans (100%) | 1.78±0.8 | 0.30±0.2 | 0.06±0.0 | 0.006 |
| 87 | Clostridium lituseburense (98%) | 1.70±0.9 | 0.00±0.0 | 0.01±0.0 | 0.006 |
| 91 | Thermus scotoductus (100%) | 1.53±0.7 | 0.73±0.4 | 0.06±0.0 | 0.028 |
| 76 | Mesorhizobium australicum (99%) | 1.41±0.7 | 0.18±0.1 | 0.07±0.0 | 0.008 |
| 124 | Granulicatella adiacens (100%) | 1.21±0.7 | 0.18±0.1 | 0.03±0.0 | 0.028 |
| 250 | Staphylococcus warneri (100%) | 0.72±0.4 | 0.12±0.0 | 0.06±0.0 | 0.041 |
| 142 | Granulicatella elegans (100%) | 0.63±0.3 | 0.04±0.0 | 0.02±0.0 | 0.006 |
| 224 | Bradyrhizobium yuanmingense (100%) | 0.56±0.2 | 0.07±0.1 | 0.03±0.0 | 0.002 |
| 227 | Sediminibacterium salmoneum (96%) | 0.46±0.2 | 0.02±0.0 | 0.05±0.0 | 0.011 |
| 226 | Sediminibacterium salmoneum (98%) | 0.38±0.2 | 0.00±0.0 | 0.02±0.0 | 0.032 |
| 243 | Pseudomonas flavescens (100%) | 0.28±0.2 | 0.01±0.0 | 0.01±0.0 | 0.027 |
| 256 | Rhodospirillum rubrum (86%) | 0.21±0.1 | 0.06±0.0 | 0±0 | 0.035 |
| 233 | Turicibacter sanguinis (100%) | 0.08±0.0 | 0±0 | 0.02±0.0 | 0.017 |
| 15 | Eubacterium coprostanoligenes (92%) | 0.03±0.0 | 0±0 | 0±0 | 0.033 |
| 10 | Clostridium nexile (100%) | 0.14±0.0 | 4.79±1.5 | 0.83±0.4 | 0.005 |
| 9 | Blautia wexlereae (100%) | 0.32±0.1 | 2.81±1.2 | 4.17±0.8 | 0.036 |
| 12 | Dorea longicatena (100%) | 0.40±0.2 | 0.47±0.2 | 3.18±0.7 | 0.002 |
| 53 | Sutterella wadsworthensis (100%) | 0.08±0.0 | 0.27±0.1 | 0.64±0.2 | 0.025 |
| 199 | Ruminococcus schinkii (97%) | 0.02±0.0 | 0.03±0.0 | 0.24±0.1 | 0.003 |
| 288 | Bacteroides dorei (99%) | 0±0 | 0.03±0.0 | 0.14±0.0 | 0.035 |
| 241 | Desulfotomaculum guttoideum (98%) | 0.04±0.0 | 0.00±0.0 | 0.13±0.0 | 0.01 |
| 1 | Bacteroides plebeius (100%) | 0.25±0.2 | 0±0 | 2.41±0.9 | 0.029 |
| 153 | Clostridium bolteae (95%) | 0±0 | 0±0 | 0.49±0.2 | 0.034 |
Shadeless and grey-shaded lines indicate respectively increased OTUs in samples either collected at time 0 or time 6. Statistics was assessed by analysis of variance. Only significant data (p<0.05) are presented.
ICR, ileocolonic resection; OTUs, operational taxonomic units; REC. recurrence; REM, remission.
At M0, the intestinal mucosa of patients with CD harboured high proportions of unusual, facultative anaerobic or aerobic gut bacteria such as Streptococccus mitis, Undibacterium oligocarboniphilum, Sphingomonas melonis and Gemella haemolysans. On the other hand, 6 months after ICR, mucosal samples exhibited higher levels of anaerobic bacteria belonging to Lachnospiraceae: Clostridium nexile, Blautia wexlereae and Dorea longicatena. Bacteroidaceae, Enterobacteriaceae and Bifidobacteriaceae were not impacted by ICR.
No difference was observed within the α-diversity between M0 and M6 samples (Shannon index, M0: 2.538±0.3179 and M6: 3.030±0.111, p>0.05).
ICR also impacted faecal bacterial populations, and the average TTGE profiles similarity percentage between M0 and M6 was 41.3%±34.1%. The inter-individual variability was high and similarity ranged from 0% to 94.9% between M0 and M6. No significant differences were noticeable depending on the endoscopic status at 6 months (remission or recurrence). Average TTGE profiles similarity percentages were 45.1%±23.4% for patients in remission and 58.1%±30.1% for patients with endoscopic recurrence.
Towards a link between bacterial dysbiosis and postoperative recurrence
The mucosa-associated microbiota was analysed in detail by 16S rRNA gene sequencing in 10 patients: 5 having persistent endoscopic remission and 5 with recurrence. No significant difference was observed between REC and REM α-diversity (Shannon index, REC: 2.907±0.513 and REM: 3.131±0.485, p>0.05). The mucosal microbiota differed markedly between these two groups of patients. Remission status was characterised by an increased number of bacteria belonging to four genera (Bacteroides, Dorea, Ruminococcus and Dialister; see online supplementary table S3) and mainly the species D. longicatena and Bacteroides plebeius (table 2). On the other hand, Gemmiger formicilis, Enterococcus durans and Ruminococcus lactaris were significantly increased in REC patients as were bacteria belonging to Bacilli class.
Table 2.
Differentially represented OTUs between recurrence and remission samples collected at 6 months after ICR
| OTUs | Closest species (% of sequence similarity) | REC6 | REM6 | p Value |
|---|---|---|---|---|
| 20 | Gemmiger formicilis (100%) | 1.58±0.7 | 0.77±0.5 | 0.038 |
| 335 | Enterococcus durans (100%) | 0.53±0.4 | 0.00±0.0 | 0.011 |
| 78 | Ruminococcus lactaris (96%) | 0.32±0.1 | 0.02±0.0 | 0.015 |
| 12 | Dorea longicatena (100%) | 0.47±0.2 | 3.18±0.7 | 0.011 |
| 1 | Bacteroides plebeius (100%) | 0±0 | 3.13±1.2 | 0.013 |
| 153 | Clostridium bolteae (95%) | 0±0 | 0.49±0.2 | 0.006 |
| 101 | Bacteroides dorei (99%) | 0.09±0.0 | 0.47±0.1 | 0.019 |
| 208 | Butyricimonas virosa (98%) | 0.00±0.0 | 0.36±0.2 | 0.05 |
| 199 | Ruminococcus schinkii (97%) | 0.03±0.0 | 0.24±0.1 | 0.005 |
| 97 | Bilophila wadsworthia (100%) | 0.01±0.0 | 0.15±0.1 | 0.05 |
| 237 | Bacteroides coprocola (100%) | 0±0 | 0.14±0.1 | 0.013 |
| 241 | Desulfotomaculum guttoideum (98%) | 0.00±0.0 | 0.13±0.0 | 0.013 |
| 312 | Bacteroides nordii (100%) | 0±0 | 0.12±0.1 | 0.028 |
| 62 | Clostridium thermocellum (88%) | 0.01±0.0 | 0.10±0.0 | 0.021 |
Shadeless and grey-shaded lines indicate respectively increased OTUs in patients with disease recurrence or remission. Statistics was assessed by Wilcoxon test. Only significant data (p<0.05) are presented.
ICR, ileocolonic resection; OTUs, operational taxonomic units; REC. recurrence; REM, remission.
All but 4 of these 14 specific species (Clostridium bolteae, Bacteroides dorei, Ruminococcus schinkii and Clostridium thermocellum) were also detected in faecal samples from the patients although at lower percentages. A similar trend in being over-represented or under-represented in remission or recurrence was observed in faeces but statistical significance was not reached. We searched for bacterial biomarkers of the clinical outcome in faecal samples of patients at M0 before surgery and detected significant differences in the bacterial composition of faecal samples at M0 between patients that appeared to stay in remission after ICR compared with those who finally experienced endoscopic recurrence. At the OTUs level, four specific molecular species had a biomarker potential, two for remission prediction and two for recurrence prediction (figure 2A). While detection of Coprococcus catus L8 and a relative of Clostridiales bacterium DJF_B152 (Butyricicoccus genus) in faeces of patients at M0 were significantly associated with remission at M6, the presence of Proteus mirabilis and of a relative of Eubacterium rangiferina were highlighted as biomarkers of future recurrence in patients undergoing ICR (OTUs denovo1092, 326, 423 and 861, respectively). Moreover, OTU denovo1092 and denovo326 were significantly more represented at M0 in patients being in remission at M6 than in REC patients (p=0.034 and 0.044, respectively; figure 2B).
Figure 2.

Early bacterial biomarkers of the clinical outcome after ileocolonic resection (ICR). Faecal microbiota from 10 patients was analysed at M0 and 6 months after ICR. (A) Specific bacterial operational taxonomic units (OTUs) that may predict at M0 the clinical outcome following ICR were deciphered applying the LEfSe algorithm.47 The LEfSe algorithm uses the non-parametric factorial Kruskal–Wallis sum-rank test to detect features with significant differential abundance with respect to the clinical outcome; biological significance is subsequently investigated using a set of pairwise tests using the (unpaired) Wilcoxon rank-sum test. As a last step, LEfSe uses linear discriminant analysis to estimate the effect size of each differentially abundant feature (ie, bacterial OTUs). (B) Boxplot of the distribution (per cent of total reads) of the four OTUs highlighted in the LEfSe analyses in the different patients’ groups. M0 bacterial biomarkers associated with remission at M6 are in green. M0 bacterial biomarkers of future recurrence in patients undergoing ICR are in red. M0, samples at time of surgery; REC, recurrence; REM, remission; LDA, linear discriminant analysis.
Postoperative recurrence: from microbial dysbiosis to microbiota destructuration
Unravelling interactions among different species within ecosystems is essential to understand how microbiota responds/adapts to environmental changes. Here we describe the use of SparCC correlation-based approach to infer species association (network) for the mucosal microbiota at each clinical status time points (M0, REC, REM). Species co-occurrence and exclusion are assessed at the overall ecosystem level, and groups of highly correlated OTUs are further defined as clusters. Clusters may relate to metabolic entities involved in trophic chains or immune reactions, specific bacterial features such as aggregation, signalling, biofilm formation or specific habitat characteristics (pH, mucins). Out of 387 total OTUs, only 15 made up the mucosal microbiota community structure of the patients with CD before operation (M0, see online supplementary figure S2 and supplementary table S6). Eighty-seven per cent of these OTUs (n=13) were common to the mucosal microbiota structure inferred for the patients 6 months after ICR (see online supplementary figure S3). Within the M0 structure, no distinct and significant bacterial cluster was identified.
The mucosal microbiota structure of patients in remission after 6 months (REM) was more complex and better organised than the structure inferred for patients suffering from disease recurrence (REC) (figure 3). The REM microbiota structure was composed of 192 OTUs, whereas 102 OTUs were found in the REC structure (see online supplementary tables S4 and S5, respectively) with 82 OTUs common to both structures. The number of inter-OTUs correlations was five times higher for REM microbiota (2142) compared with REC one (436). Both REM and REC network structures were made up of five significant clusters. Each microbial cluster was well distributed in the cohort of patients, either patients in remission (see online supplementary figure S4A) or with recurrence (see online supplementary figure S4B).
Figure 3.

Correlation network organisation inferred from the microbiota composition of patients with Crohn's disease in remission and in recurrence 6 months after ileocolonic resection (ICR). (A) and (B) respectively depict the correlation network structures inferred from the microbiota composition of patients in remission or with recurrence 6 months after ICR. Each number relates to operational taxonomic unit (OTU) indexes. OTU phylogeny at phylum level is described by colours filling each OTU dot. Correlation scores are indicated by the colour of the edges linking OTU pairs. Polygons delineate each cluster (C1–C5) identified in the network. (A and B) The red, yellow, green, blue and purple polygons delineate clusters I, II, III, IV and V.
Among the five REM microbial clusters, clusters I, III and IV were made up of bacteria mainly related to Firmicutes phylum (70%, 67% and 63%, respectively). Main species in cluster I related to Faecalibacterium prausnitzii, Ruminococcus bromii and B. plebeius, whereas G. formicilis was the main driver of cluster III. Interestingly, cluster I represented a tight community, mainly constituted with OTUs from the Ruminococcaceae and Lachnospiraceae families, with each OTU sharing in average 16.45 correlations with other OTUs of the cluster. The cluster II was taxonomically more diverse and composed of Firmicutes (49%), Bacteroidetes (34%) and Proteobacteria (11%) phyla. The most abundant OTUs related to Dorea formicigenerans, Sutterella wadsworthensis and Bacteroides uniformis. Finally, cluster V grouped OTUs affiliated to Firmicutes (42%), Proteobacteria (31%), Bacteroidetes (15%) and Actinobacteria (8%). Firmicutes population showed balanced proportions of Clostridia and Bacilli classes with OTUs related to Clostridium, Blautia, Streptococcus, Gemella and Granulicatella genera (as opposed to Clostridia class alone in cluster I).
On the other hand, the REC microbiota structure included five different clusters that were looser than in the REM microbiota structure (average 4.27 correlations/OTUs in REC vs 11.16 correlations/OTUs in REM). The cluster II was composed at 50% with Proteobacteria (α-/β-Proteobacteria) and OTUs were affiliated to Comamonas and Pelomonas genera. The cluster III grouped Clostridium hylemonae, Ruminococcus gnavus and E. durans, a group of species specifically involved in bile acids (BAs) hydroxylation and bile salts hydrolysis. F. prausnitzii was only detected once in cluster III, and out of five correlations shared by F. prausnitzii within this cluster, four were negative. Similarly to the microbiota of patients in remission, two clusters enriched in Firmicutes were detected, one mainly containing Clostridia (cluster IV) and the other Bacilli (cluster I). Finally, the cluster V, driven mainly by Bacteroides caccae and Eubacterium halii, grouped bacteria that were well distributed in terms of phyla repartition.
Colonisation of the neoterminal ileum and subanastomotic colon after ICR
Comparison between the microbiota colonising the neoterminal ileum and the subanastomotic mucosa highlighted an average TTGE profile similarity percentage of 82.6%±21.8%. Interestingly, dominant mucosal microbiota in the neoterminal ileum and subanastomotic colon were significantly closer within the patients in remission at M6 than in patients with recurrence (REM: 92.2±2.7; REC: 77.9%±24.7; p=0.02). A similar trend was observed with the pyrosequencing analysis (figure 4). Species from Dorea and Brevundimonas accounted for those explaining this difference. D. longicatena (REC-sub: 0.265±0.247 and REC-sus: 0.636±0.314) and Brevundimonas vesicularis (REC-sub: 0.022±0.022 and REC-sus: 0.203±0.096) were respectively 2.4-fold and 9.2-fold increased in the neoterminal ileum mucosa compared with the subanastomotic one in patients with recurrence.
Figure 4.
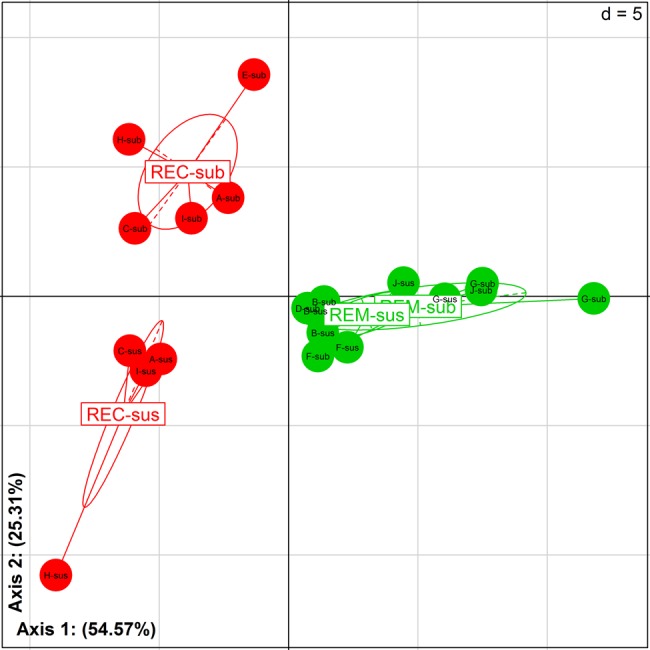
Microbiota recolonisation after ileocolonic resection. Between class analysis (axis 1 and 2) visualising results from the principal component analysis based on the operational taxonomic unit composition in the microbiota of patients 6 months after surgery. Samples were clustered according to remission/recurrence (REM/REC) and location around the anastomosis (sus/sub). Samples of patients in remission are in green (REM-sus and REM-sub). Samples of patients with endoscopic recurrence are in red (REC-sus and REC-sub). sus, neoterminal ileum; sub, subanastomotic colon.
Discussion
At time of surgery, the mucosal microbiota of patients with active CD was rich in α-/β-Proteobacteria, Bacilli and more largely in bacteria that are not usually found in a healthy gut microbiota. This is in line with previous studies.30 31 While not affecting the gut microbial diversity, ICR markedly modified the gut mucosal microbiota. Following ICR, a fourfold increase of Lachnospiraceae taxa was observed showing deep modifications within the gut ecosystem. Lachnospiraceae abundance has previously been noticed to fluctuate at both faecal and mucosal levels in patients with CD with active disease.32 ICR also led to an increase in Porphyromonadaceae levels in patients with endoscopic recurrence at 6 months, and this was also observed in the jejunal mucosa of a mouse model of resection.33
It is noteworthy that microbial assemblage and recolonisation process after ICR were associated to disease relapse or maintenance of remission. Indeed, mucosal microbiota comparison of patients being either on disease remission or recurrence 6 months after ICR has shed light on different gut ecosystem composition and structures. Our results suggest that recovering an eubiotic microbiota, mainly composed of Firmicutes and Bacteroidetes, is a crucial step towards remission in patients with CD after resection. Moreover, homogeneity in bacterial composition at the anastomosis location might be associated with homeostasis and remission in these patients. Compositional differences mainly related to an increase in Bacilli abundance during disease recurrence, whereas bacteria belonging to Bacteroides, Dorea, Ruminococcus and Dialister genera were more prevalent in patients in remission. We also assessed whether specific bacterial biomarkers in faecal samples may predict, at the time of surgery, the clinical outcome of patients after ICR. Two OTUs, both being relatives of butyrate-producing bacteria (ie, C. catus and Butyricicoccus sp.), were more abundant in M0 faecal samples of patients being in remission at 6 months and undetectable at M0 in the microbiota of patients with endoscopic recurrence at M6. On the other hand, two OTUs were specific predictors of recurrence following ICR: E. rangiferina and P. mirabilis. It is noteworthy that P. mirabilis has been shown to be able to promote colitis in susceptible animals,4 but also to induce robust interleukin-1b secretion via the NLRP3 inflammasome, hence promoting inflammation.34
In order to study the structure and thus the interactions among the bacterial components of mucosal microbiota, we built a correlation network based on the relative abundance of OTUs among the different samples. The gut microbiota structure differed significantly whether patients’ disease evolved towards maintenance of remission or recurrence of lesions. A major result is the identification of a complex mucosal ecosystem made of gut commensals and associated with disease remission. At the opposite, the microbiota structure of patients displaying CD recurrence appeared less organised. In a recent study, Levy and Borenstein35 applied systems biology and metabolic modelling to highlight forces driving species composition in the gut microbiome. This metabolic-based prediction of species interaction showed that habitat is the dominant structuring force of the human microbiome. Here we show that CD activity is associated with a loose and non-cohesive mucosal microbiota structure that might impair proper ecosystem functions. On the other hand, a tightly correlated and cohesive species structure was observed in patients in remission 6 months after ICR.
Whatever the clinical status of patients 6 months after ICR, we observed at least one cluster containing mostly bacteria belonging both to the phylogenetic36 and the metagenomic core37 (REM: cluster II and III; REC: cluster V). These clusters may constitute a functional core required for the performance of the gut ecosystem. The microbial community structure of patients in remission also presented a cluster mainly driven by F. prausnitzii and R. bromii. Both species are thought to play a beneficial role in human health, partly through the production of short-chain fatty acids (SCFAs; butyrate mostly) and were more abundant in healthy subjects than in patients with CD .38 Moreover, F. prausnitzii has been associated with clinical benefit in CD and its anti-inflammatory properties have been demonstrated in animal models.39 40 R. bromii is a strong degrader of resistant starches and proved to be unique in stimulating starch utilisation by other bacterial species,41 which may enhance the production of SCFAs in this cluster. On the other hand, the microbial structure of patients with recurrence 6 months after ICR exhibited a cluster enriched in Proteobacteria (α-/β-Proteobacteria) and composed of unusual bacteria that were also detected in the mucosa of patients with IBD in several previous studies.30 31 Interestingly, another community (cluster III) specific of REC patients was composed of bacteria sharing specific enzymatic machinery associated with the metabolism of BAs. Hence, E. durans, a component of this cluster, exhibits bile salt hydrolase activity42 and may deconjugate BAs. Moreover, C. hylemonae and R. gnavus, main contributors of this cluster, both possess a high BA 7α-dehydroxylating activity, leading to the production of secondary BAs. Of note, high concentrations of secondary BAs in faeces have been linked to the pathogenesis of colon cancer and more recently to CD,43 and several studies also reported increased R. gnavus proportions in the mucosa and in faeces of patients with CD.44–46
Ecological forces and key bacterial species that support these mucosal microbial communities still remain to be determined. Yet the presented global approach may allow a better understanding of microbial modulation by environmental factors (diet, prebiotics, antibiotics, pH, oxygen) but mostly pave the way towards general microbiota ecosystem modulation on the gut by regulating specific bacteria in the structure.
Conclusion
We highlighted specific bacteria, with either increased or decreased proportions, associated with early recurrence of CD inflammatory lesions. Moreover, we applied robust statistical analysis to assess the structure (bacterial phylotypes clusters and correlation networks) of the mucosa-associated microbial ecosystem in these patients and highlighted an overall ecosystem disruption in patients with CD recurrence after ICR.
Looking at the level of ecosystem structure may be a critical step in the development of therapeutic interventions targeting the microbiota in CD, including antibiotics and/or faecal transplantation.
Supplementary Material
Acknowledgments
The authors thank the GETAID, Eduardo Schiffrin and Stephanie Blum for critical construction of the clinical study design; Anne Berger, Pierre Cattan, Simon Msika and Yves Panis for providing rapid access to the surgical specimen, Karine Le Roux and Céline Monot for technical support and Nestlé Research for sponsorship.
Footnotes
Contributors: SM and PL contributed equally. PL, PS, PP, JD and PM designed the Research. All authors contributed to data acquisition, analysis and results interpretation. SM, PL and PM wrote the manuscript. All authors revised and approved the manuscript.
Competing interests: None declared.
Patient consent: Obtained.
Ethics approval: HEGP-Broussais Ethics Committee.
Provenance and peer review: Not commissioned; externally peer reviewed.
Data sharing statement: All data are fully available without restriction. All relevant data are within the paper and its supporting information files. DNA sequence reads from this study are available from the Sequence Read Archive (accession numbers available after acceptance) or by contacting the corresponding author.
References
- 1.Cosnes J, Gower-Rousseau C, Seksik P, et al. . Epidemiology and natural history of inflammatory bowel diseases. Gastroenterology 2011;140:1785–94. 10.1053/j.gastro.2011.01.055 [DOI] [PubMed] [Google Scholar]
- 2.Lees CW, Barrett JC, Parkes M, et al. . New IBD genetics: common pathways with other diseases. Gut 2011;60:1739–53. 10.1136/gut.2009.199679 [DOI] [PubMed] [Google Scholar]
- 3.Nell S, Suerbaum S, Josenhans C. The impact of the microbiota on the pathogenesis of IBD: lessons from mouse infection models. Nat Rev Microbiol 2010;8:564–77. 10.1038/nrmicro2403 [DOI] [PubMed] [Google Scholar]
- 4.Garrett WS, Gallini CA, Yatsunenko T, et al. . Enterobacteriaceae act in concert with the gut microbiota to induce spontaneous and maternally transmitted colitis. Cell Host Microbe 2010;8:292–300. 10.1016/j.chom.2010.08.004 [DOI] [PMC free article] [PubMed] [Google Scholar]
- 5.Garrett WS, Lord GM, Punit S, et al. . Communicable ulcerative colitis induced by T-bet deficiency in the innate immune system. Cell 2007;131:33–45. 10.1016/j.cell.2007.08.017 [DOI] [PMC free article] [PubMed] [Google Scholar]
- 6.Rooks MG, Veiga P, Wardwell-Scott LH, et al. . Gut microbiome composition and function in experimental colitis during active disease and treatment-induced remission. ISME J 2014;8:1403–17. 10.1038/ismej.2014.3 [DOI] [PMC free article] [PubMed] [Google Scholar]
- 7.Vester-Andersen M, Lundstrøm LH, Møller MH, et al. . Mortality and postoperative care pathways after emergency gastrointestinal surgery in 2904 patients: a population-based cohort study. Br J Anaesth 2014;112:860–70. 10.1093/bja/aet487 [DOI] [PubMed] [Google Scholar]
- 8.Kozuch PL, Hanauer SB. Treatment of inflammatory bowel disease: a review of medical therapy. World J Gastroenterol 2008;14:354–77. 10.3748/wjg.14.354 [DOI] [PMC free article] [PubMed] [Google Scholar]
- 9.Orlando A, Mocciaro F, Renna S, et al. . Early post-operative endoscopic recurrence in Crohn's disease patients: Data from an Italian Group for the study of inflammatory bowel disease (IG-IBD) study on a large prospective multicenter cohort. J Crohns Colitis 2014;8:1217–21. 10.1016/j.crohns.2014.02.010 [DOI] [PubMed] [Google Scholar]
- 10.D'Haens GR, Geboes K, Peeters M, et al. . Early lesions of recurrent Crohn's disease caused by infusion of intestinal contents in excluded ileum. Gastroenterology 1998;114:262–7. 10.1016/S0016-5085(98)70476-7 [DOI] [PubMed] [Google Scholar]
- 11.Rutgeerts P, Goboes K, Peeters M, et al. . Effect of faecal stream diversion on recurrence of Crohn's disease in the neoterminal ileum. Lancet 1991;338:771–4. 10.1016/0140-6736(91)90663-A [DOI] [PubMed] [Google Scholar]
- 12.Neish AS. Microbes in gastrointestinal health and disease. Gastroenterology 2009;136:65–80. 10.1053/j.gastro.2008.10.080 [DOI] [PMC free article] [PubMed] [Google Scholar]
- 13.Round JL, Mazmanian SK. The gut microbiota shapes intestinal immune responses during health and disease. Nat Rev Immunol 2009;9:313–23. 10.1038/nri2515 [DOI] [PMC free article] [PubMed] [Google Scholar]
- 14.Sartor RB. Microbial influences in inflammatory bowel diseases. Gastroenterology 2008;134:577–94. 10.1053/j.gastro.2007.11.059 [DOI] [PubMed] [Google Scholar]
- 15.O'Hara AM, Shanahan F. The gut flora as a forgotten organ. EMBO Rep 2006;7:688–93. 10.1038/sj.embor.7400731 [DOI] [PMC free article] [PubMed] [Google Scholar]
- 16.Zoetendal EG, von Wright A, Vilpponen-Salmela T, et al. . Mucosa-associated bacteria in the human gastrointestinal tract are uniformly distributed along the colon and differ from the community recovered from feces. Appl Environ Microbiol 2002;68:3401–7. 10.1128/AEM.68.7.3401-3407.2002 [DOI] [PMC free article] [PubMed] [Google Scholar]
- 17.Marteau P, Lémann M, Seksik P, et al. . Ineffectiveness of Lactobacillus johnsonii LA1 for prophylaxis of postoperative recurrence in Crohn's disease: a randomised, double blind, placebo controlled GETAID trial. Gut 2006;55:842–7. 10.1136/gut.2005.076604 [DOI] [PMC free article] [PubMed] [Google Scholar]
- 18.Rutgeerts P, Geboes K, Vantrappen G, et al. . Predictability of the postoperative course of Crohn's disease. Gastroenterology 1990;99:956–63. [DOI] [PubMed] [Google Scholar]
- 19.Lepage P, Seksik P, Sutren M, et al. . Biodiversity of the mucosa-associated microbiota is stable along the distal digestive tract in healthy individuals and patients with IBD. Inflamm Bowel Dis 2005;11:473–80. 10.1097/01.MIB.0000159662.62651.06 [DOI] [PubMed] [Google Scholar]
- 20.Zoetendal EG, Akkermans AD, de Vos WM. Temperature gradient gel electrophoresis analysis of 16S rRNA from human fecal samples reveals stable and host-specific communities of active bacteria. Appl Environ Microbiol 1998;64:3854–9. [DOI] [PMC free article] [PubMed] [Google Scholar]
- 21.Mondot S, Barreau F, Al Nabhani Z, et al. . Altered gut microbiota composition in immune-impaired Nod2(−/−) mice. Gut 2012;61:634–5. 10.1136/gutjnl-2011-300478 [DOI] [PubMed] [Google Scholar]
- 22.Caporaso JG, Kuczynski J, Stombaugh J, et al. . QIIME allows analysis of high-throughput community sequencing data. Nat Methods 2010;7:335–6. 10.1038/nmeth.f.303 [DOI] [PMC free article] [PubMed] [Google Scholar]
- 23.Edgar RC, Haas BJ, Clemente JC, et al. . UCHIME improves sensitivity and speed of chimera detection. Bioinformatics 2011;27:2194–200. 10.1093/bioinformatics/btr381 [DOI] [PMC free article] [PubMed] [Google Scholar]
- 24.Cole JR, Wang Q, Cardenas E, et al. . The Ribosomal Database Project: improved alignments and new tools for rRNA analysis. Nucleic Acids Res 2009;37:D141–5. 10.1093/nar/gkn879 [DOI] [PMC free article] [PubMed] [Google Scholar]
- 25.R Development Core Team. R: A Language and Environment for Statistical Computing, R Foundation for Statistical Computing 2012. [Google Scholar]
- 26.Chessel D, Dufour AB, Thioulouse J. The ade4 package – I: One-table methods. R News 2004;4:5–10. http://cran.r-project.org/doc/Rnews/Rnews_2004-1.pdf [Google Scholar]
- 27.Csardi G, Nepusz T. The igraph software package for complex network research. InterJournal 2006;Complex Sy:1695 http://igraph.sf.net [Google Scholar]
- 28.Friedman J, Alm EJ. Inferring correlation networks from genomic survey data. PLoS Comput Biol 2012;8:e1002687 10.1371/journal.pcbi.1002687 [DOI] [PMC free article] [PubMed] [Google Scholar]
- 29.Blondel VD, Guillaume J-L, Lambiotte R, et al. . Fast unfolding of communities in large networks. J Stat Mech Theory Exp 2008;10008:6. [Google Scholar]
- 30.Frank DN, St Amand AL, Feldman RA, et al. . Molecular-phylogenetic characterization of microbial community imbalances in human inflammatory bowel diseases. Proc Natl Acad Sci USA 2007;104:13780–5. 10.1073/pnas.0706625104 [DOI] [PMC free article] [PubMed] [Google Scholar]
- 31.Mondot S, Kang S, Furet JP, et al. . Highlighting new phylogenetic specificities of Crohn's disease microbiota. Inflamm Bowel Dis 2011;17:185–92. 10.1002/ibd.21436 [DOI] [PubMed] [Google Scholar]
- 32.Sokol H, Seksik P, Furet JP, et al. . Low counts of Faecalibacterium prausnitzii in colitis microbiota. Inflamm Bowel Dis 2009;15:1183–9. 10.1002/ibd.20903 [DOI] [PubMed] [Google Scholar]
- 33.Devine AA, Gonzalez A, Speck KE, et al. . Impact of ileocecal resection and concomitant antibiotics on the microbiome of the murine jejunum and colon. PLoS One 2013;8:e73140 10.1371/journal.pone.0073140 [DOI] [PMC free article] [PubMed] [Google Scholar]
- 34.Seo S-U, Kamada N, Muñoz-Planillo R, et al. . Distinct commensals induce interleukin-1β via NLRP3 inflammasome in inflammatory monocytes to promote intestinal inflammation in response to injury. Immunity 2015;42:744–55. 10.1016/j.immuni.2015.03.004 [DOI] [PMC free article] [PubMed] [Google Scholar]
- 35.Levy R, Borenstein E. Metabolic modeling of species interaction in the human microbiome elucidates community-level assembly rules. Proc Natl Acad Sci USA 2013;110:12804–9. 10.1073/pnas.1300926110 [DOI] [PMC free article] [PubMed] [Google Scholar]
- 36.Tap J, Mondot S, Levenez F, et al. . Towards the human intestinal microbiota phylogenetic core. Environ Microbiol 2009;11:2574–84. 10.1111/j.1462-2920.2009.01982.x [DOI] [PubMed] [Google Scholar]
- 37.Qin J, Li R, Raes J, et al. . A human gut microbial gene catalogue established by metagenomic sequencing. Nature 2010;464:59–65. 10.1038/nature08821 [DOI] [PMC free article] [PubMed] [Google Scholar]
- 38.Kang S, Denman SE, Morrison M, et al. . Dysbiosis of fecal microbiota in Crohn's disease patients as revealed by a custom phylogenetic microarray. Inflamm Bowel Dis 2010;16:2034–42. 10.1002/ibd.21319 [DOI] [PubMed] [Google Scholar]
- 39.Quévrain E, Maubert MA, Michon C, et al. . Identification of an anti-inflammatory protein from Faecalibacterium prausnitzii, a commensal bacterium deficient in Crohn's disease. Gut 2016;65:415–25.. 10.1136/gutjnl-2014-307649 [DOI] [PMC free article] [PubMed] [Google Scholar]
- 40.Sokol H, Pigneur B, Watterlot L, et al. . Faecalibacterium prausnitzii is an anti-inflammatory commensal bacterium identified by gut microbiota analysis of Crohn disease patients. Proc Natl Acad Sci USA 2008;105:16731–6. 10.1073/pnas.0804812105 [DOI] [PMC free article] [PubMed] [Google Scholar]
- 41.Ze X, Duncan SH, Louis P, et al. . Ruminococcus bromii is a keystone species for the degradation of resistant starch in the human colon. ISME J 2012;6:1535–43. 10.1038/ismej.2012.4 [DOI] [PMC free article] [PubMed] [Google Scholar]
- 42.Franz CM, Specht I, Haberer P, et al. . Bile salt hydrolase activity of Enterococci isolated from food: screening and quantitative determination. J Food Prot 2001;64:725–9. [DOI] [PubMed] [Google Scholar]
- 43.Duboc H, Rajca S, Rainteau D, et al. . Connecting dysbiosis, bile-acid dysmetabolism and gut inflammation in inflammatory bowel diseases. Gut 2013;62:531–9. 10.1136/gutjnl-2012-302578 [DOI] [PubMed] [Google Scholar]
- 44.Png CW, Lindén SK, Gilshenan KS, et al. . Mucolytic bacteria with increased prevalence in IBD mucosa augment in vitro utilization of mucin by other bacteria. Am J Gastroenterol 2010;105:2420–8. 10.1038/ajg.2010.281 [DOI] [PubMed] [Google Scholar]
- 45.Willing BP, Dicksved J, Halfvarson J, et al. . A pyrosequencing study in twins shows that gastrointestinal microbial profiles vary with inflammatory bowel disease phenotypes. Gastroenterology 2010;139:1844–54.e1. 10.1053/j.gastro.2010.08.049 [DOI] [PubMed] [Google Scholar]
- 46.Joossens M, Huys G, Cnockaert M, et al. . Dysbiosis of the faecal microbiota in patients with Crohn's disease and their unaffected relatives. Gut 2011;60: 631–7. 10.1136/gut.2010.223263 [DOI] [PubMed] [Google Scholar]
- 47.Segata N, Izard J, Waldron L, et al. . Metagenomic biomarker discovery and explanation. Genome Biol 2011;12:R60 10.1186/gb-2011-12-6-r60 [DOI] [PMC free article] [PubMed] [Google Scholar]
Associated Data
This section collects any data citations, data availability statements, or supplementary materials included in this article.