

Abstract
Members of Msi family of RNA binding proteins have recently emerged as potent oncoproteins in a range of malignancies. MSI2 is highly expressed in hematopoietic cancers where it is required for disease maintenance. In contrast to the hematopoietic system, colorectal cancers can express both Msi family members, MSI1 and MSI2. Here we demonstrate that in the intestinal epithelium, Msi1 and Msi2 have analogous oncogenic effects. Further, comparison of Msi1/2-induced gene expression programs and transcriptome-wide analyses of Msi1/2-RNA binding targets reveal significant functional overlap, including induction of the PDK-Akt-mTORC1 axis. Ultimately, we demonstrate that concomitant loss of function of both MSI family members is sufficient to abrogate the growth of human colorectal cancer cells, and Msi gene deletion inhibits tumorigenesis in several mouse models of intestinal cancer. Our findings demonstrate that MSI1 and MSI2 act as functionally redundant oncoproteins required for the ontogeny of intestinal cancers.
Graphical Abstract

Introduction
Mammalian orthologous of the Drosophila melanogaster Musashi RNA binding protein include Msi1/MSI1 and Msi2/MSI2. Drosophila Musashi governs asymmetric cell fate determination in neuroblasts through translational suppression of mRNAs encoding a lineage determinant (Nakamura et al., 1994; Okabe et al., 2001). A similar role for Msi2 in regulating asymmetric fate determination has been proposed based on analysis of asymmetric partitioning of the Msi RNA-binding target Numb in hematopoietic stem cells (HSCs) with Msi2 gain- or loss-of-function (Kharas et al., 2010; Park et al., 2014). Besides a potential role in governing asymmetric cell division, Msi proteins act as potent oncoproteins in a number of cancers. In particular, Msi2/MSI2 is a cooperative oncoprotein in hematopoietic malignancies, where it sustains a cancer stem cell self-renewal program through interaction with a number of mRNA binding targets(Ito et al., 2010; Kharas et al., 2010; Park et al., 2014; Park et al., 2015). While significant progress has been made in understanding the contribution of Msi2 to hematopoietic malignancies, very little is known about the functional contribution of Msi proteins to oncogenic transformation in other human malignancies and murine tumor models.
In the hematopoietic system, Msi2 is the only Msi family member expressed and its expression is largely restricted to the HSC compartment. In contrast, Msi1 and Msi2 are coexpressed in the putative stem cell compartments of a variety of other tissues including the hair follicle(Sugiyama-Nakagiri et al., 2006), mammary gland (Clarke et al., 2003; Katz et al., 2014; Wang et al., 2008), germ cells (Sutherland et al., 2014), intestinal epithelium (Kayahara et al., 2003; Li et al., 2014; Potten et al., 2003; Wang et al., 2015) and neural epithelium (Sakakibara et al., 2002). The observation that both Msi1 and Msi2 are coexpressed in these tissues, coupled with an absence of phenotype upon genetic ablation of either Msi1 or Msi2 (with the exception of compromised brain ventricle formation in Msi1−/− mice), and sequence homology between Msi1 and Msi2 strongly suggests that functional redundancy exists between Msi family members. This notion is supported by findings where knockdown of Msi2 in ex vivo cultures of Msi1-null neurospheres inhibits self-renewal (Sakakibara et al., 2002).
Here we compare the similarities between the oncogenic properties of Msi1 and Msi2 in the intestinal epithelium. Published studies have observed Msi1 expression in both stem cells of the intestinal crypts and human colorectal cancers (CRC), and several studies suggest that Msi1 has mitogenic activity driven by potentiation of the canonical Wnt and/or Notch signaling pathways (Cambuli et al., 2015; Rezza et al., 2010; Spears and Neufeld, 2011; Sureban et al., 2008). Like Msi1, Msi2 is also expressed in the stem cell compartment of intestinal crypts, is broadly overexpressed in CRC, and MSI2 inhibition in SW48 and HT29 CRC cell lines has antiproliferative effects both in vitro and in murine xenografts (Wang et al., 2015). These findings suggest that Msi1 and Msi2 may have overlapping roles in promoting transformation of the intestinal epithelium, however in vivo gain-of-function studies demonstrated that Msi2, unlike Msi1, does not potentiate canonical Wnt signaling, and has little to no effect on activity of the Notch pathway as was reported for MSI1 in CRC cell lines (Wang et al., 2015). Thus, there is uncertainty as to whether Msi1 has oncogenic functions in the intestinal epithelium in vivo, and whether Msi1 and Msi2 might function redundantly in promoting intestinal transformation
Here we demonstrate that acute, in vivo Msi1 gain of function phenocopies that of Msi2, including expansion of intestinal crypt base columnar stem cells, blocked differentiation, upregulation of an APC-loss gene expression signature, and activation of the mTORC1 complex, all in a Wnt-independent manner. Comparison of transcriptome profiles derived from either Msi1 or Msi2 gain of function indicates that these family members are capable of activating similar gene expression programs, and comparison of transcriptome-wide, in vivo, Msi1- and Msi2-RNA binding analyses reveals a similar repertoire of binding targets that function in analogous pathways. Ultimately, Msi1/2 loss-of-function experiments demonstrate that the activity of these RNA binding proteins in required for the initiation and maintenance of intestinal cancers.
Results
Msi1 is expressed in intestinal cancers and its forced expression transforms the intestinal epithelium
Several studies suggest that MSI1 and MSI2 are broadly expressed in colorectal cancers (Levin et al., 2010; Li et al., 2011; Wang et al., 2015), although correlation of MSI expression with stage or grade is less clear. We sought to confirm MSI1 expression in gastrointestinal cancers and observed both over- and underexpression relative to controls in a number of these malignancies (Figure 1A, B and S1A, B). Interestingly, matched pairs of colorectal adenocarcinomas and normal adjacent tissue revealed MSI1 expression to be more variable than that of MSI2, with MSI1 overexpression observed in around half of these malignancies in comparison to the ubiquitous overexpression of MSI2 [Figure 1A and (Wang et al., 2015)]. We confirmed prior reports of Msi1 expression in murine crypt base columnar intestinal stem cells (CBCs) and it’s upregulation in early adenomas resulting from loss of heterozygosity of the APC tumor suppressor in the APCmin/+ mouse model (Potten et al., 2003) (Figure 1C, D). Given that MSI2 is broadly expressed in CRC, and is also upregulated upon APC loss, we generated a targeted, single-copy, Doxycycline-inducible Msi1 gain-of-function mouse model (TRE-Msi1) using genetic loci identical to those used to assess the consequences of Msi2 gain-of-function (Wang et al., 2015). This enables direct comparison between the consequences of Msi1 and Msi2 activiation (Figure 1E and S1C, D). Doxycycline (Dox) administration resulted in broad induction of Msi1 throughout the intestinal epithelium, but not in the underlying stromal mesenchyme or lacteals (Figure S1E). Control mice (R26-M2rtTA + Dox) exhibited no differences in Msi1 expression patterns relative to wildtype (Figure S1E).
Figure 1. MSI1 is expressed in colorectal cancers and is sufficient to transform the epithelium.
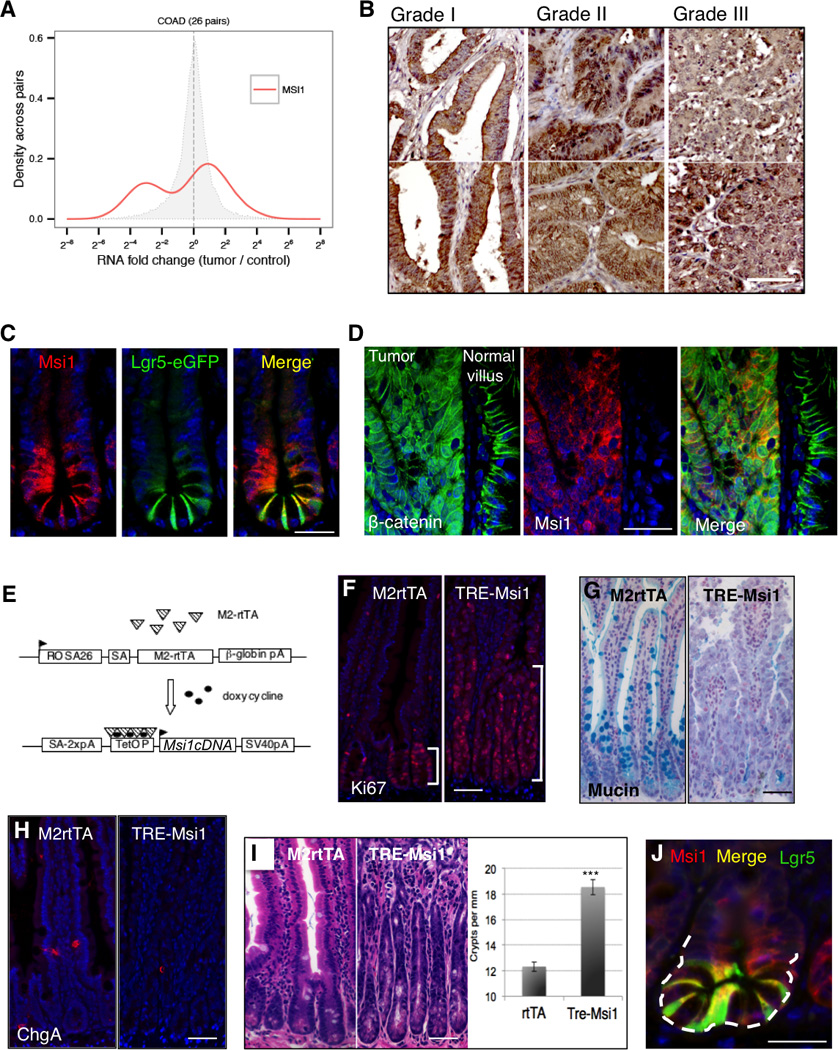
A. MSI1 expression in matched tumor/control sample pairs from TCGA colorectal adenocarcinoma (COAD) RNA-Seq (total of 26 patients). The distribution of MSI1 fold changes in tumor/control pairs for 26 individuals is plotted in red (intra-individual comparison). The distribution of MSI1 fold changes between control/control comparisons for 26 pairs of healthy individuals is plotted in grey (inter-individual comparison). B. Immunohistochemical staining for MSI1 in graded human colorectal cancer sections (scale=100µm). C. Immunofluorescence staining of Msi1 (red) in stem cells of the intestinal crypt costained for the crypt base columnar stem cell marker Lgr5 in Lgr5-eGFP-IRES-CreER knockin mice (green) (scale=50µm). D. Immunofluorescence for β-catenin and Msi1 in an adenoma resulting from APC LOH in the APCmin/+ mouse and normal villi adjacent to the adenoma (scale=100µm). E. Design of doxycycline (Dox)-inducible Msi1 knockin mice harboring a modified reverse tetracycline transactivator (M2rtTA) at the ROSA26 locus and the Msi1 cDNA under control of the tetracycline-responsive element-minimal CMV promoter (TRE/TetOP) targeted to safe-haven chromatin downstream of the Col1a1 locus. F. Immunofluorescence staining for Ki-67 marking proliferative cells in the intestinal crypts of control (M2rtTA) and TRE-Msi1 mice 48 hours after Dox induction. G. Alcian blue staining for goblet cell Mucin. H. Immunofluorescence staining for the enteroendocrine marker Chromogranin-A. (scale in F–H=100µm). I. Histological sections showing extension of crypt height and increased crypt fission in TRE-Msi1 mice (quantified at right, n=3 mice)(***: p<0.0005, Student’s t-test). J. A crypt undergoing fission in Lgr5-eGFP-IRES-CreER knockin mice costained for Msi1 (red) and GFP (green) (scale=50µm). See also Supplemental Figure 1.
Msi1 induction resulted in an expansion of the crypt proliferative zone and decreased presence of differentiated cells (the exception being persistence of Paneth cells, possibly due to their long lifespan and stable positioning at the crypt base) (Figure 1F–H and S1F–I). This caused TRE-Msi1 mice to become dehydrated, requiring euthanasia after approximately 3 days of Dox exposure. Msi1 induction also increased crypt fission, and endogenous Msi1 colocalized with Lgr5+ CBCs at sites of crypt fission in wildtype mice (Figure 1I, J). We next examined the effects of Msi1 induction on CBCs in TRE-Msi1::Lgr5-eGFP-CreER mice and observed an upward expansion of the stem cell zone and a significant increase in the frequency of Lgr5-eGFP+ CBCs (Figure 2A). Dox withdrawal resulted in a reversion of the epithelium to the wildtype state, which was maintained for several months, indicating that upon Msi downregulation, crypt stem cells return to a niche-dependent homeostatic state (Figure 2B). Further, Msi1 induction in ex vivo cultures of Lgr5-eGFP+ crypts resulted in increased growth of crypt buds, indicating that the phenotype is epithelial cell-autonomous (Figure 2 C, D).
Figure 2. Msi1 induction expands the progenitor cell compartment and drives APC loss and RNA metabolism gene expression programs.
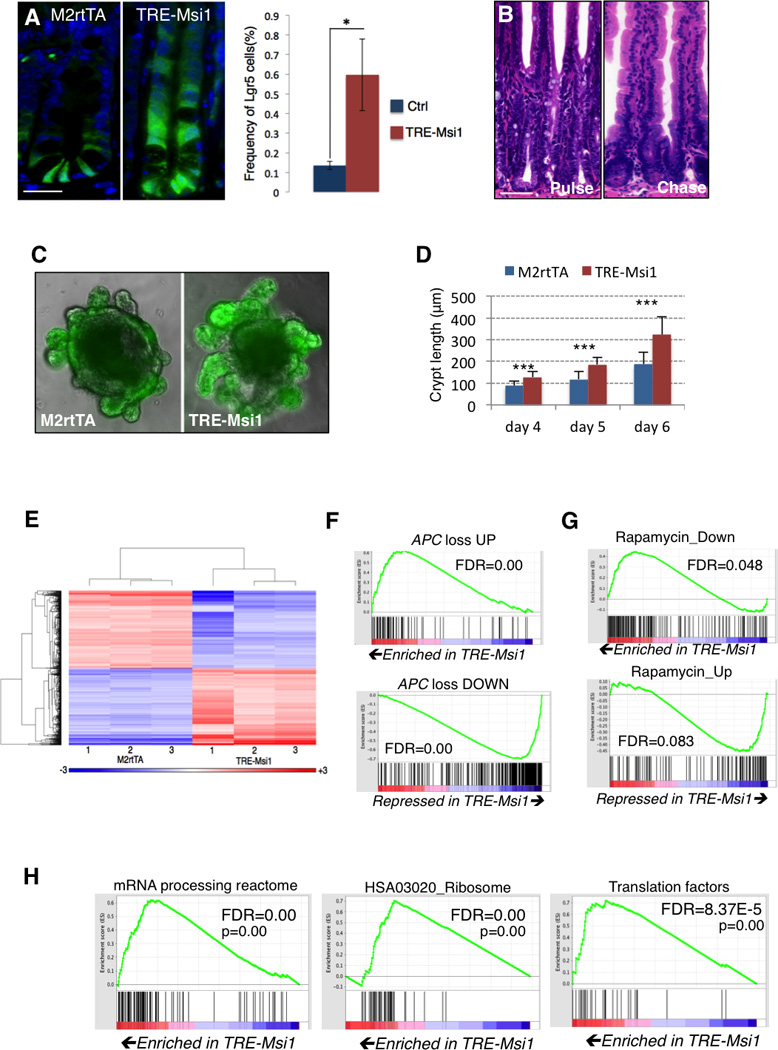
A. Msi1 induction in TRE-Msi1::Lgr5- eGFP-CreER mice results in an upward expansion of Lgr5-eGFP+ cells and an increase in the absolute frequency of Lgr5-eGFP+ cells, quantified by flow cytometry (right, n=3 mice per group, *p<0.05, Student’s t-test) (scale=50µm). B. TRE-Msi1 epithelium transformed by Dox induction for 48hrs revert to a phenotypically normal state persisting 2 months after Dox withdrawal (scale=100µm). C–D. In vitro culture of intestinal organoids derived from TREMsi1:: Lgr5-eGFP-CreER crypts followed by Dox induction in vitro. Crypt bud length is quantified in D (***: p<0.0005, Student’s t-test). E. Heatmap and hierarchical clustering of transcriptome profiles performed on the intestinal epithelium of 3 control (M2rtTA) and 3 TREMsi1 mice treated with Dox for 24 hours. F–H. Gene Set Enrichment Analysis (GSEA) of the TRE-Msi1 transcriptome identifies activation of genes induced by acute APC deletion in the intestinal epithelium (APC loss up) and suppression of genes downregulated after APC deletion (APC loss down) (F), along with an anti-correlation between the Msi1-induced transcriptome profile and the Peng_Rapamycin UP/DOWN gene sets (G), and an enrichment of expression of mRNA processing, ribosomal and translation factors upon Msi1 induction (H). FDR=False Discovery Rate. See also Supplemental Tables 1 and 2.
All of the phenotypes resulting from Msi1 induction are consistent with those observed in response to Msi2 induction, and are also consistent with acute loss of APC (excepting the stable positioning of Paneth cells, which become mislocalized upon APC loss)(Sansom et al., 2004; Wasan et al., 1998). Thus, Msi1 induction in vivo phenocopies that of Msi2 in otherwise genetically identical mouse models.
Msi1 and Msi2 drive common gene expression programs and interact with common target transcripts
We next analyzed changes to the transcriptome resulting from Msi1 induction (Table S1). Consistent with our phenotypic observations, unbiased Gene Set Enrichment Analysis [GSEA (Subramanian et al., 2005)] demonstrates that the APC-loss gene signature is among the most highly enriched upon Msi1 induction (Figure 2E, F and Table S2). We also observed enrichment of gene sets related to mRNA processing and translation along with an inverse correlation between the Msi1-induced gene expression program and expression profiles induced by the mTORC1 inhibitor Rapamycin (Figure 2G, H). All of these gene signatures were similarly enriched in intestinal epithelium overexpressing Msi2 (Wang et al., 2015), indicating that the analogous phenotypes resulting from Msi1 or Msi2 induction are driven by analogous gene expression programs. We therefore directly compared Msi1- and Msi2-induced transcriptome profiles and observed that 72% of gene expression changes resulting from Msi1 induction also occurred upon Msi2 induction (Figure 3A). Gene ontology (GO) and pathway analysis found commonly upregulated programs involved in ribosome biogenesis, signal transduction, and ErbB signaling, among others (Table S3). Commonly downregulated programs were broadly related to oxidative phosphorylation and mitochondrial activity.
Figure 3. Msi1 and Msi2 have overlapping RNA-binding targets.
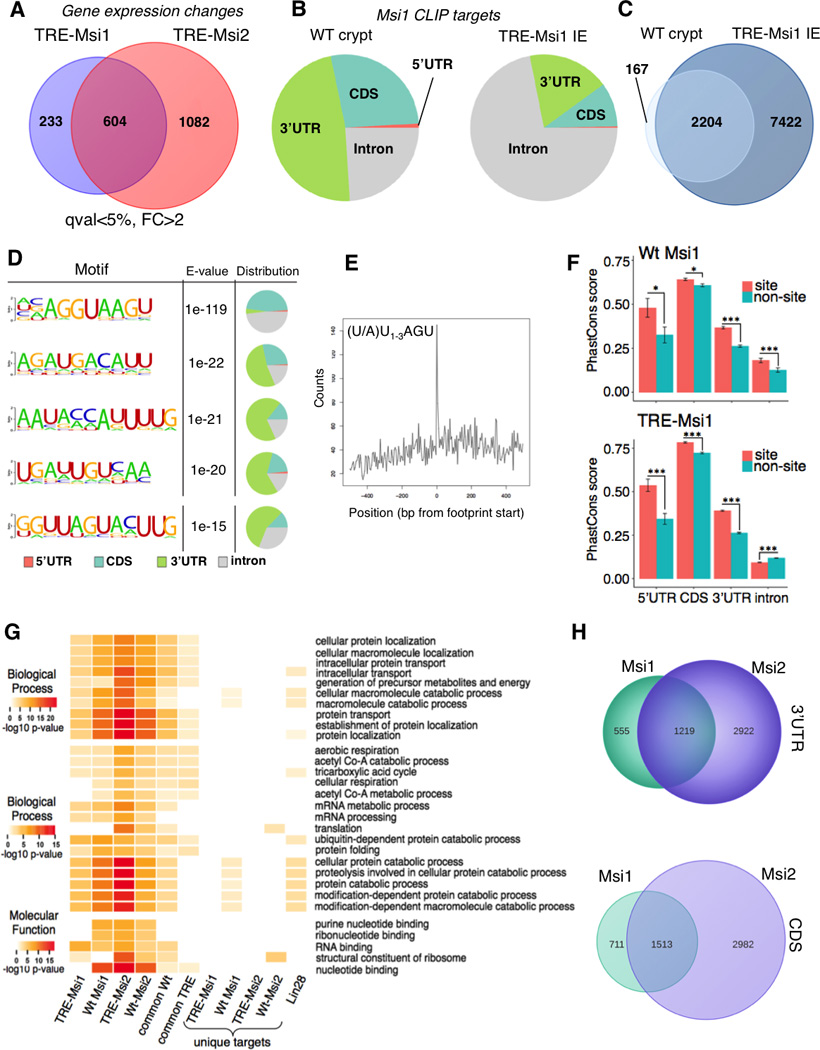
A. Venn diagram showing the degree of overlap in gene expression changes driven by Msi1 versus Msi2 induction in transcriptome profiles of the TRE-Msi1 and TRE-Msi2 intestinal epithelium. B. Distribution of Msi1-RNA binding events for endogenous Msi1 in wildtype crypts (left) and induced Msi1 in TRE-Msi1 intestinal epithelium (right). C. Venn diagram showing the degree of overlap in Msi1 RNA binding targets wildtype crypts and in TRE-Msi1 intestinal epithelium. D. Msi1 binding motif identification and distribution in wildtype intestinal crypts. The fifth motif represents the motif previously identified by selex in vitro. E. Position of the canonical Msi1 recognition motif previously identified in vitro within CLIP-Seq reads containing that motif. F. PhastCons analysis of conservation of Msi1 binding sites in the indicated regions of Msi1 target transcripts. Error bars represent 95% confidence intervals *: p<0.05, **: p<0.005, ***: p<0.0005. G. Gene ontology analyses for biological processes and molecular functions that are significantly enriched in Msi1/TRE-Msi1 or Msi2/TRE-Msi2 CLIP datasets, as well as for gene sets common to both wildtype or ectopic Msi1 and Msi2, or targets unique to Msi1/TREMsi1 or Msi2/TRE-Msi2, as well as targets bound by an unrelated RNA binding protein Lin28b. H. Venn diagrams showing overlap in transcripts bound by endogenous Msi1 and Msi2 in wildtype crypts. See also Supplemental Figures 2–4, and Supplemental Tables 3–6.
Given that Msi1/2 are RNA binding proteins that act on translation (Battelli et al., 2006; Katz et al., 2014; Kawahara et al., 2008; Okano et al., 2002), we performed in vivo transcriptome-wide RNA binding analysis (CLIP-Seq) for both endogenous and induced Msi1 in the intestinal epithelium to identify direct targets. Msi1 bound 2371 transcripts in wildtype crypts, primarily in 3’UTRs and coding sequences (Figure 3B and Table S4). Upon Dox administration, ectopic Msi1 became increasingly associated with intronic sequences, and 91% of transcripts newly bound upon Msi1 induction (i.e., those transcripts associated only with ectopic Msi1) were bound in introns (Figure 3B and S2A). In total, 93% of transcripts bound by Msi1 in wildtype crypts were also bound in TRE-Msi1 epithelium (Figure 3C). These binding patterns were consistent with those previously described for Msi2.
Motif analysis of CLIP targets indicated that Msi1 binds distinct sequences in introns and coding sequences in comparison to 3’UTRs, and although Msi1 binding motifs were A-U rich, the previously described Msi1 motif discovered by a SELEX-based approach, [(A/U)U1–3AGU](Imai et al., 2001), was not among the most significant (Figure 3D). It was, however, significant in the dataset and was located in the center of sequence reads containing it, demonstrating that it is a bona fide motif in vivo (Figure 3D, E). Msi1 binding showed no preference for highly abundant transcripts, and, globally, transcripts newly bound upon Msi1 induction exhibited no change in their expression levels (Figure S2B, C). Sequence-specific Msi1-RNA interactions were confirmed using in vitro binding assays incubating recombinant human MSI1 with RNA oligos containing the consensus motifs identified by CLIP (Figure S2D).
The large number of intronic binding sites led us to further investigate Msi1-intronic interaction. Nuclear/cytoplasmic fractionation of wildtype crypts and human CRC cells indicates that the majority of Msi1 is cytoplasmic, and binding site conservation analysis demonstrates that, while all binding sites for endogenous Msi1 and the UTR and coding sequence sites for ectopic Msi1 are evolutionarily conserved, intronic binding sites of ectopic Msi1 are not (Figure 3F and S2E). These data suggest that intronic binding events for ectopic Msi1 may be largely promiscuous. Consistent with this, analysis of the location of Msi1 binding sites across introns revealed a preference for interaction of Msi1 with the 5’ intron terminus in wildtype crypts, and this preference was largely attenuated for ectopic Msi1 (Figure S2F). This also suggests that some Msi1-intron interactions may be involved in alternative splicing (Katz et al., 2014; Uren et al., 2015). We therefore asked how Msi1 binding was related to exon inclusion/exclusion. Interestingly, Msi1 targets were more likely to contain exons that exhibited increased inclusion upon ectopic Msi1 induction than transcripts not bound by Msi1, further suggesting that Msi1 activity may be associated with alternative exon inclusion (Figure S3A).
Gene ontology analysis revealed that Msi1 binds transcripts encoding regulators of RNA metabolism, nucleotide binding, and cellular respiration consistent with the GSEA analysis of transcriptome changes (Figure 3G and Table S5). Significantly enriched GO categories also included protein localization and transport, possibly reflecting an established role for Msi in governing asymmetric cell fate determination (Kharas et al., 2010; Nakamura et al., 1994). These pathways were not enriched in the set of targets of an unrelated RNA binding protein Lin28b (Madison et al., 2013). Consistent with the GSEA and GO analyses, Ingenuity Pathway Analysis identified pathways involved in cellular respiration, cancer, and Pten-PI3K-AKT-mTORC1 signaling as being the most significantly represented across the CLIP datasets (Figure S3 B).
We next sought to determine the overlap in the RNA binding activities of Msi1 and Msi2 and observed that 69% and 68% of transcripts bound by wildtype Msi1 in their 3’ UTR and coding sequences, respectively, were similarly bound by Msi2 (Figure 3H). Similar binding patterns were observed for ectopically induced Msi1 and Msi2 (Figure S3C). Both Msi1 and Msi2 targets functioned in analogous pathways, including RNA metabolism, protein localization, and cellular respiration (Figures 3G and S3B, and Tables S5 and S6). Further, overlap of our murine in vivo CLIP datasets with published RNA binding data for MSI1 in human transformed cell lines in vitro (de Sousa Abreu et al., 2009; Uren et al., 2015; Vo et al., 2012) reveals a significant overlap despite the vast differences in cellular identity (Figure S4A). These analyses indicate that Msi1/Msi2 act on a common set of target genes, accounting for the identical phenotype between Msi1 and Msi2 gain-of-function. Given their highly similar RNA binding activities, we tested for Msi1-Msi2 protein interaction, but failed to detect any by co-immunoprecipitation, suggesting that either Msi1 or Msi2 are sufficient to act upon target transcripts (Figure S4B).
The transcripts encoding p21 and Numb are among the best-characterized Msi1 targets (Battelli et al., 2006; Imai et al., 2001), and we previously observed Msi2 binding to these transcripts in the intestinal epithelium (Wang et al., 2015). Similarly, these transcripts were bound by ectopically induced Msi1 (Figure S4C). Msi1 also bound the transcripts encoding the well-established intestinal tumor suppressors Lrig1 and Bmpr1 (He et al., 2004; Powell et al., 2012), as we previously observed for Msi2 (Figure 4A). Interestingly, Lrig1 is a negative regulator of ErbB signaling, and we observed upregulation of the ErbB pathway downstream of both Msi1 and Msi2 (Table S3).
Figure 4. Effects of Msi1 on Wnt pathway activity.
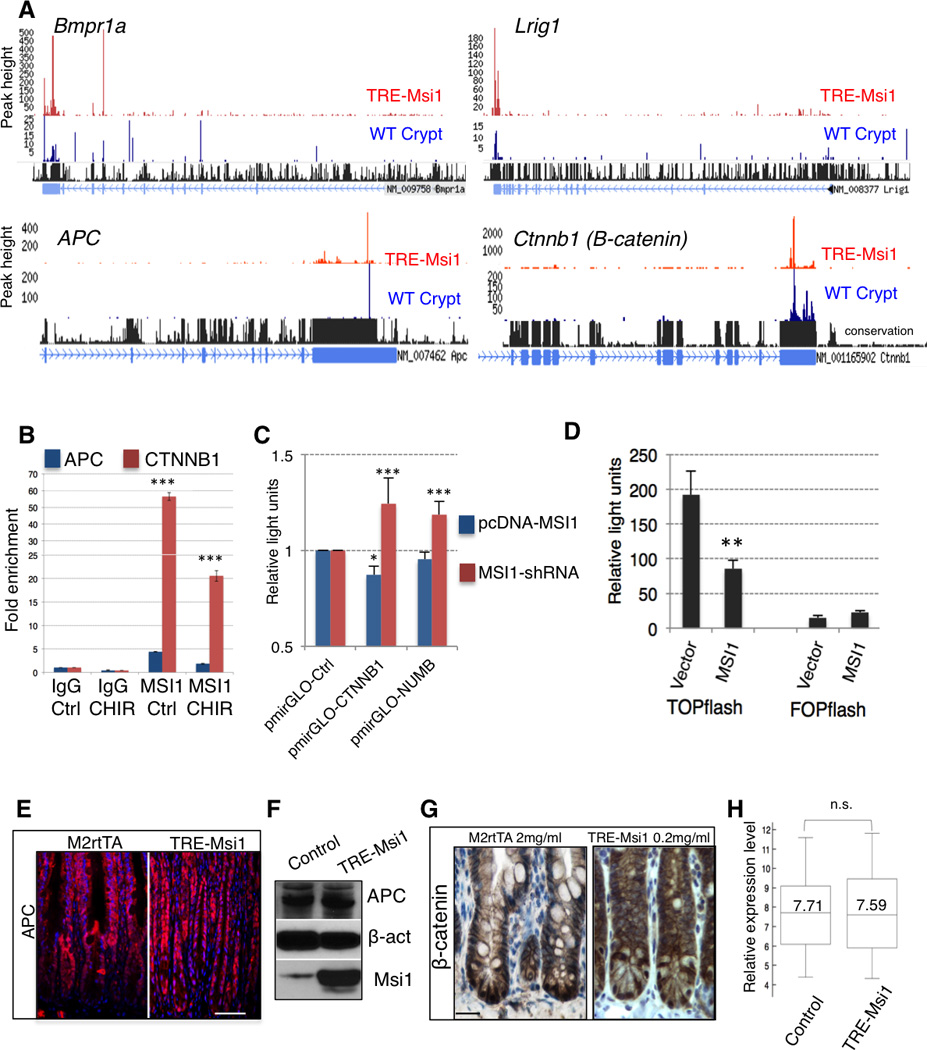
A. CLIP-Seq tracks showing endogenous (WT) and ectopically induced Msi1 binding target transcripts. B. CLIP-qRT-PCR analysis of endogenous MSI1 binding to 3'UTRs of APC and CTNNB1 (β-CATENIN) in HEK293 cells in the absence (Ctrl) or presence of the GSK3β inhibitor CHIR99021 (CHIR) (n=3). ***: p< 0.0005, Student’s t-test. C. Luciferase reporter assays in HEK293 cells upon lentiviral shRNA-knockdown of MSI1 (using pSico) or MSI1 overexpression (using pcDNA), shown for constructs containing the CTNNB1 and NUMB 3’UTRs (n=3) (*: p<0.05, ***: p< 0.0005, Student’s t-test). D. Luciferase reporter assays in HCT116 cells for canonical Wnt pathway activation using the TOPflash reporter with multimerized β-catenin/TCF binding sites upstream of luciferase or the control FOPflash reporter with mutated binding sites and empty vector or MSI1 overexpression (n=3) (**: p<0.005, Student’s t-test). E. Immunofluorescence staining of APC protein in control (M2rtTA) and TRE-Msi1 mice 48 hours after dox administration (scale=100µm). F. Immunoblotting for APC in control (M2rtTA) and TRE-Msi1 epithelium. G. Immunohistochemical staining for transcriptionally active (nuclear) β-catenin in crypts of control (M2rtTA) and TRE-Msi1 transformed intestine (scale=100µm). H. Box plot showing expression levels of known direct β-catenin target genes (full gene list in methods) in total intestinal epithelium from control (M2rtTA) and TRE-Msi1 mice (n=3).
Msi1 does not potentiate transcriptional activity of the canonical Wnt pathway
Msi1 has been reported to bind to and inhibit the function of APC, a negative regulator of the transcriptional effector or canonical Wnt signaling, β-catenin (Spears and Neufeld, 2011), and in vitro studies have posited a role for Msi1 in potentiating canonical Wnt target gene expression (Rezza et al., 2010). Indeed, we observed binding of the APC transcript, however we also observed stronger binding of Msi1 to the Ctnnb1 transcript encoding β-catenin (Figure 4A). We confirmed the preference of endogenous human MSI1 for CTNNB1 versus APC using CLIP-qRT-PCR, and this binding preference was maintained upon Wnt pathway stimulation with the GSK3β-inhibitor CHIR 99021 (Figure 4B). 3’UTR Luciferase reporter assays confirmed that MSI1 repress CTNNB1 translation, albeit moderately (Figure 4C). Similarly, activity of the TOPFlash multimerized β-CATENIN/TCF reporter was attenuated by MSI1 activity (Figure 4D). To determine the effects of Msi1 activity on the canonical Wnt pathway in vivo, we examined APC and β-catenin protein in control and TRE-Msi1 epithelium and observed no appreciable differences (Figure 4E–G). Further, analysis of the expression of direct β-catenin target genes in TRE-Msi1 epithelium showed no significant changes upon Msi1 induction (Figure 4H). Thus Msi1, like Msi2, does not potentiate canonical Wnt signaling in vivo.
Msi1 activates the PDK-Akt-mTORC1 axis
One of the major oncogenic pathways downstream of Msi2 is mTORC1, which becomes activated upon Msi2 binding to its upstream inhibitor Pten (Wang et al., 2015). Msi1 also bound to the 3’UTR of the Pten mRNA, decreasing Pten protein levels (Figure 5A, B). Further, MSI knockdown in human CRC cells led to increased PTEN activity and decreased PIP3 levels (Figures 5C and S5A–C). Downstream of Pten, Msi1 induction activated the PDK-Akt-mTORC1 axis (Figure 5B, D), with increased phosphorylation of AKT at T308 by PDK1 (PDPK1). AKT phosphorylation at S473 by mTORC2, however, showed only a minor increase, indicating that mTORC1 activation is due to increased AKT activity via activation of AKT by the PI3K pathway. Consistent with this notion, we observed an increase in the activating PDK1 autophosphorylation event at S241 (Figure 5D), and increased phosphorylation of the AKT target c-RAF (S259), further supporting the activation of AKT downstream of Msi1. Downstream of mTORC1, there was strong inactivating phosphorylation of the translational inhibitor 4EBP1, resulting in activation of the translational initiation factor eIF4E (Figure 5D). Examination of the levels and spatial distribution S6 phosphorylation (as an ultimate readout of S6 kinase activity downstream of mTORC1) revealed a dramatic induction and expansion throughout the entire epithelium upon Msi1 induction (Figure 5B, E). Thus, activation of the PDK1-AKT axis downstream of Pten by Msi1 contributes to the observed increase in mTORC1 activity in the intestinal epithelium. To confirm the functional importance of mTORC1 activity for the Msi1-driven phenotype, we pre-treated TRE-Msi1 mice with Rapamycin prior to inducing Msi1 with Dox. Rapamycin treatment blocked crypt fission, crypt height expansion, and hyperproliferation in the presence of ectopic Msi1 activity, confirming the functional importance of the mTORC1 complex downstream of Msi1 (Figure 5F–H).
Figure 5. Msi1 functions through the PDK-Akt-mTORC1 axis.
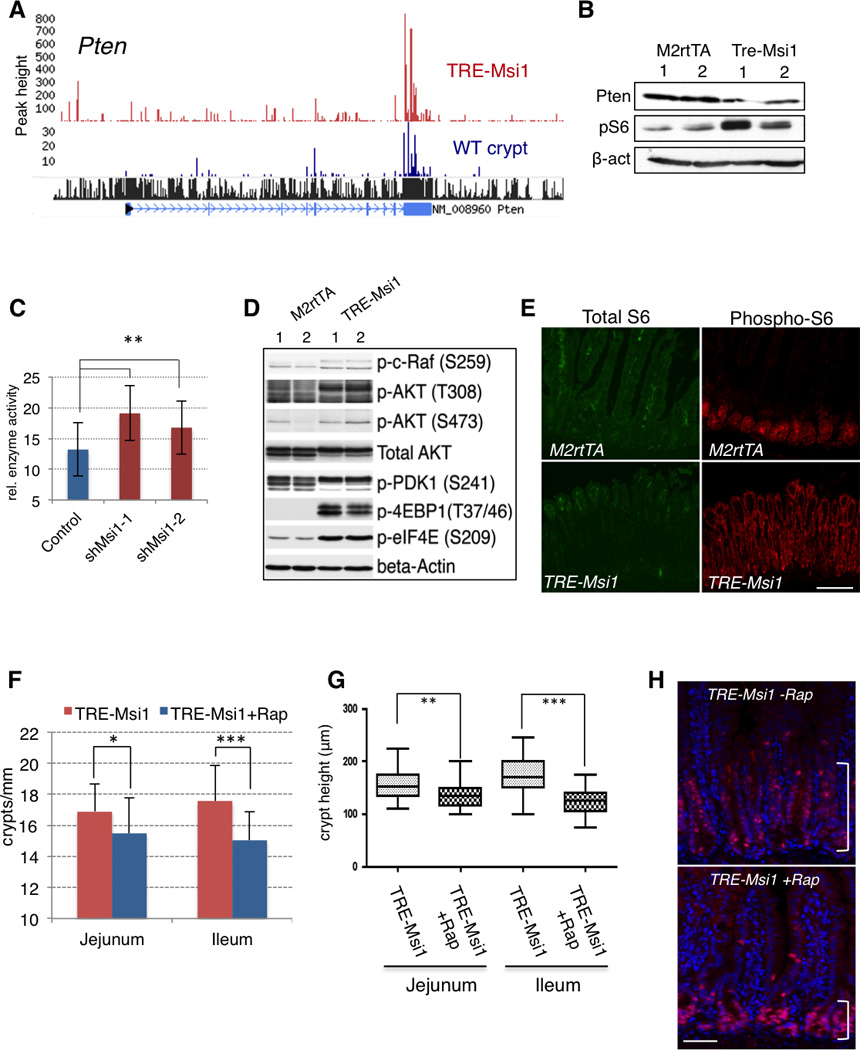
A. CLIP-Seq track showing Msi1 binding to the 3’UTR of the Pten tumor suppressor mRNA. B. Immunoblotting for Pten and S6 phosphorylation upon Msi1 induction in the intestinal epithelium. C. PTEN enzymatic activity measured by immunoprecipitation followed by ELISA upon knockdown of MSI1 in 293T cells (**: p< 0.005, Student’s t-test). D. Immunoblot analysis of the PI3K-AKT-mTORC1 pathway downstream of Pten in the intestinal epithelium of two control and two TRE-Msi1 mice treated with Dox for 24 hours. E. Immunofluorescence for phosphorylation of S6 by the mTORC1 target S6 kinase in control and TRE-Msi1 transformed intestinal epithelium (scale=200µm). F–H. Rapamycin treatment rescues TRE-Msi1-induced transformation of the intestinal epithelium. Mice treated with Rapamycin for 3 days prior to Dox administration exhibit decreased crypt fission (F) and a block in crypt height expansion (G) (*: p< 0.05, **: p< 0.005, ***: p< 0.0005, Student’s t-test). H. Immunofluorescence staining for Ki67 of Dox-induced TRE-Msi1 mice with or without Rapamycin treatment (scale=100µm). Brackets indicate the height of the crypt proliferative zone. See also Supplemental Figure 5.
Msi activity is required for intestinal tumorigenesis
The data thus far establish that Msi1 activity is sufficient to transform the intestinal epithelium in a manner analogous to Msi2, and that these two RNA binding proteins act on a similar set of target transcripts and affect analogous downstream pathways. If Msi1 and/or Msi2 act as oncoproteins in intestinal cancers, our data predict that the expression of one or the other would be sufficient to drive malignancy. We therefore assessed expression of MSI1 and MSI2 in a panel of human CRC cells and found that, while MSI2 was consistently expressed across all cell lines, MSI1 was coexpressed only in a subset, and was frequently expressed at levels lower than those observed in normal human colon (Figure 6A). This pattern is precisely what we would predict from TCGA data analysis of paired tumor/adjacent normal tissue [Figure 1A and (Wang et al., 2015)]. We thus inhibited MSI1 alone or in combination with MSI2 and/or β-CATENIN in several CRC cell lines. MSI1 inhibition alone had an antiproliferative effect in some lines, but not others (Figure 6B), and this effect could not be predicted by levels of MSI1 expression relative to MSI2. Concomitant inhibition of both MSI1/MSI2 significantly inhibited growth of all cell lines analyzed, and additional inhibition of β-CATENIN blocked tumor cell growth more effectively than β-CATENIN or MSI inhibition alone (Figure 6B). Immunoblotting for MSI1 and nuclear (transcriptionally active) β-CATENIN indicates that MSI and β-CATENIN act in parallel pathways, as β-CATENIN knockdown has no major effect on MSI1 protein levels and vice versa (Figures 6C and S6A). We further confirmed that MSI inhibition abrogated the growth of tumor xenografts from RKO and HCT116 cells, and that addition of β-CATENIN inhibition synergized with MSI inhibition to completely block tumor growth (Figures 7A–D and S6B, C).
Figure 6. MSI1 and MSI2 promote human colorectal cancer cell growth.
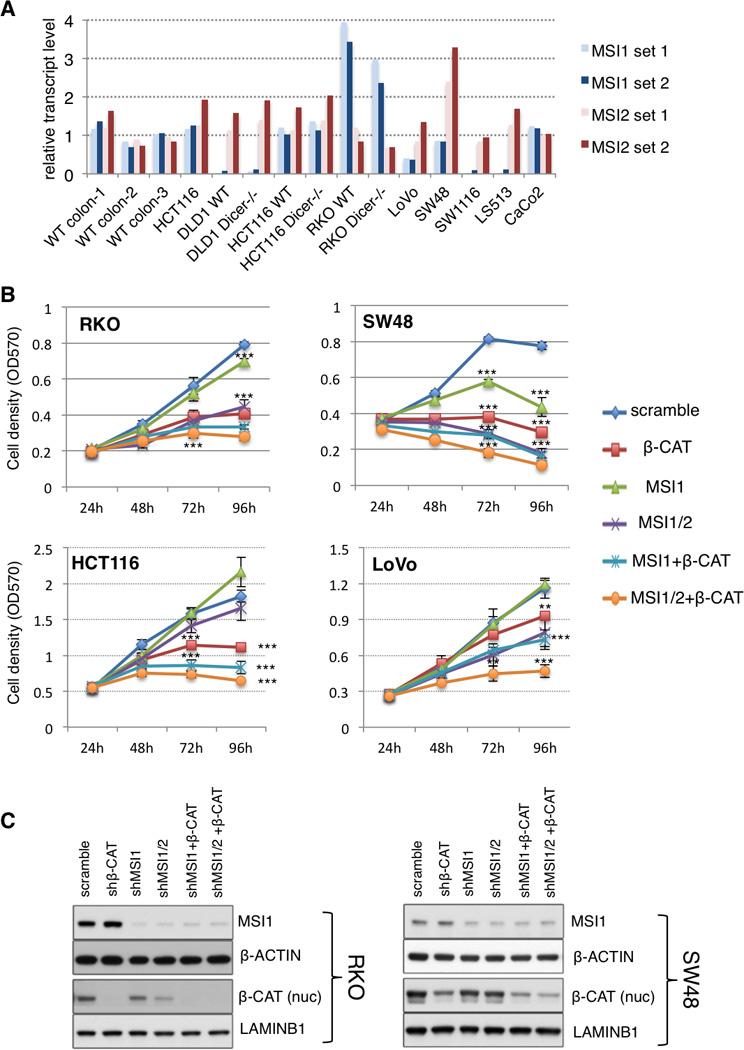
A. Expression of MSI1 and MSI2 in three wildtype human colon biopsies and a panel of colorectal cancer cell lines, interrogated with two distinct primer sets for each MSI gene. HCT116 and HCT116 WT are the same cell line, procured from distinct sources (see methods). B. Growth of human colorectal cancer cell lines upon shRNA-knockdown of MSI1, MSI1 & MSI2, MSI1 & β-CATENIN, and MSI1&2 & β-CATENIN (**: p< 0.005, ***: p< 0.0005, Student’s t-test). C. Immunoblotting validating knockdown of MSI1 and transcriptionally active (nuclear) β-CATENIN in RKO and SW48 cells. Of note, β-CATENIN knockdown does not affect MSI1 levels, and MSI1 knockdown does not significantly affect nuclear β-CATENIN levels. See also Supplemental Figure 6.
Figure 7. MSI1/Msi1 and MSI2/Msi2 cooperate to promote tumor growth in vivo.
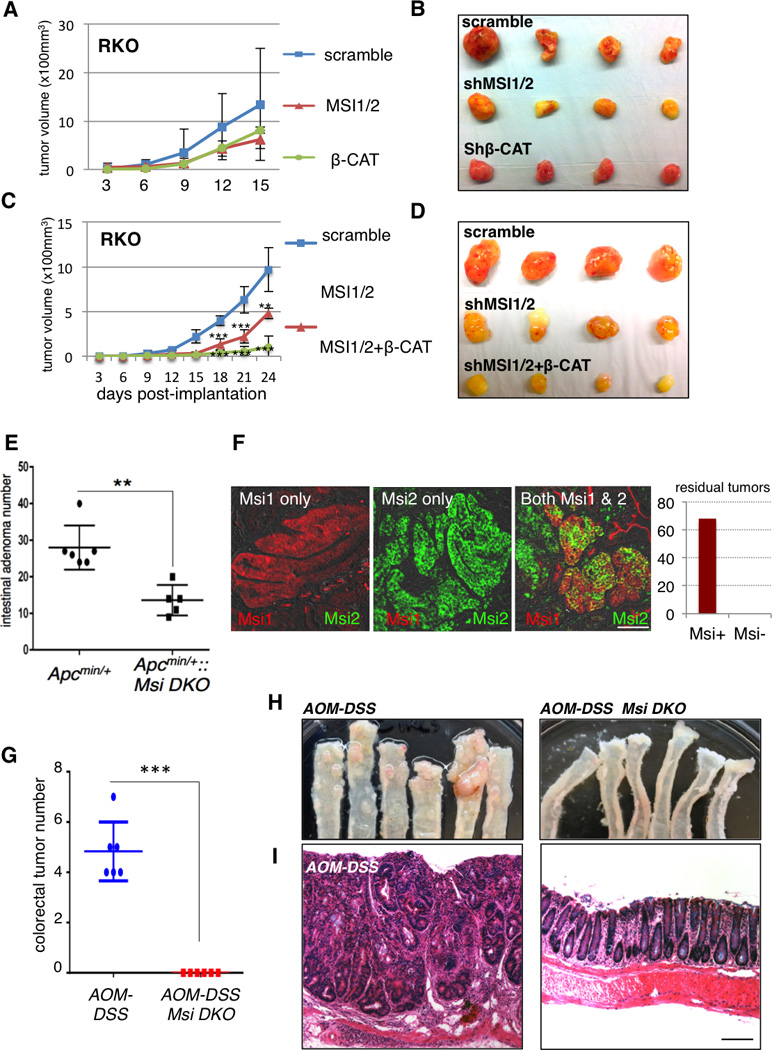
A, B. Growth of RKO cell xenografts upon MSI or β-CATENIN shRNA knockdown (A), with tumors shown after dissection upon termination of the experiment (B). C, D. Growth of RKO cell xenografts upon combined knockdown of MSI proteins alone or with β-CATENIN knockdown (C), with tumors shown after dissection upon termination of the experiment (D). (**: p< 0.005, ***: p< 0.0005., Student’s t-test). E. Frequency of intestinal adenomas in APCmin/+ mice with or without deletion of Msi gene deletion in Msi1/2flox/flox::Villin-CreER::APCmin/+ mice (**: p< 0.005, Student’s t-test, n=5–6 mice per group). F. Representative immunofluorescence micrographs of residual tumors in Msi1/2flox/flox::Villin-CreER::APCmin/+ mice showing Msi1 (red), Msi2 (green), or Msi1/2 expression (scale=100µm). The graph at right depicts number of residual tumors in Msi1/2flox/flox::Villin-CreER::APCmin/+ that were either positive or negative for Msi immunoreactivity (100%, or 68/68 total residual tumors scored positive). G. Frequency of inflammation-driven colorectal adenomas/adenocarcinomas in mice treated with the AOMDSS protocol, with or without prior Msi gene deletion in Msi1/2flox/flox::Villin-CreER mice. (***: p< 0.0005, student’s t-test, n=6 mice per group). H. Photographs of distal colon resected from control (left) and Msi1/2 double knockout (right) mice at the end of the AOM-DSS protocol. I. Representative hematoxylin-eosin histological section of a colorectal adenocarcinoma resulting from AOM-DSS treatment in control mice (left). In contrast, mice lacking Msi gene function exhibited normal colon morphology after the AOM-DSS protocol (right) (scale=200µm). Supplemental Figure 7.
These findings suggest that MSI activity is required for the maintenance of colorectal cancer growth. To test this in a more physiologically relevant setting and to address the importance for Msi activity in tumor initiation, we examine tumorigenesis in genetic models of Msi loss in vivo. First, we generated compound Msi1flox/flox::VillinCreER::APCmin/+ (Msi1−/−) Msi2flox/flox::VillinCreER::APCmin/+(Msi2−/−), and Msi1flox/flox::Msi2flox/flox::VillinCreER::APCmin/+ (Msi-DKO) mice enabling individual or concomitant ablation of the two Msi genes throughout the epithelium by Tamoxifen-mediated activation of a Villin-CreER allele (el Marjou et al., 2004) (Figure S7A–C). Acute deletion of Msi1 in otherwise wildtype mice had no effect on Msi2 expression and vice versa (Figure S7D). To study the effects of Msi loss on tumorigenesis, Msi genes were deleted alone or concomitantly followed by maintaining mice on a low protein diet to promote adenoma formation upon loss of heterozygosity at the APC locus. Individual deletion of either Msi1 or Msi2 had no effect of tumor burden in the APCmin background (Figure S7E). In contrast MsiDKO mice had a significant reduction in tumor burden relative to controls (Figure 7E). One hundred percent (68/68) of residual tumors forming in MsiDKO mice were found to have escaped recombination at one or more of the floxed Msi alleles, and thus Msi−/− tumors were never observed (Figure 7F). These data strongly indicate that Msi proteins act redundantly as oncogenes, with the presence of either Msi1 or Msi2 being sufficient to support tumorigenesis upon APC loss.
While the APCmin/+ model is relevant to human disease in that spontaneous loss of APC is found in the vast majority of human CRC (Kinzler et al., 1991; Miyoshi et al., 1992; Nagase et al., 1992), the mouse model differs from the human condition in that tumors are primarily localized to the small intestine rather than colon, and they rarely progress to malignant adenocarcinoma. We therefore examined tumor formation in the AOM-DSS model of inflammation-driven colorectal adenocarcinoma (De Robertis et al., 2011). This model is clinically relevant as chronic inflammation is a leading indicator of colorectal cancer risk (van Hogezand et al., 2002). Experimental and control mice were given a single dose of the mutagen azoxymethane (AOM), followed by cycles of the inflammatory agent dextran sodium sulfate (DSS) to drive formation of colorectal adenocarcinomas (Figure S7F). As expected, colorectal adenocarcinomas reproducibly formed in control mice (Figure 7G–I and S7G). In contrast, Msi-DKO mice were completely resistant to tumorigenesis in this model with zero tumors forming (Figure 7G–I and S7G). Taken together, our findings demonstrate the Msi1 and Msi2 act as potent, redundant oncoproteins whose activity is required for the initiation and maintenance of cancers of the intestinal epithelium.
Discussion
The Msi family of RNA binding proteins has been implicated in oncogenic transformation in a number of organ systems, through a number of proposed downstream mechanisms. In particular, several RNA binding targets have been proposed to mediate the oncogenic function of Msi1, including the transcripts encoding p21, Numb, APC and others (Battelli et al., 2006; Cambuli et al., 2015; Imai et al., 2001; Sanchez-Diaz et al., 2008; Spears and Neufeld, 2011; Sureban et al., 2008; Uren et al., 2015; Vo et al., 2012). These mechanistic studies, however, were conducted using transformed cell lines in vitro or constitutive, random integrant gain-of-function transgenesis. In contrast, in vivo transcriptome-wide RNA binding analyses for Msi1 and Msi2 suggest that the reality is far more complex, with Msi interacting with hundreds to thousands of transcripts.
Although published studies have focused largely on Msi1, the second mammalian Msi family member, Msi2 has recently emerged as a potent oncoprotein. In the hematopoietic system, Msi2 is the only Msi family member expressed, and its activity is required for hematopoietic stem cell self-renewal (Park et al., 2014). Further, oncogenic Msi2 activity promotes aggressive leukemias, in the context of acute myelogenous leukemia (AML), mixed-lineage leukemia (MLL), and chronic myelogenous leukemia (CML), where it drives chronic phase disease into the more aggressive blast crisis phase characterized by a more stem cell-like gene expression profile. Interestingly, in the hematopoietic system, the effects of Msi2 appear to be largely independent of the previously identified Msi1 RNA binding targets encoding Numb and p21(Kharas et al., 2010; Park et al., 2014; Park et al., 2015). Rather, Msi2 appears to be working through the TGF-β, Hoxa9, Ikzf2 and Myc mRNAs, as well as through a more general function in regulating RNA biogenesis in the hematopoietic lineage.
In the intestinal epithelium, Msi2 governs RNA biogenesis and also has potent oncogenic properties consistent with observations in the hematopoietic system (Wang et al., 2015). In contrast to the hematopoietic system however, Msi2 bound to several transcripts encoding well-established colorectal tumor suppressors, including the negative regulator of ErbB signaling Lrig1, as well as Bmpr1a and Pten (Goel et al., 2004; He et al., 2007; He et al., 2004; Howe et al., 2001; Marsh et al., 2008; Naguib et al., 2011; Powell et al., 2012; Wang et al., 2015). Interestingly, the known Msi1 binding targets encoding p21 and Numb were found to bind Msi2 in vivo, however Msi2 induction does not elicit a strong upregulation of the Notch pathway, nor does Msi2 potentiate activity of the canonical Wnt pathway as proposed for Msi1 in cell culture models. Instead, the major oncogenic effects of Msi2 in vivo appears to be activation of mTORC1, a complex dispensable for intestinal function, but known to be required for intestinal tumorigenesis downstream of APC loss (Faller et al., 2015; Fujishita et al., 2008). Thus, there exist discrepancies between the proposed oncogenic functions of Msi1 in colorectal cancer cells (e.g., suppression of p21, Numb, and APC translation, and potentiation of Wnt signaling), and the acute oncogenic consequences of Msi2 gain of function in vivo (RNA metabolism and mTORC1 activation). Whether these discrepancies represent actual biological differences between the activity of the two Msi family members, or differences between the in vitro and in vivo model systems were not understood.
Here we generated a single-copy, inducible Msi1 mouse model using genetic loci and strains identical to those previously used for Msi2 induction in vivo, enabling a direct comparison of the oncogenic consequences of acute gain-of-function of the two Msi family members. Remarkably, Msi1 induction elicits the identical phenotypic transformation of the intestinal epithelium observed for Msi2 through interaction with a largely common repertoire of transcripts. Interestingly, we observed that Msi1 did bind to the APC mRNA as reported in vitro, however we observed a stronger interaction between Msi1 and the Ctnnb1 mRNA, suggesting that Msi1 might regulate the canonical Wnt pathway. However, in contrast to prior reports, we found no evidence that Msi1 potentiates Wnt pathway activity either in vitro or in vivo, using either human or mouse MSI1/Ms1, consistent with our observation that MSI1/2 knockdown in human CRC cells does not significantly effect levels of nuclear β-CATENIN. Further, the observation that β-CATENIN knockdown does not affect MSI levels supports a model in which the oncogenic activities of MSI and β-CATENIN lie in parallel pathways.
These data indicate that Msi1 and Msi2 function redundantly; leading to the prediction that Msi proteins can act interchangeably as oncogenes in CRC. Indeed, dual inhibition of both MSI proteins is required to fully abrogate tumor growth in CRC cell lines. Interestingly, the dependence of these cells on MSI activity appears to be independent of underlying genetic driver mutations, as MSI inhibition was effective in blocking growth of RKO cells (mutations in BRAF, PIK3CA, and microsatellite instability), SW48 cells (mutations in APC and microsatellite instability), HCT116 (mutations in KRAS, PIK3CA, TP53, β-CATENIN, and microsatellite instability), and LoVo cells (mutations in KRAS, APC, and microsatellite instability)(Ahmed et al., 2013). This observation is similar to what was previously observed for MSI2 in human leukemias, where MSI2 upregulation and subsequent oncogene addiction occurs regardless of underlying genetic mutation (Kharas et al., 2010).
Further, despite the focus on MSI1 in CRC, our data suggest that MSI2 may be the dominant MSI family member in driving these malignancies, as MSI2 upregulation is essentially ubiquitous in CRC, whereas MSI1 upregulation is observed only in a subset of human tumor samples and CRC cell lines. Why MSI2 is preferentially expressed relative to MSI1 remains unclear.
Ultimately, the current study demonstrates that both Msi family members elicit an analogous transformation of the intestinal epithelium, with identical phenotypic changes, highly similar gene expression profiles and overlapping RNA binding targets. Further, concomitant loss of both Msi family members was sufficient to abrogate tumorigenesis in both human and murine models, clearly demonstrating the critical importance of these RNA binding proteins to the ontogeny of colorectal cancers. Our findings serve as a basis for exploring the mechanisms through which MSI proteins promote human cancers and highlight the critical importance of addressing the role of both family members when studying MSI function and consideration of their redundant function for development of MSI inhibitors.
Experimental Procedures
Accession Numbers
Transcriptome profiles: GSE74321
CLIP-Seq data: GSE54598
Generation of TRE-Msi1 Mice
All procedures involving mice were reviewed and approved by the Institutional Animal Care and Use Committee of the University of Pennsylvania (Animal Welfare Assurance Reference Number #A3079-01, approved protocol #803415 granted to Dr. Lengner) and were in accordance with the guidelines set forth in the Guide for the Care and Use of Laboratory Animals of the National Research Council of the National Institutes of Health. Euthanasia was performed using controlled flow carbon dioxide administration followed by cervical dislocation.
The murine Msi1 cDNA (a kind gift from Dr. Joseph Verdi, Maine Medical Center Research Institute) was cloned into the unique EcoRI restriction site of the pBS31 vector containing a PGK promoter followed by an ATG start codon and an FRT recombination site, followed by a splice acceptor-double polyA cassette, the tetracycline operator with a minimal CMV promoter, the unique EcoRI site, and an SV40 polyadenylation signal. The pBS31-Msi1 vector was then electroporated along with a Flpe recombinase-expressing vector into KH2 embryonic stem cells harboring the modified reverse tetracycline transactivator (M2rtTA) targeted to and under transcriptional control of the ROSA26 locus, as well as an FRT-flanked PGK-neomycinR cassette followed by a promoterless, ATG-less hygromycinR cassette targeted downstream of the Collagen1a1 locus. Selection for hygromycin resistance upon flip-in yielded numerous colonies which were verified for proper recombination at the Coll1a1 locus by digestion of genomic DNA and Southern blotting with a 3’ internal probe, yielding a 6.2kb wildtype band, a 6.7kb band for the FRT-containing knock-in allele, and a 4.1kb band for the successfully flipped-in Msi1 inducible allele (TRE-Msi1).
CLIP-Seq and CLIP-qRT-PCR
CLIP-Seq libraries were made as previously described in (Chi et al., 2009) with modifications. The CLIP-Seq procedure used in this study was identical to that used in (Wang et al., 2015) and is described in detail in the Supplemental Methods.
Generation and Verification of Msi Floxed Alleles
Msi1 and Msi2 alleles were targeted using homologous recombination in V6.5 embryonic stem cells. Generation of the Msi2 conditional allele is described in (Park et al., 2014)Targeted (3-lox) clones were isolated after neomycin (G418) selection and Southern blotting using external probes flanking both the 3’ and 5’ targeting arm validated proper insertion of the targeting vector. Three-lox clones were then transiently electroporated with Cre recombinase and subcloned to identify 2-lox conditional clones. Clones harboring 2-lox (floxed) Msi1 and Msi2 alleles were injected into blastocysts and resulting chimeras backcrossed to a Black/6 background. Addition of Cre recombinase (either transiently in culture or through intercrossing with Villin-CreER mice) resulted in deletion of the transcriptional start site and exons 1&2 (in the case of Msi1) or exons 1–4 (in the case of Msi2), generating a 1-lox null allele that was validated by Southern blotting and Msi protein loss. Southern blotting was carried out by digesting genomic DNA overnight, transferring to Hybond XL membrane (Amersham/GE Healthcare, Pittsburgh, PA) and hybridizing with a 32P-probe labeled by random priming (Prime-it II, Agilent Technologies, Santa Clara CA) in Church buffer at 60°C overnight followed by washing with increasing stringency SDS/SSC buffer and exposure to film.
For Msi1/2 in vivo expression analysis in Figure S7D, Msi1flox/flox::VillinCreER or Msi2flox/flox::VillinCreER mice were administered 5 doses of tamoxifen (2mg/dose in 100ul corn oil) when they were 6 weeks old. After a 5-day chase period, crypt epithelial RNA was isolated and Msi gene expression was analyzed.
Apcmin/+ and AOM-DSS Tumor Models
The Apcmin/+ mice were obtained from JAX lab (Stock Number: 002020). Apcmin/+::Msi1/2flox/flox, Apcmin/+::Msi1flox/flox, or Apcmin/+::Msi2flox/flox mice (n=6–7 mice per group) with or without the Villin-CreER allele (el Marjou et al., 2004) were given 5 doses of tamoxifen (2mg/dose in 100ul corn oil) when they were 6 weeks old and then raised on a low protein/high fat diet (Research Diets, D12079B) for 6 months. Additional series of tamoxifen doses was given 2 and 4 months post-initiation of high fat diet to maximize recombination of floxed Msi alleles. Adenomas were scored by two independent researchers using a stereomicroscope for Apcmin/+::Msi1/2flox/flox, or scored histologically for Apcmin/+ ::Msi1flox/flox, or Apcmin/+::Msi2flox/flox mice.
For AOM-DSS, control mice were co-housed with experimental mice and injected with 100µL of 20mg/mL−1 tamoxifen every day for five days (n=6 mice per group). Two weeks after the final tamoxifen injection, all mice were given a single intraperitoneal injection of 10mgkg−1 of azoxymethane (AOM). One week later, all mice received 3% dextran sodium sulfate (DSS) in their drinking water for seven days, and then regular water for fourteen days. Two more cycles of DSS were subsequently administered, with the third and final cycle reduced to 2.5% DSS. Fecal samples were collected regularly during the experiment, and mice were observed daily and weighed weekly. Mice were sacrificed approximately 5 weeks after the last DSS cycle. Tumors were counted using a stereomicroscope, and colon tissue was subsequently fixed for histology.
Supplementary Material
Acknowledgements
We thank members of the University of Pennsylvania Functional Genomics Core, particularly Dr. Jonathan Schug, for assistance with massively parallel sequencing. We thank Drs. Anil Rustgi, John Lynch, and Kathryn Hamilton in the Division of Gastroenterology as well as members of Dr. Igor Brodsky’s lab in the Department of Pathobiology for reagents and fruitful discussions. MY is funded by a Howard Hughes international student research fellowship. ZY is funded by National Natural Science Foundation of China (NSFC, 81572614) and the National Basic Research Program of China (973 program-2011CB944103 and 2015SKLAB6- 16). CJL is funded by a fellowship from the W.W. Smith Charitable Trust, a pilot award from an American Cancer Society Institutional Research Grant, a grant from the Pennsylvania Department of Health (Health Research Formula Fund #4100054874), and R01 CA168654 from the National Cancer Institute. This work was supported in part by the NIH/NIDDK Center for Molecular Studies in Digestive and Liver Diseases (NIH-P30-DK050306) and its core facilities, and CJL was supported by the center's pilot and feasibility grant program.
Footnotes
Publisher's Disclaimer: This is a PDF file of an unedited manuscript that has been accepted for publication. As a service to our customers we are providing this early version of the manuscript. The manuscript will undergo copyediting, typesetting, and review of the resulting proof before it is published in its final citable form. Please note that during the production process errors may be discovered which could affect the content, and all legal disclaimers that apply to the journal pertain.
Author Contributions
NL, ZY, and CJL designed all experiments, executed the majority of experiments, and wrote the manuscript. MY performed histological and flow cytometric analysis. AD performed colorectal tumor modeling experiments. FL, LV, ASN, RJC, and BDR performed analysis of sequencing data. KP and AD managed animal colonies and performed luciferase assays. DW performed human patient sample expression analysis. SW performed histological analysis. SR, JT, and STJ performed analysis of transcriptome profiling data. GM performed electrophoretic mobility shift assays. MGK and CJL generated TRE-Msi1, Msi1flox/flox, and Msi2flox/flox mouse strains, TSB performed husbandry with these strains. MGK contributed to editing the manuscript. AV and PSK contributed to the conception of mTorc1-related experiments and mTorc1 pathway analysis as well as reagents. RPD contributed to the development and application of the in vivo CLIP-Seq procedures. YK performed TCGA data analysis. SS performed histological analysis and quantification.
Competing Interests
The authors have no competing interests.
References
- Ahmed D, Eide PW, Eilertsen IA, Danielsen SA, Eknaes M, Hektoen M, Lind GE, Lothe RA. Epigenetic and genetic features of 24 colon cancer cell lines. Oncogenesis. 2013;2:e71. doi: 10.1038/oncsis.2013.35. [DOI] [PMC free article] [PubMed] [Google Scholar]
- Barker N, van Es JH, Kuipers J, Kujala P, van den Born M, Cozijnsen M, Haegebarth A, Korving J, Begthel H, Peters PJ, et al. Identification of stem cells in small intestine and colon by marker gene Lgr5. Nature. 2007;449:1003–1007. doi: 10.1038/nature06196. [DOI] [PubMed] [Google Scholar]
- Battelli C, Nikopoulos GN, Mitchell JG, Verdi JM. The RNA-binding protein Musashi-1 regulates neural development through the translational repression of p21WAF-1. Mol Cell Neurosci. 2006;31:85–96. doi: 10.1016/j.mcn.2005.09.003. [DOI] [PubMed] [Google Scholar]
- Cambuli FM, Correa BR, Rezza A, Burns SC, Qiao M, Uren PJ, Kress E, Boussouar A, Galante PA, Penalva LO, et al. A Mouse Model of Targeted Musashi1 Expression in Whole Intestinal Epithelium Suggests Regulatory Roles in Cell Cycle and Stemness. Stem cells. 2015 doi: 10.1002/stem.2202. [DOI] [PMC free article] [PubMed] [Google Scholar]
- Chi SW, Zang JB, Mele A, Darnell RB. Argonaute HITS-CLIP decodes microRNA-mRNA interaction maps. Nature. 2009;460:479–486. doi: 10.1038/nature08170. [DOI] [PMC free article] [PubMed] [Google Scholar]
- Clarke RB, Anderson E, Howell A, Potten CS. Regulation of human breast epithelial stem cells. Cell Prolif. 2003;36(Suppl 1):45–58. doi: 10.1046/j.1365-2184.36.s.1.5.x. [DOI] [PMC free article] [PubMed] [Google Scholar]
- De Robertis M, Massi E, Poeta ML, Carotti S, Morini S, Cecchetelli L, Signori E, Fazio VM. The AOM/DSS murine model for the study of colon carcinogenesis: From pathways to diagnosis and therapy studies. Journal of carcinogenesis. 2011;10:9. doi: 10.4103/1477-3163.78279. [DOI] [PMC free article] [PubMed] [Google Scholar]
- de Sousa Abreu R, Sanchez-Diaz PC, Vogel C, Burns SC, Ko D, Burton TL, Vo DT, Chennasamudaram S, Le SY, Shapiro BA, et al. Genomic analyses of musashi1 downstream targets show a strong association with cancer-related processes. The Journal of biological chemistry. 2009;284:12125–12135. doi: 10.1074/jbc.M809605200. [DOI] [PMC free article] [PubMed] [Google Scholar]
- el Marjou F, Janssen KP, Chang BH, Li M, Hindie V, Chan L, Louvard D, Chambon P, Metzger D, Robine S. Tissue-specific and inducible Cremediated recombination in the gut epithelium. Genesis. 2004;39:186–193. doi: 10.1002/gene.20042. [DOI] [PubMed] [Google Scholar]
- Faller WJ, Jackson TJ, Knight JR, Ridgway RA, Jamieson T, Karim SA, Jones C, Radulescu S, Huels DJ, Myant KB, et al. mTORC1-mediated translational elongation limits intestinal tumour initiation and growth. Nature. 2015;517:497–500. doi: 10.1038/nature13896. [DOI] [PMC free article] [PubMed] [Google Scholar]
- Fujishita T, Aoki K, Lane HA, Aoki M, Taketo MM. Inhibition of the mTORC1 pathway suppresses intestinal polyp formation and reduces mortality in ApcDelta716 mice. Proceedings of the National Academy of Sciences of the United States of America. 2008;105:13544–13549. doi: 10.1073/pnas.0800041105. [DOI] [PMC free article] [PubMed] [Google Scholar]
- Goel A, Arnold CN, Niedzwiecki D, Carethers JM, Dowell JM, Wasserman L, Compton C, Mayer RJ, Bertagnolli MM, Boland CR. Frequent inactivation of PTEN by promoter hypermethylation in microsatellite instability-high sporadic colorectal cancers. Cancer Res. 2004;64:3014–3021. doi: 10.1158/0008-5472.can-2401-2. [DOI] [PubMed] [Google Scholar]
- He XC, Yin T, Grindley JC, Tian Q, Sato T, Tao WA, Dirisina R, Porter-Westpfahl KS, Hembree M, Johnson T, et al. PTEN-deficient intestinal stem cells initiate intestinal polyposis. Nat Genet. 2007;39:189–198. doi: 10.1038/ng1928. [DOI] [PMC free article] [PubMed] [Google Scholar]
- He XC, Zhang J, Tong WG, Tawfik O, Ross J, Scoville DH, Tian Q, Zeng X, He X, Wiedemann LM, et al. BMP signaling inhibits intestinal stem cell self-renewal through suppression of Wnt-beta-catenin signaling. Nat Genet. 2004;36:1117–1121. doi: 10.1038/ng1430. [DOI] [PubMed] [Google Scholar]
- Howe JR, Bair JL, Sayed MG, Anderson ME, Mitros FA, Petersen GM, Velculescu VE, Traverso G, Vogelstein B. Germline mutations of the gene encoding bone morphogenetic protein receptor 1A in juvenile polyposis. Nat Genet. 2001;28:184–187. doi: 10.1038/88919. [DOI] [PubMed] [Google Scholar]
- Imai T, Tokunaga A, Yoshida T, Hashimoto M, Mikoshiba K, Weinmaster G, Nakafuku M, Okano H. The neural RNA-binding protein Musashi1 translationally regulates mammalian numb gene expression by interacting with its mRNA. Molecular and cellular biology. 2001;21:3888–3900. doi: 10.1128/MCB.21.12.3888-3900.2001. [DOI] [PMC free article] [PubMed] [Google Scholar]
- Ito T, Kwon HY, Zimdahl B, Congdon KL, Blum J, Lento WE, Zhao C, Lagoo A, Gerrard G, Foroni L, et al. Regulation of myeloid leukaemia by the cell-fate determinant Musashi. Nature. 2010;466:765–768. doi: 10.1038/nature09171. [DOI] [PMC free article] [PubMed] [Google Scholar]
- Katz Y, Li F, Lambert NJ, Sokol ES, Tam WL, Cheng AW, Airoldi EM, Lengner CJ, Gupta PB, Yu Z, et al. Musashi proteins are post-transcriptional regulators of the epithelial-luminal cell state. eLife. 2014;3:e03915. doi: 10.7554/eLife.03915. [DOI] [PMC free article] [PubMed] [Google Scholar]
- Kawahara H, Imai T, Imataka H, Tsujimoto M, Matsumoto K, Okano H. Neural RNA-binding protein Musashi1 inhibits translation initiation by competing with eIF4G for PABP. J Cell Biol. 2008;181:639–653. doi: 10.1083/jcb.200708004. [DOI] [PMC free article] [PubMed] [Google Scholar]
- Kayahara T, Sawada M, Takaishi S, Fukui H, Seno H, Fukuzawa H, Suzuki K, Hiai H, Kageyama R, Okano H, et al. Candidate markers for stem and early progenitor cells, Musashi-1 and Hes1, are expressed in crypt base columnar cells of mouse small intestine. FEBS Lett. 2003;535:131–135. doi: 10.1016/s0014-5793(02)03896-6. [DOI] [PubMed] [Google Scholar]
- Kharas MG, Lengner CJ, Al-Shahrour F, Bullinger L, Ball B, Zaidi S, Morgan K, Tam W, Paktinat M, Okabe R, et al. Musashi-2 regulates normal hematopoiesis and promotes aggressive myeloid leukemia. Nature medicine. 2010;16:903–908. doi: 10.1038/nm.2187. [DOI] [PMC free article] [PubMed] [Google Scholar]
Associated Data
This section collects any data citations, data availability statements, or supplementary materials included in this article.