

Abstract
Single-molecule fluorescence super-resolution imaging and tracking provide nanometer-scale information about subcellular protein positions and dynamics. These single-molecule imaging experiments can be very powerful, but they are best suited to high-copy number proteins where many measurements can be made sequentially in each cell. We describe artifacts associated with the challenge of imaging a protein expressed in only a few copies per cell. We image live Bacillus subtilis in a fluorescence microscope, and demonstrate that under standard single-molecule imaging conditions, unlabeled B. subtilis cells display punctate red fluorescent spots indistinguishable from the few PAmCherry fluorescent protein single molecules under investigation. All Bacillus species investigated were strongly affected by this artifact, whereas we did not find a significant number of these background sources in two other species we investigated, Enterococcus faecalis and Escherichia coli. With single-molecule resolution, we characterize the number, spatial distribution, and intensities of these impurity spots.
Keywords: fluorescence, imaging agents, single-molecule studies, super-resolution imaging, localization microscopy
Graphical abstract
Single-molecule-like fluorescent background signal is reported in Bacillus subtilis cells, and the density and fluorescence intensity of these spots are quantified in several Bacillus species and other Gram-negative and Gram-positive organisms.
Fluorescence microscopy has provided invaluable aid to cell biology. In recent years, the development of single-molecule fluorescence (SMF) microscopy has allowed scientists to visualize the localization, motion, and interactions of individual proteins with unprecedented resolution.[1] This technique is particularly beneficial for studies of bacterial cell biology, as bacteria commonly have sizes similar to the diffraction limit of light.[2], [3] Imaging single molecules requires that fluorescently labeled molecules are separated either in space (by at least the Abbe diffraction limit, several hundred nanometers) or in time. Because the localization precision scales with the number of photons collected, brighter probes are preferable and the signal to noise ratio is very important. Thus, in bacteria, the best single-molecule probes are ones that emit in the red, as there is less cellular autofluorescence and therefore better signal to noise in this region of the spectrum.[4] Campbell et al. evolved mRFP1, the first red monomeric protein, a dozen years ago,[5] and other red fluorescent proteins have since been evolved to address the needs of microscopy. These include the photoactivatable protein PAmCherry,[6] which can be photoactivated with a violet laser for use in single-molecule tracking experiments.
Bacillus subtilis, a Gram-positive soil bacterium, has been a particularly popular model organism for a wide range of fluorescence-based microscopy studies characterizing the subcellular localization of proteins. In addition, B. subtilis has become an important model organism in the DNA repair field, where significant differences have been found between Gram-positive species and the more well-studied Gram-negative bacteria like Escherichia coli.[7]–[9] Numerous studies of B. subtilis DNA repair using conventional fluorescence microscopy have revealed exciting homologies with the “repair centers” that fix DNA breaks in eukaryotic cells.[10]–[12] More recently, several groups have used super-resolution and single-molecule fluorescence microscopy to examine intracellular dynamics and localization within this organism.[13]–[19] The traditional methods of single-molecule tracking and super-resolution imaging in living bacteria[18]–[26] can be extended to B. subtilis, and complementing these well-developed methods with biochemical, genetic, and genomic investigations has already led to important discoveries about DNA mismatch detection and mismatch repair (MMR) in B. subtilis.[8], [19] Overall, we have been finding that the proteins that engage in complex DNA repair behaviors are much more dynamic than conventional models would suggest; this motivates further single-molecule investigations of other DNA replication and repair mechanisms.
To extend our single-molecule investigations of DNA repair in B. subtilis, we intended to study the DNA repair protein RecO, which recruits RecA to single-stranded DNA regions for recombinational repair.[7], [27]–[31] RecO is known to interact with the C-terminal tail of the single-stranded DNA binding protein, SSB,[32] and to recruit RecA to SSB-coated DNA.[33] We planned to measure the co-localization of RecO with both SSB and RecA in the presence and absence of DNA damage, and expected that RecO diffusion would slow in the presence of damage.[34] We had not previously attempted to image a protein with such a low copy number, and found that the low number of proteins of interest per cell presented challenges that had not affected previous studies of higher copy proteins. In particular, we detected single molecules in living B. subtilis cells, but we determined that these fluorescent signals were impurities, not fluorescently labeled RecO. Here, we characterize the intensity and frequency of these background sources with single-molecule sensitivity. Overall, we found that the fluorescent impurities were membrane-localized, occurred in other Bacillus species but not in all Gram-positive organisms, and had similar fluorescence intensities to single PAmCherry molecules. In this Communication, we identify the challenges that must be considered when attempting to perform high sensitivity single-molecule fluorescence imaging of low copy number proteins in living Bacillus sp. cells.
We constructed a B. subtilis strain expressing a PAmCherry-RecO fusion at the native locus as the sole source of RecO. We assayed PAmCherry-RecO functionality by performing growth curves of wild type, ΔrecO, and PAmCherry-RecO strains. While growth was significantly slowed by the deletion of RecO, we observed no growth defect in the strain carrying the PAmCherry-RecO construct. The RecO protein has been reported to be present in extremely low concentrations—on the order of one protein per cell—in E. coli,[35] so we were concerned that even moderate levels of overexpression from a plasmid could produce localization artifacts. In contrast, our previous single-molecule imaging experiments in B. subtilis had focused on much more highly expressed proteins like the mismatch repair protein MutS.[19] After photoactivation with a 405-nm laser, fluorescence from PAmCherry molecules can be imaged with 561-nm laser excitation, and the PAmCherry fluorescence emission peak of 595 nm[6] falls in a range of reasonably low B. subtilis autofluorescence. And indeed, we were able to easily image, localize, and track MutS-PAmCherry fusions expressed from the MutS native locus with a copy number greater than ~100 proteins per cell.[19], [36]
While performing imaging controls using wild type B. subtilis strain PY79, which does not include any introduced extrinsic fluorescent markers, we observed that fluorescence excitation with a 561-nm laser produced mobile spots that registered in our image analysis routines as single fluorescent molecules (Figure 1, Movie S1). The motion of these spots (often moving around the cell perimeter) suggested that whatever was producing the signal might be membrane-associated.[37] We thus imaged the cells through a cylindrical lens to obtain 3D position information with subcellular resolution based on astigmatism,[38], [39] and found that many of the spots did indeed co-localize with the cell membrane (Figure 2, Movie S2). In principle, this localization of the spots to the cell perimeter could allow location-based filtering. For instance, if one wants to study a cytoplasmic protein near the cell center, any membrane-associated spots could be removed from the analysis. However, in practice, the precision of the 3D measurement is not here sufficient to fully filter out the background spots while still keeping much of the desired signal. Furthermore, using such a location-based filter to remove membrane-localized signals would be incompatible with studies of proteins that associate permanently or transiently with the cell envelope.
Figure 1.
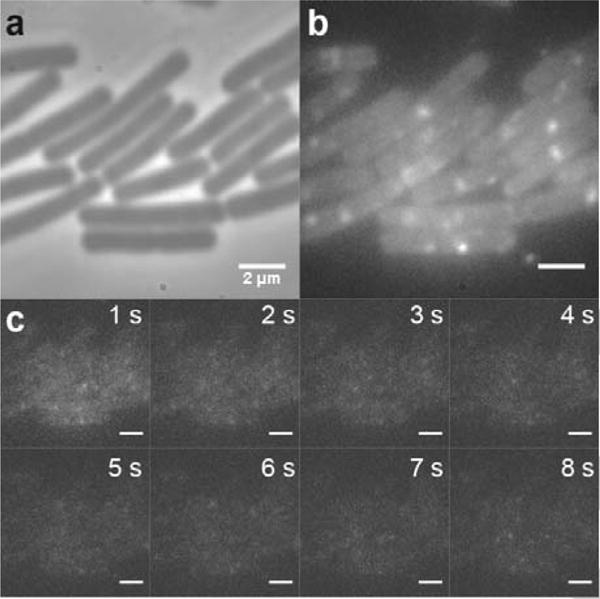
Unlabeled B. subtilis PY79 cells display both diffuse autofluorescence and punctate single-molecule-like spots under 561-nm laser excitation. PY79 is a wild type strain with no introduced fluorescent labels. (a) Phase contrast image of several PY79 cells. (b) Sum of multiple fluorescence imaging frames (a total of 8 seconds of Movie S1). The cells are excited with a 561-nm laser (power density: 1.9 μW·μm−2). (c) Individual frames from the movie in (b), each with an integration time of 40 ms. Scale bars: 2 μm.
Figure 2.
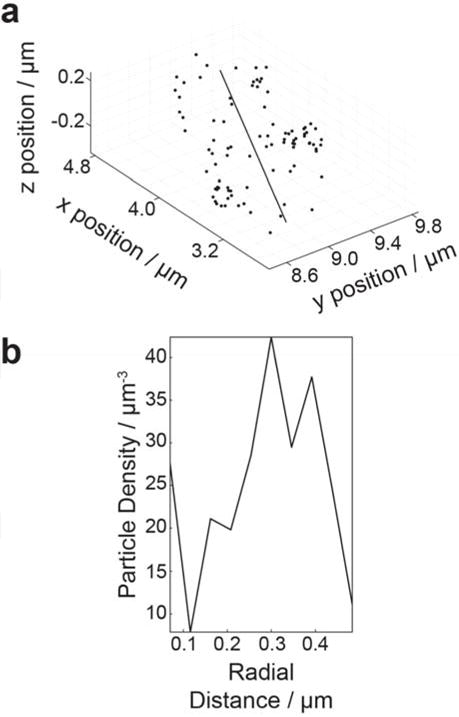
Fluorescent impurities accumulate at the B. subtilis PY79 cell membrane. PY79 is a wild type strain with no introduced fluorescent labels. (a) Cells were imaged using a cylindrical lens to determine of the z position (depth) of the localized fluorescent impurities in addition to the in-plane (x–y) position (Movie S2). Each localization in a single cell is plotted in x, y, and z as a dot and the center line of the cell is indicated. (b) The density of localizations in the cell in (a) as a function of the radial distance from the center line of the cell. Particle density is maximum at 0.3 μm; the radius of a typical B. subtilis cell is 0.3 – 0.4 μm.
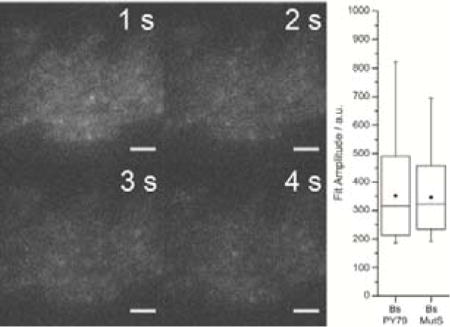
To investigate whether filtering on intensity rather than position would better differentiate between PAmCherry and the background spots, we quantified the brightness of the fluorescent impurities and compared this signal strength to the intensities of purified PAmCherry and PAmCherry-labeled proteins in cells under the same imaging conditions. For each sample, our single-molecule imaging algorithm identified isolated punctate fluorescent spots, and the intensity of each spot is defined as the Gaussian fit amplitude of that fluorescent image (see Experimental Section). We found that the intensities of purified single molecules of PAmCherry were statistically indistinguishable from the intensities of the single-molecule-like spots in unlabeled B. subtilis PY79 (compare the Bs PY79 and PAmC data sets in Figure 3). We compared the intensities of the spurious fluorescent points detected in the wild type PY79 cells to the intensities of intracellular PAmCherry in strain JWS121, a PY79-derived B. subtilis strain that expresses a fusion of PAmCherry to the DNA mismatch repair protein MutS.[19] Initially, the photoactivatable PAmCherry tag is in a non-emissive state and these PAmCherry-MutS cells look the same as wild type PY79 in the fluorescence microscope. However, PAmCherry in JWS121 cells can then be activated with a 406 nm laser pulse. MutS has a copy number of more than ~100 proteins per cell; therefore when we image after photoactivation, most of the fluorescent signal in this strain comes from PAmCherry. We found that the fluorescent impurities in the wild type PY79 had the same fluorescence intensity as individual photoactivated molecules of PAmCherry fusions in the cell (compare Bs PY79 and Bs MutS data sets in Figure 3), although many more fluorescent spots were localized after activation with a 406 nm laser in Bs MutS than in Bs PY79. Furthermore, as we developed our protocol, we investigated several different growth media and found that the fluorescent impurities were still present whether the cells were grown in rich medium (LB), minimal medium (S750), or an intermediate medium (CH [40]). The background was also observed in PY79 cells grown up from stocks from other sources.
Figure 3.
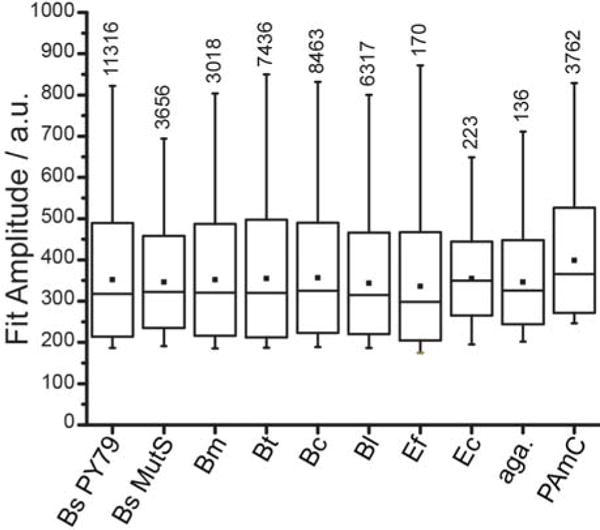
Fluorescent impurities have a similar brightness in multiple organisms. In cells excited with 561-nm light at 1.9 μW·μm−2, single-molecule intensities are determined from the amplitude of the Gaussian fit to the fluorescent image of each molecule. Horizontal lines indicate the median values, filled squares indicated the mean values, box edges indicate the standard deviation on the mean, and whiskers indicate the 1st and 99th percentiles. Bs PY79 is B. subtilis PY79, a wild type strain lacking any introduced fluorescent labels. Bs MutS is B. subtilis PY79 expressing MutS-PAmCherry fusions. Bm, Bt, Bc, Bl, Ef, and Ec are B. megaterium, B. thuringiensis, B. cereus, B. licheniformis, E. faecalis, and E. coli, respectively. Aga. is a bare agarose pad made with filtered S750 medium. PAmC is purified PAmCherry on an agarose pad. All bacterial samples were imaged on at least two separate days with the same laser intensity. All single-molecule detection and characterization was performed using the same fitting parameters. Numbers above each box indicated the number of measurements obtained from that sample.
Though this source of background has been casually discussed over the years by researchers culturing and imaging Bacillus cells in different labs with different stocks and different water supplies, we wondered whether the lack of prior formal reports of this phenomenon was due in part to the relative dearth of single-molecule studies of Gram-positive bacteria in the literature. We obtained a number of other wild type Bacillus species (B. cereus, B. licheniformis, B. megaterium, and B. thuringiensis) from the Bacillus Genetic Stock Center and observed similar single-molecule-like spots in those unlabeled cells (Figure 3, Movies S3–S8). The fluorescent impurities were still present in the unlabeled Gram-positive organism Enterococcus faecalis and even in unlabeled cells of the Gram negative E. coli (Figure 3). However, the abundance of the fluorescent impurities was significantly reduced in unlabeled E. faecalis and E. coli cells relative to cells from the Bacillus species (Figure 4). This difference in numbers of spurious single-molecule localization persisted even after correcting for differences in cell area (Figure 4). We conclude, then, that under 561-nm laser excitation in Bacillus cells, low copy number red fluorescent protein-labeled molecules are indistinguishable from spurious fluorescent spots.
Figure 4.
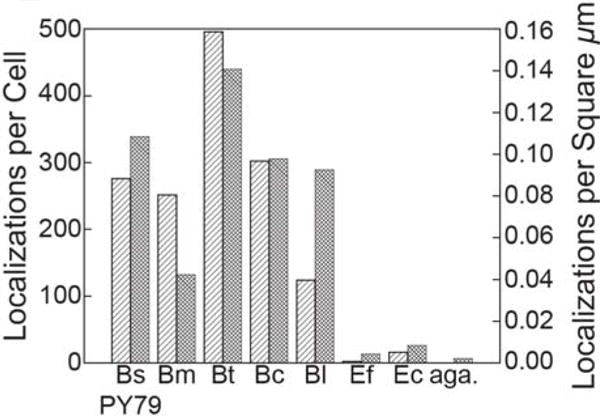
Fluorescent impurities are far more abundant in Bacillus species than in other bacteria investigated. In cells excited with 561-nm light at 1.9 μW·μm−2, the number of detected spots in each movie was divided by the number of cells analyzed in that movie to determine the number of localizations per cell (
 ) or by the total area of all cells analyzed in that movie to obtain the number of localizations per cell area (
 ). The agarose sample was a bare agarose pad made with filtered S750 medium. Bm, Bt, Bc, Bl, Ef, and Ec are B. megaterium, B. thuringiensis, B. cereus, B. licheniformis, E. faecalis, and E. coli, respectively. Aga. is a bare agarose pad made with filtered S750 medium.
We initially chose to study RecO due to its critical role in loading RecA during recombinational repair.[7] We also found it interesting that such a vital function would be performed by a protein that has been shown in E. coli to have an extremely low copy number, on the order of one protein per cell.[35] However, the single-molecule-like background signal in B. subtilis makes it extremely difficult to study low-copy proteins like RecO when using red fluorescent protein labels and 561-nm laser illumination. On the other hand, the fluorescence image of an unlabeled B. subtilis PY79 cell excited at 488 nm is shown in Figure 5b; this image demonstrates the diffuse autofluorescent cell background, which is usually much more problematic for blue/green fluorescent imaging than for imaging at redder wavelengths. Still, we hypothesized that here, single RecO molecules would best be observed with a greener label because the spurious background signals precluded our investigation of single PAmCherry-RecO molecules in B. subtilis. We therefore set out to image in living B. subtilis cells fusions of the yellow fluorescent proteins mCitrine and YFP (both of which have a fluorescence emission maximum of ~527 nm) to RecO.
Figure 5.
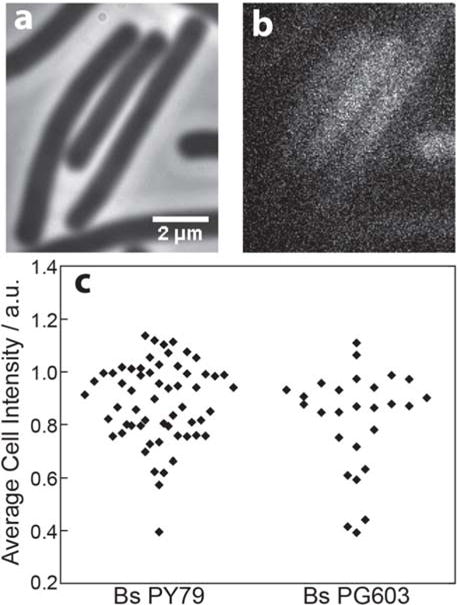
Yellow fluorescent protein fusions to RecO under native control do not give rise to a detectable signal above background autofluorescence. 20 – 50 cells of each type were excited with 488-nm light at 0.25 μW·μm−2, and imaged for 2 minutes (3000 imaging frames). Representative phase contrast (a) and fluorescence (b) images of unlabeled PY79 cells are shown. (c) The average fluorescence intensity of each cell is plotted. Bs PY79 is B. subtilis PY79, a wild type strain lacking any introduced fluorescent labels. Bs PG603 is B. subtilis PY79 with a RecO-YFP fusion at the native locus. Average cell intensity was determined from movies taken on the same day at the same laser power.
We constructed B. subtilis strain ERB81, which contains a RecO-mCitrine fusion under the xylose promoter at the AmyE locus in addition to the native copy of RecO. These cells were prepared as described above and then incubated in S750 with varying concentrations of xylose for ~6 hours at 30°C to induce RecO-mCitrine expression. Unfortunately, while xylose concentrations of 0.11% or above led to the formation of foci of many RecO-mCitrine molecules, we were unable to identify a xylose concentration for which single molecules were visible above the autofluorescent background. This observation indicates that either there are only a few copies of RecO-mCitrine which do not form foci and which are not individually brighter than the cell background, or else that the RecO-mCitrine molecules are diffusing so rapidly that their emission is also diffuse. To investigate the latter possibility, we compared the average fluorescence intensity per cell of unlabeled PY79 cells to B. subtilis strain PG603, which expresses a RecO-YFP fusion under native control at the native locus (a kind gift from Peter Graumann[10]). Unfortunately, the RecO-YFP also did not significantly increase cellular fluorescence beyond the background autofluorescence level (Figure 5c).
What does this mean for single-molecule fluorescence microscopy in B. subtilis and other bacteria? Proteins that form foci can be characterized by conventional microscopy,[10]–[12], [31], [36], [41] because the spurious, short-lived background signals discussed here are washed out at longer exposure times. Additionally, we have previously been successful at imaging higher-copy number proteins with high resolution,[19] as the amount of “real” signal in such experiments is sufficient to drown out the less frequent signals from the fluorescent impurities. The spurious background signals only become an issue in this new regime of low copy number proteins for which merely one to a few “real” molecules are expected per cell; in this previously unexplored regime, the signal from the impurities drowns out the real signal. Therefore, if single-molecule dynamics are required, overexpressing the protein can circumvent the background issue. Functionality assays can provide some assurance that the behavior of the overexpressed protein is representative of its true behavior.
The identity of these fluorescent impurities is still unclear. Similar fluorescent impurities were observed when exciting with 515 nm light, though not with 488 nm light. Bacterial cell walls can bind metal ions, and both B. subtilis and B. licheniformis accumulate significantly more metals than E. coli.[42], [43] We did observe that the fluorescent impurities were reduced—though not eliminated—upon increasing the amount of time that the glass slide and coverslips were plasma etched before use (see Experimental Section). This cleaning suggests that some environmental contaminant is being taken up and concentrated inside the bacteria. Interestingly, increasing the cleaning time of the coverslips used in the actual imaging had only a minimal effect, whereas thoroughly cleaning the slides and coverslips used to make the agarose pads proved essential for reducing the background signal occurrences. Still, Figures 3 and 4 show that imaging PAmCherry-RecO in B. subtilis was ultimately unsuccessful since it was not possible to distinguish between the extremely low number of PAmCherry-RecO molecules and the small number of detected background signals. In these cells, where we expect only 0–2 molecules of RecO per cell,[35] even a single false background signal per cell will unacceptably alter the data. Overall, low-copy number proteins in B. subtilis and related Bacillus species are ill-suited for fluorescence imaging based on current fluorescent protein fusions. However, small-molecule dyes that are brighter than the fluorescent impurities may allow single-molecule imaging even of low-copy proteins. A number of relatively new techniques, such as the HaloTag technology[44] or the incorporation of unnatural amino acids,[45]–[47] allow proteins to be tagged with brighter organic fluorescent dyes with the labeling specificity of genetic encoding, and these techniques may prove to be the best solution to the background problem in B. subtilis. Additionally, Lee et al. have reported a small molecule that can be enzymatically converted inside B. subtilis to a bright, red-emitting dye.[48] Our experience is an example of the difficulties that can arise when applying exciting new techniques such as single-molecule imaging to novel systems. Collaboration between chemists, biologists, and microscopists will be necessary to overcome these barriers and realize the full promise of single-molecule tracking in bacteria, particularly with regards to investigations of low-copy number proteins.
Experimental Section
Bacterial strains and growth conditions
Bacillus subtilis PY79, Bacillus thuringiensis HD735, Bacillus licheniformis ATCC #14580, Bacillus cereus ATCC #10987, and Bacillus megaterium QM B1551 were obtained from the Bacillus Genetic Stock Center (Columbus, Ohio). B. subtilis PG603 was a kind gift from Peter Graumann (Universität Marburg). Enterococcus faecalis V583 was a kind gift from Kevin Wood (University of Michigan). Escherichia coli MG1655 CGSC #7740 was obtained from the Coli Genetic Stock Center (Yale University, New Haven, Connecticut). B. subtilis JWS121 contains a fusion of MutS to PAmCherry at the native MutS locus. Cells were struck out on 1.5% agar/LB plates and incubated for ~16 h at 37°C. Single colonies were transferred into liquid LB and incubated for ~16 h at 37°C with shaking. Cultures were diluted 1:100 into fresh LB and incubated at 37°C with shaking to an OD600 of 0.5 – 0.8. 250 μL of culture was centrifuged for 5 minutes at 5000 × g. The supernatant was removed and the cell pellet was resuspended in 250 μL of filter-sterilized S750 minimal medium.[49] The centrifugation was repeated, the supernatant removed, and the pellet again resuspended in 250 μL of fresh S750. B. subtilis ERB81 cells containing the RecO-mCitrine fusion under the xylose promoter at the amyE locus in B. subtilis PY79 were incubated in 0.11% xylose for ~6 h at 30°C. 1.5 μL of sample was spotted onto a pad of 2% agarose in S750, and the pad was inverted onto a plasma-cleaned coverslip for imaging. The bacterial strains used in this study are summarized in Table S1.
Sample preparation and substrate cleaning for microscopy
Agarose pads were prepared by pouring molten 2% agarose in S750 minimal medium onto a glass slide and laying a glass coverslip on top of the agarose to create a flat surface after the agarose hardened. The slides and coverslips used for making the agarose pads were cleaned in an oxygen plasma etcher (PE-50, Plasma Etch Inc.) at 200 mTorr for 10 minutes. Increasing this cleaning time to 20 minutes slightly improved, but did not fully remove, the fluorescent spots; further increases in cleaning time had no significant effect on the fluorescent spots. Once the agarose solidified, the top coverslips were removed. A small volume (typically 1.5 μL) of cell suspension was pipetted onto the surface of the agarose and the liquid was allowed to dry into the pad. The pad was then inverted on to a new glass coverslip (Fisher Scientific Fisherfinest® Premium Cover Glass #12-548-B); this coverslip was also plasma cleaned for 10 minutes.
PAmCherry purification
PAmCherry was purified from E. coli as previously described.[50] Briefly, cells of E. coli DH5α containing the plasmid pBAD/HisB-PAmCherry1 (a gift from Vladislav Verkhusha [Addgene plasmid #31931][6]) were grown to mid-log phase, and protein expression was induced with 0.2% arabinose. Twenty hours after induction, cells were harvested by centrifugation and lysed using B-PER (ThermoScientific). His-tagged PAmCherry was purified using a spin column (HisPur™ Ni-NTA, ThermoScientific).
Fluorescence microscopy
Cells were imaged in an Olympus IX71 inverted microscope with a 1.40-NA 100× phase contrast oil immersion objective as previously described.[20], [26] Images were captured on a Photometrics Evolve EMCCD with a 40 ms integration time. Samples were excited with a 561-nm laser (Coherent Sapphire 561-50) with a power of 1.9 μW·μm−2. For Bs PY79 MutS-PAmCherry, PAmCherry was activated by cycles of exposure to a 406 nm laser (Coherent Cube 406) with a power of 0.15 μW·μm−2 for 200 ms. YFP-RecO and mCitrine-RecO fusions were imaged with a 488-nm laser (Coherent Sapphire 488-50) at 0.25 μW·μm−2. For 3D imaging, a cylindrical lens with 1000 mm focal distance (ThorLabs LJ1516RM-A) was placed in the optical path between the microscope and the camera. For each 3D experiment, a z-calibration curve was generated using a sample of immobilized 0.1-μm TetraSpeck™ microspheres (ThermoFisher Scientific) and collecting data at a series of known z-positions with a piezo stage (Physik Instrumente) controlled by PIMicroMove software as previously described.[38]
Single-molecule data analysis
A bandpass filter was applied to the fluorescent images to produce initial guesses of single-molecule locations. A 2D Gaussian fit was then applied to determine the center of each signal. For 3D imaging, the cylindrical lens in the microscope emission pathway creates an astigmatism that identifies the 3D position, as previously described.[38], [39] The astigmatic point spread function was fit with an asymmetric Gaussian function:
where Ibg is the background intensity, A is the amplitude of the emission, and (x0, y0) is the center position of the molecule. The z-localization was then determined from the calibration curve for that specific experiment.
Supplementary Material
Acknowledgments
E. faecalis strain V583 was a kind gift from Kevin Wood’s laboratory. B. subtilis strain PG603 was a kind gift from Peter Graumann’s laboratory. Ethan Garner and members of his laboratory provided helpful discussion. H. Tuson acknowledges funding from National Science Foundation grant number DB-1306434. J.S.B. acknowledges funding from a Burroughs Wellcome Fund Career Award at the Scientific Interface. L.A.S. acknowledges funding from NIH grant R01 GM107312. We thank Dr. Jeremy Schroeder for whole genome DNA sequence analysis.
Footnotes
Supporting information for this article is given via a link at the end of the document.
References
- 1.Tuson HH, Biteen JS. Anal Chem. 2015;87:42–63. doi: 10.1021/ac5041346. [DOI] [PubMed] [Google Scholar]
- 2.Gahlmann A, Moerner WE. Nat Rev Microbiol. 2014;12:9–22. doi: 10.1038/nrmicro3154. [DOI] [PMC free article] [PubMed] [Google Scholar]
- 3.Xie XS, Choi PJ, Li GW, et al. Annu Rev Biophys. 2008;37:417–444. doi: 10.1146/annurev.biophys.37.092607.174640. [DOI] [PubMed] [Google Scholar]
- 4.Shaner NC, Campbell RE, Steinbach PA, et al. Nat Biotechnol. 2004;22:1567–72. doi: 10.1038/nbt1037. [DOI] [PubMed] [Google Scholar]
- 5.Campbell RE, Tour O, Palmer AE, et al. Proc Natl Acad Sci U S A. 2002;99:7877–82. doi: 10.1073/pnas.082243699. [DOI] [PMC free article] [PubMed] [Google Scholar]
- 6.Subach FV, Patterson GH, Manley S, et al. Nat Methods. 2009;6:153–159. doi: 10.1038/nmeth.1298. [DOI] [PMC free article] [PubMed] [Google Scholar]
- 7.Lenhart JS, Schroeder JW, Walsh BW, et al. Microbiol Mol Biol Rev. 2012;76:530–564. doi: 10.1128/MMBR.05020-11. [DOI] [PMC free article] [PubMed] [Google Scholar]
- 8.Lenhart JS, Pillon MC, Guarne A, et al. Res Microbiol. 2016;167:4–12. doi: 10.1016/j.resmic.2015.08.006. [DOI] [PubMed] [Google Scholar]
- 9.Rudner DZ, Losick R. Cold Spring Harb Perspect Biol. 2010;2:a000307–a000307. doi: 10.1101/cshperspect.a000307. [DOI] [PMC free article] [PubMed] [Google Scholar]
- 10.Kidane D, Sanchez H, Alonso JC, et al. Mol Microbiol. 2004;52:1627–1639. doi: 10.1111/j.1365-2958.2004.04102.x. [DOI] [PubMed] [Google Scholar]
- 11.Kidane D, Graumann PL. J Cell Biol. 2005;170:357–366. doi: 10.1083/jcb.200412090. [DOI] [PMC free article] [PubMed] [Google Scholar]
- 12.Sanchez H, Kidane D, Cozar MC, et al. J Bacteriol. 2006;188:353–360. doi: 10.1128/JB.188.2.353-360.2006. [DOI] [PMC free article] [PubMed] [Google Scholar]
- 13.Soufo D, Wicker K, Heintzmann R, et al. Biophys J. 2013;105:1171–1181. doi: 10.1016/j.bpj.2013.07.038. [DOI] [PMC free article] [PubMed] [Google Scholar]
- 14.Strauss MP, Liew ATF, Turnbull L, et al. PLoS Biol. 2012;10 doi: 10.1371/journal.pbio.1001389. [DOI] [PMC free article] [PubMed] [Google Scholar]
- 15.Jennings PC, Cox GC, Monahan LG, et al. Micron. 2011;42:336–341. doi: 10.1016/j.micron.2010.09.003. [DOI] [PubMed] [Google Scholar]
- 16.Yen Shin J, Lopez-Garrido J, Lee S-H, et al. Elife. 2015;4:1–22. doi: 10.7554/eLife.06474. [DOI] [PMC free article] [PubMed] [Google Scholar]
- 17.Fleming TC, Shin JY, Lee SH, et al. Genes Dev. 2010;24:1160–1172. doi: 10.1101/gad.1925210. [DOI] [PMC free article] [PubMed] [Google Scholar]
- 18.Garner EC, Bernard R, Wang W, et al. Science. 2011;333:222–225. doi: 10.1126/science.1203285. [DOI] [PMC free article] [PubMed] [Google Scholar]
- 19.Liao Y, Schroeder JW, Gao B, et al. Proc Natl Acad Sci U S A. 2015;112:E6898–E6906. doi: 10.1073/pnas.1507386112. [DOI] [PMC free article] [PubMed] [Google Scholar]
- 20.Karunatilaka KS, Cameron EA, Martens EC, et al. MBio. 2014;5:e02172–14. doi: 10.1128/mBio.02172-14. [DOI] [PMC free article] [PubMed] [Google Scholar]
- 21.Sanamrad A, Persson F, Lundius EG, et al. Proc Natl Acad Sci U S A. 2014;111:11413–11418. doi: 10.1073/pnas.1411558111. [DOI] [PMC free article] [PubMed] [Google Scholar]
- 22.Hammar P, Walldén M, Fange D, et al. Nat Genet. 2014;46:405–8. doi: 10.1038/ng.2905. [DOI] [PMC free article] [PubMed] [Google Scholar]
- 23.Buss J, Coltharp C, Huang T, et al. Mol Microbiol. 2013;89:1099–1120. doi: 10.1111/mmi.12331. [DOI] [PMC free article] [PubMed] [Google Scholar]
- 24.Hensel Z, Weng X, Lagda AC, et al. PLoS Biol. 2013;11:e1001591. doi: 10.1371/journal.pbio.1001591. [DOI] [PMC free article] [PubMed] [Google Scholar]
- 25.Wang S, Moffitt JR, Dempsey GT, et al. Proc Natl Acad Sci U S A. 2014;111:8452–7. doi: 10.1073/pnas.1406593111. [DOI] [PMC free article] [PubMed] [Google Scholar]
- 26.Haas BL, Matson JS, Dirita VJ, et al. Mol Microbiol. 2014;96:4–13. doi: 10.1111/mmi.12834. [DOI] [PMC free article] [PubMed] [Google Scholar]
- 27.Alonso JC, Cardenas PP, Sanchez H, et al. DNA Repair (Amst) 2013;12:162–176. doi: 10.1016/j.dnarep.2012.12.005. [DOI] [PubMed] [Google Scholar]
- 28.Alonso JC, Tailor RH, Lüder G. J Bacteriol. 1988;170:3001–3007. doi: 10.1128/jb.170.7.3001-3007.1988. [DOI] [PMC free article] [PubMed] [Google Scholar]
- 29.Fernández S, Kobayashi Y, Ogasawara N, et al. Mol Gen Genet. 1999;261:567–573. doi: 10.1007/s004380051002. [DOI] [PubMed] [Google Scholar]
- 30.Michel B, Boubakri H, Baharoglu Z, et al. DNA Repair (Amst) 2007;6:967–980. doi: 10.1016/j.dnarep.2007.02.016. [DOI] [PubMed] [Google Scholar]
- 31.Lenhart JS, Brandes ER, Schroeder JW, et al. J Bacteriol. 2014;196:2851–2860. doi: 10.1128/JB.01494-14. [DOI] [PMC free article] [PubMed] [Google Scholar]
- 32.Ryzhikov M, Koroleva O, Postnov D, et al. Nucleic Acids Res. 2011;39:6305–6314. doi: 10.1093/nar/gkr199. [DOI] [PMC free article] [PubMed] [Google Scholar]
- 33.Manfredi C, Carrasco B, Ayora S, et al. J Biol Chem. 2008;283:24837–24847. doi: 10.1074/jbc.M802002200. [DOI] [PMC free article] [PubMed] [Google Scholar]
- 34.Costes A, Lecointe F, McGovern S, et al. PLoS Genet. 2010;6:1–15. doi: 10.1371/journal.pgen.1001238. [DOI] [PMC free article] [PubMed] [Google Scholar]
- 35.Taniguchi Y, Choi PJ, Li GW, et al. Science. 2011;329:533–538. doi: 10.1126/science.1188308. [DOI] [PMC free article] [PubMed] [Google Scholar]
- 36.Lenhart JS, Pillon MC, Guarné A, et al. Mol Microbiol. 2013;90:680–698. doi: 10.1111/mmi.12389. [DOI] [PubMed] [Google Scholar]
- 37.Haas BL, Matson JS, DiRita VJ, et al. Molecules. 2014;19:12116–12149. doi: 10.3390/molecules190812116. [DOI] [PMC free article] [PubMed] [Google Scholar]
- 38.Biteen JS, Goley ED, Shapiro L, et al. Chem Phys Chem. 2012;13:1007–1012. doi: 10.1002/cphc.201100686. [DOI] [PMC free article] [PubMed] [Google Scholar]
- 39.Huang B, Wang W, Bates M, et al. Science. 2008;319:810–813. doi: 10.1126/science.1153529. [DOI] [PMC free article] [PubMed] [Google Scholar]
- 40.Sterlini JM, Mandelstam J. Biochem J. 1969;113:29–37. doi: 10.1042/bj1130029. [DOI] [PMC free article] [PubMed] [Google Scholar]
- 41.Simmons LA, Davies BW, Grossman AD, et al. Mol Cell. 2008;29:291–301. doi: 10.1016/j.molcel.2007.10.036. [DOI] [PMC free article] [PubMed] [Google Scholar]
- 42.Beveridge TJ, Fyfe WS. Can J Earth Sci. 1985;22:1893–1898. [Google Scholar]
- 43.Helmann JD. J Biol Chem. 2014;289:28112–28120. doi: 10.1074/jbc.R114.587071. [DOI] [PMC free article] [PubMed] [Google Scholar]
- 44.Los GV, Encell LP, McDougall MG, et al. Acs Chem Biol. 2008;3:373–382. doi: 10.1021/cb800025k. [DOI] [PubMed] [Google Scholar]
- 45.Charbon G, Brustad E, Scott KA, et al. Chem Bio Chem. 2011;12:1818–1821. doi: 10.1002/cbic.201100282. [DOI] [PMC free article] [PubMed] [Google Scholar]
- 46.Charbon G, Wang J, Brustad E, et al. Bioorganic Med Chem Lett. 2011;21:6067–6070. doi: 10.1016/j.bmcl.2011.08.057. [DOI] [PMC free article] [PubMed] [Google Scholar]
- 47.Borrmann A, Milles S, Plass T, et al. Chem Bio Chem. 2012;13:2094–2099. doi: 10.1002/cbic.201200407. [DOI] [PubMed] [Google Scholar]
- 48.Lee MK, Williams J, Twieg RJ, et al. Chem Sci. 2013;42:220–225. doi: 10.1039/C2SC21074F. [DOI] [PMC free article] [PubMed] [Google Scholar]
- 49.Dupes NM, Walsh BW, Klocko AD, et al. J Bacteriol. 2010;192:3452–63. doi: 10.1128/JB.01435-09. [DOI] [PMC free article] [PubMed] [Google Scholar]
- 50.Donehue JE, Wertz E, Talicska CN, et al. J Phys Chem C. 2014;118:15027–15035. [Google Scholar]
Associated Data
This section collects any data citations, data availability statements, or supplementary materials included in this article.