Abstract
Fat character is an important index in duck culture that linked to local flavor, feed cost and fat intake for costumers. Since the regulation networks in duck lipid metabolism had not been reported very clearly, we aimed to explore the potential miRNA-mRNA pairs and their regulatory roles in duck lipid metabolism. Here, Cherry-Valley ducks were selected and treated with/without 5% oil added in feed for 2 weeks, and then fat content determination was performed on. The data showed that the fat contents and the fatty acid ratios of C17:1 and C18:2 were up-regulated in livers of oil-added ducks, while the C12:0 ratio was down-regulated. Then 21 differential miRNAs, including 10 novel miRNAs, were obtain from the livers by sequencing, and 73 target genes involved in lipid metabolic processes of these miRNAs were found, which constituted 316 miRNA-mRNA pairs. Two miRNA-mRNA pairs including one novel miRNA and one known miRNA, N-miR-16020-FASN and gga-miR-144-ELOVL6, were selected to validate the miRNA-mRNA negative relation. And the results showed that N-mir-16020 and gga-miR-144 could respectively bind the 3′-UTRs of FASN and ELOVL6 to control their expressions. This study provides new sights and useful information for future research on regulation network in duck lipid metabolism.
MicroRNAs (miRNA), about 18–25 nucleotides in length, are small noncoding RNAs which possess a regulatory role in mRNA translation. Over 30 years ago, the first miRNA was discovered in the nematode Caenorhabditis elegans with the identification of the developmental regulator lin-41, which is originally considered to be a conventional protein coding gene. While the Ruvkun and Ambros labs startlingly discovered that lin-4 encoded for a 22-nucleotide-long regulatory RNA instead for a protein, which could base pair with the mRNA of lin-14, another gene in the C. elegans developmental network, and control its expression2,3. Subsequently, many thousands of miRNAs were successively discovered in various organisms, for example, in human genome there had been 2588 miRNAs detected and annotated4. During miRNA biogenesis, a long primary miRNA (pri-miRNA) is firstly transcribed from the genome, fold into hairpins with two arms (5′ and 3′), and then undergo cleavage to generate a ∼70–100 nt long, hairpin-containing precursor miRNA (pre-miRNA)5,6, which would be further cleaved into an ∼18–25 nt miRNA duplex7. One strand of the duplex will be chosen as the mature miRNA to be assembled into the miRNA-induced silencing complex (miRISC)8. As translational inhibition, the miRISC will bind target mRNAs to facilitate their degradations6,9. While the other strand would be directly degraded10,11. In animals, miRNAs control the expressions of their target genes by a complementary binding between the seed regions (ranging from 2 to 8 nt) of miRNAs and 3′-UTRs of the target mRNAs. However, in plants, miRNAs target mRNAs through near-complete base pairing6,12,13.
It has been demonstrated that miRNAs regulate different biological processes such as apoptosis, organismal development, cell proliferation, tissue differentiation and regeneration6,14,15,16,17,18. Moreover, miRNAs also play crucial roles in many diseases, including cancer. For example, miR-17-92 and miR-21 were found elevated, while other miRNA families, including let-7 and miR-34 families, were frequently detected down-regulated in cancer19. The miR-17-92 cluster was reported elevated in many cancer types, especially in several leukemias and lymphomas20. Besides cancer, miRNAs are also linked to biological metabolisms, such as glucose metabolism, lipid metabolism and so on. miR-375 has been detected highly expressed in pancreatic islet cells and proved to control a large number of genes that involved in islet cell proliferation21,22. Let-7 and the miR-103/107 family have also been validated functionally linked to glucose metabolism23,24,25. miR-122, a liver-specific and liver-enriched miRNA, is the first validated miRNA that regulates lipid metabolism. Data showed that deletion of miR-122 could lead to decrease of serum triglyceride (TG) and cholesterol levels26,27,28. miR-33a/33b were investigated capable of binding the mRNAs of Sterol Regulatory Binding Element Factor (SREBP) genes and control their expressions. And SREBPs were considered as key transcriptional regulators in lipid metabolism. They had been proved to mediate many genes involved in fatty-acid, cholesterol biosynthesis and intake, phospholipids and TG productions, and so on29,30. Besides miR-122 and miR-33a/33b, there are still a certain number of miRNAs reported to be related to lipid metabolism, such as miR-2731,32,33,34, miR-37835,36, miR-37037 and so on. Most reports on the regulatory roles of miRNAs in lipid metabolism focused on mammals, but few data described which miRNAs mediated lipid metabolism and their mechanisms in poultry, especially in duck. In fact, lipid metabolism in duck is very important for not only the customers but also the raisers, because the fat characters of duck are directly linked to people’s intakes of TG and cholesterol, flavors of meat and egg, and the cost of feeding. Lipid metabolism in duck mainly locates in liver38,39. Thus, researches on lipid metabolism-related miRNAs and their mechanisms in duck liver would be meaningful.
In this study, feed with different fat contents was prepared and fed to ducks for 2 weeks, and then the miRNAs in all liver tissues were extracted and detected by high throughput sequencing. After differential expression analysis and miRNA-mRNA target prediction, lipid metabolism related miRNAs were collected and then validated. As a result, miRNAs that regulated lipid metabolism in duck liver were preliminarily found and their target genes were predicted. It should be helpful to explore and build the regulatory networks of the lipid metabolism in duck and other poultry.
Results
Differential fat characters analysis
The crude fat contents in livers of experimental group (EG) were detected significantly higher than those of control group (CG) (Table 1), promoted by 9.7%. To better analyze the fat characters, each constituent fatty acid content was also determined. As the statistical results showed that compared to CG ducks, the contents of C17:1 (Ginkgolic acid) and C18:2 (Linoleic acid) of EG ducks were significantly higher (P < 0.05), while the content of C12:0 (Lauric acid) was significantly lower (P < 0.05).
Table 1. Fat contents in liver tissues of control group (CG) and experimental group (EG).
| Fatty acids | CG | EG | P_value |
|---|---|---|---|
| C12:0 | 2.440 ± 0.022%a | 2.270 ± 0.043%b | 0.0163 |
| C13:0 | 0.323 ± 0.012% | 0.300 ± 0.014% | 1.1561 |
| C14:0 | 2.091 ± 0.016% | 2.107 ± 0.026% | 0.4959 |
| C14:1 | 0.927 ± 0.012% | 0.937 ± 0.012% | 0.4676 |
| C15:0 | 0.077 ± 0.009% | 0.053 ± 0.005% | 0.0534 |
| C15:1 | 0.420 ± 0.008% | 0.433 ± 0.005% | 0.1335 |
| C16:0 | 22.397 ± 0.034% | 22.420 ± 0.024% | 0.4791 |
| C16:1 | 3.101 ± 0.022% | 3.057 ± 0.012% | 0.0858 |
| C17:0 | 1.801 ± 0.012% | 1.797 ± 0.017% | 0.5421 |
| C17:1 | 0.113 ± 0.005%a | 0.127 ± 0.005%b | 0.0474 |
| C18:0 | 16.568 ± 0.031% | 16.643 ± 0.017% | 0.0519 |
| C18:1 | 21.884 ± 0.122% | 21.913 ± 0.028% | 0.7708 |
| C18:2 | 13.228 ± 0.026%a | 13.317 ± 0.021%b | 0.0208 |
| C18:3 | 0.027 ± 0.005% | 0.030 ± 0.006% | 0.4227 |
| C20:0 | 0.013 ± 0.005% | 0.020 ± 0.009% | 0.1835 |
| C20:1 | 0.036 ± 0.009% | 0.043 ± 0.005% | 0.4381 |
| C20:2 | 1.313 ± 0.025% | 1.343 ± 0.009% | 0.2251 |
| C20:3 | 11.691 ± 0.041% | 11.593 ± 0.012% | 0.0681 |
| C20:5 | 0.023 ± 0.005% | 0.020 ± 0.003% | 0.4227 |
| C22:0 | 1.407 ± 0.012% | 1.437 ± 0.012% | 0.0739 |
| C22:1 | 0.077 ± 0.009% | 0.087 ± 0.005% | 0.2739 |
| C22:3 | 0.010 ± 0.003% | 0.013 ± 0.005% | 0.4226 |
| C22:5 | 0.023 ± 0.005% | 0.030 ± 0.06% | 0.1835 |
| C22:6 | 0.010 ± 0.001% | 0.010 ± 0.002% | 0.5355 |
| Total | 100% | 100% | |
| Crude fat | 2.875 ± 0.035%a | 3.153 ± 0.049%b | 0.0152 |
The contents of each fatty acid and the crude fat were calculated as ratios (means ± SD) to total fatty acids and liver weights, respectively. The values in fold indicate significant differences at P < 0.05.
miRNA expression profiles in duck liver
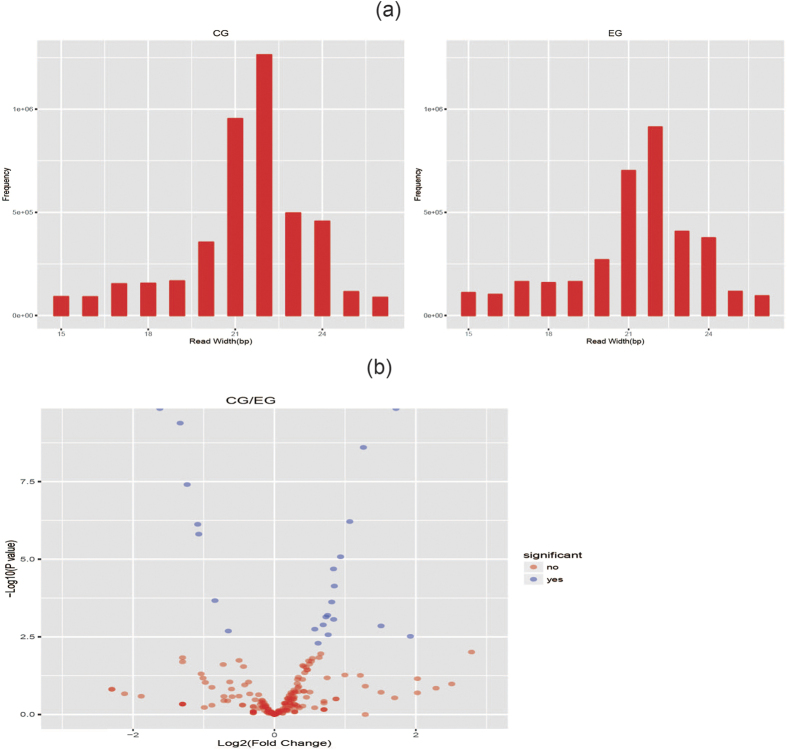
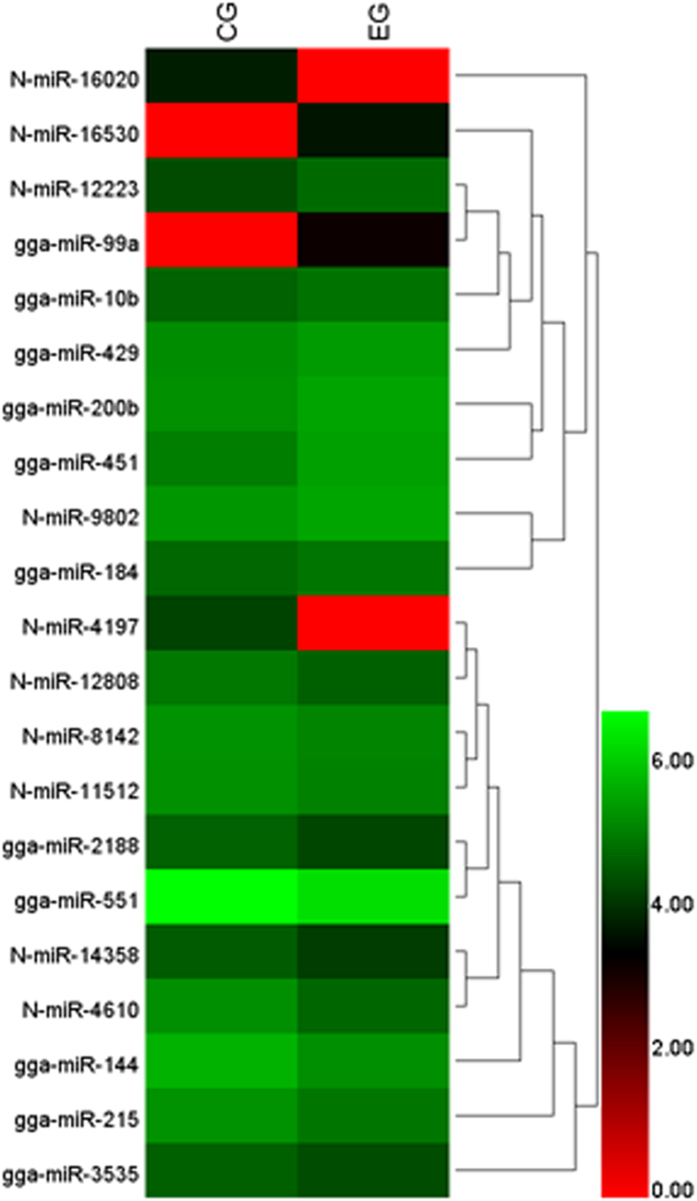
By sequencing analysis, the information of a total of 557 miRNAs from all liver samples was obtained, and their frequencies (Fig. 1a), volcano plot (Fig. 1b), Scatter plot (see Supplementary Fig. S1) and expression density distributions (see Supplementary Fig. S2) in the two groups were analyzed, respectively. Furthermore, as the statistical results indicated that compared to CG livers, 21 miNRAs were found differentially expressed, among which 9 miRNAs were up-regulated while the other 12 miRNAs were down-regulated in EG livers. The differential expressions of the 21 miRNAs in CG and EG were presented in Fig. 2. By comparison with the known miRNA database in miRBase, 11 of the 21 differentially expressed miRNAs were known while the other 10 were predicted novel miRNAs, whose mature sequences were displayed in Table 2.
Figure 1.
Read width frequency distributions (a) and volcano plot (b) of miRNAs from CG and EG livers. CG and EG represent control group and experimental group, respectively. This also applies to the following Figures and Tables.
Figure 2. Heatmap of differentially expressed miRNAs in CG and EG livers.
The prefix “N-” means predicted novel miRNAs.
Table 2. Expression changes and mature sequences of the 21 differentially expressed miRNAs.
| miRNAs | Expression change | Mature sequences (5′→3′) |
|---|---|---|
| gga-miR-99a | Up | AACCCGUAGAUCCGAUCUUGUG |
| gga-miR-10b | Up | UACCCUGUAGAACCGAAUUUGU |
| gga-miR-184 | Up | UGGACGGAGAACUGAUAAGGGU |
| gga-miR-200b | Up | UAAUACUGCCUGGUAAUGAUGAU |
| gga-miR-429 | Up | UAAUACUGUCUGGUAAUGCCGU |
| gga-miR-551 | Up | GCGACCCAUACUUGGUUUCAG |
| gga-miR-215 | Down | AUGACCUAUGAAUUGACAGAC |
| gga-miR-451 | Down | AAACCGUUACCAUUACUGAGUUU |
| gga-miR-2188 | Down | AAGGUCCAACCUCACAUGUCCU |
| gga-miR-3535 | Down | GGAUAUGAUGACUGAUUAUCUGAAA |
| gga-miR-144 | Down | CUACAGUAUAGAUGAUGUACUC |
| N-miR-16020 | Down | GAGAACUCUGCUGAAGGA |
| N-miR-16530 | Up | CUGGCGAUGAUGACACACU |
| N-miR-9802 | Up | UGGGAUGAAGCACUGAAGC |
| N-miR-12223 | Up | CGGCUGAGAUCUGAUAGC |
| N-miR-4197 | Down | UGAUCUCAUCCUGGGGCU |
| N-miR-12808 | Down | GUCCAAGCCGGACGGACU |
| N-miR-14358 | Down | GCAGACUCACUCUGUACUGAACU |
| N-miR-4610 | Down | CUAGAUGAUCUUAGAAACU |
| N-miR-8142 | Down | UGUUGUAGAUCUGGCACA |
| N-miR-11512 | Down | CACUGCUGCAGUGACUCCC |
Predicted novel miRNAs in the table were randomly named with the prefix “N-”. Expression changes represented the changes in EG that compared to CG.
miRNA target analysis
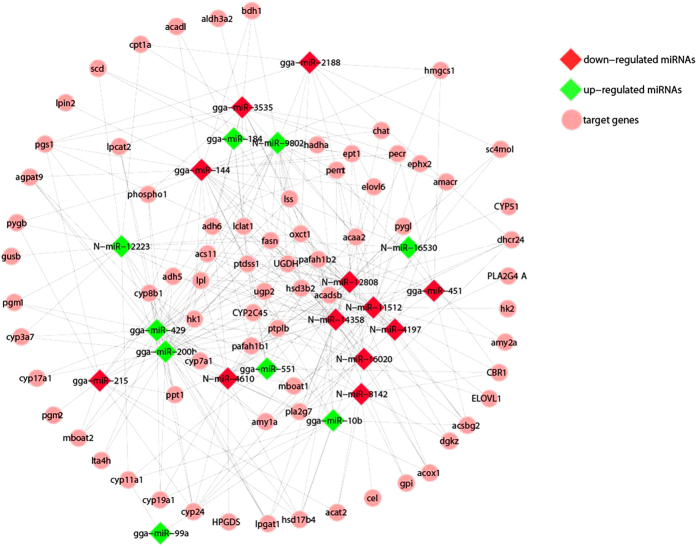
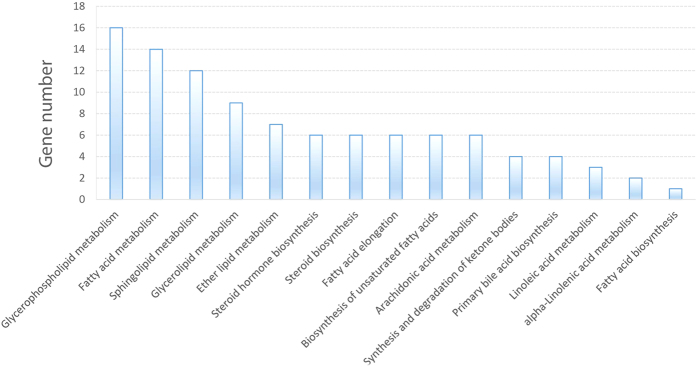
To characterize the regulations of miRNAs on lipid metabolism in duck, miRNA target prediction, GO enrichment and KEGG pathway analysis were performed. As a result, 316 most scored potential miRNA-mRNA pairs were obtained between the 21 differentially expressed miRNAs and 73 genes that involved in 15 lipid metabolic processes. The network of the 21 miRNAs and the 73 predicted target genes were constructed using Cytoscape software and shown in Fig. 3. The distribution of the 73 target genes in different metabolic processes was shown in Fig. 4.
Figure 3. Regulation networks of the differentially expressed miRNAs and their predicted target genes in duck lipid metabolism.
Figure 4. Target gene Numbers of the differential miRNAs in duck lipid metabolic processes.
Validation of two miRNA/mRNA negative regulation pairs
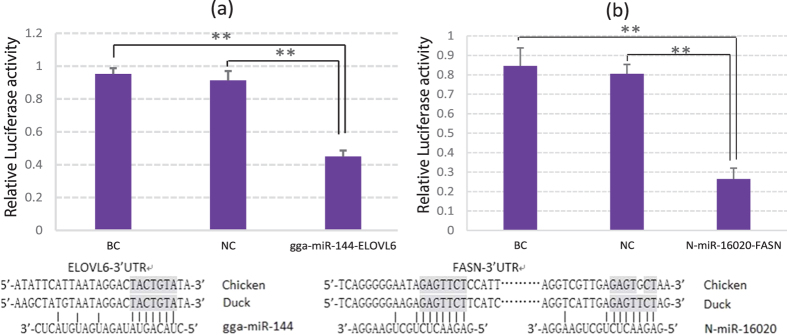
N-miR-16020 and gga-miR-144 were selected to perform the validation analysis. Primers were designed to detect their expressions in CG and EG livers. And the qRT-PCR results indicated that compared to CG, both expressions of N-miR-16020 (P < 0.05) and gga-miR-144 (P < 0.01) were down-regulated in EG (Fig. 5a). Among the predicted target genes of gga-miR-144 and N-miR-16020, Elongation of very Long chain fatty acids protein 6 (ELOVL6) and Fatty acid synthase (FASN) were respectively chosen to perform Dual-Luciferase reporter system analysis. The recombined reporter vectors with the 3′-UTRs of ELOVL6/FASN were cotransfected into duck hepatocytes with gga-miR-144/N-miR-16020 mimics, respectively. Transfections with negative mimics and without mimics were settled as negative control (NC) and blank control (BC), respectively. Each transfection was settled for 6 replicates. Data of duck hepatocyte isolation and identification could be found as Supplementary Fig. S3. After determination and statistical analysis, the firefly: Renilla luciferase activities of the two miRNA-target validations were both significantly lowered by gga-miR-144/N-miR-16020 mimics (P < 0.01) compared to NC and BC (Fig. 6a,b). Furthermore, the relative expression levels of the two chosen target genes in CG and EG livers, FASN and ELOVL6, were also determined up-regulated by 303% (P < 0.01) and 144% (P < 0.05), respectively (Fig. 5b).
Figure 5.
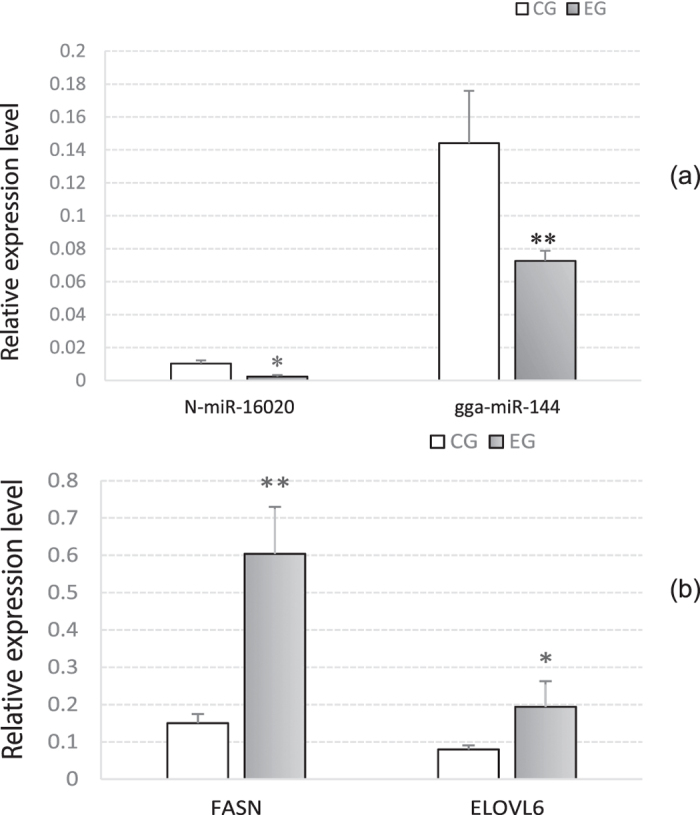
Relative expression levels of N-miR-16020 and gga-miR-144 (a) and their chosen target genes FASN and ELOVL6 (b) in CG and EG. Expression levels of the two miRNAs and their chosen target genes were determined by qRT-PCR in the CG and EG liver samples, normalized to those of U6 and β-actin respectively, and then shown as mean ± SD. Each transfection was performed in triplicates. *P < 0.05, **P < 0.01.
Figure 6.
Dual-Luciferase reporter system validations of gga-miR-144-ELOVL6 (a) and N-miR-16020-FASN (b). Recombined Dual –Luciferase reporter vectors with 3′-UTR of target genes were cotransfected with miRNAs, while cotransfection with negative mimics and transfection without mimics were settled as negative control (NC) and blank control (BC), respectively. Each transfection was performed in 6 replicates. The firefly: Renilla luciferase activities were calculated and shown as mean ± SD. *P < 0.05, **P < 0.01. The information of sequence analysis between miRNA seed regions and target 3′-UTRs was placed at the bottom.
Discussion
Duck provides important parts for people’s diet, such as meat and eggs. However, duck products with high fat content would cause many related diseases that threating people’s health, such as obesity, angiocardiopathy, hepatic adipose infiltration and so on. Besides, excessive lipid metabolism in duck will reduce its nutritional value and lower down feed conversion efficiency, which leads to more cost of feed. miRNAs have been reported to play fundamental roles in regulations of various biological processes, including lipid metabolism. Since few data were available on miRNAs involved in duck lipid metabolism which mainly locates in liver tissue, an analysis of lipid metabolism-related miRNAs in duck liver was performed on.
In this study, the feed of the experimental ducks was added in with 5% oil. And after 2 weeks, the fat contents of the livers (3.153 ± 0.049%a) were detected significantly higher than those of the control (2.875 ± 0.035%b), which indicates that the lipid synthesis in the experimental ducks represented more active. Then the differential miRNAs analysis was performed on, and 21 differentially-expressed, lipid metabolism-related miRNAs were discovered, among which 11 miRNAs were matched known in miRBase database while the other 10 miRNAs were predicted novel. These miRNAs were considered to play regulatory roles in duck lipid metabolism, and similar results had been reported in other animals. For example, miR-451 was detected significantly down-regulated (P < 0.05) in mice livers when fed with atherogenic diet40, and miR-451 was also found involved in human non-alcoholic fatty liver (NAFLD)41. A high-throughput Solexa sequencing approach was adopted to identify the miRNAs differentially expressed in large White pigs (lean type pig) and Meishan pigs (Chinese indigenous fatty pig)42, as the results showed that the expression level of miR-215 in Large White pigs was significantly higher (P < 0.01) than that in Meishan pigs. Several lipid metabolism-related diseases were proved that could be caused by the abnormal expression of miR-14443,44. These data were consistent with the results in this study.
By sequence matching and energy stability assessment, 316 pairs of miRNA-target gene were obtain in this study, containing 21 differential miRNAs and 73 lipid metabolism-related genes. To validate the predictions, two miRNA-target gene pairs were selected to test their regulatory relations, gga-miR-144-ELOVL6 and N-miR-16020-FASN, including one known miRNA and one predicted novel miRNA. Firstly, the expression levels of the two miRNAs in the livers were detected, and the qRT-PCR analysis indicated that both the two miRNAs were significantly down-regulated (P < 0.05) in EG livers (Fig. 5a), which was consistent with the miRNA sequencing data. Then Dual-Luciferase reporter system analysis was performed on to validate the regulations of the selected miRNA-target gene pairs, and the results represented that both the firefly: Renilla luciferase activity values were significantly lowered down (P < 0.01) by cotransfection with miRNA mimics, compared to negative control and blank control. These data indicated that the applied miRNA-target gene prediction analysis in this article was reliable to some extent. Furthermore, the expression levels of FASN and ELOVL6 genes were also determined in the liver samples by qRT-PCT, as the data shown in Fig. 5b, the expressions of the two genes were both significantly promoted in EG livers (P < 0.05), which was in accordance with the expression changes of N-miR-16020 and gga-miR-144. The up-regulated expressions of FASN and ELOVL6 might explain the higher contents of crude fat, C17:1, C18:2 and lower content of C12:0 in EG livers. FASN is a crucial multifunctional enzyme in lipogenesis and deposition45,46, and ELOVL6 was demonstrated to elongate C12-C16 to longer fatty acids, especially C1847,48,49. By the way, since each miRNA was predicted to regulate the expressions of a number of target genes, which were also predicted regulated by many miRNAs12, the expression changes of FASN and ELOVL6 genes in EG were probably the outcome of co-regulation by different miRNAs, including the up-regulated miRNAs. The promoted expressions of these miRNAs could be caused by a feedback regulation of their target genes or some other mechanisms, which needed to be further researched.
Fat characters of duck are directly related to both culturing cost and people’s health. Therefore, it is necessary to understand the regulation networks in duck lipid metabolism. In this research, a number of lipid metabolism-related miRNAs were obtained, and their target genes in lipid metabolic processes were predicted and preliminarily validated. In conclusion, this study may provide useful information and new objects for future research on lipid metabolism in duck.
Materials and Methods
Ethics statement
All experimental protocols were approved by Animal Ethics committee of Zhejiang University (Hangzhou, China). The methods were conducted in accordance with the Guidelines for Experimental Animals established by the Ministry of Science and Technology (Beijing, China).
Animal and tissue collection
Two groups (n = 5) of Cherry-Valley ducks at the age of 10 weeks with the same genetic background were selected as control group (CG) and experimental group (EG) in this study. Both groups of ducks were watered ad libitum and provided with the same amount of feed each day, in addition, the feed of EG was added in with 5% oil (Animal oil∶vegetable oil, 1:1). After 2 weeks, liver samples of all individuals were immediately frozen into liquid nitrogen and lately stored at −70 °C. All animals in this experiment were slaughtered following ethical standards.
Determination of fat content
The fat contents of liver samples were determined following Soxhelt extraction method, in which petroleum ether was used as solvent. Furthermore, the fatty acid ratios of the fat in liver samples were also detected. All liver samples were directly analyzed by Gas Chromatography-Mass Spectrometer (GC-MS) on a fused silica column (HP-5MS, 30 m × 0.25 mm × 0.25 μm, length × ID × film thickness). High-purity Helium (99.9995%, 0.7 mL/min) was used as carrier gas to flush pyrolytic compounds into the GC-MS system (6890N GC/5973MS, Agilent). The column temperature was elevated from 100 °C to 220 °C (6 °C/min), held for 13 min, and then elevated again to 260 °C (10 °C/min), held for 15 min. The mass spectrometer was operated in SCAN model with ionization energy of 70 eV (EI), ion source at 230 °C and quadrupole at 150 °C. The compounds were then compared to NIST98 to detect the structures, and the contents of each fatty acid were determined by calculating the peak areas.
RNA extraction
Total RNA of each sample was extracted with TRIzol reagent (Invitrogen, USA) following the manufacturer’s protocols, and then treated with RQ1 DNase (Promega, USA) to remove DNA. The quality and quantity of the extracted RNA were detected by measuring the absorbance at 260 nm/280 nm using NanoDrop 2000 (Thermo, USA). And then the RNA integrity was further verified by 1.5% agarose gel electrophoresis.
miRNA sequencing and statistical analysis
The extracted RNAs were ligated to 3′ and 5′ adaptors sequentially, reverse transcribed and PCR amplified. The entire library was then tested by 10% native PAGE gel electrophoresis, and the bands corresponding to microRNA insertion were cut and eluted. After purification, the small RNA libraries were quantified with Qubit Fluorometer (Invitrogen, USA) and then used for cluster generation and 50 nt single end sequencing analysis with Illumina HiSeq2000 system (Illumina, USA) according to the manufacturer’s instructions. The raw digital-quality data were analyzed by masking adaptor sequences and removing the contaminated reads, after which the clean reads were collected and aligned with the chicken reference genome and duck 3′UTR data (NCBI). The clean reads were compared with the Rfam database to filter the known non-miRNA reads, such as rRNA, snoRNA, snRNA, HACA-box, ribozyme, CRISPR, IRES, scaRNA and so on, and then compared with the known miRNA database in miRBase to identify mature miRNAs or pre-miRNAs. In addition, novel miRNAs were predicted through the algorithm of miRDeep50, and RNA-fold was used to analyze their structures. The numbers of miRNA reads were normalized by Fragments Per Kilobase of transcript per Million fragments mapped (FPKM)51. The differential significance was identified by the EdgeR program52 at adj. P ≤ 0.01.
miRNA target predictions and analysis
miRNA-3′-UTR sequence matching and energy stability assessment were analyzed by Miranda algorithm to predict potential target genes of the obtained lipid metabolism related miRNAs. And then GO Term and KEGG pathway analyses of these genes were performed.
qRT-PCR validation
miRNAs and mRNAs were reverse transcribed to cDNA with the miRcute miRNA First-Strand cDNA Synthesis Kit (TIANGEN, Beijing, China) and PrimeScript RT reagent Kit with gDNA Eraser (Takara, Japan), respectively. U6 RNA and β-actin were chosen as endogenous internal controls, and the relative expression levels were calculated as 2−ΔCt (ΔCt = Cttarget − Ctcontrol). qRT-PCR analyses were performed on ABI 7300 system (Applied Biosystems, Foster City, CA) using SYBR Green Realtime PCR Mix (Takara, Japan) in triplicate for each reaction.
Dual-Luciferase reporter system validation
Primer pairs with different restriction sites added in the forward and reverse primers were designed to amplify the 3′-UTRs (containing miRNA binding sites) of the chosen target genes in duck, and then recombined to pmirGLO Dual-Luciferase miRNA Target Expression Vector (Promega, USA) following the manufacturer’s introductions, which was pre-treated with the same restriction endonucleases. After verification by restriction and sequencing, the recombined vector was cotransfected into isolated Cherry-Valley duck hepatocytes with miRNA mimics/negative control (Shanghai GenePhama, China). After 48 h of cell culture, the luciferase activities were detected with Dual-Luciferase Reporter Assay System (Promega, USA) by Smart Line TL Tube Luminometer (Titertek Berthold, Germany) according to the manufacturers’ protocols. Each cotransfection was performed in 6 replicates.
Additional Information
How to cite this article: He, J. et al. Analysis of miRNAs and their target genes associated with lipid metabolism in duck liver. Sci. Rep. 6, 27418; doi: 10.1038/srep27418 (2016).
Supplementary Material
Acknowledgments
We are grateful to all the members of the laboratory for their help in sampling and performing the experiments. This work was supported by the earmarked fund for National Waterfowl-industry Technology Research System (CARS-43-2), International Science & Technology Cooperation Program of China (2013DFA31880), PhD Research Start-up Projects (010500400315) and Agricultural Extension Programs (NJTG201511) of Wenzhou Vocational College of Science & Technology.
Footnotes
Author Contributions Conceived and designed the experiments: L.L., W.W., Y.T., J.H. and L.C. Performed the experiments: J.H., L.C., S.S. and L.D. Analyzed the data: J.H., D.N., L.C., Y.Z. and X.L. Contributed reagents/materials/analysis tools: J.H., J.R., J.S. and L.L. Wrote the paper: J.H.
References
- Horvitz H. R. & Sulston J. E. Isolation and genetic characterization of cell-lineage mutants of the nematode Caenorhabditis elegans. Genetics 96, 435–454 (1980). [DOI] [PMC free article] [PubMed] [Google Scholar]
- Lee R. C., Feinbaum R. L. & Ambros V. The C. elegans heterochronic gene lin-4 encodes small RNAs with antisense complementarity to lin-14. Cell 75, 843–854 (1993). [DOI] [PubMed] [Google Scholar]
- Wightman B., Ha I. & Ruvkun G. Posttranscriptional regulation of the heterochronic gene lin-14 by lin-4 mediates temporal pattern formation in C. elegans. Cell 75, 855–862 (1993). [DOI] [PubMed] [Google Scholar]
- Griffiths-Jones S. et al. miRBase: microRNA sequences, targets and gene nomenclature. Nucleic Acids Res 34, D140–144 (2006). [DOI] [PMC free article] [PubMed] [Google Scholar]
- Lee Y. et al. The nuclear RNase III Drosha initiates microRNA processing. Nature 425, 415–419 (2003). [DOI] [PubMed] [Google Scholar]
- Pritchard C. C., Cheng H. H. & Tewari M. MicroRNA profiling: approaches and considerations. Nat Rev Genet 13, 358–369 (2012). [DOI] [PMC free article] [PubMed] [Google Scholar]
- Han J. et al. Molecular basis for the recognition of primary microRNAs by the Drosha-DGCR8 complex. Cell 125, 887–901 (2006). [DOI] [PubMed] [Google Scholar]
- Khvorova A., Reynolds A. & Jayasena S. D. Functional siRNAs and miRNAs exhibit strand bias. Cell 115, 209–216 (2003). [DOI] [PubMed] [Google Scholar]
- Shukla G. C., Singh J. & Barik S. MicroRNAs: Processing, Maturation, Target Recognition and Regulatory Functions. Mol Cell Pharmacol 3, 83–92 (2011). [PMC free article] [PubMed] [Google Scholar]
- Schwarz D. S. et al. Asymmetry in the assembly of the RNAi enzyme complex. Cell 115, 199–208 (2003). [DOI] [PubMed] [Google Scholar]
- Shin C. Cleavage of the star strand facilitates assembly of some microRNA into ago2-containing silencing complexes in mammals. Mol Cells 26, 308–313 (2008). [PubMed] [Google Scholar]
- Bartel D. P. MicroRNAs: genomics, biogenesis, mechanism, and function. Cell 116, 281–297 (2004). [DOI] [PubMed] [Google Scholar]
- Ha M. & Kim V. N. Regulation of microRNA biogenesis. Nat Rev Mol Cell Biol. 15, 509–524 (2014). [DOI] [PubMed] [Google Scholar]
- Ameres S. L. & Zamore P. D. Diversifying microRNA sequence and function. Nat Rev Mol Cell Biol. 14, 475–488 (2013). [DOI] [PubMed] [Google Scholar]
- Ramachandran R., Fausett B. V. & Goldman D. Ascl1a regulates Muller glia dedifferentiation and retinal regeneration through a Lin-28-dependent, let-7 microRNA signalling pathway. Nat Cell Biol. 12, 1101–1107 (2010). [DOI] [PMC free article] [PubMed] [Google Scholar]
- Ranganathan K. & Sivasankar V. MicroRNAs - Biology and clinical applications. J Oral Maxillofac Pathol 18, 229–234 (2014). [DOI] [PMC free article] [PubMed] [Google Scholar]
- Tsonis P. A. et al. MicroRNAs and regeneration: Let-7 members as potential regulators of dedifferentiation in lens and inner ear hair cell regeneration of the adult newt. Biochem Biophys Res Commun 362, 940–945 (2007). [DOI] [PMC free article] [PubMed] [Google Scholar]
- Tang Z. et al. Integrated analysis of miRNA and mRNA paired expression profiling of prenatal skeletal muscle development in three genotype pigs. Sci. Rep. 5, 15544 (2015). [DOI] [PMC free article] [PubMed] [Google Scholar]
- Esquela-Kerscher A. & Slack F. J. Oncomirs — microRNAs with a role in cancer. Nature Reviews Cancer 6, 259–269 (2006). [DOI] [PubMed] [Google Scholar]
- Ota A. et al. Identification and characterization of a novel gene, C13orf25, as a target for 13q31-q32 amplification in malignant lymphoma. Cancer Res 64, 3087–3095 (2004). [DOI] [PubMed] [Google Scholar]
- Poy M. N. et al. A pancreatic islet-specific microRNA regulates insulin secretion. Nature 432, 226–230 (2004). [DOI] [PubMed] [Google Scholar]
- Poy M. N. et al. miR-375 maintains normal pancreatic alpha- and beta-cell mass. Proc Natl Acad Sci. USA 106, 5813–5818 (2009). [DOI] [PMC free article] [PubMed] [Google Scholar]
- Frost R. J. & Olson E. N. Control of glucose homeostasis and insulin sensitivity by the Let-7 family of microRNAs. Proc Natl Acad Sci. USA 108, 21075–21080 (2011). [DOI] [PMC free article] [PubMed] [Google Scholar]
- Trajkovski M. et al. MicroRNAs 103 and 107 regulate insulin sensitivity. Nature 474, 649–653 (2011). [DOI] [PubMed] [Google Scholar]
- Zhu H. et al. The Lin28/let-7 axis regulates glucose metabolism. Cell 147, 81–94 (2011). [DOI] [PMC free article] [PubMed] [Google Scholar]
- Esau C. et al. miR-122 regulation of lipid metabolism revealed by in vivo antisense targeting. Cell Metab 3, 87–98 (2006). [DOI] [PubMed] [Google Scholar]
- Hsu S. H. et al. Essential metabolic, anti-inflammatory, and anti-tumorigenic functions of miR-122 in liver. J Clin Invest 122, 2871–2883 (2012). [DOI] [PMC free article] [PubMed] [Google Scholar]
- Tsai W. C. et al. Micro-122 palys a critical role in liver homeostasis and hepatocarcinogenesis. J Clin Invest 122, 2884–2897 (2012). [DOI] [PMC free article] [PubMed] [Google Scholar]
- Najafi-Shoushtari S. H. et al. MicroRNA-33 and the SREBP host genes cooperate to control cholesterol homeostasis. Science 328, 1566–1569 (2010). [DOI] [PMC free article] [PubMed] [Google Scholar]
- Jeon T. I. & Osborne T. F. SREBPs: metabolic integrators in physiology and metabolism. Trends Endocrinol Metab 23, 65–72 (2012). [DOI] [PMC free article] [PubMed] [Google Scholar]
- Ji J. et al. Over-expressed microRNA-27a and 27b influence fat accumulation and cell proliferation during rat hepatic stellate cell activation. FEBS Lett 583, 759–766 (2009). [DOI] [PubMed] [Google Scholar]
- Jennewein C. et al. MicroRNA-27b contributes to lipopolysaccharide-mediated peroxisome proliferator-activated receptor gamma (PPARgamma) mRNA destabilization. J Biol. Chem 285, 11846–11853 (2010). [DOI] [PMC free article] [PubMed] [Google Scholar]
- Wang T. et al. MicroRNAs miR-27a and miR-143 regulate porcine adipocyte lipid metabolism. Int J Mol Sci. 12, 7950–7959 (2011). [DOI] [PMC free article] [PubMed] [Google Scholar]
- Shirasaki T. et al. MicroRNA-27a regulates lipid metabolism and inhibits hepatitis C virus replication in human hepatoma cells. J Virol 87, 5270–5286 (2013). [DOI] [PMC free article] [PubMed] [Google Scholar]
- Carrer M. et al. Control of mitochondrial metabolism and systemic energy homeostasis by microRNAs 378 and 378*. Proc Natl Acad Sci. USA 109, 15330–15335 (2012). [DOI] [PMC free article] [PubMed] [Google Scholar]
- John E. et al. Dataset integration identifies transcriptional regulation of microRNA genes by PPARgamma in differentiating mouse 3T3-L1 adipocytes. Nucleic Acids Res 40, 4446–4460 (2012). [DOI] [PMC free article] [PubMed] [Google Scholar]
- Iliopoulos D. et al. MicroRNA-370 controls the expression of microRNA-122 and Cpt1alpha and affects lipid metabolism. J Lipid Res 51, 1513–1523 (2010). [DOI] [PMC free article] [PubMed] [Google Scholar]
- Fishman P. H. & Brady R. O. Biosynthesis and function of gangliosides. Science 194, 906–915 (1976). [DOI] [PubMed] [Google Scholar]
- Hermier D. Lipoprotein metabolism and fattening in poultry. J Nutr 127, 805S–808S (1997). [DOI] [PubMed] [Google Scholar]
- Garelnabi M. & Mahini H. Modulation of microRNA 21, 125 b and 451 expression by quercetin intake and exercise in mice fed atherogenic diet. Biomedicine & Preventive Nutrition 4, 359–363 (2014). [Google Scholar]
- Yamada H. et al. Associations between circulating microRNAs (miR-21, miR-34a, miR-122 and miR-451) and non-alcoholic fatty liver. Clinica Chimica Acta 424, 99–103 (2013). [DOI] [PubMed] [Google Scholar]
- Chen C. et al. Solexa sequencing identification of conserved and novel microRNAs in backfat of Large White and Chinese Meishan pigs. PLoS One 7, e31426 (2012). [DOI] [PMC free article] [PubMed] [Google Scholar]
- Ramirez C. M. et al. Control of cholesterol metabolism and plasma high-density lipoprotein levels by microRNA-144. Circ Res 112, 1592–1601 (2013). [DOI] [PMC free article] [PubMed] [Google Scholar]
- Li D. et al. Down-regulation of miR-144 elicits proinflammatory cytokine production by targeting toll-like receptor 2 in nonalcoholic steatohepatitis of high-fat-diet-induced metabolic syndrome E3 rats. Molecular and Cellular Endocrinology 402, 1–12 (2015). [DOI] [PubMed] [Google Scholar]
- Wakil S. J. Fatty acid synthase, a proficient multifunctional enzyme. Biochemistry 28, 4523–4530 (1989). [DOI] [PubMed] [Google Scholar]
- Smith S., Witkowski A. & Joshi A. K. Structural and functional organization of the animal fatty acid synthase. Progress in Lipid Research 42, 289–317 (2003). [DOI] [PubMed] [Google Scholar]
- Moon Y. A. et al. Identification of a mammalian long chain fatty acyl elongase regulated by sterol regulatory element-binding proteins. J Biol. Chem 276, 45358–45366 (2001). [DOI] [PubMed] [Google Scholar]
- Matsuzaka T. et al. Cloning and characterization of a mammalian fatty acyl-CoA elongase as a lipogenic enzyme regulated by SREBPs. J Lipid Res 43, 911–920 (2002). [PubMed] [Google Scholar]
- Green C. D. et al. Role of fatty acid elongases in determination of de novo synthesized monounsaturated fatty acid species. J Lipid Res 51, 1871–1877 (2010). [DOI] [PMC free article] [PubMed] [Google Scholar]
- Friedlander M. R. et al. Discovering microRNAs from deep sequencing data using miRDeep. Nat Biotechnol 26, 407–415 (2008). [DOI] [PubMed] [Google Scholar]
- Mortazavi A. et al. Mapping and quantifying mammalian transcriptomes by RNA-Seq. Nat Methods 5, 621–628 (2008). [DOI] [PubMed] [Google Scholar]
- Robinson M. D., McCarthy D. J. & Smyth G. K. edgeR: a Bioconductor package for differential expression analysis of digital gene expression data. Bioinformatics 26, 139–140 (2009). [DOI] [PMC free article] [PubMed] [Google Scholar]
Associated Data
This section collects any data citations, data availability statements, or supplementary materials included in this article.


