

Abstract
Mixed lineage leukemias have a relatively poor prognosis and arise as a result of translocations between the MLL (KMT2A) gene and one of multiple partner genes. Downstream targets of MLL are aberrantly upregulated and include the developmentally important HOX genes and MEIS1, as well as multiple microRNAs (miRNAs), including the miR-17~92 cluster. Here we examined the contribution of specific miRNAs to MLL leukemias through knockdown studies utilizing custom anti-microRNA oligonucleotides. Combinatorial treatment against miR-17-5p and miR-19a-3p of the miR-17~92 cluster dramatically reduces colony forming ability of MLL-fusion containing cell lines relative to non-MLL acute myeloid leukemia (AML) controls. To determine the mechanism by which these miRNAs contribute to leukemia, we validated PKNOX1 as a target of both miR-17-5p and miR-19a-3p. MEIS1 and PKNOX1 are TALE domain proteins that participate in ternary complexes with HOX and PBX partners. Here we establish the competitive relationship between PKNOX1 and MEIS1 in PBX-containing complex formation and determine the antagonistic role of PKNOX1 to leukemia in a murine MLL-AF9 model. These data implicate the miR-17~92 cluster as part of a regulatory mechanism necessary to maintain MEIS1/HOXA9-mediated transformation in MLL leukemia, indicating that targeting multiple non-homologous miRNAs may be utilized as a novel therapeutic regimen.
Keywords: MLL, miRNA, miR-17~92, PKNOX1, MEIS1, leukemia
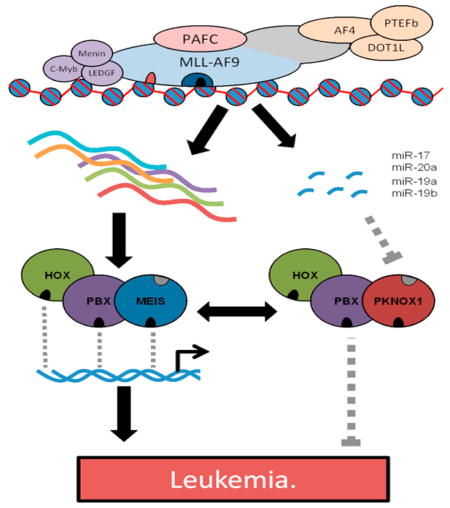
Graphical abstract
1. INTRODUCTION
Mixed lineage leukemias involving the MLL (KMT2A)gene account for about 5–10 percent of acute myeloid leukemias [1]. They arise as the result of chromosome translocations which produce fusion proteins expressing the amino-terminal portion of MLL and a carboxy-terminal fusion partner [2]. MLL fusion proteins inappropriately maintain the transcription of many target genes, including HOX genes [2, 3]. Recent studies have identified multiple miRNAs which are upregulated in MLL leukemias as compared to non-MLL AMLs [4].
MiRNAs are small non-coding RNAs (~22 nt) that post-transcriptionally downregulate the expression of mRNA target genes (reviewed in [5, 6]). Studies by our lab and others have identified several miRNAs upregulated in MLL leukemia including miR-196b and the miR-17~92 cluster [7–9]. The miR-17~92 cluster (also known as oncomiR-1) consists of 6 miRNAs co-expressed from a single transcript (miR-17-5p, miR-18a-5p, miR-19a-3p, miR-20a-5p, miR-19b-3p-1, and miR-92a-3p-1) [10] and is directly regulated by MLL [9]. Within this cluster, several miRNAs are highly related in sequence and form miRNA families. Family designation and target mRNA recognition is primarily mediated by nucleotides 2–7 of the miRNA, commonly referred to as the ‘seed region’ [11]. miR-17-5p and miR-20a-5p are highly homologous and share the same seed sequence (reviewed in [12]). Similarly, miR-19a-3p and miR-19b-3p-1 are also highly homologous with identical seed regions and form a miRNA family (reviewed in [12]). The miR-17~92 cluster targets genes involved in processes including cell death, cell cycle, development, and hypoxia (extensively reviewed in [13, 14]). Validated targets for the miR-17~92 cluster in various cancer models include PTEN, AML1 and E2F1 [15–17]. Intriguingly, several mRNAs have been validated as targets of more than one miRNA from the miR-17~92 cluster, suggesting that miRNAs may act cooperatively to regulate targets. For example, PTEN has been validated as a target for both miR-17-5p and miR-19a-3p [17, 18].
Enforced overexpression of miR-17-5p~19b increases the colony forming ability of MLL-ELL (KMT2A-ELL) transformed bone marrow cells [9]. Overexpression of the miR-17~92 cluster results in downregulation of 363 potential target genes, suggesting that disregulation of the miR-17~92 cluster has broad implications in target mRNA regulation [9]. Within MLL leukemia, miR-17-5p regulates CDKN1A (p21) expression [19]. Overexpression of miR-17~19b accelerated the onset of MLL-AF10 leukemia in a murine model, which was phenocopied by shRNA knockdown of CDKN1A (p21) [19]. The growing number of validated targets for each miRNA suggests that miRNAs are not limited to single targets, and that other, as yet non-validated targets, also likely contribute to the disease process. However, the mechanisms by which the miR-17~92 cluster contribute to MLL leukemia are not yet fully defined.
HOX genes are the most well studied MLL targets, encoding transcription factors critical to body patterning, development, and hematopoiesis (reviewed in [20]). Enforced expression of Hoxa9 and Meis1 in murine bone marrow progenitor cells is sufficient to induce AML [21]. Previous studies have shown HOXA9 is essential to MLL leukemias [22, 23]. HOX proteins function in a ternary complex containing PBX and MEIS1 partners. [24, 25]. Both the binary and ternary complex forms function to regulate target gene transcription [26]. Deletion of the Pbx-interacting domains of Meis1 abrogated its leukemogenic potential when co-infected with a Hoxa9 expressing virus [27]. PBX3 is upregulated in MLL leukemia and disruption of the HOX-PBX interaction through a small peptide inhibitor promoted apoptosis and decreased expression of known HOX-MEIS targets in an MLL leukemia cell line [28]. These findings suggest that HOX-MEIS activity requires PBX participation.
Several technologies have emerged to target miRNAs utilizing chemically modified oligonucleotides complementary to the miRNAs (reviewed in [34]). Consisting of modifications to the phosphodiester bonds and the ribose backbone, antagomirs have increased target affinity and RNA stability relative to RNA:RNA duplexes [35, 36]. In this study, we target miRNAs both individually and in combination as a potential therapeutic approach for MLL leukemia. We find that use of a combination of antagomirs functions as a potent anti-leukemia treatment in vitro. Furthermore, we validate PKNOX1 as a target of miR-17~92 cluster miRNAs, which regulates the composition of functionally distinct PBX-containing complexes. This study establishes one mechanism by which miRNA inhibition disrupts the leukemogenic potential of MLL leukemia.
2. MATERIALS AND METHODS
2.1. Retroviral constructs and infections
MIGR1 [37], MSCV-MLL-AF9 [37], and MSCV-pKOF2-Prep1-EGFP [32] retroviral constructs were previously described. Bone marrow isolation, enrichment, and infection for generation of MLL-AF9 transformed bone marrow was performed as previously described [7]. Additional infection with MIGR1 or pKOF2-Prep1-EGFP was performed on MLL-AF9-transformed bone marrow cells that had been serially replated in methylcellulose for 4 weeks. pRL-TK (Promega, Madison, #E2241), MSCV-PIG [10] and MSCV-PIG miR-17-5p-19b [10] have been described previously. Luciferase constructs were generated by cloning the 3′ UTR of PKNOX1 from human genomic DNA into the pmiR-Report plasmid (ThermoFisher, Waltham, #AM5795). Mutations to the miRNA binding sites were generated using the Stratagene Multi-site directed mutagenesis kit (Stratagene, La Jolla, California #200514). Construct details available upon request.
2.2. Cell culture and transfection
MOLM-13, MV4-11 and RS4;11 (DSMZ, Germany) and HEK293T cells were cultured using standard conditions. HEK293T cells were transfected using CalPhos Mammalian transfection system per manufacturer’s instructions (ClonTech, Mountain View, #631312). For experiments examining the role of Pknox1 in MLL-AF9 transformed murine bone marrow, cells were generated as previously described [7]. After serial replating in methylcellulose for 4 weeks, cells were acclimated to liquid culture for 1 week and subjected to additional spinoculations with either MIGR1 or MSCV-pKOF2-Prep1-GFP.
2.3. Antagomir modifications and treatment
Antagomirs were synthesized by Dharmacon (Lafayette, Colorado) with modifications described by Krutzfeldt [35, 36] All oligos were complementary to targeted miRNAs and followed a uniform pattern of modifications, including: 2′-O-Me modification at all nucleotides, and replacement of first 2 and last 4 phosphodiester linkages with phosphorothioate linkages. All oligos possess a cholesterol group appended to the 3′ end (depicted in Supplementary Table 1). Fluorescent labeled antagomirs contained an additional DY547 fluorescent label appended to the 5′ end. Antagomirs were added to media at the final concentrations indicated in figure legends.
2.4. RNA isolation and real-time polymerase chain reaction
RNA was extracted according to manufacturer’s protocol using TRI Reagent (Sigma, St. Louis, #T9424) from cells treated with antagomirs for 72 hrs in liquid culture. cDNA synthesis was performed using 10 ng of total RNA using Applied Biosystems miRNA Reverse Transcription kit (Life Technologies, Carlsbad, #4366596). Real-Time PCR was performed on an Applied Biosystems 7300 cycler using Applied Biosystems Taqman assays for hsa-miR-17-5p, hsa-miR-19a-3p, or RNU6. Data was analyzed using the Delta Delta Ct method [38].
2.5. Methylcellulose colony assays
Methylcellulose colony assays for human cell lines were performed using H4100 Methocult methylcellulose (Stemcell, Vancouver, #04100) supplemented with a final serum concentration of 10% FBS. Cells were analyzed and collected after 7–8 days in culture. Colonies were imaged under an Olympus microscope. Murine cells were plated in H3234 Methocult supplemented with IL-3 (10 ng/mL), IL-6 (10 ng/mL), and SCF (100 ng/mL).
2.6. Cell proliferation Assay
Viable cell number for human cell lines was assessed after 4 days of antagomir treatment using Promega Cell-Titer-Glo kit (Promega, Madison, #G7570) according to manufacturer’s instructions. Viable cell number for MLL-AF9 transformed murine bone marrow was performed using cell titer glow at days 3, 5, and 7. Luminescence was measured on a Glomax 96 microplate luminometer. Remaining cells were collected for cell cycle analysis. Cells were fixed and stained with propidium iodide and analyzed via FACS. All FACS data was analyzed using Watson Pragmatic function within Flowjo Software Package (Version 9.03).
2.7. Fluorescence Activated Cell Sorting (FACS)
Cellular uptake of antagomirs was detected by FACS analysis. Live cells were treated with either a control or a fluorescent-human labeled antagomir. Mean fluorescence intensity was determined in FlowJo. Cell surface marker staining was performed as previously described [37] using anti- CD117-APC (eBioscience, San Diego, # 17-1171-82), anti-CD11B-PE (eBioscience, San Diego, #12-0112-85), anti-GR-1-PE-Cy5 (eBioscience, San Diego, #15-5931-81). Data was processed using FlowJo Software Package.
2.8. Luciferase Assays
HEK293T cells were plated at 6.0×10⁵ cells well in 24 well plates and co-transfected with 120 ng of pmiR-Report reporter construct (wild-type or mutant 3′UTR for PKNOX1), 10 ng of pRL-TK, and 600 ng of either MSCV-PIG or MSCV-PIG-miR-17~19b. Cells were cultured for 48 hrs and collected for luciferase analysis with the Promega Dual-Luciferase Reporter Assay System (Promega, Madison, #E1910) according to manufacturer’s instructions.
2.9. Co-Immunoprecipitation (co-IP) and Western Blotting
Co-IP was performed in IPH buffer using Agarose A beads (Santa Cruz Biotechnology, SC-2001). All equilibration and washes were performed with IPH buffer (50 mM Tris-HCl, 150 mM NaCl, 5mM EDTA, 0.5% NP-40) with freshly added protease inhibitor cocktail (Sigma Aldrich, St. Louis, #P8340).
Proteins were separated on 10% polyacrylamide gels and transferred to nitrocellulose membranes using Trans BlotTurbo transfer system (BioRad, Hercules, CA). Membranes were probed with anti-PREP1 (N15) (Santa Cruz Biotechnology, Santa Cruz, #SC-6245), anti-Pbx1/2/3 (C-20) (Santa Cruz Biotechnology, Santa Cruz# SC-888), anti-Meis1 (Milipore, Billerica, #05-779), anti-Hoxa9 (Millipore, Billerica, #07-178), or anti-beta-Actin (Sigma, St. Louis, #A5441). Secondary antibody probing was performed with TrueBlot anti-rabbit (eBioscience, San Diego, #18-8816-31), anti-mouse-HRP (GE Life sciences, Piscataway, #NA931VS), or anti-Rabbit-HRP (GE Life sciences, Piscataway, #NA934VS).
3. RESULTS AND DISCUSSION
3.1. Antagomir uptake occurs in a dose-dependent manner
Previous studies by our lab and others have utilized antagomirs to examine the role of specific miRNAs in a murine model of MLL leukemia [7, 39]. To determine the viability of antagomirs as a potential novel therapeutic, antagomir uptake in human MLL leukemia cell lines was examined by FACS analysis of a fluorescent labeled antagomir (Figure 1A,B). A linear correlation of antagomir uptake was found with dosage up to 2 μM of antagomirs across multiple MLL fusion possessing leukemia cell lines. Knockdown was assessed at 2 μM for MOLM-13 and MV4-11 cells and 1 μM for RS4;11 cells utilizing antagomirs against miR-17-5p or miR-19a-3p (Figure 1C,D). Specific antagomir treatment resulted in significant knockdown of the targeted miRNA relative to cells treated with either a control antagomir or vehicle (Figure 1C,D). Collectively, these results indicate that antagomir treatment of human cell lines results in a dose dependent uptake with effective and specific knockdown of targeted miRNAs.
Figure 1. Antagomir treatment occurs in a dose dependent manner and results in a knockdown of target miRNA.

A–B) Antagomir uptake was determined by FACS analysis using a fluorescently labeled antagomir at multiple concentrations (20 nM–2000nM). A) Mean fluorescence intensity of cells was plotted at antagomir treatment concentrations of 20 nM, 200 nM, 500 nM, 1000 nM, and 2000 nM. B) Example plots of uptake for MOLM-13, RS4;11 and MV4-11 treated with increasing concentrations for a control antagomir (top) and its fluorescent-labelled counterpart (bottom). C–D) Antagomir-mediated knockdown of target miRNAs was verified at final treatment concentration in liquid culture. C) Knockdown shown for miR-17-5p levels relative to a control antagomir (left) or a vehicle control (right). D) Knockdown shown for miR-19a-3p levels relative to a control antagomir (left) or a vehicle control (right). Anti-Ce-miR-67 was used as a control to assess knockdown in all cell lines.
3.2. Combined inhibition of miRs-17-5p and 20a-5p or miRs-17-5p and 19a-3p reduces colony formation and increases differentiation of MLL leukemia cells
We hypothesized that increased expression of individual miRNAs is essential for maintaining MLL leukemia cell proliferation and clonogenic capacity. MLL leukemia cell lines were treated with antagomirs directed against a subset of miRNAs overexpressed in MLL leukemia to examine the functional requirement of specific miRNAs in MLL leukemia. We utilized cell lines with MLL-AF9 (KMT2A-MLLT3) (MOLM-13) or MLL-AF4 (KMT2A-AFF1) (MV4-11, RS4;11) translocations. Treatment with anti-miR-20a-5p produced the greatest decrease in colony forming ability in all cell lines, while treatment with either anti-miR-17-5p or anti-miR-20a-5p was sufficient to completely block colony formation in MV4-11 (Figure 2A). Antagomirs against miR-19a-3p caused no significant decrease relative to treatment with a control antagomir when used as a single antagomir treatment (Figure 2A). Anti-miR-19b-3p-1 treatment caused a decrease relative to both vehicle and control antagomir treatments in MV4-11 cells alone (Figure 2A).
Figure 2. Antagomir treatment results in a decrease in colony forming ability.

A–B) Antagomir treatments were performed against individual miRNAs and combinations of miRNAs at a total concentration of 2 μM for MOLM-13 and MV4-11 and 1 μM for RS4;11. MOLM-13 and RS4;11 were tested in three independent experiments with each experiment performed using duplicate plates. MV4-11 was tested in two independent experiments with each experiment performed using duplicate plates. Significance was tested against control antagomirs (*= p<0.05). Anti-Ce-miR-67 was used as a control for RS4;11, and anti-miR-10a was used as a control for MOLM-13 and MV4-11. HL-60, and U937 were tested in three independent experiments with each experiment performed using duplicate plates. E) Antagomir treated colonies were photographed and collected for Wright-Giemsa staining. Representative slides shown for both colony and cellular morphology. Scale bars represent 200 μm.
Combinatorial antagomir treatments on human cell lines were examined to determine whether simultaneously targeting multiple miRNAs with the same seed sequence or targeting multiple miRNAs with different seed sequences would potentiate the effects on colony forming capacity or proliferation (Figure 2). Treatment with anti-miR-17-5p plus anti-miR-19a-3p produced a dramatic effect beyond that observed for either of these antagomirs individually (Figure 2A). This combination produced an effect beyond an additive effect in MOLM-13. We further examined colony and cell morphology for combinatorial treatments (Figure 2B). Morphologically, cells appear more differentiated with a greater cytoplasmic:nuclear ratio and increased vacuolarity. Combinatorial treatment against miR-17-5p, and miR-19a-3p resulted in a change in cell morphology in all MLL leukemia cell lines, but not in non-MLL AML cell lines (Figure 2B). Colonies were more sparse and contained fewer cells after treatment with either anti-miR-17-5p and 20a-5p, or anti-miR-19a-3p and 19b-3p-1, or anti-miR-17-5p and 19a-3p (Figure 2A,B). Further, a decrease in cell number that was greater than the decrease in colony number in the combinatorial treatments was observed, suggesting that in addition to inhibition of colony forming ability, antagomir treatments either inhibited proliferation, or increased cell death and/or differentiation.
We have determined the requirement of specific miRNAs in the miR17~92 cluster to maintain the transformed phenotype of MLL leukemia by antagonizing miRNAs over-expressed in this subtype of leukemia. In particular, antagonizing both miR-17-5p and miR-20a-5p, or both miR-17-5p and miR-19a-3p had the most dramatic effects (Figure 2A, B). Targeting related miRNAs of the same family could potentially circumvent redundant functions caused by multiple miRNA family members’ ability to target the same mRNA transcript. Antagonizing unrelated miRNA family members shows a more dramatic effect beyond that observed for targeting only individual miRNA family members, suggesting that the miRNAs from different families also function cooperatively. This could be due to regulation of different mRNAs or because multiple miRNAs simultaneously and more efficiently target the same critical mRNA.
3.3. miRNA inhibition causes a modest decrease in cell number and increased G1/G0 cell cycle accumulation
Human cell lines were treated with antagomirs in liquid culture to examine proliferative defects and separate these effects from colony forming ability. Both individual treatments and combinatorial treatments were simultaneously tested in human MLL leukemia cell lines (Figure 3. Although individual treatments were much less dramatic, decreases largely mirrored the colony assay data (Figure 3A). Treatment with anti-miR-17-5p or anti-miR-20a-5p resulted in a decrease in total cell number at 4 days, while treatment with anti-miR-19a-3p or anti-miR-19b-3p-1 had no individual effect. Combinatorial treatment against miR-17-5p and 20a-5p resulted in a decrease in total cell number for RS4;11 cells, while anti-miR-17-5p and 20a-5p and anti-miR-17-5pnd 19a both had significant effects in MOLM-13 cells. Surprisingly, we did not detect any decrease in cell number relative to control in MV4-11 cells. Antagomir-treatment produced a less dramatic effect in liquid culture than in colony assays. To further examine effects on proliferation, cell cycle was examined by propidium iodide staining. Decreased cell numbers were accompanied by a modest accumulation of cells at G0/G1 (Figure 3B). These data indicate that decrease in colony forming ability was accompanied by a mild proliferative defect.
Figure 3. Antagomir treatment of MLL leukemia cell lines in liquid culture causes a modest decrease in total cell number and variable accumulation at G1.

A) Total cell number was assessed using Cell-Titer-Glo assay after 4 days. Antagomir treatment was performed in three independent experiments in triplicate (1 uM total concentration). Statistical significance was tested against a control antagomir treatment (* = p<0.05) using Student’s t-test. Anti-Ce-miR-67 was used as a control for RS4;11, and anti-miR-10a was used as a control for MOLM-13 and MV4-11. B) Cell cycle distribution was determined by propidium iodide (PI) staining from three independent experiments for each cell line.
3.4. PKNOX1 is a valid target of the miR-17~92 cluster
We next sought to determine potential mRNA targets relevant to MLL leukemia, focusing on common putative targets of both the miR-17 and miR-19 families with functions related to colony forming ability. While shRNA knockdown of CDKN1A (p21) in an MLL leukemia model phenocopies overexpression of the miR-17-5p~19b, it is not currently known to be targeted by miR-19a-3p. Our antagomir treatment data indicate a more severe phenotype upon combinatorial treatment with anti-miR-17-5p and anti-miR-19a-3p. As a result, we focused on a target that is regulated by both miR-17-5p and miR-19a-3p. Search results using multiple target prediction algorithms (miRanda, TargetScan, Diana-mT) identified the mRNA for the TALE domain protein PKNOX1 as an intriguing possible target (not shown). Our search identified additional common targets of the miR-17 and miR-19 families. These included targets that have been validated in the literature, such as PTEN [17, 40] and targets that have yet to be experimentally validated, such as CASP8. However, PKNOX1 was intriguing for both the strength of the predicted miRNA:mRNA interactions and the previously documented functional roles of PKNOX1. MiRNA targeting algorithms predict that the miR-17~92 cluster targets the 3′UTR of the PKNOX1 mRNA at multiple sites. miR-17-5p and miR-20a-5p putatively target the PKNOX1 3′UTR at 2 distinct sites, while miR-19a-3p and 19b putatively target the PKNOX1 3′ UTR at a single site (Figure 4A,B). All sites are evolutionarily conserved between mouse and human.
Figure 4. Pknox1 is a valid target of the miR-17~92 cluster.

A) Putative miRNA response element mutations in PKNOX1 3′UTR. Nucleotide changes for mutant constructs are indicated with underlines. B) Schematic of luciferase reporter construct design and mutation placement. C) Luciferase response relative to wild type control. Luciferase levels were examined in 4 independent experiments. Statistical significance was tested against wt (p< .05) using student’s t-test. D) Endogenous levels of PKNOX1 and PBX1/2/3 were examined in human cell lines. Unnecessary lanes cropped out.
PKNOX1 (also known as PREP1) is a homolog of MEIS1 and, along with PKNOX2 and MEIS1/2/3/4 proteins, forms the MEINOX family [29]. PKNOX1 was initially characterized as a PBX binding partner with an important role in embryonic development, whose loss results in embryonic lethality through multiple defects [41]. Pknox1 has been further characterized as a tumor suppressor in an Eμ-Myc model of lymphoma [42]. PKNOX1 participates in HOX-PBX protein complexes, utilizing the same interaction domains as MEIS1 [30]. PKNOX1 and MEIS1 are highly homologous in the domains required for both PBX interaction and DNA binding and interact with the same surface on PBX partners [31]. However, the oncogenic activity of MEIS1 is located in the C-terminal domain, which differs from that of PKNOX1 [27, 32, 33]. Meis1 cooperates with Hoxa9 in leukemic transformation; whereas co-expression of Pknox1 with Hoxa9 lacks this effect [32]. However, chimeric Pknox1 proteins which append the Meis1 C-terminus to the Pknox1 protein can restore acceleration of leukemia development [32]. Studies of Pknox1 and Meis1 in murine development indicate that Pknox1 and Meis1 largely regulate distinct sets of genes, but often have opposing functions where their targets overlap [26].
To determine the function of predicted miR-17~92 cluster targets in the PKNOX1 3′UTR, we performed luciferase reporter assays. Mutations were generated for the putative miRNA response elements (MREs) targeted by the miR-17 family, the miR-19 family, or both (Figure 4B). Mutation of either MRE individually or of all miR-17~92 cluster-targeted MREs resulted in an increase in luciferase expression relative to a wild-type reporter construct, indicating a valid regulatory relationship between the miRNAs and the PKNOX1 mRNA (Figure 4C). We determined steady-state levels of PKNOX1 in MLL leukemia cell lines along with the non-MLL K562 cells (Figure 4D. PKNOX1 levels were markedly lower in MLL leukemia cell lines relative to K562 or HEK293T cells, supporting our findings that PKNOX1 is downregulated in MLL leukemias (Figure 4D).
Our data demonstrate that PKNOX1 is a valid target of the miR-17~92 cluster. Multiple miRNAs from this cluster regulate PKNOX1 mRNA through binding to separate miRNA response elements The redundancy of miRNAs targeting the same mRNA suggest that the relationship of miR-17~92 and PKNOX1 functions as an important regulatory switch which may respond to various cellular signals. While binding affinity for the PKNOX1 transcript is predicted to be thermodynamically stable, it is likely that other mRNAs are targeted simultaneously dependent on availability of targets.
3.5. PKNOX1 and MEIS1 compete for participation in PBX-HOX complexes
To test whether miRNA levels resulted in a change in PKNOX1 protein level, miR-17~19b was expressed in HEK293T cells, which express easily detectable PKNOX1, and endogenous PKNOX1 protein was determined by western blot. Increasing concentrations of miR-17~19b resulted in a decrease in PKNOX1 protein levels (Figure 5A). To determine whether antagomir treatment also mediated PKNOX1 disregulation, PKNOX1 levels were determined after combinatorial antagomir treatment (Figure 5B). PKNOX1 levels increased in response to treatment with antagomir combinations against either the miR-17 family, the miR-19 family, or against both miR-17-5p and miR-19a-3p relative to a control antagomir treatment (Figure 5B). These results further confirm that miR-17~92 cluster miRNAs regulate PKNOX1.
Figure 5. Antagomir treatment results in increased PKNOX1 levels and participation in HOX-PBX complexes.

A) PKNOX1 protein levels in HEK293T cells were measured in response to transfection with increasing concentrations of a plasmid expressing miR-17~19b with quantification of PKNOX1 levels relative to loading control indicated below blot. B) Human leukemia cell lines were treated with antagomirs (2 μM for 72 hrs) and analyzed for PKNOX1 protein levels by western blot. B) HEK293T cells were transfected with Meis1 expressing plasmid and subjected to co-immunoprecipitation for PBX1/2/3. 20% input (bottom) was subject to western blotting for PKNOX1 and MEIS1. Co-immunoprecipitation was performed using antibody against PBX1/2/3. Representative blot depicted from experiment were performed in triplicate.
PKNOX1 and MEIS1 share high homology in their PBX-interacting domains and their homeodomains. Thus, we hypothesized that increased MEIS1 expression would compete with PKNOX1 for PBX binding, thus causing decreased PKNOX1 inclusion in these complexes. To test the competitive relationship of PKNOX1 and MEIS1, HEK293T cells were transfected with increasing amounts of a Meis1-expressing plasmid and co-immunoprecipitated for PBX-containing complexes using an antibody that recognizes all PBX family proteins. With increasing levels of Meis1 protein, less PKNOX1 was present in PBX complexes, indicating a competitive relationship (Figure 5C).
Recent studies by the Blasi group support and complement our findings [43, 44]. They found that Prep1 (Pknox1) competes with Meis1 for binding to Pbx1, and Prep1 depletion enabled Meis1 to transform MEFs [43]. Additionally, depletion of Prep1 accelerated the onset of Meis1-Hoxa9-mediated leukemogenesis in a murine model [44]. They hypothesized that increasing PREP1 levels may be an important area for future therapeutic development [43]. Studies performed by the Chen lab indicate that HOXA9 and MEIS1 are negatively regulated by miR-196b, one of the miRNAs overexpressed in MLL leukemia [45], Although this causes an initial delay in the onset of leukemia, increased miR-196b expression ultimately contributes to a more aggressive leukemia through repression of the tumor suppressor FAS [45]. This effect could thus limit the availability of HOXA9 and MEIS1for the formation of HOX-PBX-MEIS complexes. HOX-PBX3 protein-protein interaction is also essential for MLL leukemia development and inhibition of this interaction with a small peptide selectively kills cells dependent on HOXA and PBX3 overexpression [28]. Collectively, these findings implicate ternary HOX-PBX-MEIS complexes in MLL leukemia development and support a model of competition between PKNOX1 and MEIS1 for inclusion into HOXA9-PBX3 containing complexes in MLL leukemia.
3.6. Enforced Pknox1 expression decreases the colony formation ability, promotes differentiation, and results in a decrease in cell number of MLL-AF9-transformed cells
Pknox1 lacks the oncogenic potential of Meis1 in a Hoxa9-dependent murine transformation model [32]. However, the role of Pknox1 in the context of MLL leukemia remains to be tested. We hypothesized that Pknox1 would have an inhibitory role in MLL leukemia. MLL-AF9 transformed murine bone marrow cells were infected with a Pknox1-expressing virus or a control virus. Enforced expression of Pknox1 caused a decrease in colony number relative to a control vector-infected cells (Figure 6A). The decrease in colony number was primarily caused by a decrease in Type1 colonies which represent the least differentiated colony type (Figure 6B, D). Total cell number after one week in colony assays was also decreased in Pknox1-expressing cells relative to cells infected with a control virus (Figure 6C), mirroring the effects observed in anti-miR-17-5p and miR-19a-3p combinatorial antagomir treatments. Enforced overexpression of Pknox1 resulted in both a decrease in CD117 expression and an increase in Mac-1 and Gr-1 myeloid differentiation markers, supporting the colony phenotype data (Figure 6E). The effects of increased Pknox1 expression on proliferation of MLL-AF9-transformed bone marrow cells was also examined in liquid culture. Enforced Pknox1 expression inhibited the proliferation of MLL-AF9-transformed cells (Figure 6F). As with the human leukemia cell experiments, a modest accumulation of cells at G0/G1 was observed (Figure 6G). This observation is consistent with the effects of antagomir treatments on proliferation and colony-forming capacity of MLL leukemia cell lines.
Figure 6. Enforced Pknox1 expression inhibits MLL-AF9 colony forming ability and proliferation.

MLL-AF9 transformed murine bone marrow cells were infected with either MIGR1 or a Pknox1 expressing virus. Cells were plated in methylcellulose to assess colony forming ability (A – E) or in liquid culture to assess proliferation (F–G) for 1 week in 4 independent experiments. A) Colony number was assessed and B) colony type were examined in all experiments. Statistical analysis was performed using student’s t-test. C) Total cell numbers in colony assays were determined from cells collected from colony assays. D) Colony morphology (top) and GFP expression (bottom) were examined. E) Surface marker staining was assessed for CD117, MAC-1, and GR-1 in 4 independent experiments. F) Total cell number was calculated against a standard curve using Cell Titer Glo Assay from cells in liquid culture. Statistical significance was determined using student’s t-test. G) Cell cycle distribution was analyzed by FACS using propidium iodide staining. Distribution of live cells was averaged from 3 independent experiments (left). Example FACS plots are shown (right).
Murine studies found that infection with Pknox1-expressing virus fails to accelerate leukemia similarly to Meis1 when co-expressed with Hoxa9 [32]. Our experiments demonstrate that exogenous over-expression of Pknox1 negatively affects MLL leukemia cell proliferation and colony-forming ability. We found that Pknox1 overexpression in a murine MLL leukemia model decreased colony forming ability, primarily from a loss of less differentiated colonies. While human MLL cell lines do not form compact colonies like MLL-AF9 transformed murine bone marrow, the ability to form colonies is restricted to a subset of cells. Colony forming capability has been used as a surrogate of leukemia stem/progenitor cell activity in the MLL leukemia model system. Thus, loss of colony forming ability in response to antagomir treatments, without a more dramatic decrease in liquid culture growth, suggests that MLL leukemia stem/progenitor cell activity may be predominantly targeted by these miRNAs. Future work could determine whether specific cell contact-mediated pathways are particularly influenced by miR-17~92 cluster miRNAs in MLL leukemia.
4. CONCLUSIONS
Complex regulatory circuits involving miRNAs are starting to be defined in MLL leukemia. This includes regulation of HOX-PBX-MEIS complexes. Both HOXA9 and MEIS1 are directly regulated by MLL and are necessary for MLL leukemia development [3, 22, 44, 46] MiRNAs in the miR-17~92 cluster are also overexpressed in MLL leukemia. Here we show that miR-17-5p and miR-19a-3p of the miR-17~92 cluster target PKNOX1 and that antagonizing these miRNAs causes increased PKNOX1 expression. We further demonstrate that MEIS1 and PKNOX1 compete for binding in HOX-PBX containing complexes and that manipulation of relative MEIS1/PKNOX1 levels alters complex composition. Within MLL-AF9 transformed bone marrow, exogenous overexpression of Pknox1 has a detrimental effect of colony forming ability and results in an increase in differentiation markers. Together, this suggests that HOX-PBX complexes are a limiting factor in MLL leukemia and are amenable to functional disruption through antagonizing critical regulatory miRNAs. We conclude that expression of several miRNAs of the miR-17~92 cluster are critical for the continued survival of MLL leukemia. Some of this effect is likely mediated through regulation of PKNOX1, indicating this pathway would be worthwhile to explore as potential therapeutic target for MLL leukemia.
Supplementary Material
Highlights.
Treatment with anti-miRNA oligos decreases MLL leukemia cell line colony formation.
The miR-17 and miR-19 miRNA families target the MEINOX family member PKNOX1.
PKNOX1 and MEIS1 compete for inclusion into PBX-containing complexes.
Enforced Pknox1 expression reduces MLL-AF9 leukemia colony formation ability.
Acknowledgments
FINANCIAL SUPPORT
This work was supported by NIH R01HL087188 to N.J.Z.-L.
We thank Dr. G. Sauvageau for retroviral constructs. This work was supported by NIH R01HL087188 to NJZ-L.
Footnotes
CONFLICT OF INTEREST
The authors have no conflicts of interest to disclose.
Publisher's Disclaimer: This is a PDF file of an unedited manuscript that has been accepted for publication. As a service to our customers we are providing this early version of the manuscript. The manuscript will undergo copyediting, typesetting, and review of the resulting proof before it is published in its final citable form. Please note that during the production process errors may be discovered which could affect the content, and all legal disclaimers that apply to the journal pertain.
References
- 1.Huret JL, Dessen P, Bernheim A. An atlas of chromosomes in hematological malignancies. Example: 11q23 and MLL partners. Leukemia. 2001;15(6):987–9. doi: 10.1038/sj.leu.2402135. [DOI] [PubMed] [Google Scholar]
- 2.Popovic R, Zeleznik-Le NJ. MLL: how complex does it get? J Cell Biochem. 2005;95(2):234–42. doi: 10.1002/jcb.20430. [DOI] [PubMed] [Google Scholar]
- 3.Erfurth FE, et al. MLL protects CpG clusters from methylation within the Hoxa9 gene, maintaining transcript expression. Proc Natl Acad Sci U S A. 2008;105(21):7517–22. doi: 10.1073/pnas.0800090105. [DOI] [PMC free article] [PubMed] [Google Scholar]
- 4.Li Z, et al. Distinct microRNA expression profiles in acute myeloid leukemia with common translocations. Proc Natl Acad Sci U S A. 2008;105(40):15535–40. doi: 10.1073/pnas.0808266105. [DOI] [PMC free article] [PubMed] [Google Scholar]
- 5.Mian YA, Zeleznik-Le NJ. MicroRNAs in leukemias: emerging diagnostic tools and therapeutic targets. Curr Drug Targets. 2010;11(7):801–11. doi: 10.2174/138945010791320872. [DOI] [PMC free article] [PubMed] [Google Scholar]
- 6.Bartel DP. MicroRNAs: genomics, biogenesis, mechanism, and function. Cell. 2004;116(2):281–97. doi: 10.1016/s0092-8674(04)00045-5. [DOI] [PubMed] [Google Scholar]
- 7.Popovic R, et al. Regulation of mir-196b by MLL and its overexpression by MLL fusions contributes to immortalization. Blood. 2009;113(14):3314–22. doi: 10.1182/blood-2008-04-154310. [DOI] [PMC free article] [PubMed] [Google Scholar]
- 8.Li Z, et al. Consistent deregulation of gene expression between human and murine MLL rearrangement leukemias. Cancer Res. 2009;69(3):1109–16. doi: 10.1158/0008-5472.CAN-08-3381. [DOI] [PMC free article] [PubMed] [Google Scholar]
- 9.Mi S, et al. Aberrant overexpression and function of the miR-17-92 cluster in MLL-rearranged acute leukemia. Proc Natl Acad Sci U S A. 2010;107(8):3710–5. doi: 10.1073/pnas.0914900107. [DOI] [PMC free article] [PubMed] [Google Scholar]
- 10.He L, et al. A microRNA polycistron as a potential human oncogene. Nature. 2005;435(7043):828–33. doi: 10.1038/nature03552. [DOI] [PMC free article] [PubMed] [Google Scholar]
- 11.Lewis BP, Burge CB, Bartel DP. Conserved seed pairing, often flanked by adenosines, indicates that thousands of human genes are microRNA targets. Cell. 2005;120(1):15–20. doi: 10.1016/j.cell.2004.12.035. [DOI] [PubMed] [Google Scholar]
- 12.Mendell JT. miRiad roles for the miR-17-92 cluster in development and disease. Cell. 2008;133(2):217–22. doi: 10.1016/j.cell.2008.04.001. [DOI] [PMC free article] [PubMed] [Google Scholar]
- 13.Mogilyansky E, Rigoutsos I. The miR-17/92 cluster: a comprehensive update on its genomics, genetics, functions and increasingly important and numerous roles in health and disease. Cell Death Differ. 2013;20(12):1603–14. doi: 10.1038/cdd.2013.125. [DOI] [PMC free article] [PubMed] [Google Scholar]
- 14.Olive V, Jiang I, He L. mir-17-92, a cluster of miRNAs in the midst of the cancer network. Int J Biochem Cell Biol. 2010;42(8):1348–54. doi: 10.1016/j.biocel.2010.03.004. [DOI] [PMC free article] [PubMed] [Google Scholar]
- 15.O’Donnell KA, et al. c-Myc-regulated microRNAs modulate E2F1 expression. Nature. 2005;435(7043):839–43. doi: 10.1038/nature03677. [DOI] [PubMed] [Google Scholar]
- 16.Fontana L, et al. MicroRNAs 17-5p-20a-106a control monocytopoiesis through AML1 targeting and M-CSF receptor upregulation. Nat Cell Biol. 2007;9(7):775–87. doi: 10.1038/ncb1613. [DOI] [PubMed] [Google Scholar]
- 17.Olive V, et al. miR-19 is a key oncogenic component of mir-17-92. Genes Dev. 2009;23(24):2839–49. doi: 10.1101/gad.1861409. [DOI] [PMC free article] [PubMed] [Google Scholar]
- 18.Xiao C, et al. Lymphoproliferative disease and autoimmunity in mice with increased miR-17-92 expression in lymphocytes. Nat Immunol. 2008;9(4):405–14. doi: 10.1038/ni1575. [DOI] [PMC free article] [PubMed] [Google Scholar]
- 19.Wong P, et al. The miR-17-92 microRNA polycistron regulates MLL leukemia stem cell potential by modulating p21 expression. Cancer Res. 2010;70(9):3833–42. doi: 10.1158/0008-5472.CAN-09-3268. [DOI] [PMC free article] [PubMed] [Google Scholar]
- 20.Argiropoulos B, Humphries RK. Hox genes in hematopoiesis and leukemogenesis. Oncogene. 2007;26(47):6766–76. doi: 10.1038/sj.onc.1210760. [DOI] [PubMed] [Google Scholar]
- 21.Kroon E, et al. Hoxa9 transforms primary bone marrow cells through specific collaboration with Meis1a but not Pbx1b. EMBO J. 1998;17(13):3714–25. doi: 10.1093/emboj/17.13.3714. [DOI] [PMC free article] [PubMed] [Google Scholar]
- 22.Ayton PM, Cleary ML. Transformation of myeloid progenitors by MLL oncoproteins is dependent on Hoxa7 and Hoxa9. Genes Dev. 2003;17(18):2298–307. doi: 10.1101/gad.1111603. [DOI] [PMC free article] [PubMed] [Google Scholar]
- 23.Zeisig BB, et al. Hoxa9 and Meis1 are key targets for MLL-ENL-mediated cellular immortalization. Mol Cell Biol. 2004;24(2):617–28. doi: 10.1128/MCB.24.2.617-628.2004. [DOI] [PMC free article] [PubMed] [Google Scholar]
- 24.Jacobs Y, Schnabel CA, Cleary ML. Trimeric association of Hox and TALE homeodomain proteins mediates Hoxb2 hindbrain enhancer activity. Mol Cell Biol. 1999;19(7):5134–42. doi: 10.1128/mcb.19.7.5134. [DOI] [PMC free article] [PubMed] [Google Scholar]
- 25.Shen WF, et al. HOXA9 forms triple complexes with PBX2 and MEIS1 in myeloid cells. Mol Cell Biol. 1999;19(4):3051–61. doi: 10.1128/mcb.19.4.3051. [DOI] [PMC free article] [PubMed] [Google Scholar]
- 26.Penkov D, et al. Analysis of the DNA-binding profile and function of TALE homeoproteins reveals their specialization and specific interactions with Hox genes/proteins. Cell Rep. 2013;3(4):1321–33. doi: 10.1016/j.celrep.2013.03.029. [DOI] [PubMed] [Google Scholar]
- 27.Wang GG, Pasillas MP, Kamps MP. Meis1 programs transcription of FLT3 and cancer stem cell character, using a mechanism that requires interaction with Pbx and a novel function of the Meis1 C-terminus. Blood. 2005;106(1):254–64. doi: 10.1182/blood-2004-12-4664. [DOI] [PMC free article] [PubMed] [Google Scholar]
- 28.Li Z, et al. PBX3 is an important cofactor of HOXA9 in leukemogenesis. Blood. 2013;121(8):1422–31. doi: 10.1182/blood-2012-07-442004. [DOI] [PMC free article] [PubMed] [Google Scholar]
- 29.Longobardi E, et al. Biochemistry of the tale transcription factors PREP, MEIS, and PBX in vertebrates. Dev Dyn. 2013 doi: 10.1002/dvdy.24016. [DOI] [PMC free article] [PubMed] [Google Scholar]
- 30.Longobardi E, et al. Biochemistry of the tale transcription factors PREP, MEIS, and PBX in vertebrates. Dev Dyn. 2014;243(1):59–75. doi: 10.1002/dvdy.24016. [DOI] [PMC free article] [PubMed] [Google Scholar]
- 31.Knoepfler PS, et al. Meis1 and pKnox1 bind DNA cooperatively with Pbx1 utilizing an interaction surface disrupted in oncoprotein E2a-Pbx1. Proc Natl Acad Sci U S A. 1997;94(26):14553–8. doi: 10.1073/pnas.94.26.14553. [DOI] [PMC free article] [PubMed] [Google Scholar]
- 32.Bisaillon R, et al. C-terminal domain of MEIS1 converts PKNOX1 (PREP1) into a HOXA9-collaborating oncoprotein. Blood. 2011;118(17):4682–9. doi: 10.1182/blood-2011-05-354076. [DOI] [PubMed] [Google Scholar]
- 33.Mamo A, et al. Molecular dissection of Meis1 reveals 2 domains required for leukemia induction and a key role for Hoxa gene activation. Blood. 2006;108(2):622–9. doi: 10.1182/blood-2005-06-2244. [DOI] [PubMed] [Google Scholar]
- 34.Lennox KA, Behlke MA. Chemical modification and design of anti-miRNA oligonucleotides. Gene Ther. 2011;18(12):1111–20. doi: 10.1038/gt.2011.100. [DOI] [PubMed] [Google Scholar]
- 35.Krutzfeldt J, et al. Silencing of microRNAs in vivo with ‘antagomirs’. Nature. 2005;438(7068):685–9. doi: 10.1038/nature04303. [DOI] [PubMed] [Google Scholar]
- 36.Krutzfeldt J, et al. Specificity, duplex degradation and subcellular localization of antagomirs. Nucleic Acids Res. 2007;35(9):2885–92. doi: 10.1093/nar/gkm024. [DOI] [PMC free article] [PubMed] [Google Scholar]
- 37.Cierpicki T, et al. Structure of the MLL CXXC domain-DNA complex and its functional role in MLL-AF9 leukemia. Nat Struct Mol Biol. 2010;17(1):62–8. doi: 10.1038/nsmb.1714. [DOI] [PMC free article] [PubMed] [Google Scholar]
- 38.Livak KJ, Schmittgen TD. Analysis of relative gene expression data using real-time quantitative PCR and the 2(−Delta Delta C(T)) Method. Methods. 2001;25(4):402–8. doi: 10.1006/meth.2001.1262. [DOI] [PubMed] [Google Scholar]
- 39.Velu CS, et al. Therapeutic antagonists of microRNAs deplete leukemia-initiating cell activity. J Clin Invest. 2014;124(1):222–36. doi: 10.1172/JCI66005. [DOI] [PMC free article] [PubMed] [Google Scholar]
- 40.Li H, Yang BB. Stress response of glioblastoma cells mediated by miR-17-5p targeting PTEN and the passenger strand miR-17-3p targeting MDM2. Oncotarget. 2012;3(12):1653–68. doi: 10.18632/oncotarget.810. [DOI] [PMC free article] [PubMed] [Google Scholar]
- 41.Ferretti E, et al. Hypomorphic mutation of the TALE gene Prep1 (pKnox1) causes a major reduction of Pbx and Meis proteins and a pleiotropic embryonic phenotype. Mol Cell Biol. 2006;26(15):5650–62. doi: 10.1128/MCB.00313-06. [DOI] [PMC free article] [PubMed] [Google Scholar]
- 42.Longobardi E, et al. Prep1 (pKnox1)-deficiency leads to spontaneous tumor development in mice and accelerates EmuMyc lymphomagenesis: a tumor suppressor role for Prep1. Mol Oncol. 2010;4(2):126–34. doi: 10.1016/j.molonc.2010.01.001. [DOI] [PMC free article] [PubMed] [Google Scholar]
- 43.Dardaei L, Longobardi E, Blasi F. Prep1 and Meis1 competition for Pbx1 binding regulates protein stability and tumorigenesis. Proc Natl Acad Sci U S A. 2014;111(10):E896–905. doi: 10.1073/pnas.1321200111. [DOI] [PMC free article] [PubMed] [Google Scholar]
- 44.Dardaei L, et al. The deficiency of tumor suppressor prep1 accelerates the onset of meis1- hoxa9 leukemogenesis. PLoS One. 2014;9(5):e96711. doi: 10.1371/journal.pone.0096711. [DOI] [PMC free article] [PubMed] [Google Scholar]
- 45.Li Z, et al. miR-196b directly targets both HOXA9/MEIS1 oncogenes and FAS tumour suppressor in MLL-rearranged leukaemia. Nat Commun. 2012;3:688. doi: 10.1038/ncomms1681. [DOI] [PMC free article] [PubMed] [Google Scholar]
- 46.Wong P, et al. Meis1 is an essential and rate-limiting regulator of MLL leukemia stem cell potential. Genes Dev. 2007;21(21):2762–74. doi: 10.1101/gad.1602107. [DOI] [PMC free article] [PubMed] [Google Scholar]
Associated Data
This section collects any data citations, data availability statements, or supplementary materials included in this article.