Abstract
This article reviews atomic force microscopy (AFM) studies of DNA structure and dynamics and protein–DNA complexes, including recent advances in the visualization of protein–DNA complexes with the use of cutting-edge, high-speed AFM. Special emphasis is given to direct nanoscale visualization of dynamics of protein–DNA complexes. In the area of DNA structure and dynamics, structural studies of local non-B conformations of DNA and the interplay of local and global DNA conformations are reviewed. The application of time-lapse AFM nanoscale imaging of DNA dynamics is illustrated by studies of Holliday junction branch migration. Structure and dynamics of protein–DNA interactions include problems related to site-specific DNA recombination, DNA replication, and DNA mismatch repair. Studies involving the structure and dynamics of chromatin are also described.
Keywords: Atomic force microscopy, AFM of DNA, Holliday junctions, protein–DNA complexes, chromatin, nucleosomes dynamics, DNA replication, DNA repair
I. INTRODUCTION
Nanoscale imaging techniques are instrumental in understanding the structure–function relationship of DNA. Historically, electron microscopy (EM) was widely employed to nanoscale studies the various properties of DNA and its complexes with proteins. EM imaging was critical in deciphering the nucleosomal organization of DNA within the cell, illustrating the beads-on-a-string model of chromatin in its unfolded state, and elucidating the higher-order structure of chromatin (see Watson et al.1 and numerous references therein). Importantly, the Nobel Prize–winning discovery of RNA splicing was made using EM to analyze hybrids of adenovirus DNA with mRNA.2,3 EM made the imaging of DNA melting possible. This allowed a complete understanding of this fundamental property of the double-stranded DNA molecule and resulted in the development of the theory that predicts the melting process of long DNA molecules.4–6
The advent of the atomic force microscopy (AFM) nanoimaging technique heralded new molecular biology applications for the study of DNA and protein–DNA complexes. A number of features make AFM a valuable technique in biological studies, including gentle sample preparation techniques, which minimize concerns about sample preservation typically associated with EM studies. Moreover, AFM is capable of imaging samples in fully hydrated states. Therefore, in addition to nanoscale static structural data of DNA and protein–DNA complexes, AFM visualizes the dynamics of conformational transitions of DNA and its various stages. In this article, we review a few examples of AFM applications, including the analysis of DNA conformational dynamics, and the use of AFM to analyze protein–DNA complexes.
II. AFM METHODOLOGY TO STUDY DNA
A. AFM Basics
AFM is a topographic technique in which the sample topography is generated by probing the sample with a sharp stylus mounted on a cantilever that moves over the sample in a raster pattern. The vertical position of the tip and corresponding x-y coordinate of the tip are translated by the electronics to the sample topography. The x-y position of the tip is controlled by the scanner with an accuracy greater than 1 nm, while the vertical displacement of the tip is determined with sub-nanometer accuracy. Therefore, the sample topography can be obtained with sub-nanometer resolution, which has been confirmed by numerous high-resolution AFM studies (Lyubchenko7 and references therein). Notably, a recent study reported superatomic resolution for isolated organic molecules imaged with AFM.8 To accomplish this, imaging was performed with an atomically sharp probe under low temperature (5 K) and high vacuum conditions.
Deformation of soft biological samples by the scanning tip was the primary problem associated with the broad application of AFM to biology. This problem was overcome by the invention of the oscillation mode in which a tip is deliberately vibrated at a frequency close to the cantilever resonant frequency by a piezoelectric modulator.9 As a result, the tip–sample contact is limited to a short period of time defined by the oscillation frequency (~100–300 kHz for imaging in air). This approach is also known as tapping mode, as coined in the literature.10 Although tapping mode decreases the tip–sample interaction because of the short time of tip–sample contact, an additional factor termed the tip oscillation amplitude, affects the tip–sample interaction. The energy provided by the tip to the sample depends quadratically on the drive amplitude of the oscillating probe11; therefore, decreasing this parameter should further preserve the sample structure. This issue was investigated thoroughly by the lab of Thomson,12 leading to the development of the low tip oscillation mode termed small amplitude small set-point (SASS), during which the instrument operates close to the zero (net) sample force. In this mode, the tip oscillates at amplitudes below 5 nm, which is an order of magnitude lower than the typical amplitude values for tapping mode AFM. As a result, the authors were able to continuously scan the DNA samples for hours without any visible damage to the DNA molecules.
B. AFM Resolution
The AFM resolution is defined by the tip sharpness, which is graphically explained in several studies.7,13 According to estimates, atomic resolution can be achieved if the tip is terminated with a single atom and the sample is not dynamic. Imaging double-stranded DNA with a 2-nm diameter at ambient conditions with the tip with radius of curvature of 10 nm, which is a typical nominal value for regular AFM tips, yields a DNA image with a width of ≈5.7 nm. This enlargement effect is known as the tip convolution effect. Recent advances in fabrication of ultrasharp AFM tips (radius of curvature ~ 1 nm) made it possible to perform high-resolution studies of nucleic acids of different types and conformations.14 However, occasionally high-resolution images have been obtained with regular tips, suggesting that these tips were terminated with sharp spikes (asperities) that provide the necessary high-resolution topographs. This assumption was tested in Sheng et al.15 in which direct EM imaging of regular AFM tips was performed.
The thermal motion of molecules should be considered an AFM resolution-limiting factor. The implementation of cryo AFM by the pioneering works of Shao16 made it possible to dramatically improve the resolution of isolated molecules to the nanometer level. Cooling the sample down to 85K allowed the resolution of the domain structure of isolated immunoglobulin IgA protein in various states.
The capillary effect is another factor that dramatically influences AFM resolution. When a surface is exposed to air, it absorbs water molecules from the air and forms a thin water layer over the surface. AFM tips, made from either silicon or silicon nitride, are quite hydrophilic as well; therefore, the water layer further increases the probe size, thereby decreasing the resolution. Additionally, hydration of the sample leads to another complication. Upon approaching the AFM tip to the surface, a water bridge between the hydrated tip and the sample is formed. The surface tension is high, leading to capillary forces in range of the dozens of nano Newtons (nN).17 Therefore, the sample can be dragged over the surface, deteriorating the imaging process. Drying the sample and imaging at low relative humidity helps reduce the effect of capillary forces. The capillary effect can be reduced if scanning is performed in a vacuum, but the use of a vacuum is not conducive to imaging biological samples. Alternatively, there are no capillary forces if imaging is performed in an aqueous solution. Notably, in another study by Lyubchenko et al.,11 high-resolution images were obtained for individual DNA molecules rather than tightly packed DNA molecules.18 Given the fact that imaging in aqueous solutions is the best way to preserve biological samples, this imaging technique is very attractive for biological studies, as noted by images of DNA with high resolution that were acquired in aqueous solutions.11, 18
C. Sample Preparation for AFM Studies of Protein–DNA Complexes
Surface preparation is a key step for any type of microscopy to ensure reliable and reproducible data acquisition, and poor surface preparation is a significant obstacle for scanning probe microscopy because the scanning tip can change the sample structure. Moreover, the tip can displace the sample leading to what are notoriously known as surface reconstructions. Ignoring these reconstructions could lead to imaging artifacts. Thus, AFM requires reliable and robust sample preparation techniques.
The assortment of features of typical AFM substrates currently in use is rather limited. These include mostly hydrophilic silicon surfaces (e.g., mica, glass, silicon wafers) and hydrophobic graphite. Mica is the preferred substrate for AFM. It is a layered mineral in which sheet structures are basic units consisting of two polymerized sheets of silica (SiO4) tetrahedrons. Two such sheets are juxtaposed with the vertices of their tetrahedrons pointing toward each other. The sheets are cross-linked with cations (e.g., aluminum in muscovite) and hydroxyl pairs complete the coordination of these cations. The negatively charged layer packages Al2(OH)2[AlSi3O10] and the mica sheets are held together by potassium (K+) cations. The adjacent sheets of mica can be split, causing the K+ cations to be shared between the two surfaces; therefore, the split leads to uncompensated charges on separate surfaces, giving the mica surface a negative charge. The primary features of mica that favor it as a substrate for AFM are as follows. First, because of the layered structure and strong interactions within the sheet, the cleavage of mica leads to a flat surface that is atomically flat over micron-sized areas. Second, the cleaved surface is free of impurities, so there is no need for additional cleaning of the surface. Third, mica sheets can be cut with scissors or a custom cutter to make a sheet with a desired size and shape. Although the mica surface is almost atomically flat over microns of area and is suitable for imaging DNA and protein–DNA complexes, the mica surface is negatively charged and cannot bind negatively charged DNA molecules. The methods described below overcome this problem.
In one of the first reliable methods for imaging DNA,19,20 the mica surface was treated with magnesium (Mg2+) to increase the affinity of the negatively charged mica surface to DNA. As a result, the DNA molecules were held in place to permit reliable imaging by AFM. Later studies showed that pretreatment of mica is not required, but Mg2+ cations must be present in the buffer solution (e.g., Bustamante and Rivetti21). Instead of Mg2+ cations, other divalent cations can also be used.22 Nickel (Ni2+) cations are the second most widely used cations in AFM studies of DNA and protein–DNA complexes. The correlation between the DNA binding activity of the cation and its hydrated radii was discovered by Hansma and Laney,23 suggests that divalent cations bridge the negatively charged DNA backbone at the mica surface. A later study elaborated on this idea and proposed a mechanism for DNA binding at the mica surface.24 In addition to DNA, the cation-assisted procedure was applied to the imaging of various protein–DNA complexes (reviewed in Lyubchenko25).
An alternative method developed at the same time utilizes the pretreatment methodology of mica and other silica surfaces with aminopropyltriethoxy silane (APTES).26 This technique results in a positively charged surface aminopropyl mica (AP-mica) due to the protonation of the surface immobilized amino groups. The use of AP-mica as developed by Lyubchenko et al.27 enables the preparation of a very smooth functionalized mica. The AP-mica surface remains positively charged even at alkali pH values (pKa =10.4), allowing the AP-mica to bind to negatively charged DNA in the pH range of stable DNA duplexes. Divalent cations are not needed, but they can be added if they are required for the experiment. Additionally, AP-mica retains its DNA binding activity for a few weeks after the preparation.27 These features of AP-mica were critical in performing studies of local and global conformational transitions of DNA and determining the properties of different protein–DNA complexes, including chromatin (reviewed in Lyubchenko25 and Lyubchenko et al.27). A similar mica functionalization technique utilizes aminopropyl silatrane to yield APS-mica.28 This functionalized mica surface has properties very similar to AP-mica, but APS-mica is better suited for the imaging of DNA and protein–DNA complexes in aqueous solutions due to the stability of APS-mica in water compared to that of AP-mica.29, 30
In addition to these commonly used methods, a number of other techniques for mica surface preparation have been developed. In a study by Ellis et al.,31 monovalent cations were used to allow DNA immobilization on mica; however, a rather long incubation period was required for the DNA immobilization step. A method consisting of spreading DNA onto a carbon-coated mica substrate mediated by the denaturation of cytochrome c at an air–water interface was developed by Yang et al.32 and applied to image DNA with AFM. The same group later proposed an approach in which mica was coated with a cationic lipid bilayer.18 Alternatively, polylysine (PL)-coated mica yielded a good substrate suitable for imaging of DNA,33 although supercoiled DNA appeared as molecules with a loosely twisted morphology or a completely relaxed shape. The PL-mica substrate was successfully used to image reconstituted chromatin after drying the sample.34 Mica can also be coated with spermidine. This procedure was used to image the dynamics of DNA and reconstituted chromatin with time-lapse AFM in aqueous solutions.35
III. AFM OF LOCAL AND GLOBAL DNA STRUCTURES
A. Visualization of Supercoiled DNA
Numerous studies have led to the conclusion that a circular topology rather than a linear topography is the predominant DNA form in vivo. Local unwinding of the DNA duplex is accompanied by overwinding the entire DNA circle into a more compact shape termed supercoiled DNA. Importantly, circular plasmid DNA in cells is negatively supercoiled, and this form is biologically significant as it is associated with various DNA functions. A fundamental feature of supercoiled DNA geometry is that distantly separated DNA regions can be brought into close proximity.36, 37 This property is important for genetic events that require communication between distant sites on DNA, such as DNA replication, site-specific recombination, and transposition. Direct visualization of such global DNA conformations is important to understanding the biological role of DNA supercoiling. Initially, EM was instrumental to visualizing supercoiled DNA, but analysis of the dynamic properties of supercoiled DNA and the role of environmental conditions were not possible until AFM was implemented.7,11,25,29,36,38–41
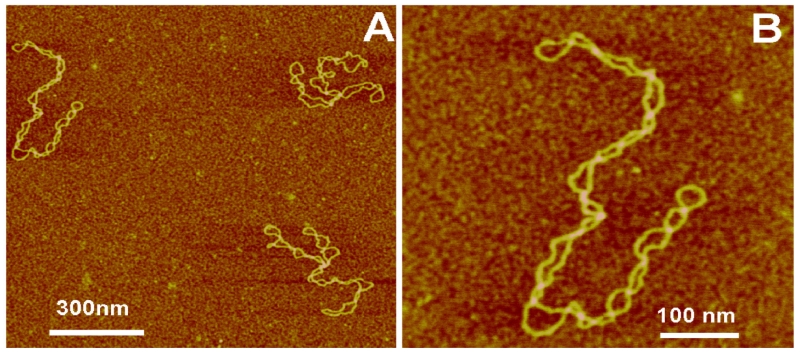
Figure 1 shows images of plasmid DNA, 5.6 kB long, obtained with AFM operating in tapping mode. Frame A shows three different DNA molecules, and the higher-resolution image of DNA is shown on the top-left in frame B. In this image, the DNA strands are interwound, forming a plectonemic morphology of supercoiled DNA. The loops between the intersections of the strands are of relatively similar sizes. These images are in agreement with computational models of supercoiled DNA.42 Two other molecules in frame A show a branched morphology of supercoiled DNA, which is expected for molecules of these sizes.7 DNA is a negatively charged polymer with a rather high linear charge density. Therefore, electrostatic repulsion of the strands plays a critical role in the overall geometry of DNA molecules. This electrostatic effect can be modulated with counterions, producing an ionic strength effect on the geometry of supercoiled DNA. AFM studies directly confirmed this assumption. One study showed that at high ionic strength intersegmental distance in the supercoiled loops decreases, forming very close DNA–DNA contacts.41 Importantly, the formation of tight contacts in the AFM experiments was observed at cation concentrations close to those of physiological ones. Thus, ionic strength modulates the interstrand separation and this juxtaposition is important for numerous genetic processes, such as site-specific recombination.
FIG. 1.
AFM images of supercoiled DNA prepared using AP mica. (A) A large-scale image with three DNA molecules in the field. (B) Zoomed image of the top-left molecule in (A). The supercoiled molecules appear as uniformly twisted filaments with a plectonemic shape [reprinted with permission from Elsevier, Copyright 2011].7
Notably, AFM was the only imaging technique that directly demonstrated the dependence of the geometry of supercoiled DNA on ionic strength. However, sample preparation techniques need to be carefully scrutinized in these studies. The results described above were obtained with the use of the AP-mica procedure. An alternative cation-assisted technique can lead to artifacts. In a study by Nagami et al.,43 AFM images of supercoiled plasmid DNA were obtained using Mg2+-treated mica. The images of supercoiled DNA molecules with this procedure appear to have long tightly twisted segments that are interspersed with large loops that were not observed experimentally with other methods and were not demonstrated in computational analyses. Thus, the use of Mg-assisted techniques can lead to artifacts, and this should be taken into account. Moreover, additional features of Mg2+-treated mica must be noted. In another study, data indicate showed that the persistence length of the DNA deposited with the Mg2+ method is larger than the persistence length of DNA in solution.44 This straightening of DNA during substrate interaction can contribute to the rearrangement of plasmid strands and may lead to changes in the labile morphology of supercoiled DNA.
B. Visualization of Alternative DNA Structures Stabilized by DNA Supercoiling
Formally, the effects of supercoiling on the structure of DNA can be divided into two main categories, global effects as described above, and local. In the following section, we describe AFM studies of local changes of DNA conformations that involve the transition of a short DNA region from a canonical B conformation into alternative structures, such as left-handed Z-DNA, cruciforms, intramolecular triple helices, and unwound regions.
1. Imaging of Cruciforms
A cruciform is formed in DNA sequences with two-fold inverted repeats or palindromic symmetry under unwinding torsional stress from negative DNA supercoiling (reviewed in Sinden45). Cruciforms contribute to various genetic processes, such as the initiation of DNA replication,46 and are putatively equivalent to Holliday junctions, an intermediate in homologous DNA recombination.47 Understanding the characteristics of cruciforms and their impact on global DNA structure and dynamics may help explain their biological functions.
The analysis of the spatial geometry of cruciforms is not a straightforward task. Cruciforms are not thermodynamically stable in linear DNA due to branch migration. EM was used to visualize cruciform structures, but this system involved completely palindromic supercoiled circular DNA, in which the size of the cruciforms varied considerably. The advent of AFM allowed the successful visualization of cruciform.47
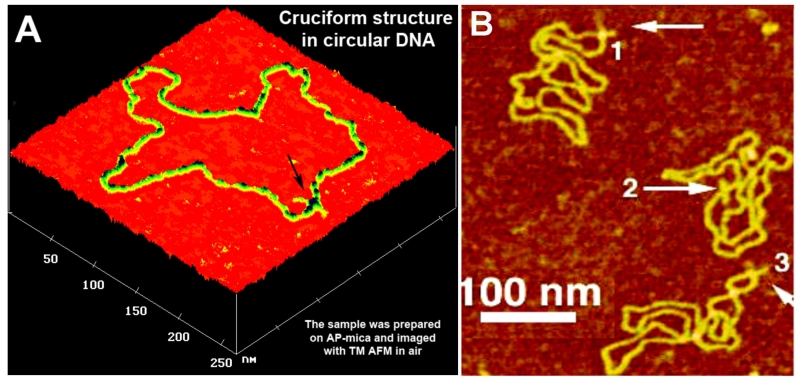
Plasmid pUC8F14C DNA, containing a 106-bp F14C inverted repeat with an expected cruciform arm length of 53 bp was analyzed using AFM. Figure 2 shows one of the AFM images of the sample prepared by deposition from a low-salt solution (TE buffer). The main feature of these DNA images is the presence of rather long extrusions (hairpin arms), as indicated by arrows. Notably, these extrusions have not been observed in supercoiled DNA without an F14C inverted repeat. Several additional facts suggest that these extrusions are the cruciforms of the 106-bp palindrome. First, the size of the arms for the extended extrusions is 15–20 nm, in full agreement with the expected length of the hairpins containing 53 bp (18 nm for B-form DNA geometry). Second, extrusions have been unambiguously identified in more than 80% of the DNA molecules, in good agreement with 2D gel electrophoresis data. Third, the number of molecules with extrusions is less for the sample with lower superhelix density. Importantly, two classes of cruciforms were observed. Cruciforms in an extended conformation (Fig. 2A) are characterized by an angle between the hairpin arms of ~180°. A second class, which represented 70–80% of the population, contained molecules in which the arms form a rather acute angle (X-type geometry, molecules 1 and 3 in Fig. 2B) with the main DNA strands being sharply bent. The experiments were performed with the AP-mica procedure, permitting the deposition and imaging of the sample in a broad range of environmental conditions. Specifically, it was shown that in the presence of high salt or Mg cations, a compact, X-type conformation is highly preferable. Statistical analysis of the inter-arm angle led to the conclusion that the cruciform arms have a high mobility. Imaging in aqueous solutions was performed to directly confirm the dynamics of cruciforms according to the cruciform conformation.47 These data showed that the X-type conformation was very mobile, allowing the hairpin arms to move between the orthogonal and almost parallel orientations. An additional study performed showed that DNA supercoiling is an important factor that defines the cruciform structure and its dynamics.38 Increased supercoiling shifts the equilibrium between folded and unfolded conformations of the cruciform toward the folded state.
FIG. 2.
AFM images of circular pUC8F14C plasmid DNA with (A) an extruded cruciform indicated with an arrow and (B) various conformations of cruciforms indicated with arrows and numbered [adapted from Shlyakhtenko et al.,1998].47
2. The Cruciform as a Molecular Switch for Global Dynamics of Supercoiled DNA
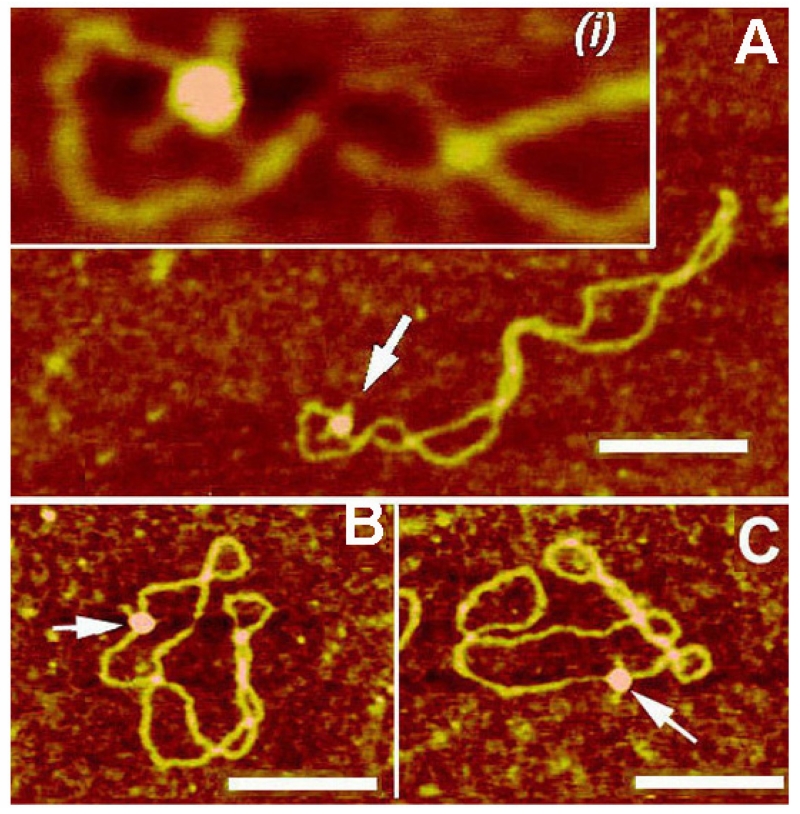
As mentioned above, a fundamental property of circular DNA is the cross talk between local DNA conformations and the global structure of the entire molecule. AFM studies of this cross talk36 revealed a new dynamic process of cruciforms termed a molecular switch. AFM images of cruciforms in Fig. 2B (see molecules 1, 3) show that X-type cruciforms tend to be localized at the loops of the plectonemic superhelix due to a bend in supercoiled DNA. Therefore, the X-type cruciform uniquely orients the plectonemic superhelix in such a way that it occupies an apical position of the molecule, defining the overall spatial geometry of the DNA superhelix. This mechanism was tested by Shlyakhtenko et al 36 by AFM imaging of cruciforms with conformations controlled by adding RuvA protein to stabilize unfolded structures of cruciforms. The most striking feature of the RuvA-unfolded cruciforms is their localization in the molecule. As shown in Figs. 3 A-C, unlike X-type cruciforms, unfolded cruciforms stabilized by RuvA exhibit no preference for an apical position on the superhelix. Statistical analysis revealed that without RuvA bound, 94% of DNA molecules contain cruciforms at an apical position, compared with only 6.5% apical RuvA-bound cruciforms. These data suggest that the reptational motion of the DNA chains in supercoiled DNA is restricted by a cruciform in a compact X-type geometry, but this limitation is eliminated as soon as the cruciform adopts an extended conformation.
FIG. 3.
AFM images of cruciforms in their complexes with RuvA protein. (A) pUC8F14C plasmid DNA. Cruciforms are indicated with arrows and numbered. (B–D) pUC8F14C plasmid DNA with RuvA protein. Cruciforms in complexes with the protein are indicated with arrows. The scale bar is 100 nm. [reprinted with permission from Elsevier, Copyright 2000].36
As mentioned above, DNA supercoiling facilitates a juxtaposition of two distant sites along a molecule to promote DNA transactions such as site-specific recombination, DNA transposition, and gene regulation through loop formation. Contrary to a sequence specific curved segment that induces a permanent bend, cruciforms exist in the molecules transiently, so the sequence-dependent orientation of the superhelix can be turned on or off depending on cruciform formation. Thus, cruciforms may function as a molecular switch to control DNA transactions.
3. Other Alternative Structures in Supercoiled DNA Visualized with AFM
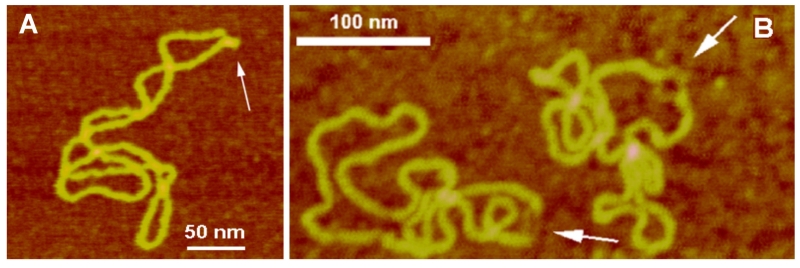
Homopurine-homopyrimidine (Pu-Py) tracts are overrepresented in genomes of eukaryotes and prokaryotes, and several classes of Pu-Py binding proteins have been described (reviewed in Sinden45). DNA supercoiling induces a transition in homopurine-homopyrimidine (Pu-Py) mirror repeat tracts to an intramolecular triple helix (triplex), also termed H-DNA. The major elements of H-DNA are the triplex and the unpaired half of the Pu or Py strand. A number of models have been suggested that describe a role of intramolecular triplexes in gene expression, DNA replication, recombination, and stabilization of telomeric structures (reviewed in Mirkin48). However, structural visualization of intramolecular triplexes within plasmid DNA were not possible until the AFM studies by Tiner et al.49 Acidic pH values stabilize intramolecular triplexes; therefore, plasmid samples were prepared at acidic pH, and control samples were prepared at neutral pH, and both samples were deposited onto APS-mica (AFM images Fig. 4A). The kink formation with a short protrusion indicated with arrows is a distinct feature of the sample prepared at an acidic pH. The formation of a sharp kink is fully consistent with the model of an intramolecular DNA triplex. Additionally, note the presence of the apical location of an H-DNA structure, suggesting that H-DNA formation, similarly to cruciforms, can also function as a conformational switch of supercoiled DNA. AFM studies were also performed with long, imperfect pyrimidine-purine (Py-Pu) inserts.50 The studies showed that this insert adopts an H-DNA conformation, although spatial morphologies varied.
FIG. 4.
AFM images of various alternative DNA structures. (A) AFM images of H-DNA stabilized by negative DNA supercoiling. The H-DNA structure is indicated with an arrow. (B) AFM images of bulges in supercoiled DNA formed by the supercoil induced dissociation of the duplex at the (ATTCT)29 region. Open regions are indicated with arrows [reprinted with permission from the American Chemical Society, Copyright 2002].40
Negative DNA supercoiling has the effect of stabilizing open DNA regions within long duplex, but this has a very low probability of occurring in linear DNA molecules.51 DNA unwinding is an important aspect of DNA replication and transcription; therefore, it is important to increase our understanding of the unwinding process. Transcription requires unwinding of DNA segments as large as ~20 bp.52
AFM visualization of opened DNA segments was reported by Potamon40 and Potamon et al.53 The repeat (ATTCT)29 was cloned into the plasmid, and the plasmid was imaged with AFM under conditions facilitating the opening of the local duplex. An example of an alternative DNA structure, such as this, is shown in Fig. 4B, with opened regions indicated with arrows. Remarkably, this local DNA structure is dramatically different from H-DNA and cruciforms. A strong kink, a characteristic feature of H-DNA, is not present in bulged DNA. The stable existence of unpaired segments in the DNA at regions of torsional stress, corresponding to DNA supercoiling in vivo, prompted Potaman et al. to suggest that unpaired DNA regions are critically involved in the initiation of DNA replication. The sequence studied in that paper was a pentanucleotide repeat expansion that is associated with Spinocerebellar ataxia disease. The discovery of the stable existence of these DNA repeats led to the model of the disease-prone expansion of the ATTCT pentanucleotide motif.
IV. AFM OF PROTEIN–DNA COMPLEXES: STATIC AFM DATA
The development of reliable methods for imaging DNA has led to the application of AFM to image various protein–DNA complexes. Below, we review a few AFM studies that increase our understanding of complex biological processes.
A. Site-Specific Protein–DNA Complexes
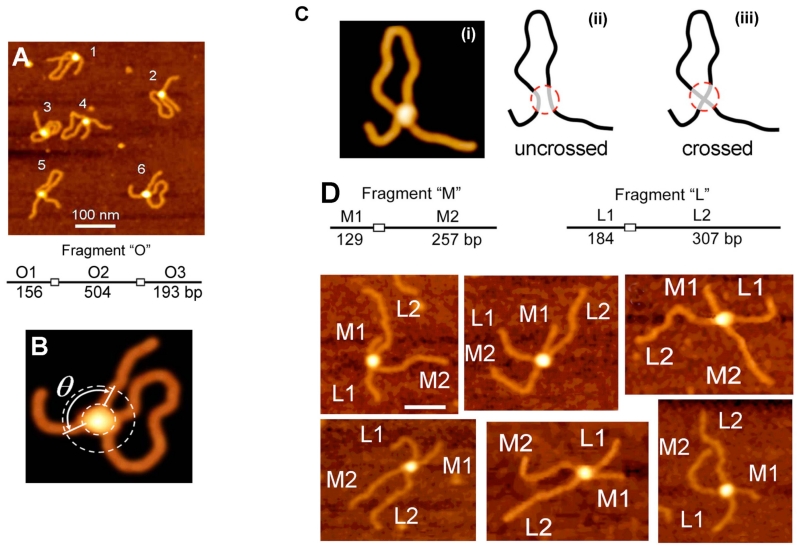
SfiI is a site-specific DNA binding protein that binds two DNA recognition sites to stimulate DNA cleavage. Because of this, an SfiI system shares a umber common features with site-specific DNA recombination systems and therefore can be considered as a model for studies of site-specific recombination complexes. In a study by Lushnikov et al.,54 AFM was applied to better understand a number of unknown properties of SfiI. In the majority of cases, SfiI binds to two distant sites in the same DNA molecule (cis complexes). Therefore, complex formation should lead to looping out of the DNA segment between the two recognition sites. AFM images in Fig. 5A illustrate the formation of these cis complexes. DNA cleavage requires Mg2+ cations; however, in the presence of calcium (Ca2+) cations restriction is terminated, although complex formation occurs. Therefore, the assembly of the synaptic complex was studied in the presence of Ca2+ cations. A zoomed image of one of these complexes is shown in Fig. 5B. The protein appears as a bright globular feature holding two DNA sites. Length measurements were performed to validate the specific binding of SfiI to this DNA substrate. Additionally, the ability of AFM to measure molecules in 3D allowed SfiI protein stoichiometry to be determined. Molecule size can be determined from the volume measurements of the protein. However, due to the tip convolution effect, AFM requires the calibration of the protein volume against proteins of known molecular weight to evaluate the protein mass (e.g., see the review by Fuentes-Perez et al.55). The volume measurements showed that SfiI binds to DNA as a tetramer, which were consistent with biochemical data.
FIG. 5.
AFM study of SfiI-DNA complexes. (A) and (B) AFM images of synaptic SfiI-DNA complexes formed between two recognition sites separated by 504 bp (left). (C) Models of the possible arrangement of DNA strands in the synaptic complex SfiI-DNA. (D) Complexes formed by SfiI by synapsis of M and L DNA fragments (trans type complexes). The schematic for the fragments is shown on the top and the AFM images are below. The flanks M1, M2 and L1, L2 are assigned according to their length measurements [reprinted with permission from the American Chemical Society, Copyright 2006].54
An important feature of site-specific DNA recombination systems is the arrangement of DNA recognition sites within the protein. An AFM image of the looped complex is shown in Fig. 5C frame (i). The binding sites can be oriented either side-by-side or in a crossed mode, as schematically shown as frames (ii) and (iii) of Fig. 5C. Model (ii) shows a side-by-side assembly, and the right panel shows the crossed orientation of the recognition sites. The AFM image in frame (i) does not allow one to distinguish between the two binding modes. The approach developed Lushnikov et al.54 resulted in the identification of the binding model. The approach is illustrated in Fig. 5D. The synaptic complex is formed in trans mode in which two DNA substrates M and L containing only one specific site for SfiI are used. However, with the use of two substrates, homologous complexes (M-M and L-L) and heterologous M-L complexes are formed. The complexes can be identified by the length of flanks between the specific site and the ends of the fragments. Schematics for M and L fragments with the arms’ lengths, as shown in the top of the figure, made it possible to differentiate each complex by the length measurements. AFM images graphically illustrate how differentiation can be made. Both DNA substrates were mixed together in the presence of SfiI to allow trans type intramolecular complexes to assemble. The AFM images in Fig. 5D show a few typical examples of such trans complexes. Statistical analysis of the length measurements over hundreds of such complexes led to the conclusion that the DNA strands in the SfiI synaptosome are crossed.
AFM images for cis and trans complexes (Figs. 5B) show that the DNA arms are oriented at an angle, suggesting that the recognition DNA sites within the synaptosome are oriented at an angle. The angle measurements demonstrate that the mean angle values are grouped between 60° and 120°. This finding led the authors to two conclusions. First, the DNA segments are not parallel, but oriented at a specific angle. Second, the double peak distribution suggests that two orientations of the DNA recognition site are possible. Both populations appeared to be equal, suggesting that the two possible orientations of the helices were formed almost equally and that there are no preferential orientations of the DNA cognate site within the complex. The entire DNA binding region (5’-GGCCNNNNNGGCC-3’) is not fully symmetric, and AFM data on the symmetry of SfiI binding suggests that the central part of the recognition site on DNA is not essential for binding specificity and the protein very likely has no direct contacts inside the NNNNN motif of the DNA spacer. This AFM prediction and the arrangement of the DNA segment in complexes with SfiI were consistent with the crystallographic model for SfiI-DNA complexes.56
It is important to note that the Mg-assisted technique does not work here, as the enzyme will cleave DNA in the presence of Mg2+ cations. However, this is not an issue for the APS-mica procedure. The synaptic complexes were assembled and analyzed in the presence of Ca2+ cations to prevent DNA cleavage.
B. Role of SSB Protein in Targeting a Stalled Replication Fork by RecG Helicase
DNA replication is a complex process in which the movement of the replication fork by the replication machinery is interspersed by pauses during which problems with the DNA template are repaired. The primary repair mechanism involves the reversal of the replication fork and formation of a Holliday junction. The homologous DNA repair machinery recognizes Holliday junctions and repairs defects that led to the replication stall. ATP-dependent RecG helicase is a key contributor to reversal fork movement and has a high affinity to the stalled replication fork. Crystallographic data for RecG in complex with fork DNA led to a model for fork recognition in which one of the RecG domains interacts with the replication fork, while two other domains bind to the parental DNA duplex.57 However, these data do not answer a number of questions. First, there are only a few proteins per cell, and it is unclear how RecG recognizes and is recruited to a stalled fork efficiently. Second, the activity of RecG in the early stages of fork rescue is enhanced and controlled by single-stranded DNA binding protein (SSB),58–61 but the mechanism of this interaction remains unclear. These issues were addressed in another study in which where AFM was used to characterize the interactions of fork DNA substrates with SSB and RecG.62
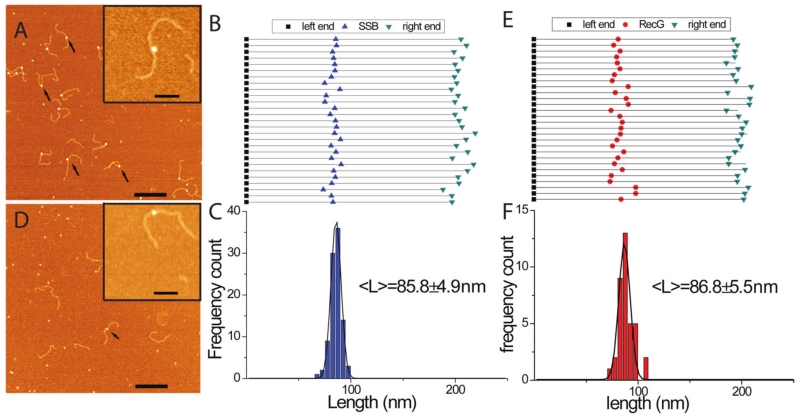
The DNA substrate contained a 3’-end 69-nt single-stranded DNA (ssDNA) segment inserted between two DNA duplexes of different lengths (255 and 355 bp). According to the crystallographic model, two domains of RecG form a complex with the parental duplex DNA ahead of the fork, while the wedge domain interacts with the ssDNA segment of the fork. The substrate binds SSB protein, as seen in the AFM image (Fig. 6A) in which SSB appears as a bright feature located within the DNA substrate. The yield of the complexes was as high as 85.3±3.8%. The locations of SSB on the DNA molecules were mapped, and the results in Figs. 6B and 6C directly illustrate the correlated position of SSB on different molecules corresponding to the expected position of the fork within the DNA substrate.
FIG. 6.
AFM analysis of the interaction of SSB and RecG with the fork DNA substrate. (A) and (D) show representative AFM images of SSB and RecG only on the fork DNA. Arrows point to the complexes. Bar size is 200 nm. Insets show enlarged images of the complexes. Bar size = 50 nm. (B) and (E) show maps for the positions of SSB and RecG, respectively, on the DNA substrate. The DNA molecules were aligned by the left end of the parental flank without normalization of the molecules lengths. (C) and (F) are the distributions of the proteins distances from the left end for SSB (n=95) and RecG (n=37), respectively [reprinted with permission form Nature Publishing Group, Macmillan Publishers Ltd. Creative commons license, Copyright 2015].62
Similar experiments were performed with RecG. In the AFM image shown in Figure 6D, RecG molecules on the DNA can also be seen (indicated by arrows). Even though this is the preferred substrate for RecG, the yield of protein–DNA complexes was only 10%. This is significantly lower than SSB, although a two-fold higher concentration of RecG was used. RecG’s DNA binding sites were mapped (Figs. 6E and F). The mean value for the lengths of the left flank of the DNA molecules was 86.8 ± 5.5 nm, corresponding to the fork position in the DNA substrate (86.7 nm). A visual comparison of the images for fork DNA-protein complexes shows that the brightness of the SSB molecules is higher than that of the RecG molecules, which is consistent with the height and volume measurements for the two proteins. These differences in height and volume become critical in distinguishing SSB from RecG when they are bound to the same DNA molecule.
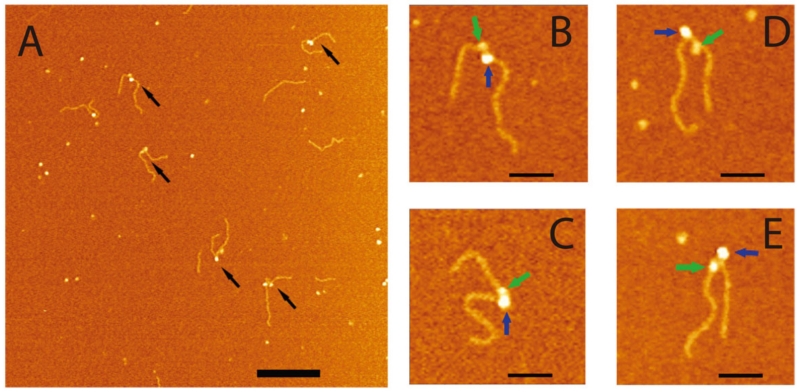
Figure 7A shows AFM images obtained from experiments in which both SSB and RecG were bound to the same DNA substrate. A new feature evident in this image is the appearance of complexes containing two molecules, as indicated by arrows. Four zoomed images of double-molecule complexes are shown in plates B–F, where two molecules with different sizes are indicated with green and blue arrows. The volumes and heights of the molecules in the double-molecule complexes were very close to the values obtained for the individual SSB–DNA and RecG–DNA complexes. These data demonstrate that RecG is capable of binding to the DNA fork in the presence of SSB because the two proteins appear on the same DNA substrate simultaneously. Two additional features emerged from the AFM studies. First, the efficiency of RecG binding in the presence of SSB increases three-fold (~30.3% in the double complexes vs. 9.7% in the RecG–DNA complexes only). Second, RecG in the presence of SSB does not occupy the fork position. Rather, statistical analysis of the length measurements showed that the position of RecG is shifted away from the fork position by the mean distance of ~ 35 bp. The translocation activity was not observed when the RecG-DNA complexes were assembled without SSB, suggesting that interaction with SSB is required to allow RecG to translocate along the duplex DNA.
FIG. 7.
AFM images of the complexes made by SSB and RecG with the fork DNA substrate. (A) Large scale AFM images, in which double-particle features are indicated with arrows. Bar size is 200 nm. Zoomed images (B-E; bar size = 50 nm) of four double-particle complexes. Large and small particles are indicated with blue and green arrows, respectively. The black and green arrows point to SSB and RecG proteins in the double-particle complexes. The figure was reproduced from paper respectively [reprinted with permission form Nature Publishing Group, Macmillan Publishers Ltd. Creative commons license, Copyright 2015].62
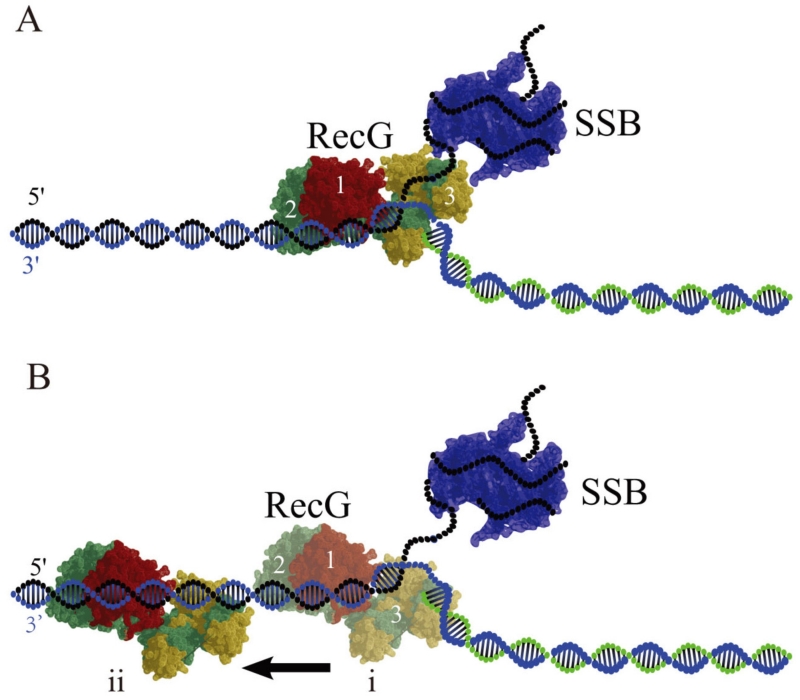
These studies suggest that interaction of SSB with RecG induces remodeling of RecG, enabling the protein to translocate along the DNA duplex. According to Fig. 8A, RecG initially binds to the fork using its three DNA binding domains. Then the RecG wedge domain 3 disengages from the fork, but domains 1 and 2 remain bound to the DNA duplex (Fig. 8B(i)). As a result, RecG loses the “hook” that kept it bound to the fork, allowing the protein to translocate along the duplex (Fig. 8B(ii)). The mean migration range is as large as ~35 bp, suggesting that RecG in this binding mode is capable of scanning rather large DNA segments. Importantly, RecG remains within the fork vicinity and can be recruited for fork regression when the fork stalls. Thus, RecG remodeling is the mechanism by which RecG remains in proximity of the replication fork. Note that fork regression requires ATP hydrolysis,63 whereas translocation by remodeled RecG is a thermally driven process and does not require ATP.
FIG. 8.
Models for RecG binding to the DNA fork in the presence of SSB. (A) No interaction with SSB. In the type 1 complex, RecG binds specifically to all arms of the fork, with domains 1 and 2 binding the parental DNA duplex, whereas the wedge domain 3 binds the single-stranded arm of the fork. SSB occupies the ssDNA arm of the fork. (B) In the type 2 complex formed after SSB remodeling, the wedge domain 3 dissociates from the ssDNA arm, but domains 1 and 2 remain bound to the parental DNA flank, enabling RecG to translocate along the duplex as shown in (i) and (ii). Model (i) shows the RecG position at the fork just after remodeling and (ii) shows the RecG position after translocation away from the fork respectively [reprinted with permission form Nature Publishing Group, Macmillan Publishers, Ltd. Creative commons license, Copyright 2015].62
Although SSB is considered an architectural single-stranded DNA binding protein with no sequence specificity for binding DNA, recently accumulated evidence suggests that SSB interacts with more than a dozen proteins.64 The experiments described above demonstrate a novel role for SSB in which SSB dramatically increases RecG loading efficiency onto the DNA fork. Moreover, SSB acts as a remodeling factor for RecG, causing RecG to disengage from the fork but remaining bound to the parental duplex. Importantly, the C-terminus of SSB is necessary for these novel SSB functions, which is in agreement with earlier findings on the role of the SSB C-terminus during protein interactions.64 Interestingly, the fact that SSB and RecG do not form stable complexes that could be detected by AFM suggests that the interaction is transient. It is reasonable to assume that the active role of SSB is not limited to the DNA replication process because SSB is also involved in other genetic processes.
C. AFM to Study the Mismatch Repair Apparatus
The DNA mismatch repair (MMR) system is an important cellular system that corrects DNA synthesis errors that occur during replication.65 As a result, the fidelity of DNA synthesis increases by several orders of magnitude. The 2015 Nobel Prize was awarded to P. Modrich for the discovery of MMR and its functions; this discovery exemplifies the progress in the understanding and appreciation of the process of MMR. Various techniques have been used to characterize MMR, including AFM.
The MMR process in Escherichia coli begins when the protein complexes MutS and MutL recognize DNA lesions, followed by the recruitment of MutH, which creates an incision at the DNA lesion. Erie et al.,66 in their early AFM study, determined how MutS recognizes the mismatch. They applied AFM topographic imaging to identify complexes of MutS with specific and nonspecific complexes using DNA substrates in which the mismatch position was introduced at a desired location. MutS binding caused the DNA duplex to bend at an angle that was measured by AFM. They found that MutS binding to a homologous region induces a bend of a defined angle, but binding to the mismatch leads to bent and straight complexes. On the basis of these studies and other biochemical and crystallographic data, the authors proposed a model in which the protein conformation is dependent on the DNA target type. MutS bends DNA while searching for the target and changes the conformation when it hits the target. The protein undergoes a conformational transition leading to the formation of a kinked complex, followed by an additional conformational transition and formation of straight DNA within the complex. Later, this group used a set of MutS mutants with alterations in sites that are responsible for DNA bending and straightening to show that Phe is a key residue in the mismatch recognition pattern.67 This group also applied AFM to determine why MutS has a low affinity to mismatches in gel-shift experiments.68 They developed the AFM-based method to evaluate protein–DNA binding constants and applied this methodology to the MutS-DNA complexes. They showed that MutS has a high affinity to the ends of DNA duplexes, and this binding property masked the high affinity of MutS to the mismatch. AFM imaging allowed the identification of specific complexes only. The approach developed to measure binding constants can be useful for AFM studies of protein–DNA complexes.
Recently, Marszalek et al.69 used AFM to characterize the interaction of the complete MutS-MutL-MutH system with a mismatch.69 From the high-resolution AFM images, they were able to identify the assembly and disassembly of the repair system. Interestingly, they discovered that MutS acts as a scaffold to promote the assembly of MutL and MutH. The authors also observed looped DNA structures, which they interpreted as bridging the mismatch and hemi-methylated GATC sites via the Mut-complex. The ability to observe such a complex and dynamic system with AFM is important for the further analysis of this and other complex protein–DNA systems.
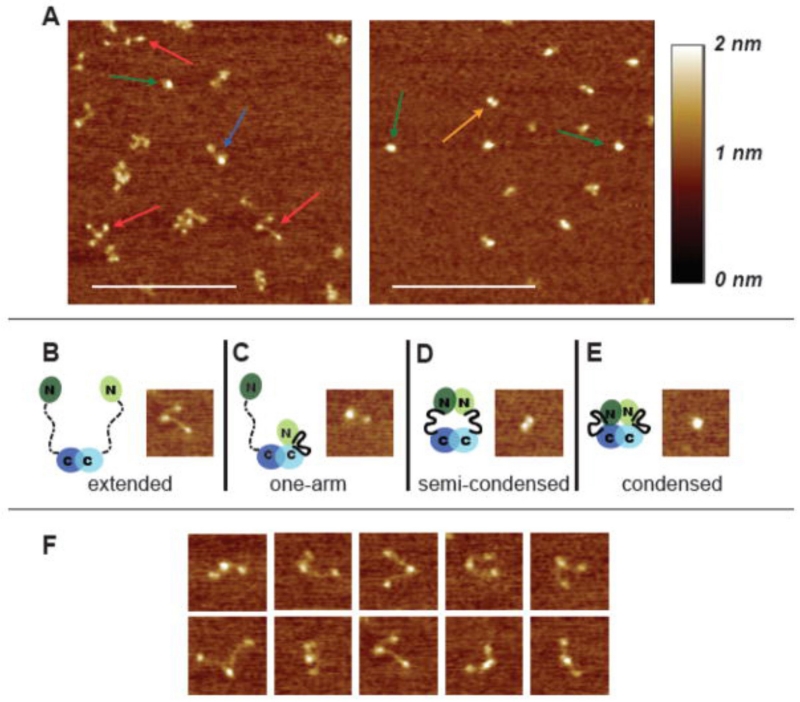
Modrich et al.70 used AFM to characterize a full-size MutL protein that is a homolog of prokaryotic MutL protein. This protein contains a long unstructured segment (UNS), which makes it problematic to study a full-size MutL with traditional X-ray crystallography. MutL assembles as dimers, and AFM images in Fig. 9A illustrate the morphological heterogeneity of the protein. Moreover, the morphology depends on ADP that causes the protein to collapse. Frames B to E show a set of conformations. Frame B shows the protein morphology in which three globular features are connected with two fibrillar segments that are unstructured. Additional three-blob assemblies are shown in Fig. 9F. The schematic in frame B explains the assembly. Based on the known properties of MutL, it has been proposed that two monomers interact by their C-terminal globular segments to form the three-blob structure. The structure can collapse to form the assembly shown in frame E, passing through the states shown in frames C and D. The analysis of the AFM data led to the conclusion that during the ATPase cycle in which sequential nucleotide binding, hydrolysis, and release occurs, MutL undergoes a series of conformational changes. It is hypothesized that conformational changes, modulated by adenine nucleotides, mediate the interactions of MutL with other proteins in the MMR pathway, thereby coordinating the recognition of DNA mismatches by MutS and the activation of MutL with the downstream events that lead to repair.
FIG. 9.
AFM images of yMutLα. (A) 500-nm × 500-nm images of MutLα deposited in the absence of nucleotide (left) and in the presence of 5 mM ADP (right). Arrows point to examples of the four different conformational states seen in the images: red = extended; blue = one armed; orange = semi-condensed; green = condensed. Scale bar (white) is 250 nm. (B–E) 100-nm × 100-nm images of the four states accompanied by cartoons of MutLα in the different conformational states. In the cartoons, domains are indicated by ovals, connected by a flexible linker. A disordered linker is shown as a dashed line; an ordered linker is shown as a solid heavy line. Mlh1 is shown in light green and blue, and Pms2 (yPms1) is shown in dark green and blue. (F) A selection of 100-nm × 100-nm images of the extended state to show the flexibility of the linker arms [reprinted with permission from Elsevier, Copyright 2008].70
D. Single-Stranded DNA Binding Proteins
SSBs have a high affinity to single-stranded DNA (ssDNA) and participate in all genetic processes involving ssDNA as an accessory protein.71–77 SSB proteins play a role in the separation of DNA strands during replication and prevent the ssDNA from reforming as a double helix. During homologous recombination, SSB proteins are involved in the formation of RecA-DNA filaments by regulating the process of loading RecA onto ssDNA.76 The interaction of SSBs with other recombination mediator proteins, such as RecO, facilitates the annealing step via the SSB-induced conformational change of SSB–ssDNA filaments.78 EM and AFM are instrumental in elucidating the mechanism of SSB–DNA interactions. However, the high flexibility and smaller filament height of single-stranded DNA are two major factors that complicate the reliable visualization of ssDNA–SSB complexes. A hybrid DNA approach has been proposed by Shlyakhtenko et al.79 that eliminates these complications.
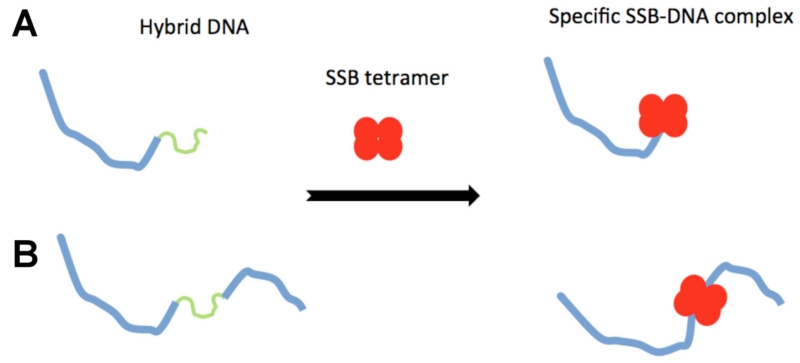
In this approach, illustrated schematically in Fig. 10, the DNA construct consists of a relatively long DNA duplex, to which ssDNA of the desired length is attached. In the tail DNA design (Fig. 10A), the ssDNA segment is located at the end of the duplex, whereas in the gap-DNA design, the DNA duplexes flank the ssDNA segment (Fig. 10B). The duplex part of the construct functions as a marker, enabling the unambiguous identification of nonspecific SSB–DNA complexes. If the protein binds specifically to tail DNA, the complex will attach only to one end of the hybrid DNA (Fig. 10A), while specific interactions with gap-DNA will lead to complex formation in which the protein is located inside the design (Fig. 10B). The length measurements of the duplexes allows target recognition specificity to be characterized.
FIG. 10.
Scheme for the hybrid DNA constructs for tail ssDNA (A) and gap-DNA (B) substrates.
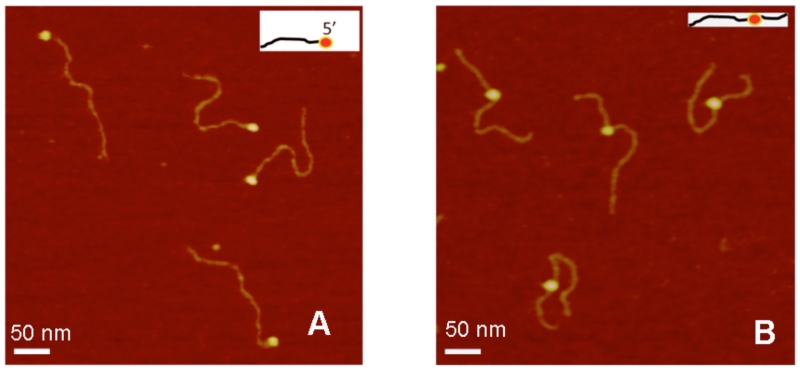
AFM images of the complexes prepared for tail and gap DNA substrates taken from another study by Shlyakhtenko et al.80 are shown in Fig. 11. The proteins appear on AFM images as bright blobs located at one end of the DNA substrate for tail DNA (plate A) or inside the duplex for gap DNA (plate B), which is consistent with the expected model. These data directly illustrate that SSB binds specifically to its target single-stranded segment of the substrate. However, this specific binding requires high-salt conditions or the presence of Mg2+ cations.80 In their absence and in low ionic strength, SSB loses its high substrate specificity.
FIG. 11.
AFM images for complexes of SSB with hybrid DNA of different types. (A) and (B) are AFM images of complexes with 5’-tail-DNA and gap-DNA, respectively. The insets show the schematic presentations of the complexes [reprinted with permission from the American Chemical Society, Copyright 2012].80
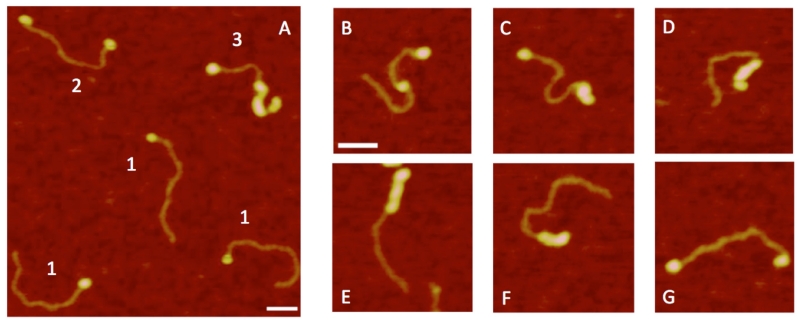
This effect is clearly seen in Fig. 12 in the AFM images in which SSB is complexed with the tail DNA substrate. SSB, seen as bright protein blobs, can bind to both ends or even inside the DNA duplex. Additionally, the images reveal that the DNA duplex can be coated with SSB protein. These findings suggest that SSB undergoes a conformational change induced by low ionic strength.80 These conformational changes not only eliminate substrate recognition by the protein, but also increase interprotein interactions. This process is illustrated by images showing that blob sizes are larger under conditions with low ionic strength than under high salt conditions.
FIG. 12.
AFM images for complexes of SSB with tail hybrid DNA obtained in low ionic strength and in the absence of Mg2+ cations. (A) Large scale image with various types of complexes indicated with numbers. Plates (B-G) show individual complexes of different morphologies of SSB aggregates [reprinted with permission from the American Chemical Society, Copyright 2012].80
V. TIME-LAPSE AFM OPERATION
One of the most attractive features of AFM for biological applications is the ability of the instrument to acquire images in aqueous solutions. First, the sample is imaged in a fully hydrated state, which is extremely important for the imaging of biological samples. Second, the dynamics of the sample can be observed from a set of consecutive images. In this mode, termed time-lapse imaging, dynamics of molecules or their interactions can be visualized. This is a unique property of AFM among all nanoimaging techniques. Finally, imaging in liquid eliminates the effects of capillary forces that are the major complicating factor that decrease the spatial resolution of AFM during gentle imaging conditions. The reliable visualization of molecules with AFM requires them to be stably bound to the surface. At the same time, to image single-molecule dynamics, the DNA must be loosely bound to permit the relatively free movement of the molecule at the surface. Therefore, the sample preparation procedure must be adjusted to reconcile these conflicting requirements.
The history of time-lapse AFM imaging began with the pioneering work of Hansma et al.,81 who directly observed the process of fibrin self-assembly into aggregates. Since this early work, single-molecule AFM imaging techniques have been applied to various processes, including (1) observing how RNA polymerase moves along DNA,13,21,82–84 (2) characterizing local and global dynamics of supercoiled DNA,11,25,28,38 (3) directly visualizing Holliday junction branch migration,25,85 (4) chromatin dynamics,30,86 (5) conformational dynamics of membrane proteins,87–89 and (6) detecting single-molecule receptor dynamics in the membranes of living cells.89,90 Novel properties of molecular systems were discovered with these time-lapse studies. A number of examples, including the dynamics of DNA Holliday junctions and the dynamics of some protein–DNA complexes, are reviewed below.
A. Visualization of Holliday Junction Branch Migration
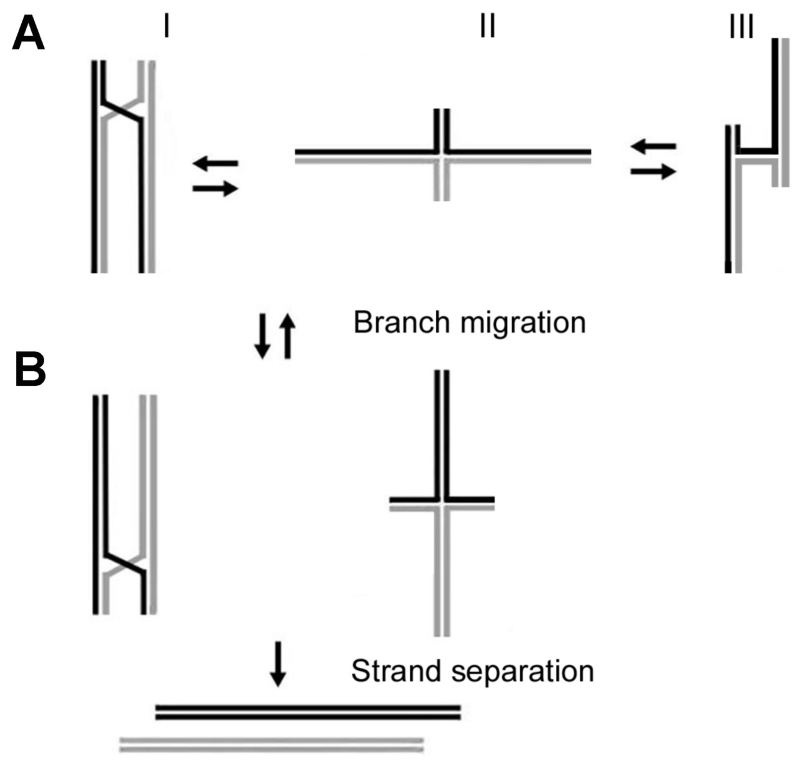
The Holliday junction (HJ), proposed in 1964 by Robin Holliday, is a central intermediate in homologous and site-specific recombination. This type of DNA structure is also involved in double-stranded break repair and is a critical intermediate in restoring a stalled DNA replication process. The arrangement of two DNA molecules as a HJ assembly allows for the exchange of DNA duplexes by the process termed branch migration. According to the schemes shown in Fig. 13A, different arrangements of the junction arms are possible. Exchanging arms can be arranged in parallel (I) or antiparallel (III) conformations. An antiparallel arrangement does not allow branch migration (model III), which is the primary property of HJ. However, HJ with completely asymmetric sequences assemble in antiparallel conformations, as confirmed by various techniques including X-ray crystallography. AFM studies of cruciform structures that are models for naturally existing homologous HJ showed that model I is preferable, suggesting that sequence symmetry is the primary factor that contributes to HJ structural dynamics.36,39,47 Conformations I and II are capable of branch migration. A textbook model proposed in the early 1970s91 suggests that HJ utilize the parallel orientation during the exchange process (model I). In this model, HJ migration is accompanied by rotatory diffusion of the DNA duplexes along the major helix.92 An alternative model suggests that an extended configuration of the junction (model II) is more appropriate for spontaneous movement of the HJ.93–95 Notably, protein-mediated branch migration with E. coli RuvAB complexes utilizes this pathway. RuvA stabilizes the extended conformation of the junction36 and two RuvB helicase assemblies bind to opposite arms of the junction to promote branch migration.
FIG. 13.
The models for Holliday junction and branch migration. (A) Models I, II, and III correspond to the HJ conformations with the exchanging arms in the parallel arrangement, extended conformation, and antiparallel arrangement, respectively. (B) Assembly of HJ after the multiple branch migration steps. HJ in the antiparallel conformation III cannot undergo branch migration, but the other two conformations can. (C) The competition of branch migration leading to the separation of the DNA duplexes [reprinted with permission from the American Chemical Society, Copyright 2009].86
It is possible that protein-mediated branch migration of HJ and spontaneous branch migration follow different mechanisms. The model of spontaneous HJ branch migration was tested by Lushnikov et al.85 Homologous HJ capable of branch migration, as shown in Fig. 13, were assembled from two DNA molecules and their dynamics were visualized using time-lapse AFM. The junction was assembled in the presence of Mg2+ cations that almost stalls the branch migration process. In time-lapse AFM experiments, the HJ sample was injected into an AFM flow cell mounted on APS-mica and continuously imaged by AFM without drying the sample. A selected area with unambiguously identified HJs was scanned continuously, and branch migration was induced by changing the buffer and removing Mg2+ cations without interrupting scanning. A few frames taken from a large set of continuous frames from Lushnikov et al.85 are shown in Fig. 14. The initially folded arms (frame a) subsequently move to an extended conformation (frame b). One of the short arms is barely seen in frame c due to branch migration, resulting in the dissociation of the molecule into two linear strands, as seen in frame d. No branch migration was observed if the junction remained folded. Statistical analysis of the AFM data was performed to confirm that junction unfolding and the formation of an extended conformation (model II) is needed for HJ migration. The relatively rapid dissociation of the junction is observed in two adjacent time-lapse frames (frames c and d in Fig. 14), suggesting that the branch migration process is considerably faster than the AFM scanning process that produced two adjacent frames with a 1-min interval. This finding was confirmed by Karymov et al.96; they used single-molecule FRET experiments to study branch migration with base-pair resolution. This study showed that HJ branch migration is a step-wise process in which spontaneous migration is interrupted by junction folding that occurs over dozens of milliseconds. The branch migration step is estimated to be as fast as 100 μs, and one branch migration hop can be larger than one base pair, a feature that can accelerate the entire branch migration process.
FIG. 14.
Time-lapse AFM images (a to d) illustrating branch migration of the Holliday junction [reprinted with permission from the American Chemical Society, Copyright 2009].86
It is remarkable that AFM has the capability to reveal the structural dynamics of HJ, which is not amenable to any other current structural technique. Overall, the time-lapse AFM observations directly and unambiguously support a model for branch migration in which the extended conformation of the Holliday junction, rather than folded ones, are required for branch migration. Notably, unfolding of the HJ is required for protein-mediated branch migration. In E. coli, RuvA accomplishes this unfolding, as confirmed by AFM imaging.36
B. Dynamics of Protein–DNA Complexes
A number of groups have successfully used time-lapse AFM to analyze biological samples. The joint efforts of Hansma et al. and Bustamante et al. demonstrate the ability of time-lapse AFM to image the assembly process of RNA polymerase-DNA complexes.83 In their later publication, these groups visualized polymerase sliding along DNA97 and showed that diffusion of RNA polymerase along DNA was a mechanism that allowed accelerated promoter detection. The time-lapse experiments described by Guthold et al.98 showed that in addition to sliding, an enzyme could jump from one site to another. Substantial improvements in DNA immobilization procedures contributed to these findings. These researchers modified the cation-assisted immobilization technique to allow loose DNA binding that permitted the molecule to move relatively freely over the surface. They used different kinds of divalent cations to reconcile conflicting experimental requirements. The real-time visualization of enzymatic degradation by a nuclease was performed by Benzanilla et al.99 The data acquisition time was accelerated by using the phase-imaging mode, which made it possible to visualize DNA replication by Sequenase™ in real time by Argaman et al.100 These researchers assumed that DNA segments between the anchoring points on the surface move freely over the surface and are available for protein interaction.
C. Structure and Dynamics of Chromatin Studied with AFM
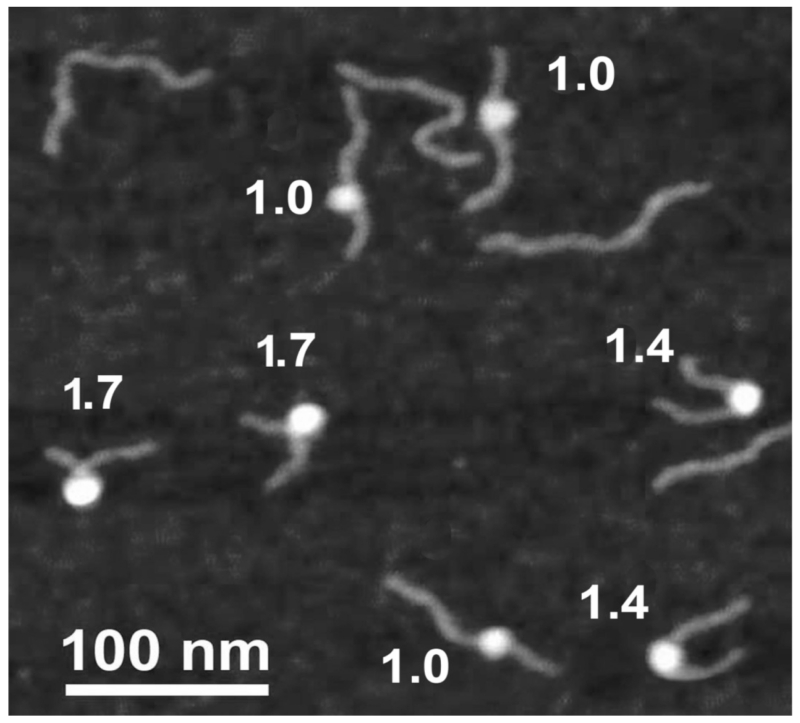
AFM studies of chromatin have been reviewed recently by Kalle et al.101 and Strappe et al.102 Below, we review studies that were focused on chromatin dynamics by time-lapse AFM.86,103–105 Mononucleosomes are typicaly used in experimental systems to study chromatin dynamics. A series of pioneering papers by J. Widom et al.106–108 reported on the use of fluorescence and enzymatic approaches to probe nucleosome dynamics. These studies showed that the local opening of nucleosomes occurs in the millisecond time scale; however, unknown properties (e.g., the size of the openings, their locations relative to the nucleosomal ends, and the model by which the DNA segments become unfolded) required other approaches. Time-lapse AFM imaging was used to directly visualize the dynamics of mononucleosomes by Shlyakhtenko et al.109 The DNA template designed for these studies was a 353-bp DNA fragment containing the 147-bp nucleosome positioning Widom-601 sequence,106 flanked by two regions of different lengths, 79 bp and 127 bp. The position of the nucleosome in this design is determined by the length measurements of the DNA flanks. Figure 15 shows AFM images of mononucleosomes assembled on the 353 bp DNA template, with the nucleosome seen as a bright particle located between the DNA flanks. Upon DNA wrapping, the lengths of the arms gradually decrease while the size of the nucleosome core increases. DNA wrapping is accompanied by a change in the inter-arm angle. Both parameters were used to determine the number of DNA turns in the NCP particle. The numbers in the figure indicate the number of DNA turns for each particle. This value varied between 1.0 and 1.7 turns and indicates the various amounts of DNA that wrap around NCP particles. These data suggest that mononucleosome particles are dynamic. This hypothesis was tested by time-lapse imaging of nucleosomes, as described below.
FIG. 15.
AFM image taken in air of reconstituted mononucleosomes. Particles marked 1, 2, and 3 are nucleosomes with ~1.7, ~1.4, and ~1.0 turns of DNA wrapped around the histone core particle [reprinted with permission from the American Chemical Society, Copyright 2011].105
Figure 16A shows images from the dataset obtained by Shlyakhtenko et al.109 and illustrates the dynamics of one selected NCP particle with ~2 DNA turns. Initially, the fully wrapped NCP particle in frame 1, slightly unwraps between frames 1 and 2, with the unwrapping process appearing more evident in frame 3. The NCP retains its geometry over 3 frames in a row (frames 3–5). Between frames 5 and 6, the NCP loosens and unwraps again in frame 6. It remains unchanged in frame 7 and finally undergoes full dissociation in frame 8. The length measurements (Fig. 16B) show that nucleosome dissociation is accompanied by unwrapping of both DNA flanks, although during the final stages (frames 6 and 7), the process is asymmetric with substantial elongation of one arm over the other. Similar observations led to the conclusion that the nucleosome undergoes spontaneous dissociation, although the specific pathway can vary from particle to particle. The example described above illustrates a non-uniform dissociation pathway; however, examples of uniform time-dependent dissociation have been reported as well.109
FIG. 16.
Time-lapse AFM study of the nucleosome unwrapping process. (A) Consecutive AFM images of the nucleosome undergoing gradual unwrapping taken by time-lapse AFM. Each frame size is 200 nm. The acquisition time of one frame is ~170 seconds. (B) Arm length dependence on the frame number [reprinted with permission from the American Chemical Society, Copyright 2011].105
The AFM time-lapse experiments directly illustrate a highly dynamic feature of mononucleosomes and suggests that nucleosomes are rather unstable. This finding is in agreement with results obtained by AFM imaging that directly analyzed NCP stability in diluted solutions by measuring the ratio of intact nucleosomes as a function of time.104 It is important to take into account the effect of the surface used for AFM experiments. Although APS-mica has a low charge density and has little effect on ion distribution near the surface,11 the interaction of DNA with the surface favors the unwrapping process. Miyagi et al.105 hypothesized that electrostatics can play a role in the chromatin unfolding process by affecting remodeling factors. Specifically, it was posited that the surface of chromatin remodeling factors that bind nucleosomes would be positively charged to facilitate nucleosome unfolding. This hypothesis is supported by Lorch et al.110 in a study from the Kornberg lab. The effect of local surface properties on nucleosome dynamics can be generalized to the chromatin level. The interaction of chromatin with nuclear membranes and other components of the nuclear matrix are important factors that modulate chromatin structure and function. These interactions can be characterized topographically by AFM by designing surfaces with different characteristics to mimic membrane structures.
D. High-Speed AFM
As described above, AFM images are reconstructed from the point-by-point probing of the surface topography. This operation is typically performed in the range of one scan line per second (2 Hz scanning frequency). Therefore, the acquisition of the entire image comprising 512 lines (512 data points per line) takes ~4 minutes. For dry samples, this slow image acquisition speed is a matter of inconvenience and is not a serious bottleneck for the entire data acquisition process. However, a slow data acquisition rate is a serious issue if AFM is used for time-lapse imaging of biological processes. For example, the translocation of RNA polymerase along DNA occurs on a time scale of seconds; therefore, data acquisition on a time scale of minutes reveals only a small percentage of the events. Ando et al.111–114 improved this process by developing and designing a high-speed AFM (HS-AFM) instrument capable of operating with sub-second image acquisition speed. The Ando HS-AFM design has the following key properties: (1) small cantilevers (proposed by Walters et al.115) with a resonant frequency above several hundred kHz and a small spring constant; (2) a high-speed scanner with a resonant frequency that matched the cantilever characteristics; (3) active damping techniques to suppress mechanical vibrations of the scanner; and (4) fast feedback control, so the HS-AFM instrument can capture images at a video rate.116 (5) Another important feature of the HS-AFM is that the tip gently touches the sample during operation in tapping mode, with amplitudes an order of magnitude lower than traditional AFM.105 The dragging effect was investigated by Kobayashi et al.,117 in which the movement rates of DNA segments were measured along the tip scanning direction and perpendicular to it. These researchers did not find a difference, suggesting that the lateral force applied to the sample does not increase with the increasing scan rate. Recent review articles have described advances in the application of HS-AFM to analyze various biological problems.114,116 Below, we review HS-AFM applications used to study the dynamics of protein–DNA complexes.105
1. Mononucleosome Dynamics with HS-AFM
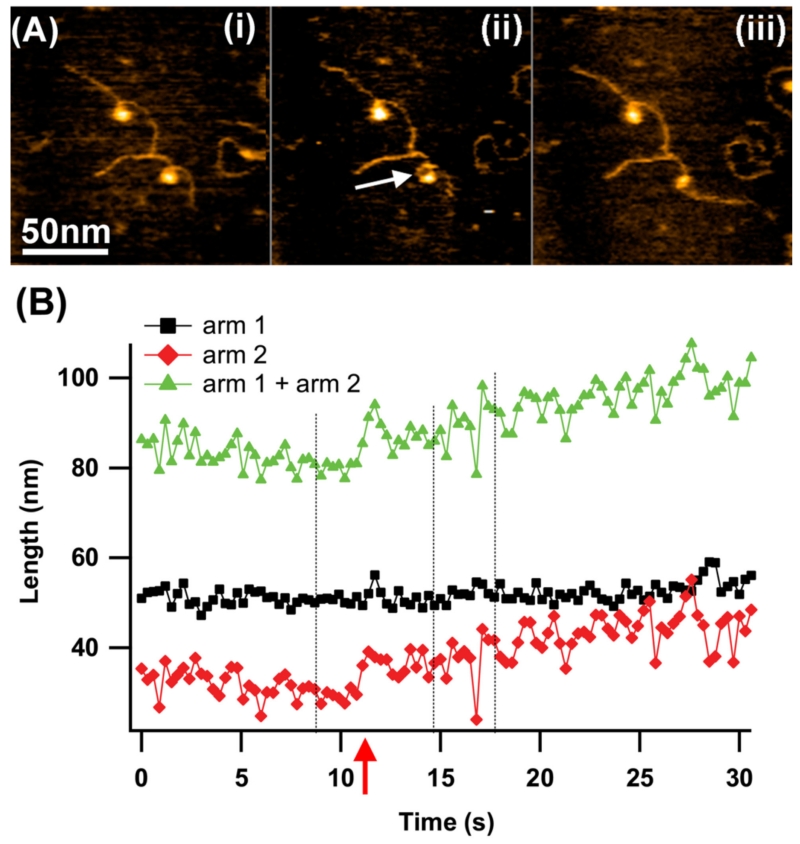
A few selected images in Fig. 17A reveal details of the dissociation process of nucleosomes that were published by Miyagi et al.,105 with a data acquisition rate of 3.3 frames per second. The entire dataset contained more than 100 frames, enabling a more detailed analysis of nucleosome dynamics. This set of three frames illustrates an interesting event in which wrapped nucleosome (frame i) initially unfold and generate a loop (frame ii; the loop is indicated with a white arrow), followed by unfolding of the loop (frame iii). Interestingly, prior to unfolding (frame iii), this looped DNA segment undergoes a series of dissociation–association steps, remaining in a tightly curved configuration. The quantitative analysis of the length measurements for the dataset is shown in Fig. 17B. The graphs show that the long arm (squares) remains unchanged, whereas the short arm increases in length dramatically at ~12 s (indicated with a red arrow in graph B). The short arm (arm 2) remains generally constant in length until ~12 s and then increases gradually, reaching a length at the end of the observation period close to that of the long arm 1. Sharp transitions occurred at ~ 17 s, resulting in unwrapping of DNA segments of ~ 10 nm (~30 bp), suggesting that the lifetime for DNA segmental dissociation is less than 330 ms. Combined, the HS-AFM data revealed that the unwrapping process is fast and complex, and it is accompanied by a number of small, quick steps spanning a second or less. The time-resolved fluorescence data of 107 showed that the breathing dynamics of nucleosomes occurs at the 50–250-ms time scale, but these studies were not able to measure the spatial range of these fluctuations. The HS-AFM data show that DNA segments as large as 30 bp dissociate in the 300-ms time scale.
FIG. 17.
HS-AFM imaging of loop formation and unfolding. (A) A set of images corresponding to 8.7 s (i), 14.7 s (ii) and 17.1 s (iii). In image (ii), the position of the DNA dissociation and unlooping events are indicated with a white arrow. (B) The length measurements for the looping and the loop unfolding process. The lengths of the left (arm 1) and right (arm 2) arms and the total DNA length are shown with black squares, red diamonds, and green triangles, respectively. In graph (B), the dashed lines correspond to the image’s acquired times shown in (A). The scan rate is one frame per 301 ms. The figure was reproduced from paper [reprinted with permission from the American Chemical Society, Copyright 2012].105
The HS-AFM studies provided insights into the mechanisms of nucleosome dynamics. The site exposure model proposed by Widom118 suggests that DNA dissociates from the histone core via an unwrapping process. The time-lapse AFM data are in agreement with this model.86 However, the high temporal resolution capability of HS-AFM indicates that in addition to the site exposure pathway, a sliding pathway is possible.105 In these observations, the nucleosome rolls quickly (~1 s) in one direction, after which it returns to the original position in the same length of time. No changes in the number of nucleosomal turns, the size of the nucleosome, or the angle between the arms occurs during this event. However, these events are rare, and the predominant pathway of nucleosome dynamics is believed to be the exposure model.
2. Site Search Process of Site-Specific DNA Binding Proteins
Interactions between distant DNA regions are key steps in fundamental genetic processes, such as site-specific recombination, integration, excision, inversion of specific DNA regions,119 and V(D)J recombination.120 These interactions are controlled by specialized proteins or protein complexes that form site-specific protein–DNA synaptic complexes called synaptosomes. The formation of a synaptic complex is a general phenomenon not limited to site-specific recombination systems. For example, a large family of DNA restriction enzymes (such as the SfiI enzyme described above) forms synaptic complexes to facilitate additional site-specific DNA cleavage.121–124 Characterization of this process was addressed by Gilmore et al.,125 in which DNA interactions of EcoRII restriction enzyme, which belongs to the synaptosome family of site-specific DNA proteins, was visualized by HS-AFM. The authors reported that EcoRII finds one specific site and then searches for another. If the two sites are located in one DNA molecule, DNA loops are formed.
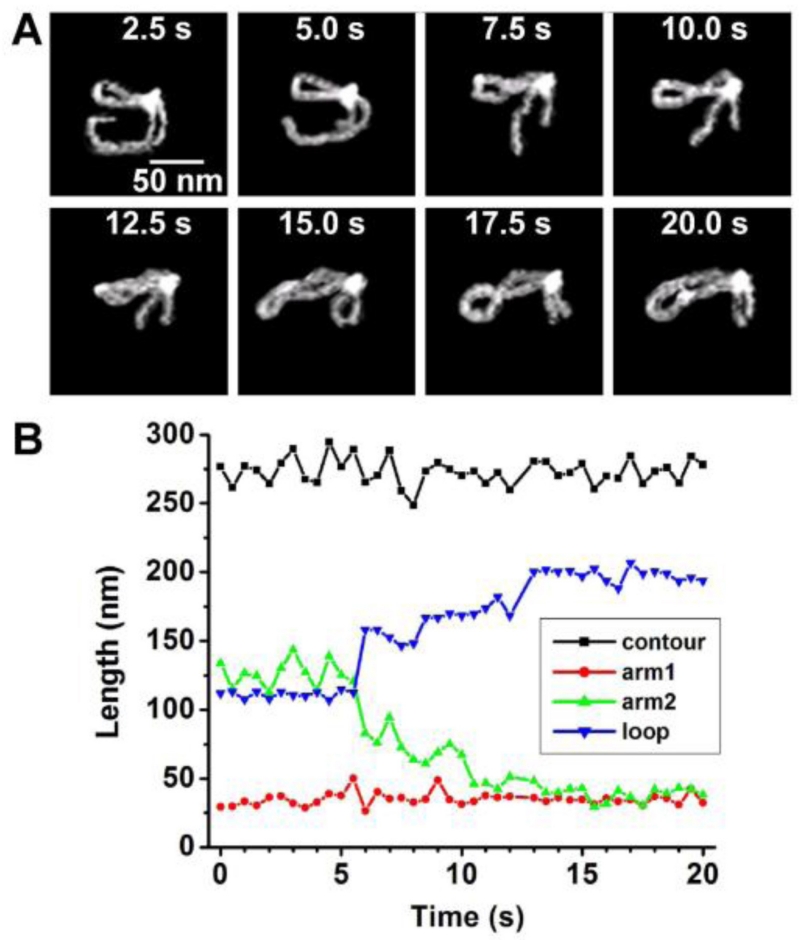
Specifically, time-lapse experiments showed that EcoRII slides and dissociates–associates with 3D and 2D diffusion while searching for the first site. The authors discovered unexpected behavior when EcoRII captured two DNA sites, with one of them being specific, leading to the formation of a loop. Frame 2.5 s of Fig. 18A shows this initial looped structure with the protein appearing as a bright blot at the strands intersection. The images following this illustrate the dynamics of the complex with the DNA loop. A comparison of frames 5.0 s and 7.5 s shows that the loop increases over time and the long arm decreases in size. This process continues, as evident in the last image (frame 20.0 s) that shows a considerable increase in the loop size. This process was analyzed by the contour length measurements (Fig. 18B). The short arm 1 remains constant over the observation period. The EcoRII specific binding site is located at 34 nm, corresponding to 100 bp from the DNA end. This suggests that the protein remains specifically bound at this recognition site for the entire time period. The length of arm 2 fluctuates at the initial stage beginning to shorten after the 5 s interval accompanying by the increase of the loop size between 283 bp (96 nm) and 312 bp (106 nm). At about 6 s, the loop length begins to increase as arm 2 decreases in length, demonstrating translocation along arm 2. After 10 s, translocation stops at a position corresponding to the location of another specific DNA site for EcoRII, as validated by the length measurement of 34 nm or 100 bp from the end. During this process the loop becomes as large as 610 bp. Thus, the translocation process covers a distance of approximately 300 bp (102 nm) with the mean rate of approximately 30 bp/s (10.2 nm/s).
FIG. 18.
HS-AFM study of the dynamics of EcoRII-DNA complexes. (A) Individual frames shown every 2.5 s illustrate EcoRII translocation. As the long arm gradually decreases, the loop length gradually increases. (B) The dependence of DNA length on time measured in 0.5 s intervals. As the long arm gradually gets shorter, the loop length gradually increases. The contour lengths of the entire molecule and the short arm have consistent values over the entire timescale. The translocation over the length of 300 base pairs occurs within 10 s [adapted from Suzuki et al, 2011; with permission from Elsevier, Copyright 2015].126
A number of conclusions emerge from these studies. First, EcoRII remains bound at one DNA recognition site and searches for another site by threading the DNA filament through another DNA binding pocket of the enzyme until it finds the second recognition site and subsequently forms a stable synaptic complex. Second, although there are fluctuations in the size of the loop, its size gradually increases because the formation of a larger loop is an entropically favorable process. Third, the protein translocation event is not accompanied by its rotation around the DNA helix because DNA supercoiling within the loop would be necessary. These findings suggest that the protein slides along the DNA filament during translocation possibly via small hops.
3. HS-AFM Imaging of the Cleavage Process of DNA by the Restriction Enzyme SfiI
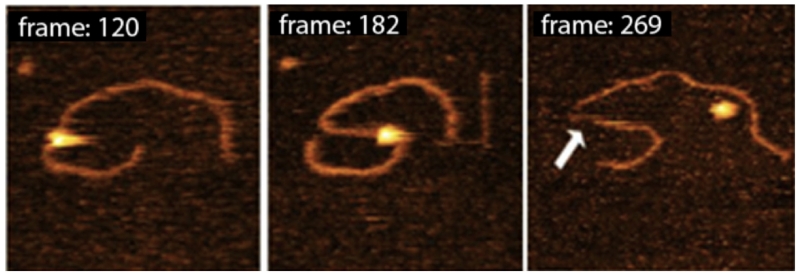
Direct visualization of the cleavage reaction for protein–DNA complexes is challenging for any time-lapse AFM study. HS-AFM was applied to detect and characterize the cleavage process of SfiI restriction enzyme.126 This is a convenient test system for HS-AFM studies because the protein’s enzymatic activity is maximal at 50°C; therefore, in the presence of Mg2+ cations and at room temperature, the synaptic complex has an ~10-min lifetime. The SfiI-DNA complex was assembled in a buffer containing Ca2+ cations. Under these conditions, the synaptic-loop complex is assembled but the DNA cleavage event does not occur.127 The sample was placed on the APS-treated mica mounted onto the scanning stage and Mg2+ cations were added to initiate the cleavage process.
Figure 19 shows a set of four images from the large data set, illustrating the dynamics of one of the complexes accompanied by DNA cleavage. The looped complex stabilized by SfiI specific binding is cleaved at one biding site leading to the dissociation of the loop (5 s), followed by movement of the cleaved segment away from the protein (10 s). However, the DNA fragment remains bound to the protein at another binding site of the loop. This fragment dissociates, followed by cleavage of another DNA fragment (15 s) and the complete dissociation of the enzyme, generating three fragments with the lengths corresponding to the positions of the protein biding sites within the DNA substrate. The cleavage of DNA with SfiI was analyzed earlier using a circular DNA substrate and gel electrophoresis to detect the cleavage products.128 These studies showed that the recognition sites were cleaved consecutively with the liberation of the cleavage products and enzyme dissociation. The AFM data is in complete agreement with the electrophoresis findings. Thus, these studies provide firm support for the application of HS-AFM to analyze DNA cleavage processes performed by site-specific enzymes.
FIG. 19.
HS-AFM visualization of the DNA cleavage process by SfiI restriction enzyme. The figure was reproduced from paper [adapted from Lushnikov et al, 2006; with permission from Elsevier, Copyright 2015].127
4. Single-Stranded DNA Binding Proteins
Above, we reviewed AFM studies of SSB-DNA complexes. The dynamics of this system were studied by Shlyakhtenko et al.80 using gap-DNA substrates in which SSB binds to the ssDNA gap (Fig. 20). The time-lapse experiments were performed under salt conditions that allow specific interactions of SSB with ssDNA (Tris-HCl, 50mM NaCl and 10mM Mg2+). Figure 20 shows a few frames of the dynamics of the complex formed with a gap substrate, and the movie file can be found with their paper.80 The first image in Fig. 20 (frame #120) shows SSB protein located inside the DNA substrate. The protein position inside corresponds to the location of ssDNA in the gap DNA substrate. A dramatic change in the overall DNA shape (frame #182) did not change the protein’s position, remaining bound to the same location on the substrate. Eventually, the protein dissociates, as is demonstrated by the last frame in their movie. The dissociation event exposes the single-stranded gap between the two dsDNA arms, as shown by the arrow on Fig. 20 (frame #269). Notably, under these conditions, SSB dissociates from the substrate in one step. Data analysis confirmed that SSB binds ssDNA as a tetramer, and remains a tetramer after dissociation from the DNA. The analysis of time-lapse AFM results revealed that SSB binds to the target strongly and remains specifically bound to the ssDNA target region during the long observation period while the DNA undergoes extensive segmental motion. The high stability of the SSB–DNA complex reflects the high yield of complexes observed with AFM and is consistent with the thermodynamic and dissociation kinetics analyses.129 The dissociation of the protein in the HS-AFM time-lapse experiments occurs rapidly, between two adjacent time frames; the dissociation time is less than a second. The temperature jump experiments showed that SSB unwrapping dynamics span between a few to ten milliseconds 129, which is in line with our estimates. Primarily, the protein dissociates from the DNA in the same morphology as it was in the complex, which according to the volume measurements, is a tetramer. However, two-step dissociation events in which one SSB dimer dissociates and another remains bound to the same position on the DNA substrate were also observed. The stability of the dimeric SSB-ssDNA complexes is relatively high, so the complex remained stable over dozens of frames of the time-lapse experiments. These observations suggest that the SSB dimer is capable of binding ssDNA, although this is not a primary mode of SSB–DNA interactions.
FIG. 20.
HS-AFM data with a few selected frames illustrating the dynamics of complexes of SSB with 69-gap-DNA, prepared in standard conditions. Each frame is 990 msec. The bar size is 50 nm. The arrow points to the exposed ssDNA region appearing after protein dissociation [reprinted with permission from the American Chemical Society, Copyright 2012].80
VI. CONCLUSIONS: FUTURE OF AFM TOPOGRAPHIC STUDIES
AFM, with its capability to image biological samples in a fully hydrated state, is coming of age. The use of time-lapse AFM to image DNA in liquid in complexes with various proteins, including ligands, enables direct imaging of critical genetic processes, such as transcription, replication, and recombination. Recent advances in HS-AFM have enabled the technique to become available to a broader biomedical community. At the current stage of development, HS-AFM is capable of imaging molecular dynamics with the rate approaching video optical microscopy. This unique capability allows dynamics to be visualized on the nanoscale range and opens novel prospects for nanoimaging. Moreover, the current HS-AFM design operates with the oscillation amplitude in the range of a nanometer, thereby dramatically minimizing the potential deformation effect of the tip. This technological advance is an important step to further improve the instrument. It enables AFM to operate in the least invasive mode (attractive tip-sample interaction regime) and almost eliminates tip-induced modification of the sample. Tip geometry is a major resolution-limiting factor for AFM. Recent advances in the tip manufacturing process provided AFM practitioners with probes as sharp as a few nanometers. At the same time, there is room for improvement in instrumentation, such as high speed for large samples and sample preparation techniques. These technological advances developed for AFM analysis of various biological complexes can be extended to other biomolecular systems to provide structural biologists with a powerful nanoimaging tools.
ACKNOWLEDGMENTS
The author thanks the lab members for their critical reading of the paper and useful comments. The work was supported by grants from the National Institutes of Health (grant nos. P01 GM091743, R01 GM096039 and R01 GM100156) and from the National Science Foundation (grant nos. EPS-1004094 and MCB-515346).
REFERENCES
- 1.Watson JD, Baker TA, Bell SP, Gann A, Levine M, Losick R. Molecular Biology of the Gene. Pearson; San Francisco: 2008. [Google Scholar]
- 2.Chow LT, Gelinas RE, Broker TR, Roberts RJ. An amazing sequence arrangement at the 5’ ends of adenovirus 2 messenger RNA. Cell. 1977;12:1–8. doi: 10.1016/0092-8674(77)90180-5. [DOI] [PubMed] [Google Scholar]
- 3.Berget SM, Moore C, Sharp PA. Spliced segments at the 5’ terminus of adenovirus 2 late mRNA. Proc Natl Acad Sci U S A. 1977;74:3171–5. doi: 10.1073/pnas.74.8.3171. [DOI] [PMC free article] [PubMed] [Google Scholar]
- 4.Borovik AS, Kalambet YA, Lyubchenko YL, Shitov VT, Golovanov EI. Equilibrium melting of plasmid ColE1 DNA: electron-microscopic visualization. Nucleic Acids Res. 1980;8:4165–84. doi: 10.1093/nar/8.18.4165. [DOI] [PMC free article] [PubMed] [Google Scholar]
- 5.Lyubchenko YL, Kalambet YA, Lyamichev VI, Borovik AS. A comparison of experimental and theoretical melting maps for replicative form of phi X174 DNA. Nucleic Acids Res. 1982;10:1867–76. doi: 10.1093/nar/10.6.1867. [DOI] [PMC free article] [PubMed] [Google Scholar]
- 6.Lyubchenko YL, Vologodskii AV, Frank-Kamenetskii MD. Direct comparison of theoretical and experimental melting profiles for RF II phiX174 DNA. Nature. 1978;271:28–31. doi: 10.1038/271028a0. [DOI] [PubMed] [Google Scholar]
- 7.Lyubchenko YL. Preparation of DNA and nucleoprotein samples for AFM imaging. Micron. 2011;42:196–206. doi: 10.1016/j.micron.2010.08.011. [DOI] [PMC free article] [PubMed] [Google Scholar]
- 8.Gross L, Mohn F, Moll N, Meyer G, Ebel R, Abdel-Mageed WM, Jaspars M. Organic structure determination using atomic resolution scanning probe microscopy. Nature Chem. 2010;2:821–5. doi: 10.1038/nchem.765. [DOI] [PubMed] [Google Scholar]
- 9.Martin Y, Williams CC, Wickramasinghe HK. Atomic force microscopy-force mapping and profiling on a sub 100A scale. J Appl Phys. 1987;61:4723–9. [Google Scholar]
- 10.Zhong Q, Inniss D, Kjoller K, Elings VB. Fractured polymer/silica fiber surface studied by tapping mode atomic force microscopy. Surf. Sci. Lett. 1993;290:L688–L692. [Google Scholar]
- 11.Lyubchenko YL, Shlyakhtenko LS. Visualization of supercoiled DNA with atomic force microscopy in situ. Proc Natl Acad Sci U S A. 1997;94:496–501. doi: 10.1073/pnas.94.2.496. [DOI] [PMC free article] [PubMed] [Google Scholar]
- 12.Santos S, Barcons V, Christenson HK, Billingsley DJ, Bonass WA, Font J, Thomson NH. Stability, resolution, and ultra-low wear amplitude modulation atomic force microscopy of DNA: Small amplitude small set-point imaging. Appl Physics Letts. 2003;103:063702. [Google Scholar]
- 13.Bustamante C, Rivetti C, Keller DJ. Scanning force microscopy under aqueous solutions. Curr Opin Struct Biol. 1997;7:709–16. doi: 10.1016/s0959-440x(97)80082-6. [DOI] [PubMed] [Google Scholar]
- 14.Klinov D, Dwir B, Kapon E, Borovok N, Molotsky T, Kotlyar A. High-resolution atomic force microscopy of duplex and triplex DNA molecules. Nanotechnology. 2007;18:225102. [Google Scholar]
- 15.Sheng S, Czajkowsky DM, Shao Z. AFM tips: how sharp are they? J Microsc. 1999;196:1–5. [PubMed] [Google Scholar]
- 16.Zhang Y, Sheng S, Shao Z. Imaging biological structures with the cryo atomic force microscope. Biophys J. 1996;71:2168–76. doi: 10.1016/S0006-3495(96)79418-3. [DOI] [PMC free article] [PubMed] [Google Scholar]
- 17.Freund J, Halbritter J, Horber JK. How dry are dried samples? Water adsorption measured by STM. Microsc Res Tech. 1999;44:327–38. doi: 10.1002/(SICI)1097-0029(19990301)44:5<327::AID-JEMT3>3.0.CO;2-E. [DOI] [PubMed] [Google Scholar]
- 18.Mou J, Czajkowsky DM, Zhang Y, Shao Z. High-resolution atomic-force microscopy of DNA: the pitch of the double helix. FEBS Lett. 1995;371:279–82. doi: 10.1016/0014-5793(95)00906-p. [DOI] [PubMed] [Google Scholar]
- 19.Bustamante C, Vesenka J, Tang CL, Rees W, Guthold M, Keller R. Circular DNA molecules imaged in air by scanning force microscopy. Biochemistry. 1992;31:22–6. doi: 10.1021/bi00116a005. [DOI] [PubMed] [Google Scholar]
- 20.Vesenka J, Guthold M, Tang CL, Keller D, Delaine E, Bustamante C. Substrate preparation for reliable imaging of DNA molecules with the scanning force microscope. Ultramicroscopy. 1992;42-44:1243–9. doi: 10.1016/0304-3991(92)90430-r. [DOI] [PubMed] [Google Scholar]
- 21.Bustamante C, Rivetti C. Visualizing protein-nucleic acid interactions on a large scale with the scanning force microscope. Annu Rev Biophys Biomol Struct. 1996;25:395–429. doi: 10.1146/annurev.bb.25.060196.002143. [DOI] [PubMed] [Google Scholar]
- 22.Thundat T, Allison DP, Warmack RJ, Brown GM, Jacobson KB, Schrick JJ, Ferrell TL. Atomic force microscopy of DNA on mica and chemically modified mica. Scanning Microsc. 1992;6:911–8. [PubMed] [Google Scholar]
- 23.Hansma HG, Laney DE. DNA binding to mica correlates with cationic radius: assay by atomic force microscopy. Biophys. J. 1996;70:1933–9. doi: 10.1016/S0006-3495(96)79757-6. [DOI] [PMC free article] [PubMed] [Google Scholar]
- 24.Pastre D, Pietrement O, Fusil S, Landousy F, Jeusset J, David MO, Hamon L, Le Cam E, Zozime A. Adsorption of DNA to mica mediated by divalent counterions: a theoretical and experimental study. Biophys. J. 2003;85:2507–18. doi: 10.1016/s0006-3495(03)74673-6. [DOI] [PMC free article] [PubMed] [Google Scholar]
- 25.Lyubchenko YL. DNA structure and dynamics: an atomic force microscopy study. Cell Biochem Biophys. 2004;41:75–98. doi: 10.1385/CBB:41:1:075. [DOI] [PubMed] [Google Scholar]
- 26.Lyubchenko YL, Gall AA, Shlyakhtenko LS, Harrington RE, Jacobs BL, Oden PI, Lindsay SM. Atomic force microscopy imaging of double stranded DNA and RNA. J Biomol Struct Dyn. 1992;10:589–606. doi: 10.1080/07391102.1992.10508670. [DOI] [PubMed] [Google Scholar]
- 27.Lyubchenko YL, Gall AA, Shlyakhtenko LS. Atomic Force Microscopy of DNA and Protein-DNA Complexes Using Functionalized Mica Substrates. In: Moss T, editor. Methods Mol. Biol. DNA-protein interactions; Principles and protocols. Vol. 148. Humana Press; Totowa (NJ): 2001. pp. 569–578. [DOI] [PubMed] [Google Scholar]
- 28.Shlyakhtenko LS, Gall AA, Filonov A, Cerovac Z, Lushnikov A, Lyubchenko YL. Silatrane-based surface chemistry for immobilization of DNA, protein-DNA complexes and other biological materials. Ultramicroscopy. 2003;97:279–87. doi: 10.1016/S0304-3991(03)00053-6. [DOI] [PubMed] [Google Scholar]
- 29.Lyubchenko YL, Shlyakhtenko LS. AFM for analysis of structure and dynamics of DNA and protein-DNA complexes. Methods. 2009;47:206–13. doi: 10.1016/j.ymeth.2008.09.002. [DOI] [PMC free article] [PubMed] [Google Scholar]
- 30.Lyubchenko YL, Shlyakhtenko LS, Gall AA. Atomic force microscopy imaging and probing of DNA, proteins, and protein DNA complexes: silatrane surface chemistry. Methods Mol Biol. 2009;543:337–51. doi: 10.1007/978-1-60327-015-1_21. [DOI] [PubMed] [Google Scholar]
- 31.Ellis JS, Abdelhady HG, Allen S, Davies MC, Roberts CJ, Tendler SJ, Williams PM. Direct atomic force microscopy observations of monovalent ion induced binding of DNA to mica. J Microsc. 2004;215:297–301. doi: 10.1111/j.0022-2720.2004.01379.x. [DOI] [PubMed] [Google Scholar]
- 32.Yang J, Takeyasu K, Shao Z. Atomic force microscopy of DNA molecules. FEBS Lett. 1992;301:173–6. doi: 10.1016/0014-5793(92)81241-d. [DOI] [PubMed] [Google Scholar]
- 33.Bussiek M, Mucke N, Langowski J. Polylysine-coated mica can be used to observe systematic changes in the supercoiled DNA conformation by scanning force microscopy in solution. Nucleic Acids Res. 2003;31:e137. doi: 10.1093/nar/gng137. [DOI] [PMC free article] [PubMed] [Google Scholar]
- 34.Bussiek M, Toth K, Brun N, Langowski J. DNA-loop formation on nucleosomes shown by in situ scanning force microscopy of supercoiled DNA. J Mol Biol. 2005;345:695–706. doi: 10.1016/j.jmb.2004.11.016. [DOI] [PubMed] [Google Scholar]
- 35.Suzuki Y, Higuchi Y, Hizume K, Yokokawa M, Yoshimura SH, Yoshikawa K, Takeyasu K. Molecular dynamics of DNA and nucleosomes in solution studied by fast-scanning atomic force microscopy. Ultramicroscopy. 2010 doi: 10.1016/j.ultramic.2010.02.032. [DOI] [PubMed] [Google Scholar]
- 36.Shlyakhtenko LS, Hsieh P, Grigoriev M, Potaman VN, Sinden RR, Lyubchenko YL. A cruciform structural transition provides a molecular switch for chromosome structure and dynamics. J Mol Biol. 2000;296:1169–73. doi: 10.1006/jmbi.2000.3542. [DOI] [PubMed] [Google Scholar]
- 37.Vologodskii AV. Biophysics of DNA. Cambridge University Press; New York: 2015. [Google Scholar]
- 38.Mikheikin AL, Lushnikov AY, Lyubchenko YL. Effect of DNA supercoiling on the geometry of holliday junctions. Biochemistry. 2006;45:12998–3006. doi: 10.1021/bi061002k. [DOI] [PMC free article] [PubMed] [Google Scholar]
- 39.Lyubchenko YL, Shlyakhtenko LS, Potaman VP, Sinden RR. Global and Local DNA Structure and Dynamics. Single molecule studies with AFM. Microsc Microanal. 2002;8:170–171. [Google Scholar]
- 40.Potaman VN, Lushnikov AY, Sinden RR, Lyubchenko YL. Site-specific labeling of supercoiled DNA at the a+t rich sequences. Biochemistry. 2002;41:13198–206. doi: 10.1021/bi026402w. [DOI] [PubMed] [Google Scholar]
- 41.Shlyakhtenko LS, Miloseska L, Potaman VN, Sinden RR, Lyubchenko YL. Intersegmental interactions in supercoiled DNA: atomic force microscope study. Ultramicroscopy. 2003;97:263–70. doi: 10.1016/S0304-3991(03)00051-2. [DOI] [PubMed] [Google Scholar]
- 42.Huang J, Schlick T, Vologodskii A. Dynamics of site juxtaposition in supercoiled DNA. Proc Natl Acad Sci U S A. 2001;98:968–973. doi: 10.1073/pnas.98.3.968. [DOI] [PMC free article] [PubMed] [Google Scholar]
- 43.Nagami F, Zuccheri G, Samori B, Kuroda R. Time-lapse imaging of conformational changes in supercoiled DNA by scanning force microscopy. Analyt Biochem. 2002;300:170–6. doi: 10.1006/abio.2001.5435. [DOI] [PubMed] [Google Scholar]
- 44.Rivetti C, Guthold M, Bustamante C. Scanning force microscopy of DNA deposited onto mica: equilibration versus kinetic trapping studied by statistical polymer chain analysis. J Mol Biol. 1996;264:919–32. doi: 10.1006/jmbi.1996.0687. [DOI] [PubMed] [Google Scholar]
- 45.Sinden RR. DNA Structure and Function. Academic Press; San Diego: 1994. [Google Scholar]
- 46.Pearson CE, Zorbas H, Price GB, Zannis-Hadjopoulos M. Inverted repeats, stem-loops, and cruciforms: significance for initiation of DNA replication. J Cell Biochem. 1996;63:1–22. doi: 10.1002/(SICI)1097-4644(199610)63:1%3C1::AID-JCB1%3E3.0.CO;2-3. [DOI] [PubMed] [Google Scholar]
- 47.Shlyakhtenko LS, Potaman VN, Sinden RR, Lyubchenko YL. Structure and dynamics of supercoil-stabilized DNA cruciforms. J Molec Biol. 1998;280:61–72. doi: 10.1006/jmbi.1998.1855. [DOI] [PubMed] [Google Scholar]
- 48.Mirkin SM. Discovery of alternative DNA structures: a heroic decade (1979–1989) Front Biosci. 2008;13:1064–71. doi: 10.2741/2744. [DOI] [PubMed] [Google Scholar]
- 49.Tiner WJ, Sr, Potaman VN, Sinden RR, Lyubchenko YL. The structure of intramolecular triplex DNA: atomic force microscopy study. J Mol Biol. 2001;314:353–7. doi: 10.1006/jmbi.2001.5174. [DOI] [PubMed] [Google Scholar]
- 50.Kato M, McAllister CJ, Hokabe S, Shimizu N, Lyubchenko YL. Structural heterogeneity of pyrimidine/purine-biased DNA sequence analyzed by atomic force microscopy. Eur J Biochem. 2002;269:3632–6. doi: 10.1046/j.1432-1033.2002.03063.x. [DOI] [PubMed] [Google Scholar]
- 51.Amirikyan BR, Vologodskii AV, Lyubchenko YL. Determination of DNA cooperativity factor. Nucleic Acids Res. 1981;9:5469–82. doi: 10.1093/nar/9.20.5469. [DOI] [PMC free article] [PubMed] [Google Scholar]
- 52.Zaychikov E, Denissova L, Heumann H. Translocation of the Escherichia coli transcription complex observed in the registers 11 to 20: “jumping” of RNA polymerase and asymmetric expansion and contraction of the “transcription bubble.”. Proc Natl Acad Sci U S A. 1995;92:1739–43. doi: 10.1073/pnas.92.5.1739. [DOI] [PMC free article] [PubMed] [Google Scholar]
- 53.Potaman VN, Bissler JJ, Hashem VI, Oussatcheva EA, Lu L, Shlyakhtenko LS, Lyubchenko YL, Matsuura T, Ashizawa T, Leffak M, Benham CJ, Sinden RR. Unpaired structures in SCA10 (ATTCT) n.(AGAAT)n repeats. J Mol Biol. 2003;326:1095–111. doi: 10.1016/s0022-2836(03)00037-8. [DOI] [PubMed] [Google Scholar]
- 54.Lushnikov AY, Potaman VN, Oussatcheva EA, Sinden RR, Lyubchenko YL. DNA Strand arrangement within the SfiI-DNA complex: atomic force microscopy analysis. Biochemistry. 2006;45:152–8. doi: 10.1021/bi051767c. [DOI] [PMC free article] [PubMed] [Google Scholar]
- 55.Fuentes-Perez ME, Dillingham MS, Moreno-Herrero F. AFM volumetric methods for the characterization of proteins and nucleic acids. Methods. 2013;60:113–21. doi: 10.1016/j.ymeth.2013.02.005. [DOI] [PubMed] [Google Scholar]
- 56.Vanamee ES, Viadiu H, Kucera R, Dorner L, Picone S, Schildkraut I, Aggarwal AK. A view of consecutive binding events from structures of tetrameric endonuclease SfiI bound to DNA. Embo J. 2005;24:4198–208. doi: 10.1038/sj.emboj.7600880. [DOI] [PMC free article] [PubMed] [Google Scholar]
- 57.Singleton MR, Scaife S, Wigley DB. Structural analysis of DNA replication fork reversal by RecG. Cell. 2001;107:79–89. doi: 10.1016/s0092-8674(01)00501-3. [DOI] [PubMed] [Google Scholar]
- 58.Abd Wahab S, Choi M, Bianco PR. Characterization of the ATPase activity of RecG and RuvAB proteins on model fork structures reveals insight into stalled DNA replication fork repair. J Biol Chem. 2013;288:26397–409. doi: 10.1074/jbc.M113.500223. [DOI] [PMC free article] [PubMed] [Google Scholar]
- 59.Buss JA, Kimura Y, Bianco PR. RecG interacts directly with SSB: implications for stalled replication fork regression. Nucleic Acids Res. 2008;36:7029–42. doi: 10.1093/nar/gkn795. [DOI] [PMC free article] [PubMed] [Google Scholar]
- 60.Slocum SL, Buss JA, Kimura Y, Bianco PR. Characterization of the ATPase activity of the Escherichia coli RecG protein reveals that the preferred cofactor is negatively supercoiled DNA. J Mol Biol. 2007;367:647–64. doi: 10.1016/j.jmb.2007.01.007. [DOI] [PMC free article] [PubMed] [Google Scholar]
- 61.Yu C, Tan HY, Choi M, Stanenas AJ, Byrd AK, Raney K, Cohan CS, Bianco PR. SSB binds to the RecG and PriA helicases in vivo in the absence of DNA. Genes Cells. 2016;21:163–184. doi: 10.1111/gtc.12334. [DOI] [PMC free article] [PubMed] [Google Scholar]
- 62.Sun Z, Tan HY, Bianco PR, Lyubchenko YL. Remodeling of RecG Helicase at the DNA Replication Fork by SSB Protein. Sci Rep. 2015;5:9625. doi: 10.1038/srep09625. [DOI] [PMC free article] [PubMed] [Google Scholar]
- 63.McGlynn P, Lloyd RG. Genome stability and the processing of damaged replication forks by RecG. Trends Genet. 2002;18:413–9. doi: 10.1016/s0168-9525(02)02720-8. [DOI] [PubMed] [Google Scholar]
- 64.Shereda RD, Kozlov AG, Lohman TM, Cox MM, Keck JL. SSB as an organizer/mobilizer of genome maintenance complexes. Crit Rev Biochem Mol Biol. 2008;43:289–318. doi: 10.1080/10409230802341296. [DOI] [PMC free article] [PubMed] [Google Scholar]
- 65.Modrich P. Mechanisms in eukaryotic mismatch repair. J Biol Chem. 2006;281:30305–9. doi: 10.1074/jbc.R600022200. [DOI] [PMC free article] [PubMed] [Google Scholar]
- 66.Wang H, Yang Y, Schofield MJ, Du C, Fridman Y, Lee SD, Larson ED, Drummond JT, Alani E, Hsieh P, Erie DA. DNA bending and unbending by MutS govern mismatch recognition and specificity. Proc Natl Acad Sci U S A. 2003;100:14822–7. doi: 10.1073/pnas.2433654100. [DOI] [PMC free article] [PubMed] [Google Scholar]
- 67.Tessmer I, Yang Y, Zhai J, Du C, Hsieh P, Hingorani MM, Erie DA. Mechanism of MutS searching for DNA mismatches and signaling repair. J Biol Chem. 2008;283:36646–54. doi: 10.1074/jbc.M805712200. [DOI] [PMC free article] [PubMed] [Google Scholar]
- 68.Yang Y, Sass LE, Du C, Hsieh P, Erie DA. Determination of protein-DNA binding constants and specificities from statistical analyses of single molecules: MutS-DNA interactions. Nucleic Acids Res. 2005;33:4322–34. doi: 10.1093/nar/gki708. [DOI] [PMC free article] [PubMed] [Google Scholar]
- 69.Josephs EA, Zheng T, Marszalek PE. Atomic force microscopy captures the initiation of methyl-directed DNA mismatch repair. DNA Repair (Amst) 2015;35:71–84. doi: 10.1016/j.dnarep.2015.08.006. [DOI] [PMC free article] [PubMed] [Google Scholar]
- 70.Sacho EJ, Kadyrov FA, Modrich P, Kunkel TA, Erie DA. Direct visualization of asymmetric adenine-nucleotide-induced conformational changes in MutL alpha. Mol Cell. 2008;29:112–21. doi: 10.1016/j.molcel.2007.10.030. [DOI] [PMC free article] [PubMed] [Google Scholar]
- 71.Kur J, Olszewski M, Dlugolecka A, Filipkowski P. Single-stranded DNA-binding proteins (SSBs)— sources and applications in molecular biology. Acta Biochim Pol. 2005;52:569–74. [PubMed] [Google Scholar]
- 72.Krauss G, Sindermann H, Schomburg U, Maass G. Escherichia coli single-strand deoxyribonucleic acid binding protein: stability, specificity, and kinetics of complexes with oligonucleotides and deoxyribonucleic acid. Biochemistry. 1981;20:5346–52. doi: 10.1021/bi00521a040. [DOI] [PubMed] [Google Scholar]
- 73.Dillingham MS, Tibbles KL, Hunter JL, Bell JC, Kowalczykowski SC, Webb MR. Fluorescent single-stranded DNA binding protein as a probe for sensitive, real-time assays of helicase activity. Biophys J. 2008;95:3330–9. doi: 10.1529/biophysj.108.133512. [DOI] [PMC free article] [PubMed] [Google Scholar]
- 74.McEntee K, Weinstock GM, Lehman IR. A protein-catalyzed strand assimilation: stimulation by Escherichia coli single-stranded DNA-binding protein. Proc Natl Acad Sci U S A. 1980;77:857–61. doi: 10.1073/pnas.77.2.857. [DOI] [PMC free article] [PubMed] [Google Scholar]
- 75.Bochkarev A, Bochkareva E. RPA to BRCA2: lessons from single-stranded DNA binding by the OB-fold. Curr Opin Struct Biol. 2004;14:36–42. doi: 10.1016/j.sbi.2004.01.001. [DOI] [PubMed] [Google Scholar]
- 76.Shereda RD, Kozlov AG, Lohman TM, Cox MM, Keck JL. SSB as an organizer/mobilizer of genome maintenance complexes. Crit Revs Biochem Molec Biol. 2008;43:289–318. doi: 10.1080/10409230802341296. [DOI] [PMC free article] [PubMed] [Google Scholar]
- 77.Lohman TM, Ferrari ME. Escherichia coli single-stranded DNA-binding protein: multiple DNA-binding modes and cooperativities. Annu Rev Biochem. 1994;63:527–70. doi: 10.1146/annurev.bi.63.070194.002523. [DOI] [PubMed] [Google Scholar]
- 78.Ryzhikov M, Koroleva O, Postnov D, Tran A, Korolev S. Mechanism of RecO recruitment to DNA by single-stranded DNA binding protein. Nucleic Acids Res. 2011;39:6305–14. doi: 10.1093/nar/gkr199. [DOI] [PMC free article] [PubMed] [Google Scholar]
- 79.Shlyakhtenko LS, Lushnikov AY, Li M, Lackey L, Harris RS, Lyubchenko YL. Atomic force microscopy studies provide direct evidence for dimerization of the HIV restriction factor APOBEC3G. J Biol Chem. 2011;286:3387–95. doi: 10.1074/jbc.M110.195685. [DOI] [PMC free article] [PubMed] [Google Scholar]
- 80.Shlyakhtenko LS, Lushnikov AY, Miyagi A, Lyubchenko YL. Specificity of binding of single-stranded DNA-binding protein to its target. Biochemistry. 2012;51:1500–9. doi: 10.1021/bi201863z. [DOI] [PMC free article] [PubMed] [Google Scholar]
- 81.Drake B, Prater CB, Weisenhorn AL, Gould SA, Albrecht TR, Quate CF, Cannell DS, Hansma HG, Hansma PK. Imaging crystals, polymers, and processes in water with the atomic force microscope. Science. 1989;243:1586–9. doi: 10.1126/science.2928794. [DOI] [PubMed] [Google Scholar]
- 82.Bustamante C, Erie D, Keller D. Biochemical and structural applications of scanning force microscopy. Curr Opin Struct Biol. 1994;4:750–60. [Google Scholar]
- 83.Guthold M, Bezanilla M, Erie DA, Jenkins B, Hansma HG, Bustamante C. Following the assembly of RNA polymerase-DNA complexes in aqueous solutions with the scanning force microscope. Proc Natl Acad Sci USA. 1994;91:12927–31. doi: 10.1073/pnas.91.26.12927. [DOI] [PMC free article] [PubMed] [Google Scholar]
- 84.Guthold M, Zhu X, Rivetti C, Yang G, Thomson NH, Kasas S, Hansma HG, Smith B, Hansma PK, Bustamante C. Direct observation of one-dimensional diffusion and transcription by Escherichia coli RNA polymerase. Biophys J. 1999;77:2284–94. doi: 10.1016/S0006-3495(99)77067-0. [DOI] [PMC free article] [PubMed] [Google Scholar]
- 85.Lushnikov AY, Bogdanov A, Lyubchenko YL. DNA recombination: Holliday junctions dynamics and branch migration. J Biol Chem. 2003;278:43130–4. doi: 10.1074/jbc.M308228200. [DOI] [PubMed] [Google Scholar]
- 86.Shlyakhtenko LS, Lushnikov AY, Lyubchenko YL. Dynamics of nucleosomes revealed by time-lapse atomic force microscopy. Biochemistry. 2009;48:7842–8. doi: 10.1021/bi900977t. [DOI] [PMC free article] [PubMed] [Google Scholar]
- 87.Muller DJ. AFM: a nanotool in membrane biology. Biochemistry. 2008;47:7986–98. doi: 10.1021/bi800753x. [DOI] [PubMed] [Google Scholar]
- 88.Muller DJ, Engel A. Atomic force microscopy and spectroscopy of native membrane proteins. Nature Protocols. 2007;2:2191–7. doi: 10.1038/nprot.2007.309. [DOI] [PubMed] [Google Scholar]
- 89.Scheuring S, Dufrene YF. Atomic force microscopy: probing the spatial organization, interactions and elasticity of microbial cell envelopes at molecular resolution. Molec Microbiol. 2010;75:1327–36. doi: 10.1111/j.1365-2958.2010.07064.x. [DOI] [PubMed] [Google Scholar]
- 90.Heinisch JJ, Dupres V, Wilk S, Jendretzki A, Dufrene YF. Single-molecule atomic force microscopy reveals clustering of the yeast plasma-membrane sensor Wsc1. PLoS ONE. 2010;5:e11104. doi: 10.1371/journal.pone.0011104. [DOI] [PMC free article] [PubMed] [Google Scholar]
- 91.Sigal N, Alberts B. Genetic recombination: the nature of a crossed strand-exchange between two homologous DNA molecules. J Mol Biol. 1972;71:789–93. doi: 10.1016/s0022-2836(72)80039-1. [DOI] [PubMed] [Google Scholar]
- 92.Meselson M. Formation of hybrid DNA by rotary diffusion during genetic recombination. J Mol Biol. 1972;71:795–8. doi: 10.1016/s0022-2836(72)80040-8. [DOI] [PubMed] [Google Scholar]
- 93.Panyutin IG, Biswas I, Hsieh P. A pivotal role for the structure of the Holliday junction in DNA branch migration. Embo J. 1995;14:1819–26. doi: 10.1002/j.1460-2075.1995.tb07170.x. [DOI] [PMC free article] [PubMed] [Google Scholar]
- 94.Panyutin IG, Hsieh P. The kinetics of spontaneous DNA branch migration. Proc Natl Acad Sci U S A. 1994;91:2021–5. doi: 10.1073/pnas.91.6.2021. [DOI] [PMC free article] [PubMed] [Google Scholar]
- 95.Biswas I, Yamamoto A, Hsieh P. Branch migration through DNA sequence heterology. J Mol Biol. 1998;279:795–806. doi: 10.1006/jmbi.1998.1769. [DOI] [PubMed] [Google Scholar]
- 96.Karymov M, Daniel D, Sankey OF, Lyubchenko YL. Holliday junction dynamics and branch migration: single-molecule analysis. Proc Natl Acad Sci USA. 2005;102:8186–91. doi: 10.1073/pnas.0407210102. [DOI] [PMC free article] [PubMed] [Google Scholar]
- 97.Kasas S, Thomson NH, Smith BL, Hansma HG, Zhu X, Guthold M, Bustamante C, Kool ET, Kashlev M, Hansma PK. Escherichia coli RNA polymerase activity observed using atomic force microscopy. Biochemistry. 1997;36:461–8. doi: 10.1021/bi9624402. [DOI] [PubMed] [Google Scholar]
- 98.Guthold M, Zhu X, Rivetti C, Yang G, Thomson NH, Kasas S, Hansma HG, Smith B, Hansma PK, Bustamante C. Direct observation of one-dimensional diffusion and transcription by Escherichia coli RNA polymerase. Biophys J. 1999;77:2284–94. doi: 10.1016/S0006-3495(99)77067-0. [DOI] [PMC free article] [PubMed] [Google Scholar]
- 99.Bezanilla M, Drake B, Nudler E, Kashlev M, Hansma PK, Hansma HG. Motion and enzymatic degradation of DNA in the atomic force microscope. Biophys J. 1994;67:2454–9. doi: 10.1016/S0006-3495(94)80733-7. [DOI] [PMC free article] [PubMed] [Google Scholar]
- 100.Argaman M, Golan R, Thomson NH, Hansma HG. Phase imaging of moving DNA molecules and DNA molecules replicated in the atomic force microscope. Nucleic Acids Res. 1997;25:4379–84. doi: 10.1093/nar/25.21.4379. [DOI] [PMC free article] [PubMed] [Google Scholar]
- 101.Kalle W, Strappe P. Atomic force microscopy on chromosomes, chromatin and DNA: a review. Micron. 2012;43:1224–31. doi: 10.1016/j.micron.2012.04.004. [DOI] [PubMed] [Google Scholar]
- 102.Lyubchenko YL. Nanoscale nucleosome dynamics assessed with time-lapse AFM. Biophys Rev. 2014;6:181–90. doi: 10.1007/s12551-013-0121-3. [DOI] [PMC free article] [PubMed] [Google Scholar]
- 103.Filenko NA, Kolar C, West JT, Smith SA, Hassan YI, Borgstahl GE, Zempleni J, Lyubchenko YL. The role of histone H4 biotinylation in the structure of nucleosomes. PLoS One. 2011;6:e16299. doi: 10.1371/journal.pone.0016299. [DOI] [PMC free article] [PubMed] [Google Scholar]
- 104.Menshikova I, Menshikov E, Filenko N, Lyubchenko YL. Nucleosomes structure and dynamics: effect of CHAPS. Int J Biochem Molec Biol. 2011;2:129–37. [PMC free article] [PubMed] [Google Scholar]
- 105.Miyagi A, Ando T, Lyubchenko YL. Dynamics of nucleosomes assessed with time-lapse high-speed atomic force microscopy. Biochem. 2011;50:7901–8. doi: 10.1021/bi200946z. [DOI] [PubMed] [Google Scholar]
- 106.Li G, Widom J. Nucleosomes facilitate their own invasion. Nat Struct Mol Biol. 2004;11:763–9. doi: 10.1038/nsmb801. [DOI] [PubMed] [Google Scholar]
- 107.Li G, Levitus M, Bustamante C, Widom J. Rapid spontaneous accessibility of nucleosomal DNA. Nat Struct Mol Biol. 2003;12:46–53. doi: 10.1038/nsmb869. [DOI] [PubMed] [Google Scholar]
- 108.Tims HS, Widom J. Stopped-flow fluorescence resonance energy transfer for analysis of nucleosome dynamics. Methods. 2007;41:296–303. doi: 10.1016/j.ymeth.2007.01.001. [DOI] [PMC free article] [PubMed] [Google Scholar]
- 109.Shlyakhtenko LS, Lushnikov AY, Lyubchenko YL. Dynamics of nucleosomes revealed by time-lapse atomic force microscopy. Biochemistry. 2009;48:7842–8. doi: 10.1021/bi900977t. [DOI] [PMC free article] [PubMed] [Google Scholar]
- 110.Lorch Y, Maier-Davis B, Kornberg RD. Mechanism of chromatin remodeling. Proc Nat Acad Sci U S A. 2010;107:3458–62. doi: 10.1073/pnas.1000398107. [DOI] [PMC free article] [PubMed] [Google Scholar]
- 111.Ando T, Kodera N, Takai E, Maruyama D, Saito K, Toda A. A high-speed atomic force microscope for studying biological macromolecules. Proc Natl Acad Sci USA. 2001;98:12468–72. doi: 10.1073/pnas.211400898. [DOI] [PMC free article] [PubMed] [Google Scholar]
- 112.Ando T, Uchihashi T, Fukuma T. High-speed atomic force microscopy for nano-visualization of dynamic biomolecular processes. Prog Surface Sci. 2008;83:337–47. [Google Scholar]
- 113.Ando T. High-speed AFM imaging. Curr Opin Struct Biol. 2014;28:63–8. doi: 10.1016/j.sbi.2014.07.011. [DOI] [PubMed] [Google Scholar]
- 114.Ando T, Uchihashi T, Scheuring S. Filming biomolecular processes by high-speed atomic force microscopy. Chem Rev. 2014;114:3120–88. doi: 10.1021/cr4003837. [DOI] [PMC free article] [PubMed] [Google Scholar]
- 115.Walters DA, Cleveland JP, Thomson NH, Hansma PK, Wendman MA, Gurley G, Elings V. Short cantilevers for atomic force microscopy. Rev Sci Instrum. 1996;67:3583–90. [Google Scholar]
- 116.Ando T. High-speed AFM imaging. Curr Opin Struct Biol. 2014;28:63–8. doi: 10.1016/j.sbi.2014.07.011. [DOI] [PubMed] [Google Scholar]
- 117.Kobayashi M, Sumitomo K, Torimitsu K. Real-time imaging of DNA-streptavidin complex formation in solution using a high-speed atomic force microscope. Ultramicroscopy. 2007;107:184–90. doi: 10.1016/j.ultramic.2006.07.008. [DOI] [PubMed] [Google Scholar]
- 118.Widom J. Chromatin: the nucleosome unwrapped. Curr Biol. 1997;7:R653–5. doi: 10.1016/s0960-9822(06)00327-7. [DOI] [PubMed] [Google Scholar]
- 119.Grindley ND, Whiteson KL, Rice PA. Mechanisms of site-specific recombination. Annu Rev Biochem. 2006 doi: 10.1146/annurev.biochem.73.011303.073908. [DOI] [PubMed] [Google Scholar]
- 120.Swanson PC. The bounty of RAGs: recombination signal complexes and reaction outcomes. Immunol Rev. 2004;200:90–114. doi: 10.1111/j.0105-2896.2004.00159.x. [DOI] [PubMed] [Google Scholar]
- 121.Bilcock DT, Halford SE. DNA restriction dependent on two recognition sites: activities of the SfiI restriction-modification system in Escherichia coli. Mol Microbiol. 1999;31:1243–54. doi: 10.1046/j.1365-2958.1999.01266.x. [DOI] [PubMed] [Google Scholar]
- 122.Embleton ML, Siksnys V, Halford SE. DNA cleavage reactions by type II restriction enzymes that require two copies of their recognition sites. J Mol Biol. 2001;311:503–14. doi: 10.1006/jmbi.2001.4892. [DOI] [PubMed] [Google Scholar]
- 123.Bath AJ, Milsom SE, Gormley NA, Halford SE. Many type IIs restriction endonucleases interact with two recognition sites before cleaving DNA. J Biol Chem. 2002;277:4024–33. doi: 10.1074/jbc.M108441200. [DOI] [PubMed] [Google Scholar]
- 124.Gormley NA, Hillberg AL, Halford SE. The type IIs restriction endonuclease BspMI is a tetramer that acts concertedly at two copies of an asymmetric DNA sequence. J Biol Chem. 2002;277:4034–41. doi: 10.1074/jbc.M108442200. [DOI] [PubMed] [Google Scholar]
- 125.Gilmore JL, Suzuki Y, Tamulaitis G, Siksnys V, Takeyasu K, Lyubchenko YL. Single-molecule dynamics of the DNA-EcoRII protein complexes revealed with high-speed atomic force microscopy. Biochemistry. 2009;48:10492–8. doi: 10.1021/bi9010368. [DOI] [PMC free article] [PubMed] [Google Scholar]
- 126.Suzuki Y, Gilmore JL, Yoshimura SH, Henderson RM, Lyubchenko YL, Takeyasu K. Visual analysis of concerted cleavage by Type IIF restriction enzyme SfiI in sub-second time region. Biophys J. 2011;101:2992–8. doi: 10.1016/j.bpj.2011.09.064. [DOI] [PMC free article] [PubMed] [Google Scholar]
- 127.Lushnikov AY, Potaman VN, Lyubchenko YL. Site-specific labeling of supercoiled DNA. Nucleic Acids Res. 2006;34(1-7):e111. doi: 10.1093/nar/gkl642. [DOI] [PMC free article] [PubMed] [Google Scholar]
- 128.Embleton ML, Williams SA, Watson MA, Halford SE. Specificity from the synapsis of DNA elements by the Sfi I endonuclease. J Molec Biol. 1999;289:785–97. doi: 10.1006/jmbi.1999.2822. [DOI] [PubMed] [Google Scholar]
- 129.Kuznetsov SV, Kozlov AG, Lohman TM, Ansari A. Microsecond dynamics of protein-DNA interactions: direct observation of the wrapping/unwrapping kinetics of single-stranded DNA around the E. coli SSB tetramer. J Mol Biol. 2006;359:55–65. doi: 10.1016/j.jmb.2006.02.070. [DOI] [PubMed] [Google Scholar]


