Abstract
Metazoan genomes are spatially organized at multiple scales, from packaging of DNA around individual nucleosomes to segregation of whole chromosomes into distinct territories1–5. At the intermediate scale of kilobases to megabases, which encompasses the sizes of genes, gene clusters and regulatory domains, the three-dimensional (3D) organization of DNA is implicated in multiple gene regulatory mechanisms2–4,6–8, but understanding this organization remains a challenge. At this scale, the genome is partitioned into domains of different epigenetic states that are essential for regulating gene expression9–11. Here, we investigate the 3D organization of chromatin in different epigenetic states using super-resolution imaging. We classified genomic domains in Drosophila cells into transcriptionally active, inactive, or Polycomb-repressed states and observed distinct chromatin organizations for each state. Remarkably, all three types of chromatin domains exhibit power-law scaling between their physical sizes in 3D and their domain lengths, but each type has a distinct scaling exponent. Polycomb-repressed chromatin shows the densest packing and most intriguing folding behaviour in which packing density increases with domain length. Distinct from the self-similar organization displayed by transcriptionally active and inactive chromatin, the Polycomb-repressed domains are characterized by a high degree of chromatin intermixing within the domain. Moreover, compared to inactive domains, Polycomb-repressed domains spatially exclude neighbouring active chromatin to a much stronger degree. Computational modelling and knockdown experiments suggest that reversible chromatin interactions mediated by Polycomb-group proteins plays an important role in these unique packaging properties of the repressed chromatin. Taken together, our super-resolution images reveal distinct chromatin packaging for different epigenetic states at the kilobase-to-megabase scale, a length scale that is directly relevant to genome regulation.
Multiple lines of evidence suggest that the spatial organization of chromatin at the kilobase-to-megabase is important for genomic functions2–4,6–8,10–12. The sizes of genes, gene clusters and regulatory domains all occur in this range; in addition, physical interactions between genomic elements separated by this distance range, such as promoter-enhancer interactions, are important for gene activity2–4. Recent high-throughput chromatin conformation capture measurements revealed that individual chromosomes are partitioned into contact domains or topologically associating domains with lengths ranging from tens of kilobases (kb) to multiple megabases (Mb), and that this structural organization could be relevant to a variety of genome functions3,6–8,10–12 At this length scale, chromatin is also demarcated into domains of distinct epigenetic states characterized by biochemical modifications and DNA-binding proteins9–11. Yet, how the 3D spatial organization of chromatin differs amongst these different epigenetic states is largely unknown.
Direct imaging of the spatial organization of chromatin in different epigenetic states requires the ability to specifically label genomic DNA in situ and to resolve chromatin structures beyond the diffraction-limit resolution of ~200 nm. Here, we used fluorescent in situ hybridization (FISH) to label specific regions of the genome with complementary oligonucleotide probes tagged with fluorescent dyes. We adopted and modified a previously reported Oligopaint approach13,14 to produce tens of thousands of unique, oligonucleotide probes to label kilobase-to-megabase long genomic regions using massively parallel oligo synthesis13–16. High-yield probe synthesis was achieved with a recently described enzymatic amplification method17 (Extended Data Fig. 1 and Supplementary Methods). We used osmotically balanced fixation conditions that minimized shrinkage effect (Supplementary Methods) and observed no detectable chromatin shrinkage (Extended Data Fig. 2). We then imaged the labelled chromatin regions using three-dimensional stochastic optical reconstruction microscopy (3D-STORM)18,19, a single-molecule-based super-resolution imaging method. This approach yielded images of specific genomic regions in cells with 20-nm xy and 50-nm z resolution14.
We imaged 46 epigenetically defined genomic domains (Extended Data Fig. 3a; Extended Data Table) in Drosophila Kc167 cells. We classified these regions into three major epigenetic states — transcriptionally active, inactive, and Polycomb-repressed (hereafter referred to as active, inactive and repressed, respectively) — based on enrichment of histone modifications and regulatory proteins from ChIP-seq and DamID data (Fig. 1a), as described previously10,11,20 and in Supplementary Methods. Active chromatin domains were selected based on the enrichment of the histone modifications H3K4me2 or H3K79me3. Repressed domains were selected based on enrichment for H3K27me3 or Polycomb Group (PcG) proteins. Inactive domains were selected based on the predominance of unmodified histones and a depletion of PcG proteins and transcriptional activators. The lengths of the selected domains span those observed for all three epigenetic types in Drosophila (~10–500 kb).
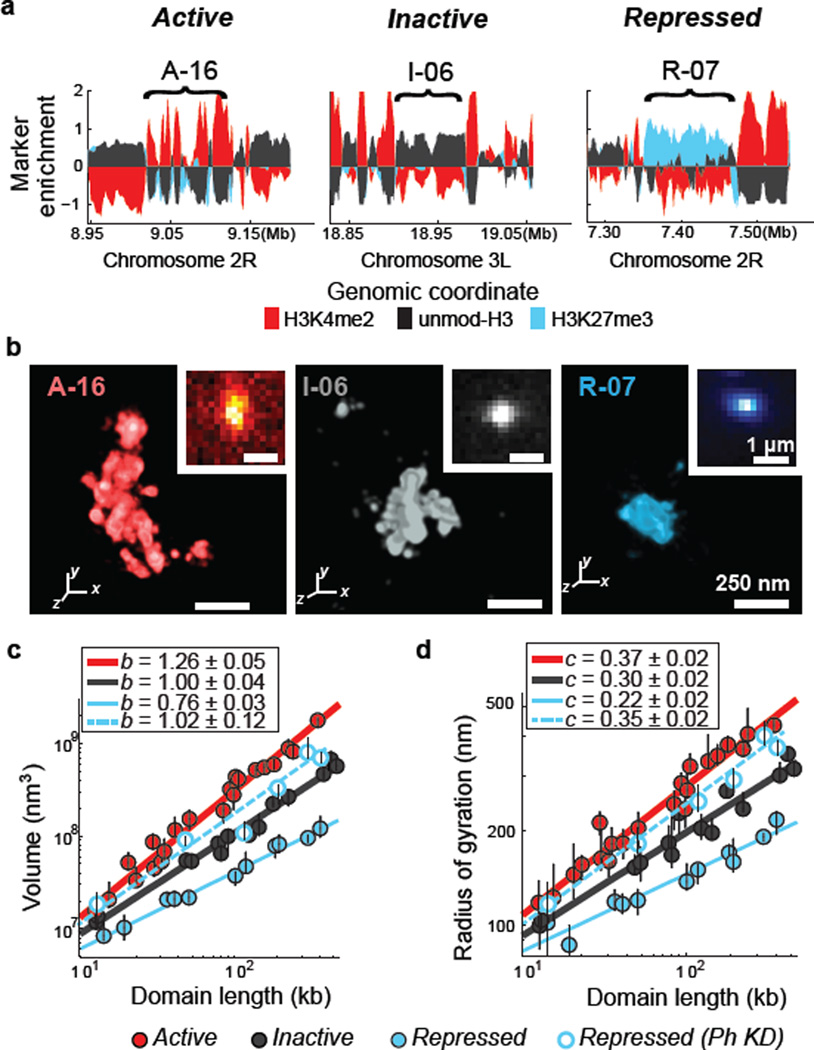
Figure 1. Chromatin in different epigenetic states exhibits distinct packaging and power-law scaling.
a, Enrichment profile of H3K4me2 (red), H3K27me3 (light blue) and unmodified H3 (black) in three genomic regions, each harbouring an example active, inactive or repressed domain (indicated by brackets). Marker enrichment, as defined in Supplementary Methods, was determined from ChIP-seq data20. b, 3D-STORM images of the three distinct epigenetic domains in (a), labelled by in situ hybridization with DNA probes conjugated to the photoswitchable dye Alexa-647, shown with their corresponding conventional images in the inset. Each epigenetic domain appears as a single region in nearly all cells due to homologous pairing in the tetraploid Kc167 cells. c, Log-log plot of the median domain volume as a function of domain length for active (red solid circles), inactive (black solid circles) and repressed (light blue solid circles) domains, as well as for repressed domains in Ph-knockdown cells (light blue hollow circles). Error bars represent 95% confidence intervals derived from resampling (n ≈ 50 cells). The lines indicate power-law fits, with the scaling exponent b shown in the legend. d, as in (c) but for the radius of gyration as a function of domain length with the scaling exponent c shown in the legend.
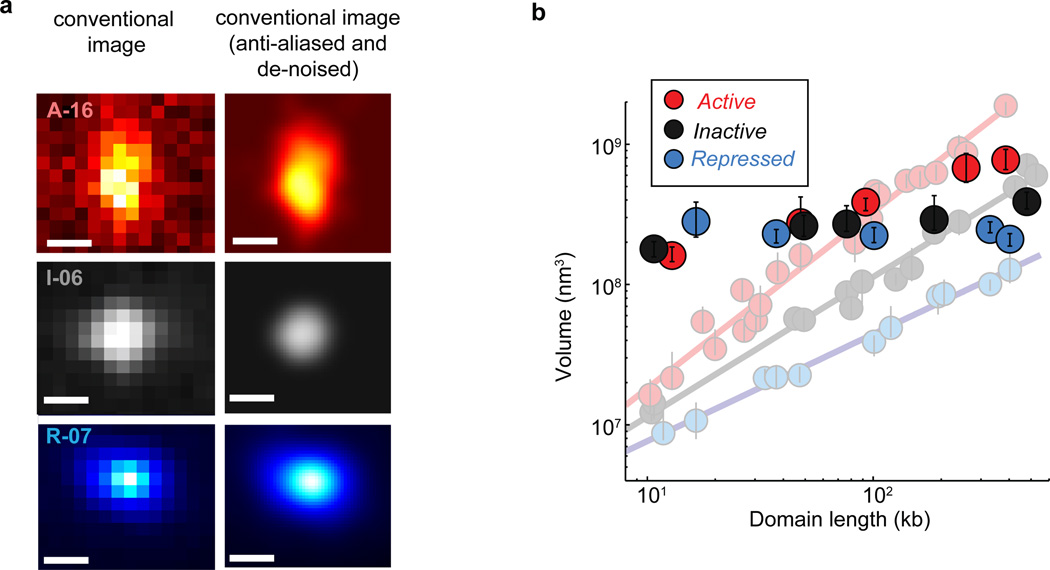
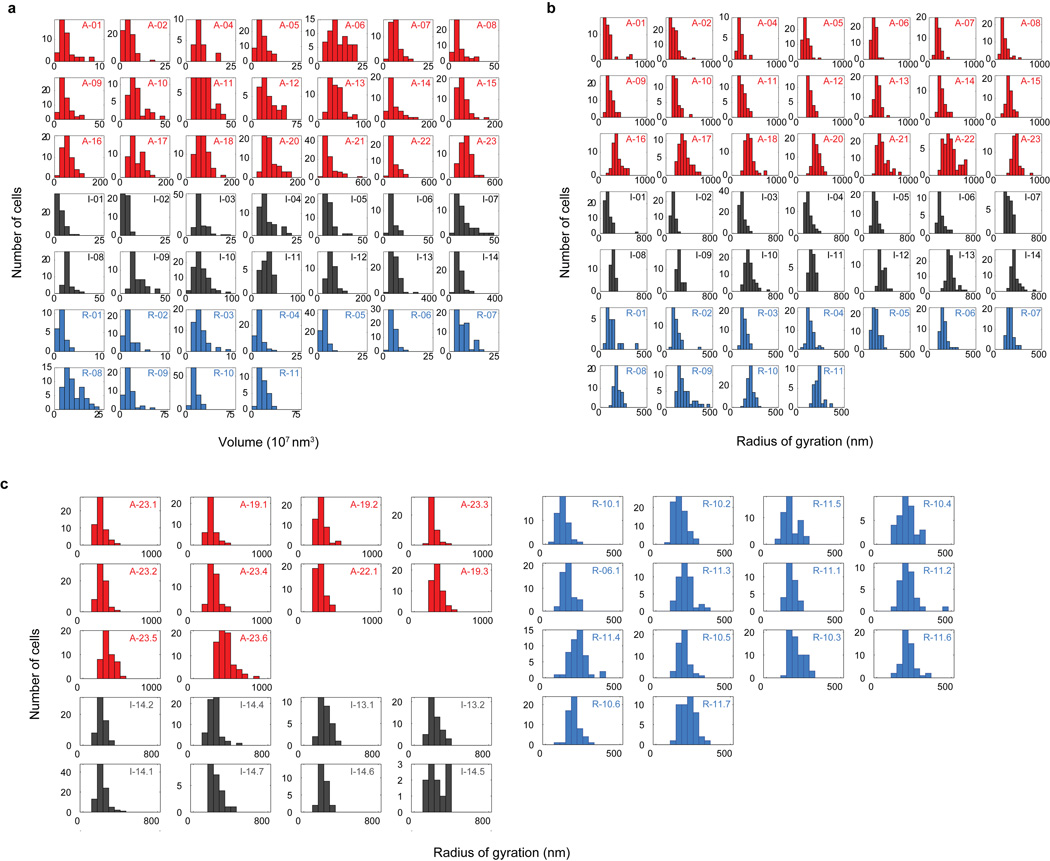
Compared to conventional fluorescence images, STORM images of these domains revealed substantially more structural information (Fig. 1b and Extended Data Fig. 4). From these super-resolution images, we first measured the physical volume occupied by each domain, as a measure of the compactness of the DNA in the domain (Fig. 1c; Extended Data Fig. 3b, c). The volume measurements showed cell-to-cell variations (Extended Data Fig. 5a, b), which may reflect differences in expression state or cell cycle. However, the values averaged over ~50 randomly selected cells for each domain exhibited a clear difference among the three types of epigenetic domains. Across the nearly two orders of magnitude of domain lengths that we studied, the median volumes of the active domains were always larger than those of the inactive domains of the same domain lengths, which were in turn always larger than those of the repressed domains (Fig. 1c, solid circles). These results are in line with previous data showing that PcG proteins can lead to chromatin compaction2,21–23 and that actively transcribed chromatin regions tend to be more open than non-transcribing regions2.
Notably, the volume (V) of the chromatin domains exhibited a power-law scaling behaviour with the domain length (L), i.e. V ~ Lb, and the scaling exponent b was distinct for the three different epigenetic states (Fig. 1c, solid circles; Extended Data Fig. 3b, c). Inactive chromatin domains had a scaling exponent of b = 1.00 ± 0.04 (± standard error), indicating that the 3D density of the chromatin was constant over different domain lengths. Active domains had a scaling exponent significantly greater than 1 (b = 1.26 ± 0.05), indicating increasingly less dense packaging for larger domains. Repressed domains exhibited the most intriguing scaling behaviour, with a scaling exponent that was notably less than 1 (b = 0.76 ± 0.03), indicating that the packaging density increased with increasing domain length. As an alternative measure of the physical sizes of chromatin domains, we determined the radius of gyration (Rg), defined as the root-mean square distance of molecule positions measured by STORM in each domain from the centroid of these positions in the domain (Supplementary Methods). Power-law scaling was also observed for Rg as a function of L, i.e. Rg ~ Lc, with the scaling exponents c = 0.37 ± 0.02, 0.30 ± 0.02, and 0.22 ± 0.02, for active, inactive and repressed domains, respectively (Fig. 1d, solid circles; Extended Data Fig. 3d). These scaling behaviours were conserved across different genomic regions on multiple chromosomes (Extended Data Fig 3a, b), suggesting that the different packaging behaviours are characteristic of the epigenetic states. Epigenetic states also influence the scaling of contact frequencies measured by chromosome conformation capture24, but how contact frequency is related to the size measurements here remains to be understood. In addition to different size-scaling properties, these different types of epigenetic domains also tend to have different 3D shape characteristics (Extended Data Fig. 3e, f).
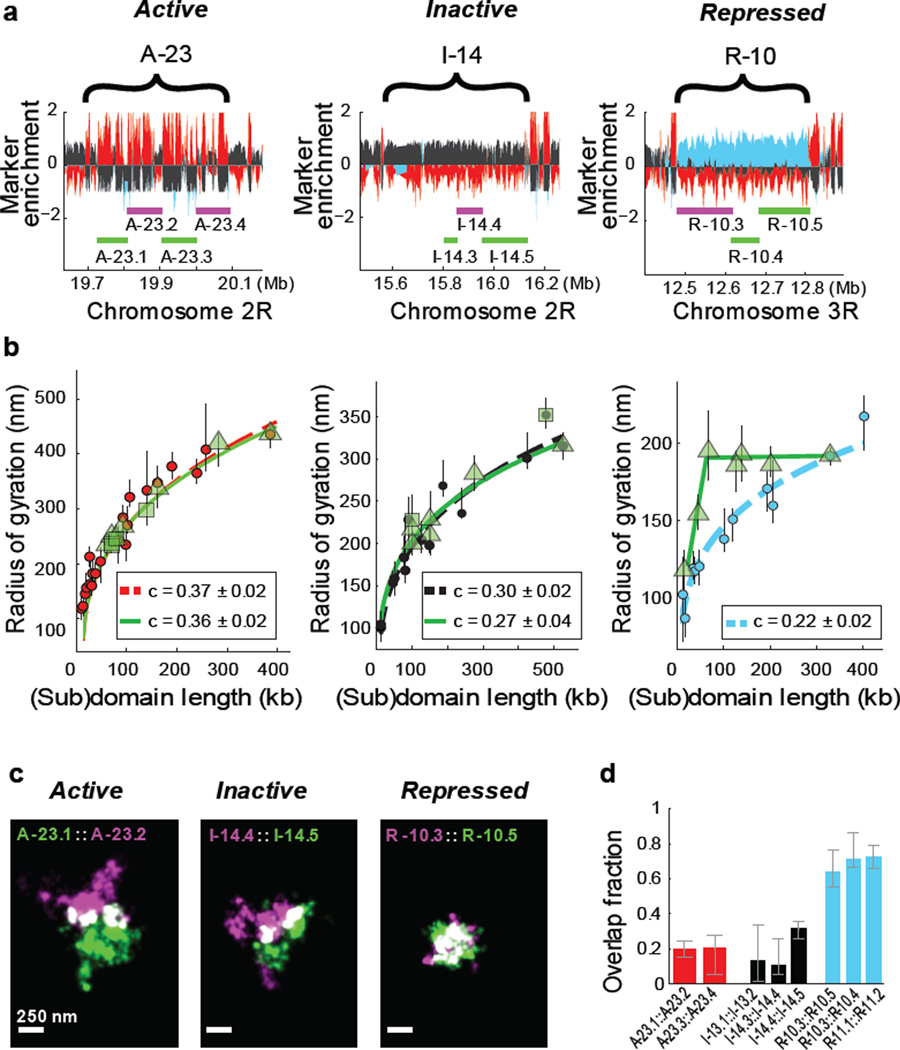
Next, we probed how chromatin was folded within epigenetic domains. To this end, we selected two large chromatin domains for each epigenetic type and measured the Rg of internal regions of varying lengths within these domains, hereafter referred to as subdomains (Fig. 2a, b; Extended Data Fig. 5c; Extended Data Table). Interestingly, both inactive and active domains showed a self-similar organization, in which the internal subdomains exhibited scaling behaviours that were similar to those observed for the whole epigenetic domains (Fig. 2b, left and middle). In stark contrast, we did not observe such a self-similar organization for either of the repressed chromatin domains investigated (the Bithorax (Fig. 2b, right) and Antennapedia (Extended Data Fig. 6) complexes). Instead, the Rg values grew rapidly as a function of subdomain length and quickly saturated such that subdomains longer than 1/5th of the length of the parent domain essentially all exhibited the same Rg values.
Figure 2. Different types of epigenetic domains exhibit distinct subdomain scaling and intermixing.
a, Marker enrichment profile of three genomic regions with the example epigenetic domains marked by brackets and imaged subdomains marked by green and magenta lines. b, Linear plot of the radius of gyration as a function of the subdomain length (green symbols), compared to those for the whole domain data (red, black or light blue circles), for active (left panel), inactive (middle panel) and repressed chromatin (right panel). Different green symbols (triangle and squares) represent subdomains of two different parent domains. Power-law fits of subdomains (green solid lines) and whole domains (red, black and light blue dashed lines) are shown with the scaling exponent c given in the legends. The green lines in the right panel are to guide the eye. c, Two-colour, 3D-STORM images of example pairs of subdomains within active (left), inactive (middle) and repressed (right) domains. Portions of the two subdomains that overlap in 3D are shown in white. The two subdomains are labelled with Alexa-647 and Alexa 750 tagged DNA probes, respectively. d, Quantification of overlap fraction between the subdomains for active (red), inactive (black), or repressed (light blue) chromatin (Supplementary Methods). Error bars represent 95% confidence intervals derived from resampling (n ≈ 50 cells).
The observation that even a small subdomain traversed nearly the entire volume of the parent domain predicts that two such small subdomains would occupy the same physical space, suggesting a high degree of intermixing of chromatin within these repressed domains. We tested this hypothesis by simultaneously labelling two subdomains within the same repressed domain with two distinct sets of FISH probes conjugated to spectrally distinct photoswitchable dyes and imaged these subdomains with two-colour STORM (Fig. 2c, right panel). Indeed, images of these subdomain pairs showed a high degree of overlap. This highly intermixed state was markedly distinct from the behaviours observed for the active and inactive chromatin regions that we examined, which were characterized by only moderate levels of intermixing between subdomains (Fig. 2c; left and middle panels). Quantitatively, the pairs of subdomains within each repressed domain showed ~60–80% overlap in space (median 68%, 3 different pairs of subdomains investigated, n ≈ 150 cells) (Fig. 2d, light blue). In contrast, the neighbouring subdomains of inactive chromatin only showed ~10–30% spatial overlap (median 26%, 3 different pairs of subdomains, n ≈ 150 cells) (Fig. 2d, black) and the neighbouring subdomains of active chromatin only showed ~15–25% spatial overlap (median 20%, 2 different pairs of subdomains, n ≈ 100 cells) (Fig. 2d, red). The difference observed between active (or inactive) subdomains and repressed subdomains is statistically highly significant (p < 1×10⁻¹⁰, Wilcoxon test). These results indicate that the degree of intermixing of chromatin within individual epigenetic domains depends strongly on the epigenetic state.
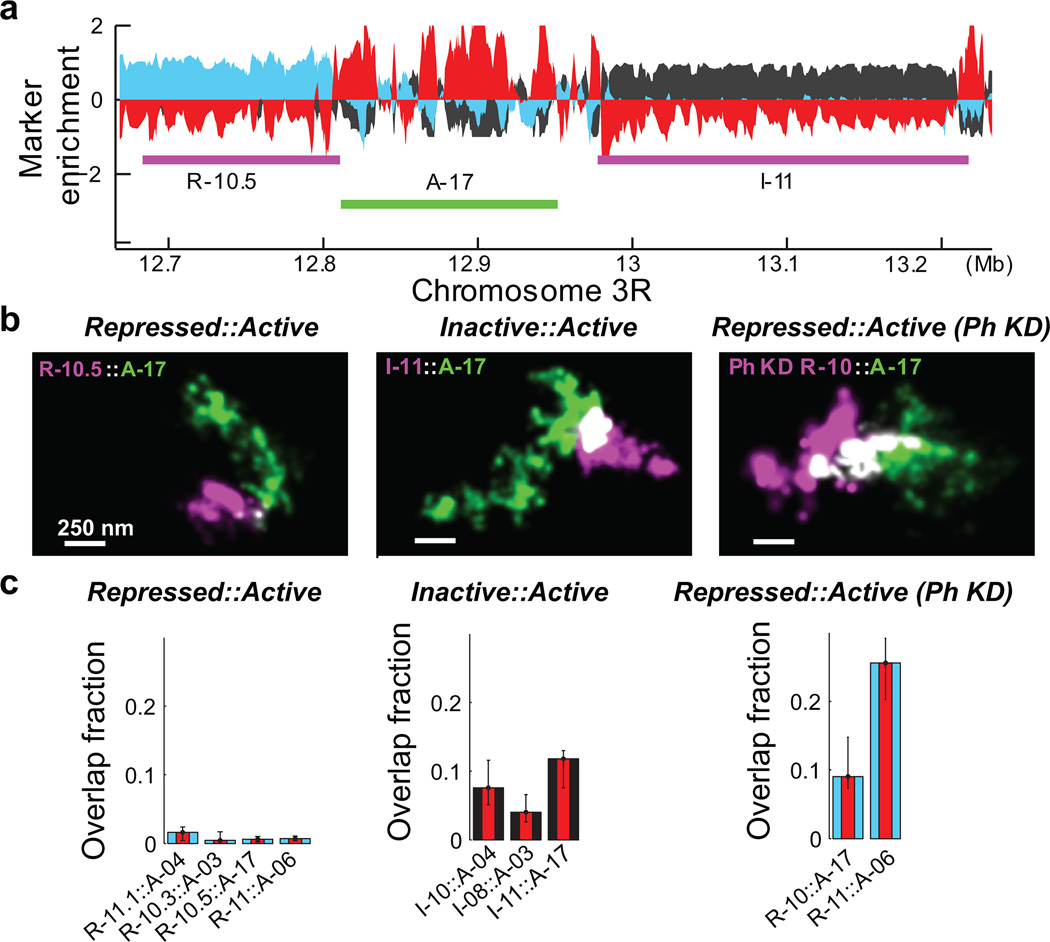
We then probed how these different epigenetic domains interacted with one another across epigenetic boundaries. Notably, the repressed domains did not show any appreciable overlap with neighbouring active domains, whereas the neighbouring inactive and active domains appeared to be partially intermixed with each other (Fig. 3a, b). We quantified four different repressed::active boundaries and three different inactive::active boundaries. The repressed domains typically showed less than 3% overlap with their neighbouring active domains (median 1.5%, n ≈ 150 cells), whereas inactive domains exhibited up to 15% overlap with neighbouring active domains (median 9.8%, n ≈ 150) (Fig. 3c). The difference between these two types of domain boundaries was statistically highly significant (p < 1×10⁻¹⁴, Wilcoxon test). Therefore, the degree of spatial separation between neighbouring domains of different epigenetic types also depends strongly on the epigenetic state.
Figure 3. Neighbouring chromatin domains show different amount of intermixing for different types of epigenetic boundaries.
a, Marker enrichment profile of a genomic region harbouring three epigenetic domains marked by the magenta and green lines. b, Two-colour, 3D-STORM images for neighbouring epigenetic domains with repressed::active and inactive::active boundaries in wildtype cells, as well as for the repressed::active boundaries in Ph-knockdown (Ph KD) cells. c, Quantification overlap fraction between the indicated neighbouring domains (Supplementary Methods). Error bars represent 95% confidence intervals derived from resampling (n ≈ 50 cells).
The different packaging and intermixing behaviour observed for these chromatin types point to distinct mechanisms involved in chromatin folding in the different epigenetic states. It is remarkable that the two types of non-transcribing chromatin — inactive and repressed states — exhibited such distinct packaging behaviours. The repressed chromatin appeared to exhibit a substantially more compact packing, higher degree of chromatin intermixing within domains, and stronger tendency to spatially exclude neighbouring domains. To explore the potential mechanisms underlying these different packaging behaviours, we employed stochastic polymer simulations. It has been suggested that genomic DNA can be approximated as a “fractal globule”, which arises when an unknotted polymer is confined into a volume substantially smaller than the relaxed volume of the polymer25–27. Our experimentally observed power-law scaling (Rg ~ L0.3) and self-similar organization of the inactive chromatin are roughly consistent with the expected properties of the fractal globule, as confirmed by our simulations of a polymer confined to a small volume (Supplementary Methods) (Fig. 4a, b).
Figure 4. Computational modelling of chromatin packaging for inactive and repressed domains.
a, Radius of gyration of polymer domains as a function of the domain length for simulated polymers confined in a small volume to emulate inactive chromatin. Error bars indicate 95% confidence intervals derived from resampling (n ≈ 20 simulations). The line indicates the power-law fit with the scaling exponent c = 0.33. b, Radius of gyration of subdomains of a parent inactive domain (green triangles) compared to the whole-domain scaling data (black circles) with power-law fits and scaling exponents shown. c, Radius of gyration as a function of the domain length for the simulated sticky polymer domain, embedded in a non-stick, confined polymer, to emulate repressed chromatin. The light blue line represent the power-law fit with the scaling exponent c = 0.22. The black dotted line indicates the point at which the closest possible packing of monomers is reached, causing c to deviate from 0.22 and approach 0.33 beyond this point. c also deviates from 0.22 at the small monomer number end because such a short polymer chain cannot sufficiently bend. d, Radius of gyration of the subdomains (green triangles) of the parent sticky domain in comparison with the whole-domain scaling data (light blue circles). e, Snapshots of simulations showing adjacent subdomains in the inactive (non-sticky) chromatin, adjacent subdomains of the repressed (sticky) chromatin, and adjacent repressed and inactive chromatin domains. f, Quantification of the overlap fraction (Supplementary Methods) between the adjacent polymer regions illustrated in (e).
Polycomb-repressed chromatin, on the other hand, exhibited distinct folding behaviours that could not be explained by the fractal globule model. Prompted by the observations that some PcG proteins can bridge nucleosomes21,22, we used self-interacting monomers28 to simulate such PcG-mediated chromatin interactions. We then embedded such a “sticky” polymer domain containing self-interacting monomers within a large non-sticky polymer (to emulate the surrounding non-repressed domains), and simulated the polymer in a confined volume (Supplementary Methods). This model reproduced the packaging behaviours that we observed for repressed chromatin domains provided that the monomer-interaction strength was not too strong to cause irreversible monomer binding and that the simulation was sufficiently long to achieve intermixing (Supplementary Methods). First, the scaling exponent of 0.22 ± 0.01 (Rg ~ L0.22) derived from the simulation agreed quantitatively with the experimentally observed value (Fig. 4c). Second, subdomains of these simulated polymers showed a saturation behaviour where the subdomains had nearly the same Rg values as the full domain until they became less than one-third the length of the parent domain (Fig. 4d), also similar to our experimental observation (Fig. 2b, right panel). Third, subdomains within the sticky polymer domains exhibited substantially more intermixing than neighbouring subdomains of the non-sticky polymer, and the sticky polymer domains spatially excluded neighbouring non-sticky regions (Fig. 4e, f) – both behaviours also consistent with the differences that we observed experimentally between repressed and inactive chromatin domains (Fig. 2c, d and Fig. 3b, c). Overall, our simulation results suggest that interactions between PcG proteins could provide an explanation for the distinct folding behaviour observed for the repressed chromatin, though it is possible that other mechanisms also contribute to the observed folding behaviour.
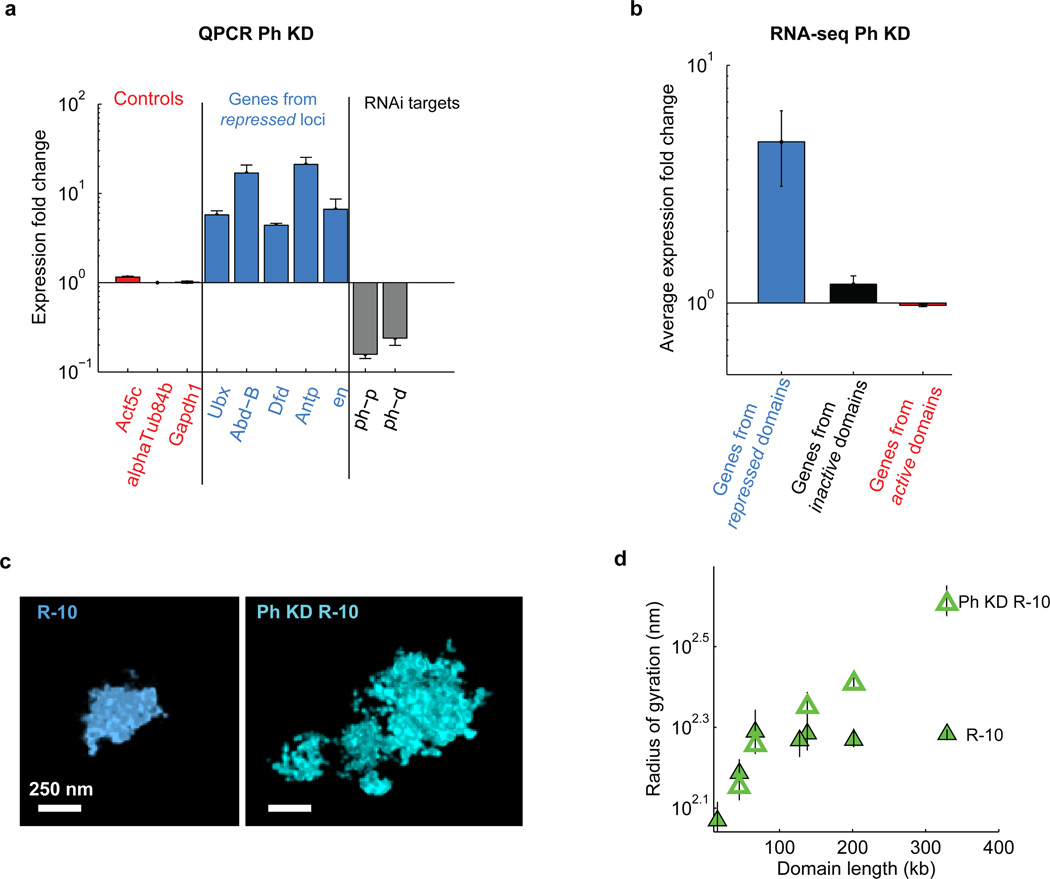
To test if these structural features for repressed domains indeed depend on PcG proteins, we used RNAi to knockdown a Polycomb Repressive Complex I (PRC1) component, Polyhomeotic (Ph), which contains a SAM motif that is capable of self-interaction29. qPCR experiments indicated a ~80% knockdown efficiency of the two copies of ph, ph-p and ph-d (Extended Data Fig. 7a). Functionally, Ph-knockdown led to a substantial increase in expression of many known PcG-target genes but did not affect the expression of the hundreds of genes from the inactive and active domains that we imaged (Extended Data Fig. 7a, b), consistent with previous work showing the important role of PcG proteins in transcriptional repression2,21–23. Structurally, Ph-knockdown abolished all of the three unique packaging properties that we observed for the repressed domains. First, Ph-knockdown caused substantially decompaction of the repressed domains to an extent that their 3D sizes approached those of active domains, and the power-law scaling coefficients of the repressed domains increased substantially such that the domains no longer became more densely packed with increasing domain length (Fig. 1c, d, hollow circles, Extended Data Fig. 7c). Second, Ph-knockdown abolished the saturation effect that we observed for the subdomains of the repressed domains (Extended Data Fig. 7d). Finally, the spatial overlap between neighbouring repressed and active domains in Ph-knockdown cells increased dramatically to 20–30% (Fig. 3b, c), becoming similar to the extent of overlap observed between neighbouring active subdomains. The increase in intermixing of repressed and active domains upon Ph-knockdown is statistically highly significant (Wilcoxon test p = 1×10⁻¹⁸, n ≈ 150 cells). These data indicate that the unique structural properties that we observed for the repressed domains indeed depend on PcG proteins, potentially through the self-interactions of the Ph component of PRC1.
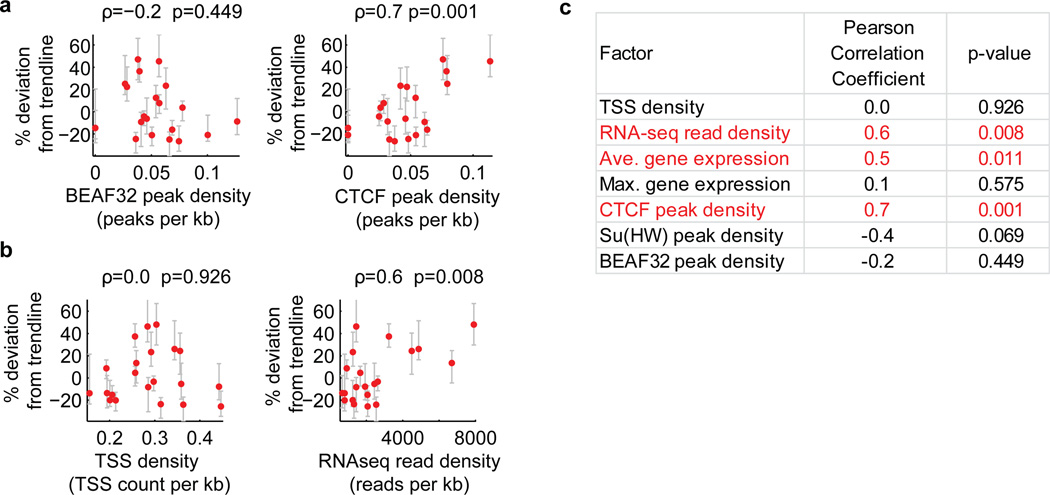
Although we primarily focused on the relationship between chromatin structures and epigenetic states, our experimental data also revealed significant locus-specific variations in chromatin packaging, particularly for the active domains (Extended Data Fig. 8). After normalization for different domain lengths based on our observed scaling law, 42% of the pairs of examined active domains showed statistically distinct degrees of compaction (p < 0.05), while this fraction was only 16% for the examined repressed domains (Extended Data Fig. 8b). These variations may be linked to local genomic context, such as different activating histone modifications or transcription factor binding20, or different levels of transcriptional activity. Indeed, our analysis suggested that domains with higher transcriptional activity (measured by RNA-seq) appeared to have less dense packaging, as did domains with higher than average density of CTCF binding, though the degrees of correlation were only moderate (Extended Data Fig. 9).
Taken together, our results showed that direct visualization of DNA in the nucleus with nanometre-scale resolution can reveal previously unseen structural details of chromatin. We observed three distinct spatial organizations for chromatin in Drosophila cells, each corresponding to a different epigenetic state. Transcriptionally inactive chromatin, lacking substantial post-translational modification or transcription factor binding, adopts a 3D organization that resembles the fractal globule state of a polymer. On the other hand, Polycomb-repressed chromatin adopts a substantially more compact packaging configuration. Within these repressed domains, chromatin is highly intermixed, much more so than within the constitutively inactive chromatin. These Polycomb-repressed domains harbour genes encoding key developmental transcription factors, whose misexpression can have detrimental consequences in differentiated cells. Such a high-density packaging and high degree of chromatin intermixing may contribute to the inaccessibility of DNA to the transcription machinery, and thereby may help ensure that transcription is repressed in this chromatin state21,22. Moreover, our observation that Polycomb-repressed domains become increasingly more compact as the domain length increases could explain why PcG-targeted genes (such as the well-known Hox genes) tend to cluster in the genome. Concatenating PcG domains would increase domain length and therefore could lead to more compact packaging and potentially a more complete repression of gene expression. Notably, these Polycomb-repressed domains also strongly exclude intermixing with nearby (active) chromatin, which may help prevent “bystander” activation30 caused by transcription activators and enhancers accidentally brought into proximity of PcG-targeted genes by the active chromatin. We note that the Polycomb-repressed domains investigated here all have relatively high density of bound PcG proteins (Supplementary Methods); it is thus possible that the structural properties that we observed may not apply to all Polycomb-enriched domains and that a sufficiently high PcG density is needed to establish these properties. Finally, we observed a far less compact packaging for transcriptionally active domains as compared to transcriptionally inactive domains; such an open structure could help transcription factors and polymerase machinery gain access to the encoded genes and facilitate transcription. Thus, our data suggest that epigenetic factors not only partition the genome into distinct, one-dimensional domains of different biochemical properties but can also shape the three-dimensional nanoscale structures of these domains, which may work in concert with the biochemical properties to regulate gene expression.
Extended Data
Extended Data Figure 1. Schematic of oligonucleotide probe design and synthesis.
A unique pair of index primers are used in a PCR reaction to selectively amplify the templates for the probe set of interest from a complex pool of custom, array-derived oligonucleotides. These templates are then amplified and converted to RNA in an in vitro transcription reaction. The RNA products are converted back to DNA in a reverse-transcription reaction using a primer labelled with an activator dye, Alexa 405, which incorporates the dye into the resulting single-stranded DNA probe. Finally, a 32-nt oligonucleotide attached to Alexa 647 is hybridized to all of the probes. The photoswitchable dye, Alexa 647, is used for STORM imaging. The activator dye, Alexa 405, facilitates the 405-nm light induced reactivation of the Alexa 647 dye.
Extended Data Figure 2. Effect of cell fixation on chromatin sizes.
a, Top panels: Example images of DNA in a Kc167 cell, visualized with the viable DNA dye Hoechst 33342, both in the live cell before fixation and in the same cell after applying our fixation buffer (osmotically balanced methanol-free formaldehyde in PBS). Bottom panels: Same as the top panels but for a Kc167 cell before and after fixation with methanol, a fixative that is known to cause a shrinkage effect. b, Quantifications of the distances between chromatin features in live and fixed cells. Corresponding chromatin features were identified in the live and corresponding fixed cell images through scale-invariant feature transform (SIFT) registration40. We measured distances between pairs of identified SIFT features in each cell, and calculated the ratio between the median inter-feature distances before and after fixation for each cell. Plotted here are the histograms of ratios determined from many cells for fixation with our osmotically balanced methanol-free formaldehyde fixation buffer (magenta), for a “mock fixed” condition in which the growth media was replaced with fresh media without any fixation reagent (cyan), and for fixation with methanol (red), n ≈ 80 cells in each cases. The average ratios are 1.009 ± 0.003 and 1.008 ±0.003 for fixation with our fixation buffer and the mock fixation, respectively, indicating a lack of shrinkage effect. In contrast, the average ratio for the methanol-fixation case (0.868 ± 0.005) is appreciably less than one, indicating a chromosome shrinkage induced by methanol. c, STORM images of TRF1-mMaple3 labelled telomeres in live and fixed HEK293 cells. mMaple3 is a photoactivatable fluorescent protein42. Cells are fixed with our osmotically balanced methanol-free formaldehyde in PBS. Two examples of telomere STORM images are shown for each condition. d, Quantifications of the radius of gyration of the telomeric domains in live and fixed cells. We determined the radius of gyration for each telomere structure and plotted here are the histograms of the radii of gyration across ~150 telomeres from ~30 cells for live (Cyan) and fixed (Magenta) cells. The average radius of gyration is 77 ± 3 nm for live cells and 78 ± 2 nm for fixed cells, again indicating that there is no significant chromatin shrinkage effect upon fixation. The telomere size measurement is not limited by our image resolution with mMaple3 (~30 nm).
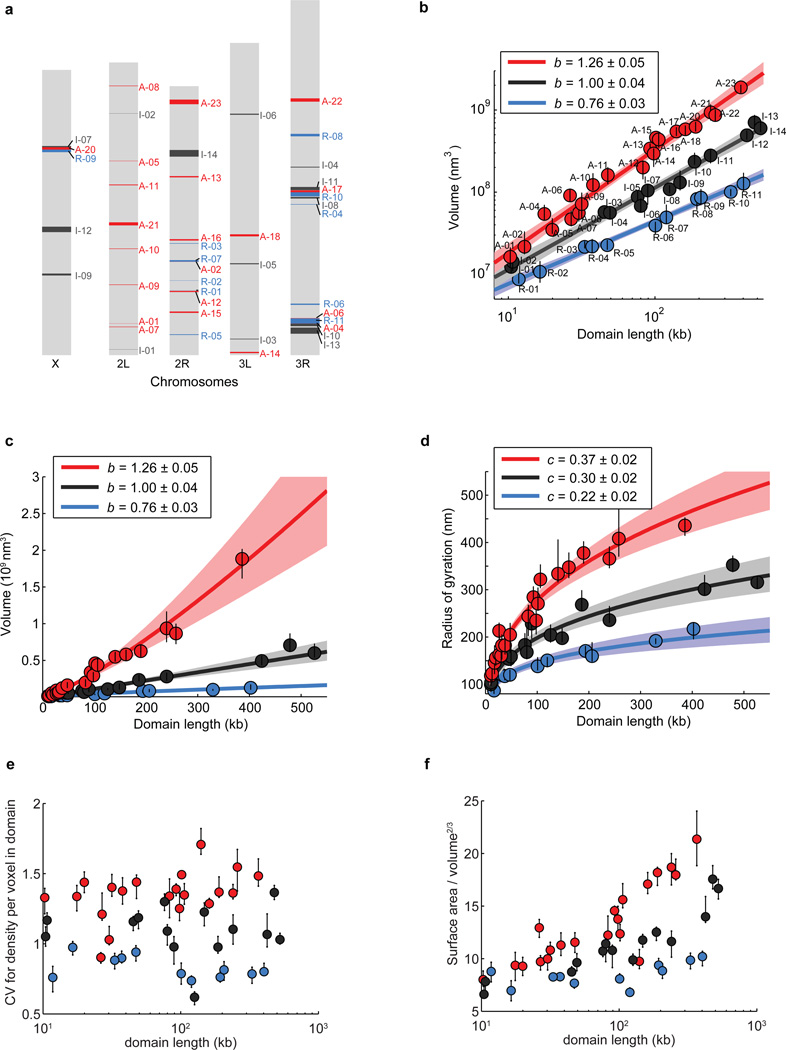
Extended Data Figure 3. Volume, radius of gyration and other shape characteristics for chromatin domains of various domain lengths in three different epigenetic states.
a, Scheme of Drosophila chromosomes (X, 2L, 2R, 3L, and 3R) with the position of the imaged epigenetic domains marked (Red: active domains A-01 to A-23; Black: inactive domains I-01 to I-14; Blue: repressed domains R-01 to R-11). b, Log-log plot of the median domain volume as a function of domain contour length reproduced from Fig. 1c but with the domain ID labelled. c, As in Fig. 1c but plotted on a linear-linear scale. d, Linear plot of the median radius of gyration as a function of domain contour length. e, Coefficient of variation (CV) in density per voxel for all domains as a function of domain length. CV in density is defined as the ratio of the standard deviation of density to the average density within the domain-occupied volume, which characterizes how uniformly the chromatin is distributed in space within these domains (Supplementary Methods). f, Ratio of surface area to volume2/3 for all domains as a function of domain length. This surface-to-volume parameter characterizes the complexity of the physical shapes taken by the domains in 3D (Supplementary Methods). Error bars represent 95% confidence intervals derived from resampling.
Extended Data Figure 4. Conventional images of chromatin domains and domain volume characterization based on conventional images.
a, Blow-up view of the conventional images of chromatin domains shown in Fig. 1b. The left column shows the raw conventional, wide-field images, with pixel size defined by our camera. The right column shows the corresponding anti-aliased and de-noised images. b, Quantification of the median domain volume determined from conventional images (foreground symbols), overlaid on the median volume determined from STORM data plotted in Fig. 1c (faint background symbols and lines). Error bars represent 95% confidence intervals derived from resampling. Note that the conventional images may not only cause an artificial increase in domain size, especially severe for those domains whose physical sizes are smaller than the image resolution, but can also lead to an apparent decrease in domain size in some cases when the thin protrusions was too dim to detect by conventional imaging.
Extended Data Fig 5. Distributions of domain volume and radius of gyration of different epigenetic domains and subdomains over all imaged cells.
a, Histograms of domain volume for all imaged cells for each of the domains shown in Extended Data Fig. 2a. Red: active domains; Black: inactive domains; Light blue: repressed domains. The domain IDs are indicated in the upper right corner of each plot. The x-axis (volume) range has been adjusted for each domain to ensure the readability of the histogram. b, Histograms of the radius of gyration for each of the imaged domains in all cells. c, Histograms of the radius of gyration for subdomains of active (red), inactive (black) and repressed (blue) chromatin, shown in Fig. 2b and Extended Data Fig. 6, for all imaged cells. The subdomain IDs are indicated in the upper right corner of each plot.
Extended Data Figure 6. Additional data on the scaling behaviour of subdomains of repressed chromatin.
a, Enrichment profile of H3K4me2 (red), H3K27me3 (light blue) and unmodified H3 (black) in a genomic region harbouring the repressed domain R-11 (Antennapedia complex). b, The radius of gyration of subdomains (green triangles) of R-11 as a function of subdomain length compared to the scaling of whole repressed domains (light blue circles). The data shown in Fig. 2b, right panel are for the R-10 domain (Bithorax complex). The light blue dashed line indicates the power-law fit for the whole domain data. Green lines are to guide the eye. Error bars represent 95% confidence intervals (n ≈ 50 cells).
Extended Data Figure 7. Effect of polyhomeotic (Ph) knockdown.
a, Quantification of relative change in gene expression by qPCR (mean +/− s.e.m., n = 3 biological replicates) upon ph-p and ph-d double knockdown. Grey bars: Expression fold change of ph-p and ph-d upon the double knockdown. Light blue bars: Expression fold change of five Polycomb target genes, Ubx, Abd-B, Dfd, Antp, en. Red bars: Expression fold change of three control genes, Act5c, alphatub84b and Gapdh1, that are not targeted by Polycomb. Expression fold change was determined as the ratio between the signal detected in ph-p and ph-d double knockdown cells and that detected in wild-type cells. b, Average expression fold change upon ph-p and ph-d double knockdown for all genes in all of the active (red), inactive (black) and repressed (light blue) domains included in our study. The expression fold change is defined as the ratio of expression level measured in Ph-knockdown cells to that measured in the wild-type control cells determined by next generation RNA sequencing (mean ±s.e.m., n = 45, 89 and 532 genes for Repressed, Inactive and Active domains, respectively, 2 biological replicates). Expression level was measured in units of read fragments per kilobase per million reads (FPKM). Note, some genes (9 from Repressed regions, 11 from Inactive regions and 2 from Active regions) are excluded from the average expression fold change calculation because they received zero counts in the wild-type control cells. c, Example images of the R-10 domain (Bithorax complex) in wild-type (left) and Ph-knockdown (right) cells. d, Radius of gyration vs. domain length for subdomains of R-10 in wild-type cells (solid green triangles) and Ph-knockdown cells (hollow green triangles).
Extended Data Figure 8. Locus-to-locus variation observed for the three types of epigenetic domains after normalization based on the observed scaling law over domain length.
a, the normalized volume for domains of active (left), inactive (middle), and repressed (right) chromatin. Normalized volume is defined as the ratio of median volume of the domain to the expected volume calculated from the power-law scaling fits shown in Fig. 1c. Error bars represent 78% confidence intervals, such that there is a less than 5% chance that domains with non-overlapping error bars are not distinct. b, Volcano plots of the relative differences in volume between all pairs of active domains (left), inactive domains (middle) or repressed domains (right), after the normalization shown in (a). Each data point represents one pair of domains with their ratio of the normalized volumes plotted on the x-axis and the p-value of their normalized volume difference plotted on the y-axis. The dashed line is at a p-value of 0.05. All dots above this line represent pairs of domains in which the normalized volume of one domain is statistically distinguishable that of the other domain. c, Standard deviation of the normalized volumes for each domain type. Error-bars represent 95% confidence intervals.
Extended Data Figure 9. Additional factors correlating with the domain volume after normalizing the effect of domain length for active domains.
To normalize for the effect of domain length, we determined the percent deviation of the volumes of active domains from the power law scaling trendline shown in Fig. 1c, and hereafter refer to this value as percent deviation from trendline. a, Correlation of the percent deviation from trendline with the binding density of the insulator proteins BEAF32 (left) and CTCF (right). Binding density was determined from the density of peaks per kb in Dam-ID data20. Peaks were defined as local maxima at least 2 standards deviation above the mean. b, As in (a) but for correlation with transcription start site (TSS) density (left) and RNA-seq total read density (right). The TSS density is defined as the average number of TSSs per kb in the domain and the RNA-seq total read density is defined as the total number of reads mapping to the domain measured using RNA sequencing divided by the domain length in kb. c, Pearson Correlation coefficients and corresponding p-values for the correlation of percent deviation from trendline with the indicated genomic factors. Average gene expression is referring to the average expression value in FPKM (read fragments per kilobase per million reads) of all genes in the domain. Maximum gene expression is referring to the FPKM of the most highly expressed gene in the domain. Su(Hw) is an insulator protein like BEAF32 and CTCF. We noticed a weak trend in which domains with higher binding densities of the insulators BEAF32 or Su(Hw) are slightly more compact. Although this trend is consistent with the hypothesis that insulator proteins may function as loop forming factors and that loops may lead to more compact domains12, the correlation detected here was not statistically significant. Further analysis with improved sensitivity in detection of BEAF32 or Su(Hw) binding sites might uncover a stronger affect, so our data do not rule out the insulator loop hypothesis. Similarly, we caution that the positive correlation observed with the density of CTCF binding sites might reflect the preference of CTCF to bind open chromatin regions (such as enhancers and promoters), and does not necessarily suggest that CTCF binding induces a more open chromatin state.
Extended Data Table 1. Epigenetic domains and subdomains probed.
List of the domain IDs, locus coordinates, lengths (in base pairs) and representative harboured genes of all epigenetic domains and subdomains imaged in this study.
| Domains | Subdomains | ||||||
|---|---|---|---|---|---|---|---|
| ID | Genome coordinate | Length (bp) | Selected genes | ID | Genome coordinate | Length (bp) | Selected genes |
| A-01 | chr2L:2489241-2499536 | 10295 | oaf | A-19.1 | chrX:1907754-1977754 | 70000 | (Many genes) |
| A-02 | chr2R:7338881-7351765 | 12884 | E(Pc) | A-19.2 | chrX: 1977754-2047754 | 70000 | (Many genes) |
| A-03 | chr3R:12464802-12479673 | 14871 | Cctgamma | A-19.3 | chrX: 1907754-2047754 | 140000 | (Many genes) |
| A-04 | chr3R:2470393-2487998 | 17605 | Taf1 | A-22.1 | chr3R:19929199-20029199 | 100000 | (Many genes) |
| A-05 | chr2L:15254575-15274520 | 19945 | yuri | A-23.1 | chr2R:19726615-19787585 | 60970 | (Many genes) |
| A-06 | chr3R:2890667-2916994 | 26327 | alphaTub84b, Dpck, Aly | A-23.2 | chr2R:19809874-19888410 | 78536 | (Many genes) |
| A-07 | chr2L:2210964-2237817 | 26853 | mio, Uch, rti, | A-23.3 | chr2R:19906491-19976552 | 70061 | (Many genes) |
| A-08 | chr2L:21153308-21183571 | 30263 | Acon, bur, Mpp6, Nbr, Mcm10, Ret | A-23.4 | chr2R:20000481-20092780 | 92299 | (Many genes) |
| A-09 | chr2L:5517877-5549514 | 31637 | Lam, Cap-D3, tomb, Oscillin, Hel25E, cl | A-23.5 | chr2R:19726615-19888410 | 161795 | (Many genes) |
| A-10 | chr2L:8353587-8391384 | 37797 | Aats-ala, RpS13, CSNS, Pp2A-29B, Rcd4, Mur29b |
A-23.6 | chr2R:19809874-20092780 | 282906 | (Many genes) |
| A-11 | chr2L:13363559-13411277 | 47718 | Vm34Ca,RpL24, loqs. beta’Cop, Tap42,Nnp-1 |
I-13.1 | chr3R:1786654-1886654 | 100000 | Pbprp3,Os-E |
| A-12 | chr2R:4972056-5054981 | 82925 | (Many genes) | I-13.2 | chr3R:1686653-1786653 | 100000 | (Contains only genes of little known function) |
| A-13 | chr2R:13979742-14072371 | 92629 | (Many genes) | I-14.1 | chr2R:15602615-15702615 | 100000 | Or56a,Obp56g |
| A-14 | chr3L:167832-265882 | 98050 | (Many genes) | I-14.2 | chr2R:15702616-15802615 | 99999 | Obp56h,Toll-7,Obp56i |
| A-15 | chr2R:3328439-3429969 | 101530 | (Many genes) | I-14.3 | chr2R:15802616-15852615 | 49999 | (Contains only genes of little known function) |
| A-16 | chr2R:9019018-9125165 | 106147 | (Many genes) | I-14.4 | chr2R:15852616-15952615 | 99999 | (Contains only genes of little known function) |
| A-17 | chr3R:12811417-12951671 | 140254 | (Many genes) | I-14.5 | chr2R:15952616-16128463 | 175847 | 18w |
| A-18 | chr3L:9344016-9505324 | 161308 | (Many genes) | I-14.6 | chr2R:15702616-15852615 | 149999 | Obp56h,Toll-7,Obp56i |
| A-19 | chrX:1907754-2083414 | 175660 | (Many genes) | I-14.7 | chr2R:15802616-15952615 | 149999 | (Contains only genes of little known function) |
| A-20 | chrX:16161627-16351359 | 189732 | (Many genes) | I-14.8 | chr2R:15852616-16128463 | 275847 | 18w |
| A-21 | chr2L:10203488-10443191 | 239703 | (Many genes) | R-06.1 | chr3R:3967588-4043731 | 76143 | grn |
| A-22 | chr3R:19929199-20187132 | 257933 | (Many genes) | R-10.1 | chr3R:12571412-12586412 | 15000 | (Ubx regulatory region) |
| A-23 | chr2R:19726615-20092780 | 366165 | (Many genes) | R-10.2 | chr3R:12571412-12616414 | 45002 | (Ubx regulatory region) |
| I-01 | chr2L:455203-465638 | 10435 | (Contains only genes of little known function) |
R-10.3 | chr3R:12481406-12619389 | 137983 | Ubx |
| I-02 | chr2L:18991061-19001768 | 10707 | (Contains only genes of little known function) |
R-10.4 | chr3R:12616227-12683098 | 66871 | abd-A |
| I-03 | chr3L:1250391-1295624 | 45233 | (Contains only genes of little known function) |
R-10.5 | chr3R:12683230-12810708 | 127478 | Abd-B |
| I-04 | chr3R:14754844-14804163 | 49319 | (Contains only genes of little known function) |
R-10.6 | chr3R:12481406-12683098 | 201692 | Ubx, abd-A |
| I-05 | chr3L:7154799-7231065 | 76266 | (Contains only genes of little known function) |
R-11.1 | chr3R:2487143-2570646 | 83503 | zen2, pb, lab |
| I-06 | chr3L:18903046-18983014 | 79968 | (Contains only genes of little known function) |
R-11.2 | chr3R:2568667-2653159 | 84492 | Dfd, bcd, zen, zen2 |
| I-07 | chrX:16351360-16440669 | 89309 | para(DmNav1) | R-11.3 | chr3R:2641835-2721984 | 80149 | Scr, ftz |
| I-08 | chr3R:12312771-12438748 | 125977 | Scp2, Decay, Gr89a, npf | R-11.4 | chr3R:2721063-2827254 | 106191 | Antp |
| I-09 | chrX:6269580-6417829 | 148249 | (Contains only genes of little known function) |
R-11.5 | chr3R:2825712-2889707 | 63995 | Sodh-1, (Antp regulatory region) |
| I-10 | chr3R:2287031-2473421 | 186390 | sunz, glob2, dpR-11 | R-11.6 | chr3R:2487143-2653159 | 166016 | Scr, Dfd, bcd, zen, zen2, pb, lab |
| I-11 | chr3R:12977555-13217431 | 239876 | beat-IIa, beat-IIb, Brf | R-11.7 | chr3R:2568667-2827254 | 258587 | Antp, ftz, Scr, Dfd, bcd, zen, zen2 |
| I-12 | chrX:9679192-10103054 | 423862 | Yp1, Yp2, Cht6, Ser7, Idgf4 | ||||
| I-13 | chr3R:1686653-2165126 | 478473 | Or83c, Os-E, Osi3-Osi19, Pbprp3, Obp83cd, Obp83ef, Obp83g | ||||
| I-14 | chr2R:15602615-16128463 | 525848 | 18w, Toll-7, Obp56h,Obp56i | ||||
| R-01 | chr2R:5080631-5092410 | 11779 | unpg | ||||
| R-02 | chr2R:5860081-5876517 | 16436 | eve | ||||
| R-03 | chr2R:8770090-8803242 | 33152 | vg | ||||
| R-04 | chr3R:11833445-11870730 | 37285 | pnr, GATAe | ||||
| R-05 | chr2R:1593366-1640664 | 47298 | ap | ||||
| R-06 | chr3R:3953538-4054361 | 100823 | grn | ||||
| R-07 | chr2R:7350135-7469804 | 119669 | en, inv | ||||
| R-08 | chr3R:17205633-17399201 | 193568 | slou, lbe, lbl, bap | ||||
| R-09 | chrX:15953918-16160086 | 206168 | disco, disco-r, Tob | ||||
| R-10 | chr3R:12481406-12810708 | 329302 | Abd-B, abd-A, Ubx (Bithorax-complex) | ||||
| R-11 | chr3R:2487143-2889707 | 402564 | Antp, ftz, Scr, Dfd, bcd, zen, zen2, pb, lab (Antenopedia-complex) |
||||
Supplementary Material
Acknowledgments
We thank Hazen Babcock for help with instrumentation and technical advice, Jané Kondev for insightful discussions about the data, Anton Goloborodko for sharing custom OpenMM force-field, and Sonny Nguyen for discussions on RNAi knockdown protocol. This work was supported in part by the National Institutes of Health (X.Z., C.W., L.M.). A.N.B. acknowledges support by the Damon Runyon Foundation postdoctoral fellowship. J.R.M. acknowledges support of the Helen Hay Whitney Foundation postdoctoral fellowship. S. W. acknowledges support of the Jane Coffin Childs Foundation postdoctoral fellowship. X.Z. is a Howard Hughes Medical Institute Investigator.
Footnotes
Supplementary Information (including Supplementary Methods and Supplementary Table) is linked to the online version of the paper.
Author contributions A.N.B. and X.Z. conceived the project. A.N.B., B.B., and X.Z. designed the experiments and simulations with input from C.W. and L.M. A.N.B. and B.B. performed the experiments, data analysis and simulations. J.R.M. conceived the high yield probe synthesis method, and J.R.M. and A.N.B developed this method. B.J.B. assisted with initial probe synthesis. S.W. assisted with live-cell STORM experiments. G.F. and M.I. assisted with methods for simulation. A.N.B., B.B., L.M., C.W., and X.Z. interpreted the results. A.N.B., B.B., J.R.M. and X.Z. wrote the manuscript, with inputs from B.J.B., G.F., M.I., L.M. and C.W.
RNA-Seq data have been deposited at Gene Expression Omnibus (GEO) under the accession code GSE75060.
The authors declare no competing financial interests.
References
- 1.Kornberg RD, Lorch Y. Twenty-five years of the nucleosome, fundamental particle of the eukaryote chromosome. Cell. 1999;98:285–294. doi: 10.1016/s0092-8674(00)81958-3. [DOI] [PubMed] [Google Scholar]
- 2.Bickmore WA. The Spatial Organization of the Human Genome. Annu. Rev. Genomics Hum. Genet. 2013:67–84. doi: 10.1146/annurev-genom-091212-153515. at < http://www.ncbi.nlm.nih.gov/pubmed/23875797>. [DOI] [PubMed] [Google Scholar]
- 3.Gibcus JH, Dekker J. The hierarchy of the 3D genome. Mol. Cell. 2013;49:773–782. doi: 10.1016/j.molcel.2013.02.011. [DOI] [PMC free article] [PubMed] [Google Scholar]
- 4.Levine M, Cattoglio C, Tjian R. Looping back to leap forward: transcription enters a new era. Cell. 2014;157:13–25. doi: 10.1016/j.cell.2014.02.009. [DOI] [PMC free article] [PubMed] [Google Scholar]
- 5.Cremer T, Cremer M. Chromosome territories. Cold Spring Harb. Perspect. Biol. 2010;2:a003889. doi: 10.1101/cshperspect.a003889. [DOI] [PMC free article] [PubMed] [Google Scholar]
- 6.Gorkin DU, Leung D, Ren B. The 3D genome in transcriptional regulation and pluripotency. Cell Stem Cell. 2014;14:762–775. doi: 10.1016/j.stem.2014.05.017. [DOI] [PMC free article] [PubMed] [Google Scholar]
- 7.Sexton T, Cavalli G. The Role of Chromosome Domains in Shaping the Functional Genome. Cell. 2015;160:1049–1059. doi: 10.1016/j.cell.2015.02.040. [DOI] [PubMed] [Google Scholar]
- 8.Galupa R, Heard E. X-chromosome inactivation: new insights into cis and trans regulation. Curr. Opin. Genet. Dev. 2015;31:57–66. doi: 10.1016/j.gde.2015.04.002. [DOI] [PubMed] [Google Scholar]
- 9.Bernstein BE, Meissner A, Lander ES. The Mammalian Epigenome. Cell. 2007;128:669–681. doi: 10.1016/j.cell.2007.01.033. [DOI] [PubMed] [Google Scholar]
- 10.Bickmore WA, Van Steensel B. Genome architecture: Domain organization of interphase chromosomes. Cell. 2013;152:1270–1284. doi: 10.1016/j.cell.2013.02.001. [DOI] [PubMed] [Google Scholar]
- 11.Rivera CM, Ren B. Mapping Human Epigenomes. Cell. 2013;155:39–55. doi: 10.1016/j.cell.2013.09.011. [DOI] [PMC free article] [PubMed] [Google Scholar]
- 12.Gómez-Díaz E, Corces VG. Architectural proteins: regulators of 3D genome organization in cell fate. Trends Cell Biol. 2014;24:703–711. doi: 10.1016/j.tcb.2014.08.003. [DOI] [PMC free article] [PubMed] [Google Scholar]
- 13.Beliveau BJ, et al. Versatile design and synthesis platform for visualizing genomes with Oligopaint FISH probes. Proc. Natl. Acad. Sci. 2012;109:21301–21306. doi: 10.1073/pnas.1213818110. [DOI] [PMC free article] [PubMed] [Google Scholar]
- 14.Beliveau BJ, et al. Single-molecule super-resolution imaging of chromosomes and in situ haplotype visualization using Oligopaint FISH probes. Nat. Commun. 2015;6:7147. doi: 10.1038/ncomms8147. [DOI] [PMC free article] [PubMed] [Google Scholar]
- 15.Boyle S, Rodesch MJ, Halvensleben HA, Jeddeloh JA, Bickmore WA. Fluorescence in situ hybridization with high-complexity repeat-free oligonucleotide probes generated by massively parallel synthesis. Chromosome Res. 2011;19:901–909. doi: 10.1007/s10577-011-9245-0. [DOI] [PMC free article] [PubMed] [Google Scholar]
- 16.Yamada NA, et al. Visualization of fine-scale genomic structure by oligonucleotide-based high-resolution FISH. Cytogenet. Genome Res. 2011;132:248–254. doi: 10.1159/000322717. [DOI] [PubMed] [Google Scholar]
- 17.Chen KH, Boettiger AN, Moffitt JR, Wang S, Zhuang X. Spatially resolved, highly multiplexed RNA profiling in single cells. Science. 2015;348:412. doi: 10.1126/science.aaa6090. [DOI] [PMC free article] [PubMed] [Google Scholar]
- 18.Rust MJ, Bates M, Zhuang X. Sub-diffraction-limit imaging by stochastic optical reconstruction microscopy (STORM) Nat. Methods. 2006;3:793–795. doi: 10.1038/nmeth929. [DOI] [PMC free article] [PubMed] [Google Scholar]
- 19.Huang B, Wang W, Bates M, Zhuang X. Three-dimensional super-resolution imaging by stochastic optical reconstruction microscopy. Science. 2008;319:810–813. doi: 10.1126/science.1153529. [DOI] [PMC free article] [PubMed] [Google Scholar]
- 20.Filion GJ, et al. Systematic protein location mapping reveals five principal chromatin types in Drosophila cells. Cell. 2010;143:212–224. doi: 10.1016/j.cell.2010.09.009. [DOI] [PMC free article] [PubMed] [Google Scholar]
- 21.Simon JA, Kingston RE. Occupying chromatin: Polycomb mechanisms for getting to genomic targets, stopping transcriptional traffic, and staying put. Mol. Cell. 2013;49:808–824. doi: 10.1016/j.molcel.2013.02.013. [DOI] [PMC free article] [PubMed] [Google Scholar]
- 22.Grossniklaus U, Paro R. Transcriptional Silencing by Polycomb-Group Proteins. Cold Spring Harb. Perspect. Biol. 2014;6:a019331–a019331. doi: 10.1101/cshperspect.a019331. [DOI] [PMC free article] [PubMed] [Google Scholar]
- 23.Cheutin T, Cavalli G. Polycomb silencing: from linear chromatin domains to 3D chromosome folding. Curr. Opin. Genet. Dev. 2014;25C:30–37. doi: 10.1016/j.gde.2013.11.016. [DOI] [PubMed] [Google Scholar]
- 24.Sexton T, et al. Three-dimensional folding and functional organization principles of the Drosophila genome. Cell. 2012;148:458–472. doi: 10.1016/j.cell.2012.01.010. [DOI] [PubMed] [Google Scholar]
- 25.Lieberman-Aiden E, et al. Comprehensive mapping of long-range interactions reveals folding principles of the human genome. Science. 2009;326:289–293. doi: 10.1126/science.1181369. [DOI] [PMC free article] [PubMed] [Google Scholar]
- 26.Mirny LA. The fractal globule as a model of chromatin architecture in the cell. Chromosome Res. 2011;19:37–51. doi: 10.1007/s10577-010-9177-0. [DOI] [PMC free article] [PubMed] [Google Scholar]
- 27.Halverson JD, Smrek J, Kremer K, Grosberg AY. From a melt of rings to chromosome territories: the role of topological constraints in genome folding. Rep. Prog. Phys. 2014;77:022601. doi: 10.1088/0034-4885/77/2/022601. [DOI] [PubMed] [Google Scholar]
- 28.Nicodemi M, Pombo A. Models of chromosome structure. Curr. Opin. Cell Biol. 2014;28:90–95. doi: 10.1016/j.ceb.2014.04.004. [DOI] [PubMed] [Google Scholar]
- 29.Isono K, et al. SAM Domain Polymerization Links Subnuclear Clustering of PRC1 to Gene Silencing. Dev. Cell. 2013;26:565–577. doi: 10.1016/j.devcel.2013.08.016. [DOI] [PubMed] [Google Scholar]
- 30.Spitz F, Furlong EEM. Transcription factors: from enhancer binding to developmental control. Nat. Rev. Genet. 2012;13:613–626. doi: 10.1038/nrg3207. [DOI] [PubMed] [Google Scholar]
Associated Data
This section collects any data citations, data availability statements, or supplementary materials included in this article.


