

Abstract
Objectives
To examine the effect of the relationship between alcohol and cigarette consumption on biological aging using deoxyribonucleic acid (DNA) methylation-based indices.
Design
We examined the association between DNA methylation indices of smoking and alcohol to those for biological aging in two independent cohorts using the epigenetic “clock” provided by Hannum and colleagues.
Setting
Longitudinal studies of aging and the effect of psychosocial stress.
Participants
Publicly available genome-wide methylation data from participants in two ethnically informative cohorts (n=656 white, n=180 black).
Measurements
Deviation of biological age from chronological age as a result of smoking and alcohol consumption.
Results
Greater cigarette consumption was associated with accelerated biological aging, with strong effects evident at even low levels of exposure. In contrast, alcohol consumption was associated with a mixed effect on biological aging and pronounced nonlinear effects. At low and heavy levels of alcohol consumption, there was accelerated biological aging, whereas at intermediate levels of consumption there was a relative decelerating effect. The decelerating effects of alcohol were particularly notable at loci for which methylation increased with age.
Conclusion
These data support prior epidemiological studies indicating that moderate alcohol use is associated with healthy aging, but we urge caution in interpreting these results. Conversely, smoking has strong negative effects at all levels of consumption. These results also support the use of methylomic indices as a tool for assessing the impact of lifestyle on aging.
The shifting age of the world’s population suggests a greater need for indices of healthy aging that can provide empirical grounding for medical advice on the likely effect of lifestyle change. (1) As first reviewed by Fraga and Esteller in 2007 and more recently by Hannum and colleagues in 2013, recent work on epigenetic correlates of chronological aging has provided a new approach to examination of the effects of environmental factors on aging. (2–5)
Hannum and colleagues developed an index of aging referred to as apparent methylomic aging rate, which is defined as the ratio of predicted age, based on methylation data, to chronological age.(2) For those interested in using blood-based assessments of the effect of lifestyle or environmental factors on aging, this type of epigenetic clock, or index of methylomic age,(6) provides several advantages, including strong correlation with chronological age (coefficient of determination > 0.95), constancy across the adult age range, lack of influence of sex, usefulness in a variety of tissue types, and ease of assessment through the use of a commonly used assessment platform (HumanMethylation450 Beadchip, Illumina, San Diego, CA). (2)
There also has been substantial progress in the use of deoxyribonucleic acid (DNA) methylation to quantify cigarette consumption. Over the past several years, it has been demonstrated that smoking is associated with genome-wide changes in DNA methylation.(7–15) The most reliably and robustly differentially methylated CpG residue is referred to as cg05575921, which is found in the aryl hydrocarbon receptor repressor.(7) Since its initial association with smoking in 2012, eight consecutive genome wide analyses have shown that it is consistently the most robustly differentially methylated residue in the genome in response to smoking in all age groups. (7–15) Demethylation at cg05575921 is strongly associated with serum cotinine levels and daily cigarette consumption. (9)
A recent demonstration that a broad, dose-dependent pattern of altered methylation, particularly at a CpG residue found in a chromosome 10 open reading frame (C10orf35, a.k.a. cg23193759), is associated with alcohol consumption has complemented methylation findings with respect to cigarette consumption.(16) Taken together, these new DNA methylation assessment techniques address the well-known shortcomings of unreliable self-reports of tobacco and alcohol consumption and provide an alternative method of determining the relationship between common types of substance use and critical healthcare outcomes(17), associations that are of great significance given that tobacco and alcohol use are, respectively, the first- and third-leading causes of preventable morbidity and mortality in the United States.(18–20)
Improving upon the reliability of self-reported substance use is important.(21–23) Similarly, although well-structured assessments of alcohol consumption in the general population are thought to be adequately reliable, individuals at the highest risk of alcoholism have a high rate of nonparticipation in self-report surveys, and when they participate in these surveys, their self-report is often unreliable.(24) Accordingly, use of epigenetic biomarkers of substance use exposure may usefully supplement datasets of self-reported substance use and expand the number of usable data sets by allowing examination of substance use effects in data sets that do not include self-reported use.
These newly developed epigenetic approaches were used to quantify the effect of substance use on Hannum and colleagues “biological clock” and methylation at each of the 71 loci that comprise the clock using two independent, ethnically informative cohorts.
METHODS
Methylation at the 73 (71 for the clock, 1 each for smoking and alcohol consumption) CpG residues analyzed in this study were obtained from publically available Illumina HumanMethylation450 Beadchip datasets. The first set of methylation data (n=656; Gene Expression Omnibus (GEO) accession GSE40279) is from a study of the effects of aging on genome methylation by Hannum and colleagues. (2) The second set of human methylation data are from the Family and Community Health Studies (FACHS) (n=180; GEO accession numbers GSE35059 and GSE59550).(9) Their local institutional review boards approved the procedures and protocols used in each of those studies.
Analytical Approach
The association between smoking and drinking biomarkers and the biological clock was first examined in Hannum’s dataset. The averaged value of the 71 weighted indicators was used as the dependent variable, providing an index of relative biological age. Given the expectation of nonlinear effects, a hierarchical linear regression approach was used to examine linear and nonlinear effects of alcohol and cigarette smoke exposure sequentially, controlling for chronological age at each step. Accordingly, all observed effects represent effect on biological age net of chronological age. All analyses were conducted using Stata version 13.0 (StataCorp, College Station, TX). Discrepancies between biological and chronological age, in the form of residuals, were created using a regression procedure in which biological clock was the outcome, and chronological age was the independent variable. The residual has a mean of 0 and thus represents positive and negative deviations from chronological age in years. Using the index of discrepancy between biological and chronological age as the dependent variable, in step 1, the linear effect of the biomarker on discrepancy score was examined; in the second step, quadratic effects in the model were included. Cubic effects were also included in the final step. To identify the best-fitting model and so determine the presence of nonlinear effects, the fit of the nested models was contrasted using an F-test. Because the Hannum approach is robust with respect to blood cell composition and unaffected by sex(2) and Hannum and colleagues first cleaned then depleted the data set of all loci influence of sex before depositing their data, further data cleaning and controlling for sex for the 73 loci that were extracted were not attempted.
To follow up and allow direct comparison with the replication sample, the association between the biomarkers for smoking and drinking and each of the loci included in the biological clock were also examined, controlling for chronological age. For ease of examination, clock loci were ordered so that all loci whose methylation values increased with age were in the upper half of Table 1, and those that decreased with age were in the bottom half of Table 1. Biomarker beta values decreased with greater substance use, so positive coefficients in the upper half of Table 1 indicate that greater consumption is associated with decelerated aging at a particular clock locus (with the significant values being shadowed). Negative correlations indicated accelerated aging (with the significant values being bolded). Conversely, in the bottom half of Table 1, positive coefficients indicate accelerated aging (with the significant values being bolded) whereas negative correlations indicated decelerated aging (with the significant values being shadowed).
Table 1.
Relationship Between Chronological Age, Smoking, and Alcohol Consumption Biomarkers and Aging Markers in the Hannum Cohort
| Aging Related Markers | Chronological Age | cg05575921 | cg23193759 | |||
|---|---|---|---|---|---|---|
| Beta | P-Value | Beta | P-Value | Beta | P-Value | |
| cg16867657 | 0.859 | <.001 | −0.026 | .20 | 0.038 | .06 |
| cg06639320 | 0.747 | <.001 | 0.019 | .47 | 0.161 | <.001 |
| cg22454769 | 0.744 | <.001 | 0.028 | .28 | 0.092 | <.001 |
| cg24079702 | 0.707 | <.001 | 0.023 | .41 | 0.088 | .002 |
| cg07553761 | 0.700 | <.001 | −0.059 | .03 | −0.044 | .12 |
| cg04875128 | 0.665 | <.001 | −0.019 | .51 | 0.119 | <.001 |
| cg14692377 | 0.654 | <.001 | 0.054 | .07 | 0.120 | <.001 |
| cg22736354 | 0.645 | <.001 | 0.021 | .47 | 0.171 | <.001 |
| cg07547549 | 0.631 | <.001 | 0.018 | .56 | 0.203 | <.001 |
| cg02650266 | 0.628 | <.001 | −0.076 | .01 | 0.172 | <.001 |
| cg23500537 | 0.620 | <.001 | −0.029 | .34 | 0.064 | .04 |
| cg03032497 | 0.620 | <.001 | −0.053 | .08 | 0.036 | .24 |
| cg08097417 | 0.615 | <.001 | 0.087 | .005 | 0.119 | <.001 |
| cg14361627 | 0.614 | <.001 | 0.064 | .04 | 0.072 | .02 |
| cg16419235 | 0.610 | <.001 | −0.015 | .63 | 0.187 | <.001 |
| cg22285878 | 0.592 | <.001 | −0.012 | .71 | 0.020 | .54 |
| cg03607117 | 0.586 | <.001 | 0.028 | .38 | 0.012 | .71 |
| cg06493994 | 0.585 | <.001 | 0.088 | .006 | 0.278 | <.001 |
| cg04400972 | 0.577 | <.001 | −0.058 | .07 | 0.133 | <.001 |
| cg23091758 | 0.559 | <.001 | −0.010 | .75 | 0.103 | .002 |
| cg07955995 | 0.553 | <.001 | 0.053 | .10 | 0.009 | .79 |
| cg22158769 | 0.548 | <.001 | −0.056 | .08 | 0.100 | .002 |
| cg20426994 | 0.544 | <.001 | −0.003 | .94 | 0.150 | <.001 |
| cg14556683 | 0.538 | <.001 | 0.033 | .32 | 0.229 | <.001 |
| cg00748589 | 0.534 | <.001 | 0.051 | .12 | 0.300 | <.001 |
| cg21296230 | 0.533 | <.001 | 0.029 | .38 | 0.203 | <.001 |
| cg07927379 | 0.529 | <.001 | 0.036 | .27 | 0.044 | .19 |
| cg25410668 | 0.523 | <.001 | −0.020 | .54 | 0.141 | <.001 |
| cg22213242 | 0.513 | <.001 | 0.050 | .13 | −0.110 | .001 |
| cg23606718 | 0.512 | <.001 | 0.037 | .27 | 0.290 | <.001 |
| cg03399905 | 0.509 | <.001 | −0.012 | .72 | 0.308 | <.001 |
| cg25478614 | 0.506 | <.001 | 0.054 | .11 | 0.078 | .02 |
| cg06419846 | 0.504 | <.001 | −0.005 | .89 | −0.093 | .007 |
| cg00481951 | 0.495 | <.001 | 0.022 | .52 | 0.211 | <.001 |
| cg08540945 | 0.491 | <.001 | −0.026 | .45 | 0.153 | <.001 |
| cg18473521 | 0.477 | <.001 | 0.001 | .97 | 0.049 | .16 |
| cg11067179 | 0.462 | <.001 | 0.006 | .86 | −0.123 | <.001 |
| cg04940570 | 0.461 | <.001 | 0.024 | .49 | 0.278 | <.001 |
| cg21139312 | 0.377 | <.001 | 0.061 | .09 | −0.001 | .97 |
| cg19935065 | 0.237 | <.001 | 0.022 | .57 | 0.023 | .55 |
| ch1339564907R | −0.372 | <.001 | 0.028 | .43 | 0.001 | .98 |
| cg09651136 | −0.401 | <.001 | 0.084 | .02 | 0.093 | .01 |
| ch230415474F | −0.413 | <.001 | 0.072 | .04 | 0.001 | .97 |
| cg13001142 | −0.416 | <.001 | −0.017 | .63 | 0.124 | .001 |
| cg05442902 | −0.439 | <.001 | 0.147 | <.001 | 0.112 | .002 |
| cg02867102 | −0.474 | <.001 | 0.116 | .001 | 0.140 | <.001 |
| cg00486113 | −0.521 | <.001 | 0.204 | <.001 | 0.194 | <.001 |
| cg20052760 | −0.526 | <.001 | 0.111 | .001 | 0.212 | <.001 |
| cg19722847 | −0.534 | <.001 | 0.125 | <.001 | 0.189 | <.001 |
| cg06874016 | −0.537 | <.001 | 0.109 | .001 | 0.033 | .33 |
| cg02046143 | −0.538 | <.001 | 0.095 | .004 | 0.241 | <.001 |
| cg25428494 | −0.544 | <.001 | 0.080 | .01 | 0.133 | <.001 |
| cg04474832 | −0.548 | <.001 | 0.188 | <.001 | 0.191 | <.001 |
| cg02085953 | −0.556 | <.001 | 0.159 | <.001 | 0.037 | .26 |
| cg04416734 | −0.557 | <.001 | 0.205 | <.001 | 0.120 | <.001 |
| cg22512670 | −0.565 | <.001 | 0.206 | <.001 | 0.201 | <.001 |
| cg06685111 | −0.568 | <.001 | 0.162 | <.001 | 0.213 | <.001 |
| cg03473532 | −0.569 | <.001 | 0.100 | .002 | 0.133 | <.001 |
| cg22016779 | −0.572 | <.001 | 0.036 | .27 | −0.009 | .77 |
| cg20822990 | −0.576 | <.001 | 0.191 | <.001 | 0.293 | <.001 |
| cg08415592 | −0.578 | <.001 | 0.109 | .001 | 0.145 | <.001 |
| cg07583137 | −0.589 | <.001 | 0.146 | <.001 | 0.121 | <.001 |
| cg09809672 | −0.598 | <.001 | 0.162 | <.001 | 0.226 | <.001 |
| cg01528542 | −0.604 | <.001 | 0.064 | .04 | −0.005 | .88 |
| cg07082267 | −0.608 | <.001 | 0.186 | <.001 | 0.239 | <.001 |
| cg22796704 | −0.616 | <.001 | 0.157 | <.001 | 0.229 | <.001 |
| cg23744638 | −0.640 | <.001 | 0.150 | <.001 | 0.196 | <.001 |
| cg16054275 | −0.646 | <.001 | 0.124 | <.001 | 0.093 | .002 |
| cg08234504 | −0.669 | <.001 | 0.125 | <.001 | 0.153 | <.001 |
| cg19283806 | −0.679 | <.001 | 0.068 | .02 | 0.125 | <.001 |
| cg10501210 | −0.726 | <.001 | 0.108 | <.001 | 0.152 | <.001 |
Note. The loci in the top half of the table are those that hypermethylate (+beta) and those in the bottom half are those that demethylate (−beta) as a function of increasing age. Significant pro-aging effects of smoking or alcohol consumption as denoted by cg05575921 or cg23193759, respectively, are indicated in bold. Antiaging effects of cigarette or alcohol consumption are denoted by bold italics
To replicate and examine generalizability of linear effects for smoking, the analyses were repeated in a smaller sample of black adults selected to be smokers or nonsmokers. Because of missing intermediate levels, curvilinear effects on the overall index could not be examined. Accordingly, the sample was used to replicate the effect of biomarkers for smoking and drinking on the individual clock loci. Using the same format as for the Hannum dataset, the association between the biomarkers for smoking and drinking and each of the loci included in the biological clock were examined, controlling for chronological age.
RESULTS
The demographic characteristics of both of the cohorts examined are given in Table 2. The first cohort from Hannum and colleagues consisted of 656 white subjects with an average age of 63.4±14.8. No information on sex was available for the dataset. The second cohort consisted of 180 African Americans drawn from the Family and Community Health Studies (FACHS) with an average age of 48.9±8.6.
Table 2.
Demographic Characteristics of the Study Cohorts
| Characteristic | Hannum, N=656 | Family and Community Health Studies, N=180 |
|---|---|---|
| Age, mean±standard deviation (range) | 63.4 ± 14.8 (19–101) | 48.9 ± 8.6 (35–91) |
| Sex, n | ||
| Male | NA | 79 |
| Female | NA | 111 |
| Race and ethnicity, n | ||
| White | 482 | |
| White Hispanic | 174 | |
| Black | 180 |
NA=not available.
Examination of the Hannum and colleagues cohort
As a first step in the analyses, the simple correlation of each of the 71 “clock” loci with chronological age was computed, replicating the observation of Hannum regarding the robust association for each. As Table 1 indicates, each of the residues was significantly associated with chronological aging (p<.001). To address the primary study hypotheses, an index of the discrepancy between biological and chronological age was created by regressing chronological age on biological age and using the residual as the dependent variable. Using this dependent variable, the relationship between the previously derived quantitative measures of smoking and alcohol consumption and discrepancy scores was examined.
Because of the expectation of nonlinear effects, linear, quadratic, and cubic effects were stepped in, and the best fitting model was identified using direct contrasts of nested models. All hierarchal regression models were constructed using Stata version 13 (Stata Corp.). Smoking and drinking were quantified using methylation status at cg05575921 and cg23193759, respectfully, with methylation at each decreasing in response to greater consumption.
In the analysis of the effect of smoking, stepping in the linear effect indicated that linear acceleration of the biological clock produced by exposure to cigarette smoke was significant (unstandardized beta = −8.730, p < .001), as was the quadratic term (unstandardized beta = −39.443, p = .049). Direct comparison of linear, quadratic, and cubic models using nested model comparisons confirmed that the quadratic model provided the best fit to the data. It significantly improved fit over the linear model (linear vs quadratic: F(1, 653) = 3.89, p = .049), and there was no additional significant improvement when a cubic component was added (quadratic vs cubic: F(1, 652) = 0.88, p = .35). Accordingly, the effect of smoking on overall biological aging was asymptotic, with the effect of increasing smoke exposure on accelerated aging greater as participants moved from no exposure to moderate smoke exposure, and with effect on biological aging leveling off at higher levels of smoking exposure (Figure 1).
Figure 1.
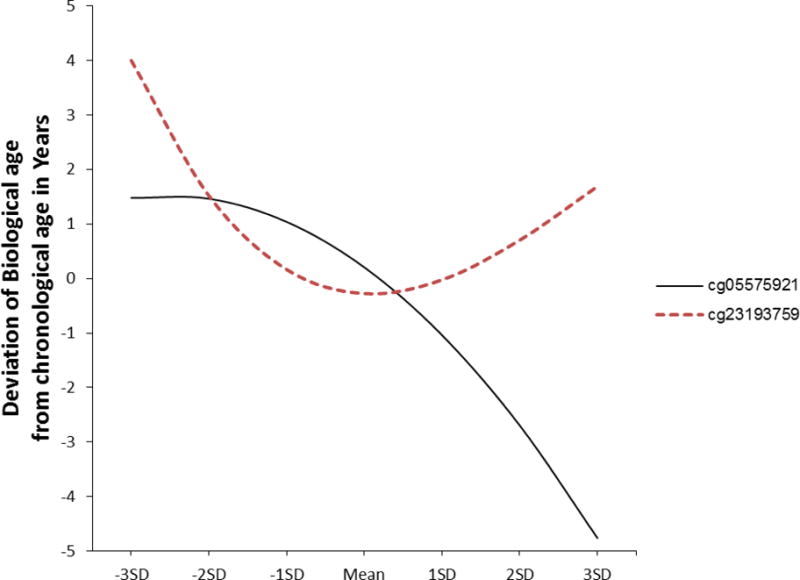
Graph of the best-fitting model representing the effect of smoking consumption (solid line; cg05575921) and alcohol consumption (dotted line; cg23193759) on biological aging using Hannum’s weights. All values within ±3 standard deviations of the mean of each predictor are included. In each case, lower scores on the x-axis indicate greater substance use exposure, and higher scores on the y-axis indicate relatively greater acceleration of the biological clock. Predicted scores represent residual biological age after controlling for chronological age.
The association between cg23193759 and an index of discrepancy between biological and chronological age was similarly examined. Again, the best-fitting model was found to be one that contained a nonlinear component. Although linear and quadratic effects of alcohol consumption on discrepancy score were nonsignificant before the cubic component was entered, they were significant in the final model that included cubic effects, with results suggesting that the cubic component of the model qualified the linear decelerating effect of alcohol consumption on biological age (unstandardized beta = −186.8059, p = .01) and the quadratic effect (unstandardized beta = 796.201, p = .02). The significant cubic component (unstandardized beta = −969.066, p = .03) highlighted the reversal of effects at the extremes. Very low and very high levels of alcohol consumption as measured by cg23193759 were associated with faster biological aging relative than moderate consumption. Direct comparison of linear, quadratic, and cubic models using nested models indicated that the cubic model provided the best fit to the data (linear vs cubic: F(2, 652) = 3.65, p = .03) and (quadratic vs cubic: F(1,652) = 4.51, p = .03). Accordingly, the pattern of results indicates that the relatively decelerating effect of alcohol consumption on aging is present only for variation in the moderate range of consumption (Figure 1).
Simple linear associations at each of the 71 residues were also examined to better characterize the pattern of effects of smoking and drinking. Controlling for chronological age, methylation status at 33 of the 71 CpG residues was significantly associated with methylation status at cg05575921 (smoking), whereas methylation status at 55 loci was associated with methylation at cg23193759 (alcohol consumption). Only 11 loci were not associated with cg05575921 or cg23193759, indicating that substance use affected a substantial majority of the clock loci.
The effect of smoking and drinking on the individual loci that constitute the biological clock were different for those epigenetic indicators that increased with age from those that decreased with age. Focusing on clock indicators at which methylation increases with chronological age (those in the top half of Table 1) showed that smoking exposure was associated with little effect. Three indicators showed significant decelerating effects, indicated by shadowed coefficients, whereas as two showed accelerating effects, indicated by bolded coefficients. Conversely, for loci at which methylation decreases with increasing chronological age (those in the bottom half of Table 1), it can be seen that smoking exposure is consistently associated with accelerated aging. That is, 28 indicators (bolded) showed an accelerating effect on aging, whereas none showed a decelerating effect. For alcohol exposure, the patterning of effects was different. The indicators in the top half of Table 1 (those that increase with age) showed consistent effects of alcohol exposure in the direction of decelerating biological aging, with 27 indicators (shadowed) showing significant deceleration and only three showing significant acceleration (bolded) in response to greater alcohol exposure. For indicators in the bottom half of Table 1, the effect of alcohol exposure is robustly in the direction of acceleration of aging, with 25 indicators (bolded) showing significant acceleration and none showing deceleration. Accordingly, the bulk of the effect for alcohol and smoking exposure on biological aging is attributable to their acceleration of ongoing demethylation or slowing of ongoing hypermethylation (i.e., they are associated with decreased methylation).
Replication Using the FACHS cohort
Because the Hannum data were derived from samples of individuals of European ancestry, the analyses were repeated using data from 180 subjects from the FACHS selected to be smokers or nonsmokers. The FACHS sample is a longitudinal sample assessing health behaviors in black individuals across a range of sociodemographic circumstances. From this sample, 85 self-reported smokers and 95 nonsmokers whose methylation was examined using the Illumina array platform were randomly selected. Using this sample, the relationship between the biological clock and chronological age was replicated (coefficient of determination (r) = 0.775, p < .001), and the relative strength of the 71 regression coefficients linking methylation to chronological age across the two samples was replicated (r = 0.961).
All the proposed epigenetic clock indicators were associated with aging in the same direction as in the Hannum and colleagues’ data set. (See Appendix 1 for table of effects in the replication sample.) Only linear contrasts were examined. Methylation status at 31 clock residues was significantly associated with methylation status at cg05575921 (smoking), and 37 residues were significantly associated at cg23193759 (alcohol consumption). For smoking effects, 20 were direct replications of significant associations identified in the Hannum data set (64.5%). For drinking effects, 34 were direct replications of significant associations identified in the Hannum data set (91.9%). Similar patterns of effects were observed within subsets of loci as well. For loci at which methylation increased with chronological age, tobacco use was inconsistently associated with biological age (6 accelerating, 4 decelerating). Conversely, for loci at which methylation decreased with chronological age, tobacco use was consistently associated with accelerated aging (21 accelerating, 0 decelerating) (p<.001)). Likewise, for indicators that increased with age, alcohol use was robustly associated with decelerated aging (23 decelerating, 0 accelerating), but for indicators that decreased with chronological age, alcohol consumption was associated with accelerated aging (14 accelerating, 0 decelerating) (p<.001).
DISCUSSION
Using a recently developed index of biological aging, support was found for a previously hypothesized effect of smoking on accelerated aging and a previously hypothesized curvilinear effect of alcohol consumption on aging. Effects showing that the epigenetic clock developed using data from white subjects generalized to a black sample were replicated, and similar patterns of effects of smoking and drinking on the individual loci comprising the clock were found in both samples. Examination of nonlinear effects indicated a significant quadratic effect for cigarette smoke exposure, reflecting an asymptotic impact, whereas alcohol consumption showed a significant cubic effect, suggesting an advantage of moderate levels of consumption. Unexpectedly, both data sets indicated divergent patterns of effect among epigenetic clock indicators depending on whether the indicators increased or decreased with age. Epigenetic clock indicators that increased with chronological age were most useful in identifying the divergent effects of alcohol and tobacco on biological aging, with alcohol producing robust decelerating effects but smoking having inconsistent effects for these indicators. Conversely, epigenetic clock indicators that decreased with age were most useful in identifying the shared effects of alcohol and tobacco on accelerating aging, with cigarette smoke and alcohol consumption producing accelerating effects on the aging indicators.
These results suggest that, despite being correlated, the effects of alcohol and smoking consumption on biological aging are different. Whereas smoking accelerated biological aging at any level of consumption, alcohol had a more-complex association with aging. When examining the 40 loci at which greater methylation was associated with older chronological age, significant antiaging effects of alcohol were found in both data sets at 19 loci. In contrast, when examining the 41 loci at which lower methylation was associated with greater chronological aging, no replicable protective effects of alcohol were noted. Second, consistent with prior epidemiological examinations, moderate alcohol consumption was associated with decelerated aging overall.(25, 26) The U-shaped curve found in the current study is similar to that found with respect to the effects of alcohol consumption on other health-related outcomes, including quality of life and bone density.(27, 28)
These data are silent as to the mechanism of the benevolent association between moderate alcohol intake and slower aging. One controversial viewpoint is that substances, such as resveratrol, found in certain alcoholic beverages (e.g., red wine) directly moderate the beneficial effects of alcohol,(29) but some of the subsequent basic and clinical studies have been less confirmatory. (30–33) Also, because abstainers often do so because of chronic severe medical disorders or prior difficulties with substances, this could account for some of the effect with respect to aging at the lower range of alcohol consumption. The beneficial effects attributed to moderate alcohol consumption observed here and elsewhere may be largely secondary to healthy behavioral habits found in those who drink moderately. Interrogation of epidemiologically sound, behaviorally informed cohorts that also have DNA for epigenetic testing may answer more effectively whether it is the moderate alcohol consumption or the accompanying behavioral habits that are responsible for the observed U-shaped curve.
In contrast, no significant protective effects of smoking for aging were found in either dataset at any of the loci. Increasing cigarette consumption as indicated by cg05575921 was reproducibly associated with methylation status at 20 of the 71 epigenetic clock indicators, with marked enrichment at loci at which methylation is negatively associated with aging. Because prior studies have shown that heavy chronic smoking itself has nominally significant effects on methylation status at nearly one-quarter of the CpG loci in the genome, the number of significantly affected loci found in the current study is not surprising.(9) Furthermore, given the prominent effects of smoking on methylation at genes involved in inflammation(7, 9, 34) and the strong inflammatory components of many forms of common complex illness, including diabetes mellitus, coronary artery disease, and obesity(35–37), the hypothesis that inflammation mediates the effects of smoking on aging should be examined.
Black and white individuals had similar patterns of effect on individual clock indicators for the biomarkers of smoking (cg05575921) and alcohol consumption (cg23193759). Although requiring additional replication, this finding suggests that effects of substances on biological aging may be generalizable across social and demographic categories and specifically that results using the biological clock may be generalizable across black and white samples.
Several other groups have described epigenetic clocks based on methylation data.(38, 39) The 353 probes identified in one study(38) and the three in the other(39) use data only from probes from the Illumina 27k array that were also present in the Illumina 450k array. Because Hannum’s marker set was designed specifically for use in blood-derived DNA, and all of the current study data are based on the 450K array, which is less promoter-centric than the 27k array, the use of the Hannum clock allows for a less-biased assessment of aging in a marker set designed specifically for the tissue and the platform used in the methylation assessments. Still, it is unlikely that this array will be the final word in methylation assessments, and future studies using whole-genome approaches with methylation-independent measures of substance consumption (e.g., cotinine levels) could markedly improve understanding of this important subject.
The current results highlight the potential for existing epidemiological datasets that have DNA to provide useful insights beyond those for which they were initially collected. In the area of substance use research, this potential seems considerable. Likewise, studies designed to examine the effect of other lifestyle choices and circumstances may be extended to examine effects on biological aging directly. The results also highlight a potential solution to the problem of substantial error in self-report approaches to assessment of substance use and suggest that epigenetic indicators of substance use may allow more-nuanced examination of effects on aging, such as examination of nonlinear associations.
Supplementary Material
Acknowledgments
This work was supported by National Institutes of Health Grant R21DA034457 to Dr. Philibert. Pending property claims cover the use of DNA methylation to assess alcohol use status. U.S. patent 8,637,652 and other pending claims cover the use of DNA methylation to assess smoking status. Dr. Philibert is a potential royalty recipient on those intellectual right claims. Dr. Philibert is an officer and stockholder of Behavioral Diagnostics (www.bdmethylation.com). Support for this study was provided by the Center for Translational and Prevention Science (P30DA02782, Brody-PI) funded by the National Institute on Drug Abuse. The content is solely the responsibility of the authors and does not necessarily represent the official views of the National Institutes of Health.
Footnotes
Drs. Beach and Philibert had full access to all of the data in the study and take responsibility for the integrity of the data and the accuracy of the data analysis.
Conflict of Interest: Pending property claims cover the use of DNA methylation to assess alcohol use status. U.S. patent 8,637,652 and other pending claims cover the use of DNA methylation to assess smoking status. Dr. Philibert is a potential royalty recipient on those intellectual right claims. Dr. Philibert is an officer and stockholder of Behavioral Diagnostics (www.bdmethylation.com).
Author Contributions: All authors contributed to this paper.
Sponsor’s Role: None
References
- 1.United Nations World Population Ageing 1950–2050. Department of Economic and Social Affairs; New York, USA: 2014. [Google Scholar]
- 2.Hannum G, Guinney J, Zhao L, et al. Genome-wide methylation profiles reveal quantitative views of human aging rates. Mol Cell. 2013;49:359–367. doi: 10.1016/j.molcel.2012.10.016. [DOI] [PMC free article] [PubMed] [Google Scholar]
- 3.Fraga MF, Esteller M. Epigenetics and aging: The targets and the marks. Trends Genetics. 2007;23:413–418. doi: 10.1016/j.tig.2007.05.008. [DOI] [PubMed] [Google Scholar]
- 4.Horvath S, Zhang Y, Langfelder P, et al. Aging effects on DNA methylation modules in human brain and blood tissue. Genome Biol. 2012;13:R97. doi: 10.1186/gb-2012-13-10-r97. [DOI] [PMC free article] [PubMed] [Google Scholar]
- 5.Boks MP, Derks EM, Weisenberger DJ, et al. The relationship of DNA methylation with age, gender and genotype in twins and healthy controls. PLoS One. 2009;4:e6767. doi: 10.1371/journal.pone.0006767. [DOI] [PMC free article] [PubMed] [Google Scholar]
- 6.Mitteldorf JJ. How does the body know how old it is? Introducing the epigenetic clock hypothesis. Biochem Moscow. 2013;78:1048–1053. doi: 10.1134/S0006297913090113. [DOI] [PubMed] [Google Scholar]
- 7.Monick MM, Beach SR, Plume J, et al. Coordinated changes in AHRR methylation in lymphoblasts and pulmonary macrophages from smokers. Am J Med Genet B Neuropsychiatr Genet. 2012;159B:141–151. doi: 10.1002/ajmg.b.32021. [DOI] [PMC free article] [PubMed] [Google Scholar]
- 8.Elliott H, Tillin T, McArdle W, et al. Differences in smoking associated DNA methylation patterns in South Asians and Europeans. Clin Epigenetics. 2014;6:4. doi: 10.1186/1868-7083-6-4. [DOI] [PMC free article] [PubMed] [Google Scholar]
- 9.Dogan MV, Shields B, Cutrona C, et al. The effect of smoking on DNA methylation of peripheral blood mononuclear cells from African American women. BMC Genomics. 2014;15:151. doi: 10.1186/1471-2164-15-151. [DOI] [PMC free article] [PubMed] [Google Scholar]
- 10.Zeilinger S, Kühnel B, Klopp N, et al. Tobacco smoking leads to extensive genome-wide changes in DNA methylation. PLoS One. 2013;8:e63812. doi: 10.1371/journal.pone.0063812. [DOI] [PMC free article] [PubMed] [Google Scholar]
- 11.Philibert R, Beach SR, Li K-M, et al. Changes in DNA methylation at the aryl hydrocarbon receptor repressor may be a new biomarker for smoking. Clin Epigenetics. 2013;5:19–26. doi: 10.1186/1868-7083-5-19. [DOI] [PMC free article] [PubMed] [Google Scholar]
- 12.Besingi W, Johansson Å. Smoke related DNA methylation changes in the etiology of human disease. Hum Mol Genet. 2013;23:2290–2297. doi: 10.1093/hmg/ddt621. [DOI] [PubMed] [Google Scholar]
- 13.Shenker NS, Polidoro S, van Veldhoven K, et al. Epigenome-wide association study in the European Prospective Investigation into Cancer and Nutrition (EPIC-Turin) identifies novel genetic loci associated with smoking. Hum Mol Genet. 2013;22:843–851. doi: 10.1093/hmg/dds488. [DOI] [PubMed] [Google Scholar]
- 14.Philibert RA, Beach SR, Brody GH. Demethylation of the aryl hydrocarbon receptor repressor as a biomarker for nascent smokers. Epigenetics. 2012;7:1331–1338. doi: 10.4161/epi.22520. [DOI] [PMC free article] [PubMed] [Google Scholar]
- 15.Joubert BR, Håberg SE, Nilsen RM, et al. 450K epigenome-wide scan identifies differential DNA methylation in newborns related to maternal smoking during pregnancy. Environ Health Perspect. 2012;120:1425–1431. doi: 10.1289/ehp.1205412. [DOI] [PMC free article] [PubMed] [Google Scholar]
- 16.Philibert R, Penaluna B, White T, et al. A pilot examination of the genome-wide DNA methylation signatures of subjects entering and exiting short-term alcohol dependence treatment programs. Epigenetics. 2014;9:1–7. doi: 10.4161/epi.32252. [DOI] [PMC free article] [PubMed] [Google Scholar]
- 17.Beach SRH, Gerrard M, Gibbons FX, et al. A role for epigenetics in broadening the scope of pediatric care in the prevention of adolescent smoking. Epigenetic Diagnosis and Therapy. 2015:1–7. doi: 10.2174/2214083201999140320153918. E-Pub Ahead of Print(1) [DOI] [PMC free article] [PubMed] [Google Scholar]
- 18.Mokdad AH, Marks JS, Stroup DF, et al. Actual causes of death in the United States, 2000. JAMA. 2004;291:1238–1245. doi: 10.1001/jama.291.10.1238. [DOI] [PubMed] [Google Scholar]
- 19.Centers for Disease Control and Prevention. Vital signs: Current cigarette smoking among adults aged >/=18 years—United States, 2005–2010. MMWR Morb Mortal Wkly Rep. 2011;60:1207–1212. [PubMed] [Google Scholar]
- 20.Centers for Disease Control and Prevention. Alcohol-attributable deaths and years of potential life lost—United States, 2001. MMWR Morbid Mortal Wkly Rep. 2004;53:866–870. [PubMed] [Google Scholar]
- 21.Gorber SC, Schofield-Hurwitz S, Hardt J, et al. The accuracy of self-reported smoking: A systematic review of the relationship between self-reported and cotinine-assessed smoking status. Nicotine Tob Res. 2009;11:12–24. doi: 10.1093/ntr/ntn010. [DOI] [PubMed] [Google Scholar]
- 22.Caraballo RS, Giovino GA, Pechacek TF. Self-reported cigarette smoking vs. serum cotinine among U.S. adolescents. Nicotine Tob Res. 2004;6:19–25. doi: 10.1080/14622200310001656821. [DOI] [PubMed] [Google Scholar]
- 23.Fendrich M, Mackesy-Amiti ME, Johnson TP, et al. Tobacco-reporting validity in an epidemiological drug-use survey. Addict Behav. 2005;30:175–181. doi: 10.1016/j.addbeh.2004.04.009. [DOI] [PubMed] [Google Scholar]
- 24.Sobell LC, Sobell MB. Assessing Alcohol Problems: A Guide for Clinicians. U.S. Department of Health and Human Services; 2003. Alcohol Consumption Measures. [on-line]. Available at http://pubs.niaaa.nih.gov/publications/AssessingAlcohol/index.pdf Accessed 8/24/14. [Google Scholar]
- 25.Sun Q, Townsend MK, Okereke OI, et al. Alcohol consumption at midlife and successful ageing in women: A prospective cohort analysis in the Nurses’ Health Study. PLoS Med. 2011;8:e1001090. doi: 10.1371/journal.pmed.1001090. [DOI] [PMC free article] [PubMed] [Google Scholar]
- 26.Ronksley PE, Brien SE, Turner BJ, et al. Association of alcohol consumption with selected cardiovascular disease outcomes: A systematic review and meta-analysis. BMJ. 2011;342:d671. doi: 10.1136/bmj.d671. [DOI] [PMC free article] [PubMed] [Google Scholar]
- 27.Kaplan MS, Huguet N, Feeny D, et al. Alcohol use patterns and trajectories of health-related quality of life in middle-aged and older adults: A 14-year population-based study. J Stud Alcohol Drugs. 2012;73:581–590. doi: 10.15288/jsad.2012.73.581. [DOI] [PMC free article] [PubMed] [Google Scholar]
- 28.Tucker KL, Jugdaohsingh R, Powell JJ, et al. Effects of beer, wine, and liquor intakes on bone mineral density in older men and women. Am J Clin Nutr. 2009;89:1188–1196. doi: 10.3945/ajcn.2008.26765. [DOI] [PMC free article] [PubMed] [Google Scholar]
- 29.Baur JA, Sinclair DA. Therapeutic potential of resveratrol: The in vivo evidence. Nat Rev Drug Discov. 2006;5:493–506. doi: 10.1038/nrd2060. [DOI] [PubMed] [Google Scholar]
- 30.Pacholec M, Bleasdale JE, Chrunyk B, et al. SRT1720, SRT2183, SRT1460, and resveratrol are not direct activators of SIRT1. J Biol Chem. 2010;285:8340–8351. doi: 10.1074/jbc.M109.088682. [DOI] [PMC free article] [PubMed] [Google Scholar]
- 31.Semba RD, Ferrucci L, Bartali B, et al. Resveratrol levels and all-cause mortality in older community-dwelling adults. JAMA Intern Med. 2014;174:1077–1084. doi: 10.1001/jamainternmed.2014.1582. [DOI] [PMC free article] [PubMed] [Google Scholar]
- 32.Yuan H, Marmorstein R. Red wine, toast of the town (again) Science. 2013;339:1156–1157. doi: 10.1126/science.1236463. [DOI] [PMC free article] [PubMed] [Google Scholar]
- 33.Hubbard BP, Gomes AP, Dai H, et al. Evidence for a common mechanism of SIRT1 regulation by allosteric activators. Science. 2013;339:1216–1219. doi: 10.1126/science.1231097. [DOI] [PMC free article] [PubMed] [Google Scholar]
- 34.Kremens K, Powers L, Gerke A, et al. Smoking-induced changes in Cpg Dna methylation at gene promoter regions target inflammation pathways. Am J Respir Crit Care Med. 2012;185:A2668. [Google Scholar]
- 35.Zozulinska D, Wierusz-Wysocka B. Type 2 diabetes mellitus as inflammatory disease. Diabetes Res Clin Practice. 2006;74(2 Suppl):S12–S16. [Google Scholar]
- 36.Cook DG, Mendall MA, Whincup PH, et al. C-reactive protein concentration in children: Relationship to adiposity and other cardiovascular risk factors. Atherosclerosis. 2000;149:139–150. doi: 10.1016/s0021-9150(99)00312-3. [DOI] [PubMed] [Google Scholar]
- 37.Dandona P, Aljada A, Bandyopadhyay A. Inflammation: The link between insulin resistance, obesity and diabetes. Trends Immunol. 2004;25:4–7. doi: 10.1016/j.it.2003.10.013. [DOI] [PubMed] [Google Scholar]
- 38.Horvath S, Zhang Y, Langfelder P, et al. Aging effects on DNA methylation modules in human brain and blood tissue. Genome Biol. 2012;13:1–18. doi: 10.1186/gb-2012-13-10-r97. [DOI] [PMC free article] [PubMed] [Google Scholar]
- 39.Weidner C, Lin Q, Koch C, et al. Aging of blood can be tracked by DNA methylation changes at just three CpG sites. Genome Biol. 2014;15:R24. doi: 10.1186/gb-2014-15-2-r24. [DOI] [PMC free article] [PubMed] [Google Scholar]
Associated Data
This section collects any data citations, data availability statements, or supplementary materials included in this article.