

Abstract
Background
Dietary intervention success requires strong participant adherence, but very few studies have examined factors related to both short-term and long-term adherence. A better understanding of predictors of adherence is necessary to improve the design and execution of dietary intervention trials. This study was designed to identify participant characteristics at baseline and study features that predict short-term and long-term adherence with interventions promoting the Mediterranean-type diet (MedDiet) in the PREvención con DIeta MEDiterránea (PREDIMED) randomized trial.
Methods
Analyses included men and women living in Spain aged 55–80 at high risk for cardiovascular disease. Participants were randomized to the MedDiet supplemented with either complementary extra-virgin olive oil (EVOO) or tree nuts. The control group and participants with insufficient information on adherence were excluded. PREDIMED began in 2003 and ended in 2010. Investigators assessed covariates at baseline and dietary information was updated yearly throughout follow-up. Adherence was measured with a validated 14-point Mediterranean-type diet adherence score. Logistic regression was used to examine associations between baseline characteristics and adherence at one and four years of follow-up.
Results
Participants were randomized to the MedDiet supplemented with EVOO (n = 2,543; 1,962 after exclusions) or tree nuts (n = 2,454; 2,236 after exclusions). A higher number of cardiovascular risk factors, larger waist circumference, lower physical activity levels, lower total energy intake, poorer baseline adherence to the 14-point adherence score, and allocation to MedDiet + EVOO each independently predicted poorer adherence. Participants from PREDIMED recruiting centers with a higher total workload (measured as total number of persons-years of follow-up) achieved better adherence. No adverse events or side effects were reported.
Conclusions
To maximize dietary adherence in dietary interventions, additional efforts to promote adherence should be used for participants with lower baseline adherence to the intended diet and poorer health status. The design of multicenter nutrition trials should prioritize few large centers with more participants in each, rather than many small centers.
Trial registration
This study was registered at controlled-trials.com (http://www.controlled-trials. com/ISRCTN35739639). International Standard Randomized Controlled Trial Number (ISRCTN): 35739639. Registration date: 5 October 2005.
Trial design: parallel randomized trial.
Electronic supplementary material
The online version of this article (doi:10.1186/s12966-016-0394-6) contains supplementary material, which is available to authorized users.
Keywords: Dietary adherence, Short-term dietary adherence, Long-term dietary adherence, Mediterranean Diet, PREDIMED trial, Dietary predictors, Dietary intervention
Background
The global burden of diet-related chronic diseases has skyrocketed over the last few decades. As rates continue to rise [1] and food environments become increasingly obesogenic [2], it is more important than ever to improve understanding of diet-disease relationships and decrease the risk of chronic disease through diet modification. Effective dietary intervention strategies can help accomplish both of these objectives. The Mediterranean-type diet (MedDiet) is associated with decreased risk of all-cause [3, 4] and premature [5, 6] death, cardiovascular disease [7, 8], type 2 diabetes [9, 10], overweight and obesity [11, 12], and several cancers [13, 14]. Experimental interventions and randomized controlled trials (RCTs) have confirmed these findings [7, 8, 14–19]. It is very likely that future intervention trials in nutrition will adopt the paradigm of the Mediterranean food pattern, as the 2015 Dietary Guidelines for Americans have recommended [20]. In this context, information about the predictors of success in interventions using such a food pattern is very much needed.
Permanent dietary modifications are difficult to achieve; long-term dietary interventions often have low adherence [21–26]. Identifying participant characteristics and study design features that predict long-term adherence will substantially help investigators design dietary interventions to maximize adherence, achieve sufficient contrast in nutritional exposures between intervention arms, and reduce diet-related chronic diseases in target populations.
A handful of studies have identified predictors of short-term adherence to dietary interventions [27–35]. Predictors included the female sex [35], older age [27, 29], a non-diabetic [28, 35] and non-depressive status [34, 36], normal weight [29, 30, 34], higher physical activity levels [34, 35], not smoking [35], white ethnicity [29, 32], higher socioeconomic status [27, 29, 33], and being married [35]. Only two studies have investigated predictors of adherence to the MedDiet [35, 37]. PREvención con DIeta MEDiterránea (PREDIMED) researchers investigated the relationship between baseline characteristics and MedDiet adherence, but that study included only a partial sample of the trial and evaluated only short-term adherence [35]. Another study had longer follow-up but lacked a control group [37].
Among the very few studies that have examined long-term dietary adherence, the outcome was often defined as meeting weight-loss goals, which is only a proxy for dietary adherence. Because only sustained, long-term dietary patterns modify chronic disease risk [38–40], a better understanding of long-term adherence to healthy dietary patterns is needed.
The aim of the present study was to identify predictors of short and long-term adherence with a MedDiet intervention. This study uses data from the PREDIMED trial, a RCT of the MedDiet for the primary prevention of cardiovascular disease [41, 42].
Methods
Study population
Details on the PREDIMED design and methods are described in detail elsewhere [18, 23, 43]. Briefly, the PREDIMED trial was a multicenter, randomized, controlled, single-blinded cardiovascular disease prevention trial conducted in Spain [41]. It was designed to assess the effects of the MedDiet on cardiovascular disease in 7,447 participants recruited between 2003 and 2009. Eligible participants were aged 55 to 80 and at high risk for developing cardiovascular disease (CVD). High risk was defined as having type 2 diabetes or at least three of the following major (CVD) risk factors: current smoking, hypertension, elevated low-density lipoprotein cholesterol levels, BMI ≥25 kg/m2, or a family history of premature coronary heart disease (CHD). After providing written informed consent, participants were randomized to one of three interventions; a traditional MedDiet supplemented with either complementary extra-virgin olive oil (EVOO) or tree nuts or a control diet (advice to reduce all types of dietary fat). The control group was excluded from the present analyses because the focus of this study was the adherence with the intervention promoting the MedDiet. Inclusion criteria into this study are depicted in the flow diagram figure provided below, along with the CONSORT checklist for randomized trials. The trial ended in 2010, after a median follow-up of 4.8 years, because of the observed benefit of the MedDiet compared to the low-fat control diet in the prevention of CVD. Institutional Review Boards at 11 recruiting centers approved the study protocol [44]. No harm or unintended effects were reported in any arm [41].
When one-year dietary adherence was the outcome of interest, the present study excluded participants missing information on any of the 14-point dietary adherence score items at one year of follow-up (n = 799), leaving 4,198 participants for analysis. When four-year dietary adherence was the outcome of interest, participants recruited after November 2006 (n = 1,495) were excluded because subsequent follow-up was less than four years. Participants who had missing information on any of the 14-point dietary adherence score items at four years of follow-up were further excluded (n = 1,149), leaving 2,353 participants available for analysis.
Outcome assessment
Registered dietitians conducted quarterly group sessions and one-on-one in-person interviews to deliver a comprehensive motivational educational intervention aimed at modifying participant eating habits. Dietitians collected detailed dietary information at baseline and yearly thereafter during follow-up. Individual interviews and group sessions were conducted every three months throughout the trial. A previously validated 14-item Mediterranean Diet Assessment Tool [45] was the primary method for assessing adherence to the intervention (Additional file 1: Figure S1). PREDIMED dietitians assessed participant adherence using this tool during each visit. A value of 0 (non-compliant) or 1 (compliant) was assigned to each item [46]. Higher scores reflected better adherence. High adherence was defined as meeting at least 11 of the 14 items. This cut-point was used because roughly half of participants complied with 11 or more items at each follow-up visit.
Covariate assessment
Dietitians administered a validated 137-item food frequency questionnaire (FFQ) at each yearly visit [47], from which total energy and alcohol intake was computed [48]. Another questionnaire collected information on sociodemographic variables, lifestyle, and family history data. A validated Spanish version of the Minnesota questionnaire [49, 50] was used to assess physical activity. Investigators reviewed medical records at baseline and yearly thereafter to assess medical diagnoses. Nurses measured weight and height using standardized procedures, and blood pressure using a validated [51] semiautomatic oscillometer in triplicate (Omron HEM_705CP). Primary care doctors assessed participants for new diagnoses of hypercholesterolemia, hypertension and type 2 diabetes. Definitions for these diagnoses are described elsewhere [42].
Exposure assessment
Potential baseline predictors of adherence were assessed based on clinical relevance and findings from previously published studies. These included sex (male, female), age (<65 years, ≥65 years), highest educational level attained (less than primary school, primary school, secondary school, university or more), occupation (retired, working, housewife, unemployed or unable to work), marital status (married, other), number of people in household, continuous cardiovascular risk factor score (one point was assigned for each of the following diagnoses or conditions: type 2 diabetes, hypertension, high blood cholesterol, family history of premature CHD, depression, and obesity; scores of 0–1 and 5–6 were collapsed due to low frequency), individual cardiovascular risk factors (each of the six factors included in the cardiovascular risk score were also assessed separately instead of as a continuous score), systolic blood pressure and diastolic blood pressure (SBP and DBP, continuous, per 5 mmHg), waist circumference (continuous, per 5 cm), physical activity (tertiles of MET-min/day), smoking status (never, former, current), total energy intake (quartiles of kcal/day), alcohol other than wine (low: <10 g/day for men, <5 for women; moderate: 10–50 for men, 5–10 for women; high: >50 for men, >10 for women), baseline 14-point dietary adherence score (<11 points, ≥11 points), and MedDiet intervention group (mixed nuts, EVOO). This analysis also evaluated whether the “total workload”, measured in person-years of follow-up and an indicator of how many participants a given center delivers the intervention to throughout follow-up, was associated with dietary adherence.
Statistical methods
Chi-square tests were used to assess differences in distributions of baseline characteristics between those with low adherence (<11 points) and high adherence (≥11 points). In Table 2, crude and multivariate-adjusted logistic regression was used to calculate odds ratios (ORs) of adherence to the MedDiet at one and four years of follow-up according to baseline characteristics. Multivariate models were adjusted for all potential predictors of dietary adherence listed above. To calculate p-values for trend, the median value was assigned to each category and the resulting variable was treated as continuous. Quantiles were not treated as ordinal variables to account for the fact that the differences in median values across quantiles were not equal.
Table 2.
Odds of high adherence with the MedDiet intervention at one and four years of follow-upa
| OR (95 % CI) for dietary adherence (≥11 vs. <11 points)b | ||||||||||
|---|---|---|---|---|---|---|---|---|---|---|
| 1 Year | 4 Years | |||||||||
| Demographic Characteristics | n | Crude | p | Multivariate | p | n | Crude | p | Multivariate | p |
| Sex | ||||||||||
| Men | 1820 | 1.00 (ref) | 1.00 (ref) | 1103 | 1.00 (ref) | 1.00 (ref) | ||||
| Women | 2378 | 0.83 (0.73, 0.94) | 0.003 | 0.78 (0.64, 0.96) | 0.02 | 1350 | 0.76 (0.64, 0.90) | 0.001 | 0.92 (0.69, 1.23) | 0.59 |
| Age at baseline (years) | ||||||||||
| < 65 | 1627 | 1.00 (ref) | 1.00 (ref) | 868 | 1.00 (ref) | 1.00 (ref) | ||||
| ≥ 65 | 2571 | 1.01 (0.89, 1.14) | 0.90 | 0.98 (0.80, 1.15) | 0.80 | 1485 | 0.87 (0.74, 1.04) | 0.12 | 0.90 (0.73, 1.12) | 0.36 |
| Educational level | ||||||||||
| University or higher | 339 | 1.00 (ref) | 1.00 (ref) | 173 | 1.00 (ref) | 1.00 (ref) | ||||
| Secondary school | 643 | 0.92 (0.71, 1.20) | 0.56 | 0.97 (0.73, 1.28) | 0.83 | 356 | 0.61 (0.42, 0.90) | 0.01 | 0.68 (0.46, 1.02) | 0.06 |
| Primary School | 3109 | 0.82 (0.65, 1.03) | 0.09 | 0.90 (0.70, 1.15) | 0.39 | 1768 | 0.64 (0.46, 0.90) | 0.009 | 0.81 (0.57, 1.17) | 0.26 |
| Less than primary school | 107 | 0.60 (0.39, 0.92) | 0.02 | 0.87 (0.54, 1.39) | 0.55 | 57 | 0.29 (0.15, 0.54) | <0.001 | 0.52 (0.27, 1.01) | 0.06 |
| Occupation | ||||||||||
| Retired | 2234 | 1.00 (ref) | 1.00 (ref) | 1127 | 1.00 (ref) | 1.00 (ref) | ||||
| Working | 509 | 0.81 (0.67, 0.98) | 0.03 | 0.77 (0.61, 0.96) | 0.02 | 258 | 1.04 (0.89, 1.37) | 0.75 | 1.00 (0.72, 1.38) | 0.99 |
| Housewife | 1324 | 0.95 (0.83, 1.09) | 0.44 | 1.12 (0.93, 1.33) | 0.51 | 802 | 0.89 (0.74, 1.06) | 0.19 | 1.03 (0.81, 1.32) | 0.80 |
| Unemployed/unable to work | 131 | 0.64 (0.45, 0.91) | 0.01 | 0.14 (0.47, 1.01) | 0.06 | 66 | 0.87 (0.53, 1.44) | 0.59 | 1.00 (0.58, 1.73) | 0.99 |
| Marital Status | ||||||||||
| Married | 3266 | 1.00 (ref) | 1.00 (ref) | 1824 | 1.00 (ref) | 1.00 (ref) | ||||
| Single | 157 | 0.97 (0.70, 1.34) | 0.85 | 1.02 (0.72, 1.43) | 0.92 | 88 | 1.08 (0.70, 1.68) | 0.73 | 0.93 (0.58, 1.49) | 0.76 |
| Widowed | 668 | 0.87 (0.74, 1.03) | 0.07 | 1.00 (0.83, 1.21) | 0.99 | 399 | 0.77 (0.62, 0.96) | 0.02 | 0.86 (0.67, 1.11) | 0.26 |
| Divorced or separated | 107 | 0.75 (0.51, 1.10) | 0.15 | 0.99 (0.66, 1.50) | 0.97 | 42 | 0.91 (.49, 1.69) | 0.76 | 1.16 (0.60, 2.25) | 0.65 |
| Number of people in household | 4198 | 1.00 (0.96, 1.05) | 0.89 | 1.04 (0.99, 1.10) | 0.12 | 2353 | 1.01 (0.94, 1.07) | 0.87 | 0.99 (0.92, 1.06) | 0.70 |
| Health-Related Characteristics at Baseline | ||||||||||
| Number of CVD Risk Factors c,d | ||||||||||
| 0–1 | 285 | 1.00 (ref) | 1.00 (ref) | 204 | 1.00 (ref) | 1.00 (ref) | ||||
| 2 | 1237 | 0.89 (0.68, 1.15) | 0.94 (0.71, 1.25) | 734 | 0.76 (0.55, 1.05) | 0.82 (0.58, 1.17) | ||||
| 3 | 1632 | 0.76 (0.59, 0.98) | 0.94 (0.71, 1.24) | 884 | 0.66 (0.48, 0.91) | 0.83 (0.58, 1.18) | ||||
| 4 | 824 | 0.62 (0.47, 0.81) | 0.87 (0.64, 1.18) | 429 | 0.50 (0.35, 0.71) | 0.71 (0.48, 1.04) | ||||
| 5–6 | 220 | 0.57 (0.40, 0.81) | <0.001 | 0.83 (0.56, 1.23) | 0.26 | 102 | 0.34 (0.21, 0.56) | <0.001 | 0.47 (0.27, 0.80) | 0.009 |
| Individual CVD Risk Factors | ||||||||||
| Type 2 Diabetes | ||||||||||
| No | 2199 | 1.00 (ref) | 1.00 (ref) | 1221 | 1.00 (ref) | 1.00 (ref) | ||||
| Yes | 1999 | 0.75 (0.66, 0.85) | <0.001 | 0.77 (0.66, 0.88) | <0.001 | 1132 | 0.71 (0.60, 0.84) | <0.001 | 0.74 (0.61, 0.90) | 0.003 |
| Hypertension | ||||||||||
| No | 757 | 1.00 (ref) | 1.00 (ref) | 447 | 1.00 (ref) | 1.00 (ref) | ||||
| Yes | 3441 | 0.97 (0.83, 1.13) | 0.68 | 0.89 (0.74, 1.06) | 0.20 | 1906 | 0.87 (0.71, 1.08) | 0.21 | 0.77 (0.61, 0.99) | 0.04 |
| Hypercolesterolaemia | ||||||||||
| No | 1169 | 1.00 (ref) | 1.00 (ref) | 748 | 1.00 (ref) | 1.00 (ref) | ||||
| Yes | 3029 | 1.14 (0.99, 1.30) | 0.06 | 1.06 (0.92, 1.24) | 0.42 | 1605 | 1.15 (0.96, 1.37) | 0.13 | 1.11 (0.91, 1.36) | 0.29 |
| Family history of premature CHD | ||||||||||
| No | 3237 | 1.00 (ref) | 1.00 (ref) | 1871 | 1.00 (ref) | 1.00 (ref) | ||||
| Yes | 961 | 0.89 (0.77, 1.02) | 0.10 | 0.88 (0.75, 1.03) | 0.11 | 482 | 0.64 (0.53, 0.79) | <0.001 | 0.63 (0.50, 0.78) | <0.001 |
| Depression | ||||||||||
| No | 3481 | 1.00 (ref) | 1.00 (ref) | 1975 | 1.00 (ref) | 1.00 (ref) | ||||
| Yes | 717 | 0.87 (0.74, 1.02) | 0.10 | 0.97 (0.81, 1.15) | 0.71 | 378 | 0.79 (0.64, 0.99) | 0.04 | 0.81 (0.63, 1.03) | 0.09 |
| Obesity | ||||||||||
| No | 2282 | 1.00 (ref) | 1.00 (ref) | 1302 | 1.00 (ref) | 1.00 (ref) | ||||
| Yes | 1916 | 0.78 (0.69, 0.88) | <0.001 | 1.12 (0.95, 1.32) | 0.17 | 1051 | 0.83 (0.70, 0.97) | 0.02 | 1.14 (0.91, 1.43) | 0.24 |
| SBP (per 5 mmHg) | 4198 | 1.01 (1.00, 1.03) | 0.07 | 1.00 (0.99, 1.02) | 0.70 | 2353 | 1.02 (1.00, 1.04) | 0.02 | 1.01 (0.99, 1.04) | 0.31 |
| DBP (per 5 mmHg) | 4198 | 1.02 (1.00, 1.05) | 0.09 | 1.02 (0.98, 1.05) | 0.38 | 2353 | 1.03 (0.99, 1.07) | 0.10 | 1.00 (0.95, 1.05) | 0.90 |
| Waist circumference (per 5 cm) | 4198 | 0.90 (0.88, 0.93) | <0.001 | 0.92 (0.88, 0.95) | <0.001 | 2353 | 0.90 (0.87, 0.94) | <0.001 | 0.97 (0.92, 1.02) | 0.22 |
| Physical activity (MET-min/d) c,e | ||||||||||
| T1 (low) | 1332 | 1.00 (ref) | 1.00 (ref) | 703 | 1.00 (ref) | 1.00 (ref) | ||||
| T2 | 1414 | 1.28 (1.10, 1.48) | 1.13 (0.97, 1.33) | 785 | 1.46 (1.19, 1.80) | 1.29 (1.04, 1.60) | ||||
| T3 (high) | 1452 | 1.70 (1.46, 1.98) | <0.001 | 1.38 (1.17, 1.63) | <0.001 | 865 | 2.12 (1.72, 2.60) | <0.001 | 1.62 (1.29, 2.04) | <0.001 |
| Smoking Status | ||||||||||
| Never | 2576 | 1.00 (ref) | 1.00 (ref) | 1482 | 1.00 (ref) | 1.00 (ref) | ||||
| Former | 574 | 0.90 (0.75, 1.08) | 0.24 | 0.83 (0.67, 1.04) | 0.10 | 320 | 1.16 (0.90, 1.48) | 0.25 | 0.97 (0.71, 1.31) | 0.83 |
| Current | 1048 | 1.17 (1.01, 1.35) | 0.04 | 1.05 (0.87, 1.26) | 0.63 | 551 | 1.17 (0.95, 1.42) | 0.13 | 1.01 (0.78, 1.30) | 0.96 |
| Total energy intake (kcal/day) c, f | ||||||||||
| Q1 (low) | 1017 | 1.00 (ref) | 1.00 (ref) | 568 | 1.00 (ref) | 1.00 (ref) | ||||
| Q2 | 1038 | 1.31 (1.10, 1.56) | 1.20 (1.00, 1.45) | 858 | 1.17 (0.92, 1.49) | 1.08 (0.84, 1.40) | ||||
| Q3 | 1078 | 1.34 (1.13, 1.59) | 1.16 (0.96, 1.39) | 363 | 1.41 (1.11, 1.79) | 1.28 (0.99, 1.65) | ||||
| Q4 (high) | 1065 | 1.50 (1.26, 1.79) | <0.001 | 1.32 (1.09, 1.58) | 0.009 | 564 | 1.36 (1.08, 1.72) | 0.007 | 1.27 (0.99, 1.64) | 0.04 |
| Alcohol other than wine (g/day) | ||||||||||
| < 10 men, <5 women | 2429 | 1.00 (ref) | 1.00 (ref) | 1360 | 1.00 (ref) | 1.00 (ref) | ||||
| 10-50 men, 5–10 women | 606 | 1.04 (0.87, 1.24) | 0.67 | 0.88 (0.72, 1.08) | 0.21 | 344 | 1.03 (0.81, 1.31) | 0.81 | 0.80 (0.61, 1.05) | 0.11 |
| > 50 men, >10 women | 1163 | 1.00 (0.87, 1.15) | 0.97 | 0.93 (0.80, 1.09) | 0.39 | 649 | 1.09 (0.90, 1.32) | 0.38 | 1.03 (0.83, 1.28) | 0.77 |
| 14-point adherence score a | ||||||||||
| < 11 | 3416 | 1.00 (ref) | 1.00 (ref) | 1864 | 1.00 (ref) | 1.00 (ref) | ||||
| ≥ 11 | 782 | 3.41 (2.85, 4.07) | <0.001 | 3.25 (2.71, 3.91) | <0.001 | 489 | 2.06 (1.66, 2.6) | <0.001 | 1.81 (1.44, 2.27) | <0.001 |
| Study Design Features | ||||||||||
| Intervention Group | ||||||||||
| MedDiet + nuts | 1962 | 1.00 (ref) | 1.00 (ref) | 1027 | 1.00 (ref) | 1.00 (ref) | ||||
| MedDiet + EVOO | 2236 | 0.70 (0.62, 0.79) | <0.001 | 0.70 (0.62, 0.80) | <0.001 | 1326 | 0.74 (0.62, 0.87) | <0.001 | 0.74 (0.62, 0.88) | 0.001 |
| Total workload of center (person-years) e,g | ||||||||||
| Q1 (low) | 1247 | 1.00 (ref) | 1.00 (ref) | 624 | 1.00 (ref) | 1.00 (ref) | ||||
| Q2 | 1133 | 1.31 (1.12, 1.54) | 1.34 (1.12, 1.59) | 361 | 0.87 (0.70, 1.08) | 0.87 (0.69, 1.10) | ||||
| Q3 | 1168 | 1.90 (1.61, 2.23) | 1.75 (1.46, 2.10) | 804 | 0.67 (0.51, 0.87) | 0.74 (0.56, 0.99) | ||||
| Q4 (high) | 650 | 1.32 (1.10, 1.60) | <0.001 | 1.48 (1.19, 1.79) | <0.001 | 564 | 2.56 (1.98, 3.31) | <0.001 | 2.27 (1.72, 3.00) | 0.004 |
a ORs < 1 imply poorer adherence. ORs > 1 imply better adherence. A validated MedDiet adherence assessment tool was used. 1 point was added for each item in adherence with the traditional MedDiet. High adherence = adherence with ≥11 items on 14-point dietary adherence score. Low adherence = adherence with <11 items. b All models are from logistic regression analysis. Multivariate models are mutually adjusted for all characteristics displayed in this table including total CVD risk score but excluding individual CVD risk factors (type 2 diabetes, hypertension, hypercholesterolaemia, family history of pre-mature CHD, depression, obesity). When an individual CVD risk factors was the exposure of interest, the model was mutually adjusted for other individual CVD risk factors but not total CVD risk score. c P-values for trend were calculated by assigning the median value to each category and treating the resulting variable as continuous d Total CVD risk score calculated by summing the following CVD risk factors: type 2 diabetes, hypertension, high blood cholesterol, family history of premature CHD, depression, obesity. e Tertiles of physical activity (MET-min/d): T1: <108; T2: 108–268; T3: ≥268. f Quartiles of energy intake (kcal/d), by sex: Men: Q1: <2051; Q2: 2051- < 2394; Q3:2934- < 2801; Q4: ≥2801. Women: Q1: <1786; Q2: 1786- < 2109; Q3: 2109- < 2465; Q4: ≥2465. g Measured in quartiles of person years at center. After 1 Year: Q1: 133- < 352; Q2: 352- < 537; Q3: 537- < 650; Q4: ≥650. After 4 years: Q1: 893- < 1220; Q2: 1220- < 2175; Q3: 2175- < 2384; Q4: ≥2384
Several sensitivity analyses were conducted using multivariate logistic regression. Analyses looked at associations between potential baseline predictors and adherence at two and three years of follow-up (instead of one and four years), and with ≥10 and ≥12 as alternative cut-points for dietary adherence (instead of ≥11).
All p-values are two-tailed. Values of ≤0.05 are considered statistically significant. All statistical analyses were performed using Stata software (version 12.0, StataCorp 2011, College Station, TX, USA).
Results
Table 1 shows the mean (±SD) or percentage of participants with high adherence and low adherence (≥11 and <11 points on 14-point score) after 1-y and 4-y follow-up across levels of baseline characteristics. 54 % of participants complied at one-year follow-up, and 58 % at 4-y follow-up. The mean (±SD) age at baseline was 66.9 (±6.1) years, and 56.4 % of participants were female. The following baseline characteristics were associated with lower adherence at both time points: female sex, a greater number of cardiovascular risk factors, larger waist circumference, less physical activity, less total energy intake, and lower baseline 14-point dietary adherence score. When individual risk factors were assessed, type 2 diabetes diagnosis and obesity were associated with poorer adherence at both time points. Randomization to the MedDiet supplemented with MedDiet + EVOO and inclusion at a center following a lower intervention workload were also correlated with lower adherence at one and four years. Additional file 2: Table S5 shows that distributions of baseline characteristics did not differ depending on time period of enrollment, with the exception of number of total workload per center. Centers that began recruitment after November, 2006 were the only centers with less than 300 participants. November, 2006 was selected as the cut-point because participants recruited after this date were followed for less than four years, and thus were excluded from analyses where dietary adherence at four years is the outcome of interest.
Table 1.
Baseline characteristics according to a 14-point dietary adherence score after 1, 4 years of follow-upa
| 1 Year of Follow-up | 4 Years of Follow-up | |||||
|---|---|---|---|---|---|---|
| Adherenceb | Low (n = 1925) | High (n = 2273) | Low (n = 978) | High (n = 1375) | ||
| Demographic Characteristics c | % or mean (SD) | p-value | % or mean (SD) | p-value | ||
| Women | 59.1 | 54.6 | 0.003 | 61.3 | 54.6 | 0.001 |
| Age at Baseline (years) | 66.9 (6.1) | 66.9 (5.9) | 0.68 | 67.6 (6.2) | 66.8 (5.8) | 0.005 |
| Educational level | ||||||
| University | 7.5 | 8.8 | 5.6 | 8.7 | ||
| Secondary school | 14.8 | 16.2 | 15.8 | 15.0 | ||
| Primary school | 74.7 | 72.8 | 75.0 | 74.8 | ||
| Less than primary school | 3.1 | 2.2 | 0.06 | 3.6 | 1.6 | 0.001 |
| Occupation | ||||||
| Retired | 51.6 | 54.6 | 50.9 | 53.0 | ||
| Working | 13.1 | 11.3 | 10.4 | 11.4 | ||
| Housewife | 31.5 | 31.6 | 35.7 | 33.0 | ||
| Unemployed/unable to work | 3.8 | 2.6 | 0.02 | 3.0 | 2.7 | 0.51 |
| Marital Status | ||||||
| Married | 75.9 | 78.9 | 75.6 | 78.9 | ||
| Single | 3.7 | 3.7 | 3.5 | 3.9 | ||
| Widowed | 18.6 | 15.1 | 19.1 | 15.4 | ||
| Divorced or separated | 1.8 | 2.2 | 0.22 | 1.8 | 1.8 | 0.12 |
| Number of People in Household | 1.7 (1.3) | 1.7 (1.4) | 0.89 | 1.6 (1.1) | 1.6 (1.5) | 0.87 |
| Health-Related Characteristics at Baseline | ||||||
| Number of CVD Risk Factorsc | ||||||
| 0-1 | 5.8 | 7.6 | 6.7 | 10.1 | ||
| 2 | 27.1 | 31.5 | 28.6 | 33.0 | ||
| 3 | 39.1 | 38.7 | 37.5 | 37.6 | ||
| 4 | 21.9 | 17.7 | 21.2 | 16.2 | ||
| 5-6 | 6.1 | 4.5 | <0.001 | 6.0 | 3.1 | <0.001 |
| Type 2 diabetes | 51.5 | 44.3 | <0.001 | 53.1 | 44.6 | <0.001 |
| Hypertension | 82.2 | 81. | 0.60 | 82.2 | 80.2 | 0.21 |
| Hypercholesterolemia | 70.8 | 73.3 | 0.06 | 66.5 | 69.5 | 0.12 |
| Family history of premature CHD | 24.1 | 21.9 | 0.10 | 24.7 | 17.5 | <0.001 |
| Depression | 18.1 | 16.2 | 0.10 | 17.9 | 14.8 | 0.04 |
| Obesity | 49.0 | 42.8 | <0.001 | 47.4 | 42.7 | 0.02 |
| SBP (mmHg) | 148.5 (20.7) | 149.7 (20.6) | 0.07 | 148.5 (20.6) | 150.5 (20.9) | 0.02 |
| DBP (mmHg) | 82.9 (10.8) | 83.5 (11.1) | 0.09 | 83.3 (11.2) | 84.1 (10.9) | 0.10 |
| Waist circumference (cm) | 101.2 (10.0) | 99.1 (10.6) | 0.004 | 100.8 (10.3) | 98.7 (10.0) | <0.001 |
| Physical activity (MET-min/d)d | ||||||
| T1 (low) | 36.1 | 27.7 | 36.7 | 24.7 | ||
| T2 | 34.3 | 33.6 | 34.0 | 33.5 | ||
| T3 (high) | 29.6 | 38.6 | <0.001 | 29.4 | 41.8 | <0.001 |
| Smoking status | ||||||
| Never | 62.1 | 60.7 | 65.0 | 61.5 | ||
| Former | 14.7 | 12.9 | 12.9 | 14.1 | ||
| Current | 23.2 | 26.4 | <0.03 | 22.1 | 24.4 | 0.22 |
| Total energy intake (kcal/day)e | ||||||
| Q1 (low) | 27.3 | 21.4 | 24.6 | 19.9 | ||
| Q2 | 24.5 | 25.1 | 24.2 | 22.9 | ||
| Q3 | 25.3 | 26.5 | 23.7 | 27.0 | ||
| Q4 (high) | 23.0 | 27.1 | <0.001 | 27.6 | 30.3 | 0.02 |
| Alcohol other than wine (g/day) | ||||||
| < 10 men, <5 women | 57.9 | 57.6 | 58.6 | 57.0 | ||
| 10-50 men, 5–10 women | 14.2 | 14.7 | 14.7 | 14.7 | ||
| > 50 men, > 10 women | 27.9 | 27.7 | 0.90 | 26.7 | 28.3 | 0.68 |
| 14-point adherence scoreb | 8.2 (1.8) | 9.3 (1.8) | <0.001 | 8.5 (2.0) | 9.3 (1.9) | <0.001 |
| Intervention Design Features | ||||||
| Intervention Group | ||||||
| MedDiet + EVOO | 58.0 | 49.2 | 60.7 | 53.2 | ||
| MedDiet + Nuts | 42.0 | 50.8 | <0.001 | 39.3 | 46.8 | <0.001 |
| Total workload of center (person-years) f | ||||||
| Q1 (low) | 34.4 | 26.7 | 25.4 | 23.3 | ||
| Q2 | 27.3 | 26.8 | 41.3 | 33.0 | ||
| Q3 | 22.7 | 32.2 | 19.9 | 12.2 | ||
| Q4 (high) | 15.6 | 15.4 | <0.001 | 13.4 | 31.5 | <0.001 |
a Those randomized after November 2006 did not have the opportunity to provide information on 4-year adherence. b A validated MedDiet adherence assessment tool was used. 1 point was added for each item in adherence with the traditional MedDiet. High adherence = adherence with ≥11 items on 14-point dietary adherence score. Low adherence = adherence with <11 items. c Total CVD risk score was calculated by summing the following CVD risk factors: type 2 diabetes, hypertension, high blood cholesterol, family history of premature CHD, depression, obesity. d Tertiles of physical activity (MET-min/d): T1: <108; T2: 108–268; T3: ≥268. e Quartiles of energy intake (kcal/d), by sex: Men: Q1: <2051; Q2: 2051- < 2394; Q3:2934- < 2801; Q4: ≥2801. Women: Q1: <1786; Q2: 1786- < 2109; Q3: 2109- < 2465; Q4: ≥2465. f Measured in quartiles of person years at center. After 1 Year: Q1: 133- < 352; Q2: 352- < 537; Q3: 537- < 650; Q4: ≥650. After 4 years: Q1: 893- < 1220; Q2: 1220- < 2175; Q3: 2175- < 2384; Q4: ≥2384
Figure 1 provides a summary diagram comparing multivariate logistic regression results across all primary and sensitivity analyses.
Fig. 1.
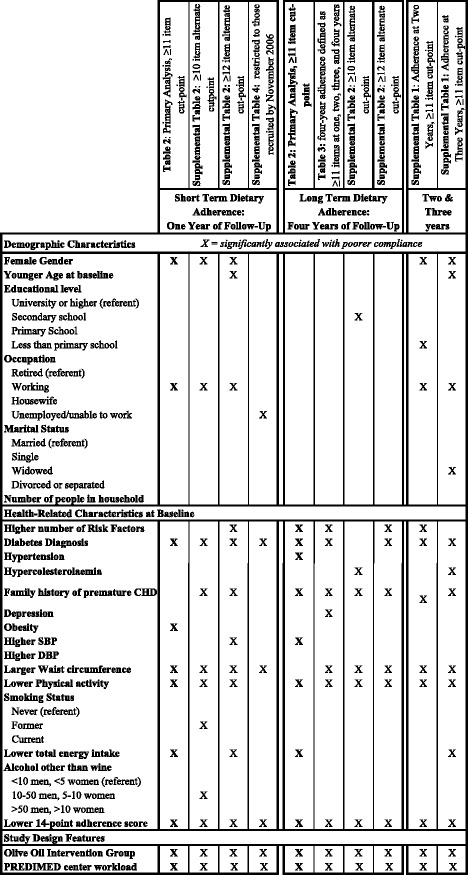
Summary of primary and sensitivity analysis results from multivariate logistic regression models investigating predictors of dietary adherence with the 14-point MedDiet score
Short term dietary adherence (one year of follow-up)
Table 2 shows primary results for the association between potential baseline characteristics and dietary adherence after one and and four years of follow-up. The following baseline characteristics were associated with lower dietary adherence at one year of follow-up in multivariate logistic regression models: the female sex, working (vs. retired), type 2 diabetes diagnosis, obesity, larger waist circumference, lower physical activity, lower total energy intake, and lower 14-point baseline adherence score. Both study design features, randomization to the MedDiet + EVOO intervention arm, and belonging to a PREDIMED center that had a lower workload (fewer person years), were also associated with lower one-year adherence. In Additional file 2: Table S2, the dietary adherence score cut-off point is changed from ≥11 to the alternative cut-off points of ≥10 and ≥12. The majority of predictors of low one-year adherence observed in Table 2, when ≥11 items was the cut-off point, remained after changing the cut-off point. Exceptions include obesity (no longer a predictor when either alternate cut-off point was used) and lower energy intake (no longer a predictor when ≥10 items was the cut-off point). Additional file 2: Table S4 investigates adherence at one year of follow-up after excluding those recruited after November 2006 in order to restrict to the group that could be analyzed at both time points. A handful of associations did not hold, likely due to reduced power as a result of smaller sample size. Associations with lower one-year adherence that did not hold included the female gender, working (vs. retired), obesity, lower physical activity, and lower total energy intake. Baseline predictors of lower one-year adherence that remained significant throughout all sensitivity analyses include type 2 diabetes, larger waist circumference, and lower 14-point baseline adherence score. Both study design features (randomization to the MedDiet + EVOO intervention arm and belonging to a PREDIMED center with a lower workload) were also associated with lower one-year adherence throughout all sensitivity analyses.
Long term dietary adherence (after four years of follow-up)
Based on the primary analysis in Table 2, the following baseline characteristics were associated with lower dietary adherence after four years in multivariate logistic regression models: higher total number of cardiovascular risk factors, specifically type 2 diabetes diagnosis, hypertension, and family history of premature CHD, higher SBP, lower physical activity levels, lower total energy intake, and lower baseline14-point adherence score. Study design features predicting lower adherence after four years of follow-up included being in the MedDiet + EVOO intervention arm and belonging to a PREDIMED center with a lower workload over follow-up. Table 3 defines four-year adherence as consistently meeting the criteria for high dietary adherence (≥11 points on 14-point score) every year throughout the first four years of follow-up. Results were similar to four-year results in Table 2. However, with this more stringent definition, hypertension, higher SBP, and lower energy intake were no longer associated with poorer four-year adherence. After changing the dietary adherence cut-off points to ≥10 and ≥12 items (Additional file 2: Table S2), all associations between potential predictors and lower four-year adherence remained except for total number of cardiovascular risk factors (no longer a predictor when cut-off point was ≥10 items), type 2 diabetes diagnosis (no longer a predictor when cut-point was ≥10 items), higher SBP (no longer a predictor for either alternative cut-point), and lower total energy intake (no longer a predictor using either alternative cut-off point). Baseline predictors of lower four-year adherence that remained significant throughout all sensitivity analyses included family history of CHD, lower physical activity, lower baseline 14-point adherence score, randomization to the MedDiet + EVOO arm, and belonging to a PREDIMED center with a lower workload.
Table 3.
Odds of high adherence with the MedDiet intervention every year throughout four years of follow-up. a
| OR (95 % CI) for dietary adherence (≥11 vs. <11 points)b | |||||
|---|---|---|---|---|---|
| Demographic Characteristics | n | Crude Model | p | Multivariate | p |
| Sex | |||||
| Men | 815 | 1.00 (ref) | 1.00 (ref) | ||
| Women | 1103 | 0.69 (0.57, 0.84) | <0.001 | 0.72 (0.49, 1.05) | 0.09 |
| Age at baseline (years) | |||||
| < 65 | 683 | 1.00 (ref) | 1.00 (ref) | ||
| ≥ 65 | 1235 | 0.94 (0.77, 1.15) | 0.57 | 0.85 (0.65, 1.12) | 0.25 |
| Educational level | |||||
| University or higher | 146 | 1.00 (ref) | 1.00 (ref) | ||
| Secondary school | 294 | 0.59 (0.39, 0.89) | 0.01 | 0.71 (0.44, 1.14) | 0.15 |
| Primary School | 1435 | 0.62 (0.44, 0.89) | 0.006 | 0.78 (0.52, 1.18) | 0.24 |
| Less than primary school | 43 | 0.23 (0.09, 0.57) | 0.002 | 0.53 (0.19, 1.48) | 0.23 |
| Occupation | |||||
| Retired | 1017 | 1.00 (ref) | 1.00 (ref) | ||
| Working | 197 | 0.79 (0.56, 1.10) | 0.16 | 0.72 (0.47, 1.11) | 0.14 |
| Housewife | 662 | 0.85 (0.68, 1.05) | 0.12 | 1.00 (0.72, 1.38) | 0.98 |
| Unemployed/unable to work | 42 | 0.48 (0.22, 1.04) | 0.06 | 0.72 (0.30, 1.71) | 0.46 |
| Marital Status | |||||
| Married | 1484 | 1.00 (ref) | 1.00 (ref) | ||
| Single | 76 | 1.04 (0.64, 1.71) | 0.86 | 0.85 (0.47, 1.51) | 0.58 |
| Widowed | 324 | 0.78 (0.60, 1.02) | 0.07 | 0.89 (0.64, 1.24) | 0.50 |
| Divorced or separated | 34 | 0.66 (0.29, 1.46) | 0.30 | 1.35 (0.54, 3.40) | 0.52 |
| Number of people in household | 1918 | 1.05 (0.96, 1.14) | 0.31 | 1.02 (0.91, 1.14) | 0.76 |
| Health-Related Characteristics at Baseline | |||||
| Number of CVD Risk Factors c,d | |||||
| 0–1 | 171 | 1.00 (ref) | 1.00 (ref) | ||
| 2 | 595 | 0.95 (0.67, 1.35) | 1.13 (0.75, 1.68) | ||
| 3 | 714 | 0.62 (0.44, 1.87) | 0.91 (0.60, 1.37) | ||
| 4 | 352 | 0.45 (0.30, 0.66) | 0.78 (0.48, 1.25) | ||
| 5–6 | 86 | 0.18 (0.08, 0.38) | <0.001 | 0.27 (0.12, 0.63) | 0.003 |
| Type 2 Diabetes | |||||
| No | 993 | 1.00 (ref) | 1.00 (ref) | ||
| Yes | 925 | 0.63 (0.52, 0.77) | <0.001 | 0.73 (0.56, 0.93) | 0.01 |
| Hypertension | |||||
| No | 367 | 1.00 (ref) | 1.00 (ref) | ||
| Yes | 1551 | 0.89 (0.70, 1.14) | 0.36 | 0.75 (0.56, 1.02) | 0.07 |
| Hypercolesterolaemia | |||||
| No | 604 | 1.00 (ref) | 1.00 (ref) | ||
| Yes | 1314 | 1.04 (0.84, 1.28) | 0.75 | 1.12 (0.87, 1.44) | 0.39 |
| Family history of premature CHD | |||||
| No | 1537 | 1.00 (ref) | 1.00 (ref) | ||
| Yes | 381 | 0.74 (0.57, 0.95) | 0.02 | 0.72 (0.54, 0.97) | 0.03 |
| Depression | |||||
| No | 1607 | 1.00 (ref) | 1.00 (ref) | ||
| Yes | 311 | 0.72 (0.55, 0.95) | 0.02 | 0.69 (0.50, 0.95) | 0.02 |
| Obesity | |||||
| No | 1054 | 1.00 (ref) | 1.00 (ref) | ||
| Yes | 864 | 0.57 (0.47, 0.70) | <0.001 | 0.84 (0.63, 1.12) | 0.23 |
| SBP (per 5 mmHg) | 1918 | 1.03 (1.01, 1.06) | 0.004 | 1.02 (0.98, 1.05) | 0.34 |
| DBP (per 5 mmHg) | 1918 | 1.04 (1.00, 1.09) | 0.04 | 1.00 (0.94, 1.07) | 0.94 |
| Waist circumference (per 5 cm) | 1918 | 0.82 (0.78, 0.87) | <0.001 | 0.93 (0.88, 1.00) | 0.04 |
| Physical activity (MET-min/d) c,e | |||||
| T1 (low) | 552 | 1.00 (ref) | 1.00 (ref) | ||
| T2 | 642 | 1.62 (1.24, 2.12) | 1.27 (0.94, 1.71) | ||
| T3 (high) | 724 | 2.63 (2.04, 3.40) | <0.001 | 1.60 (0.18, 2.17) | 0.002 |
| Smoking Status | |||||
| Never | 1209 | 1.00 (ref) | 1.00 (ref) | ||
| Former | 251 | 1.04 (0.78, 1.41) | 0.75 | 0.75 (0.51, 1.11) | 0.15 |
| Current | 458 | 1.08 (0.86, 1.36) | 0.51 | 0.82 (0.59, 1.14) | 0.25 |
| Total energy intake (kcal/day) c,f | |||||
| Q1 (low) | 405 | 1.00 (ref) | 1.00 (ref) | ||
| Q2 | 443 | 1.11 (0.82, 1.50) | 1.00 (0.71, 1.40) | ||
| Q3 | 499 | 1.37 (1.03, 1.82) | 1.19 (0.84, 1.65) | ||
| Q4 (high) | 571 | 1.15 (0.87, 1.53) | 0.29 | 1.12 (0.80, 1.56) | 0.39 |
| Alcohol other than wine (g/day) | |||||
| < 10 men, <5 women | 1125 | 1.00 (ref) | 1.00 (ref) | ||
| 10-50 men, 5–10 women | 270 | 1.25 (0.95, 1.65) | 0.12 | 0.87 (0.61, 1.23) | 0.43 |
| > 50 men, >10 women | 523 | 0.95 (0.75, 1.19) | 0.63 | 0.95 (0.72, 1.25) | 0.69 |
| 14-point adherence score a | |||||
| < 11 | 1528 | 1.00 (ref) | 1.00 (ref) | ||
| ≥ 11 | 390 | 2.95 (2.34, 3.71) | <0.001 | 2.63 (2.02, 3.42) | <0.001 |
| Study Design Features | |||||
| Intervention Group | |||||
| MedDiet + Nuts | 809 | 1.00 (ref) | 1.00 (ref) | ||
| MedDiet + EVOO | 1109 | 0.68 (0.56, 0.82) | <0.001 | 0.66 (0.53, 0.83) | <0.001 |
| Total workload of center (person-years) e,g | |||||
| Q1 (low) | 267 | 1.00 (ref) | 1.00 (ref) | ||
| Q2 | 809 | 0.54 (0.39, 0.74) | 0.56 (0.40, 0.80) | ||
| Q3 | 311 | 0.45 (0.30, 0.67) | 0.52 (0.34, 0.80) | ||
| Q4 (high) | 531 | 3.50 (2.55, 4.79) | <0.001 | 3.17 (2.22, 4.52) | <0.001 |
a ORs < 1 imply poorer adherence. ORs > 1 imply better adherence. A validated MedDiet adherence assessment tool was used. 1 point was added for each item in adherence with the traditional MedDiet. High adherence = adherence with ≥11 items on 14-point dietary adherence score. Low adherence = adherence with <11 items. b All models are from logistic regression analysis. Multivariate models are mutually adjusted for all characteristics displayed in this table including total CVD risk score but excluding individual CVD risk factors (type 2 diabetes, hypertension, hypercholesterolaemia, family history of pre-mature CHD, depression, obesity). When an individual CVD risk factors was the exposure of interest, the model was mutually adjusted for other individual CVD risk factors but not total CVD risk score. c P-values for trend were calculated by assigning the median value to each category and treating the resulting variable as continuous. d Risk score calculated by summing the following CVD risk factors: type 2 diabetes, hypertension, high blood cholesterol, family history of premature CHD, depression, obesity. e Tertiles of physical activity (MET-min/d): T1: <108; T2: 108–268; T3: ≥268. f Quartiles of energy intake (kcal/d), by sex: Men: Q1: <2051; Q2: 2051- < 2394; Q3:2934- < 2801; Q4: ≥2801. Women: Q1: <1786; Q2: 1786- < 2109; Q3: 2109- < 2465; Q4: ≥2465. g Measured in quartiles of person years at center. After 4 years: Q1: 893- < 1220; Q2: 1220- < 2175; Q3: 2175- < 2384; Q4: ≥2384
Medium-term adherence (two and three years of follow-up)
Additional file 2: Table S1 shows results for the association between potential predictors and adherence at the alternate time points of two and three years of follow-up. All characteristics that predicted lower adherence at both one and four years in the primary analysis multivariate logistic regression models (type 2 diabetes diagnosis, lower physical activity, lower total energy intake, lower 14-point adherence score, randomization to the MedDiet + EVOO arm, and belonging to a PREDIMED center with a lower workload) also predicted low adherence at both two and three years.
Additional file 2: Table S3 presents results from logistic regression analyses of the association between MedDiet intervention (nuts or EVOO) and dietary adherence to nut and olive oil items on the 14-point dietary adherence score (≥4 tbsp olive oil per day; olive oil as main culinary fat; ≥3 servings of nuts per week). Those in the MedDiet + EVOO intervention arm had significantly higher odds of complying with either of the two olive oil items (5 to 10 times the odds) at both one and four years of follow-up. In contrast, those in the nut intervention group had about 20 times the odds of complying with the nut item.
Discussion
In the PREDIMED trial, baseline characteristics showing the strongest associations with both low short-term and low long-term dietary adherence with a MedDiet intervention included a higher number of cardiovascular risk factors (including specifically type 2 diabetes diagnosis), larger waist circumference, lower levels of physical activity, lower baseline dietary adherence, randomization to the MedDiet + EVOO intervention arm and belonging to a PREDIMED center with a lower workload, measured by total person years of follow-up.
Study design
It is not surprising that the total workload (measured in person years) at a PREDIMED center was associated with both short-term and long-term adherence; the workload likely represents the level of experience the research team had with intervention delivery. Similar findings have been observed in hospitals, where quality of care is often related to number of administered procedures [52]. This finding suggests that multicenter interventions should recruit participants to fewer centers with more participants in each, instead of more centers with fewer participants in each, to maximize effectiveness and adherence. Streamlining intervention delivery would have an added benefit of reducing costs. While this would not explain the difference in adherence, this would free up resources for increased support for participants at risk of poor or suboptimal adherence.
Participants randomized to the MedDiet + EVOO (compared to tree nuts) had lower dietary adherence. This is probably because olive oil is a staple ingredient in the Spanish diet; participants consume olive oil regardless of supplementation from PREDIMED. Nut consumption is not as commonplace. As a result, it is easier for the nut group to adhere to the olive oil criteria compared to the olive oil group’s ability to adhere to the nut criteria. Additional file 2: Table S3 shows that intervention group is a much stronger predictor of complying with the nut adherence item compared to the olive oil adherence items. This suggests that, for dietary interventions providing participants with complementary food items, it may be most effective to provide them with foods that are less commonplace.
Baseline health and lifestyle characteristics
In the present study, many predictors of low adherence with the MedDiet are indicators of poorer baseline health, including various cardiovascular risk factors, less physical activity, and poorer baseline diet. These results are consistent with previous findings investigating predictors of adherence with dietary interventions for reducing fat [29] and carbohydrates [28], family-level interventions [34], and MedDiet interventions [35, 37]. Baseline health status may indicate how much a person values his or her health, which may moderate one’s motivation to comply with the intervention. Alternatively, some research suggests that individuals may be more willing or motivated to make dietary and lifestyle improvements following a medical diagnosis [53]. These findings do not necessarily contradict this notion, as many of these indicators of baseline health are likely long-standing conditions and/or habits; the time during which one is more motivated to make improvements may have passed. Regardless, unhealthy individuals have a greater need for dietary improvement. Thus, they are often the most important targets of dietary interventions. Personalized, higher-intensity intervention approaches may be needed to achieve optimal adherence among less healthy individuals.
Demographic characteristics
Like this study, most previous studies [35, 37] found that women have lower adherence than men. The only exception was a family intervention study [34]. It is possible that because mothers traditionally plan family meals, they were motivated to set a positive example through intervention adherence [34]. However, in this study population, it is possible that spouses and children influence meal preparation, leading to these disparate findings. Different strategies likely have different levels of effectiveness based on sex [54]. However, in the present study the female sex only predicted lower adherence at one year of follow-up, and not four years.
There have been conflicting findings about the relationship between age and dietary adherence [27, 29, 37]. The age range in the present study was restricted to 55–80 years; hence little age variability likely limited the ability to detect an association.
There was little evidence for an association between educational attainment and intervention adherence. While participants with less than a primary school education had lower long-term adherence than those with university level or higher, this did not hold in several sensitivity analyses. Previous studies have found that higher socioeconomic status predicted better dietary adherence, but findings did not hold for long-term adherence [27, 29] and were limited to low-fat dietary interventions [33]. This suggests that dietary interventions may be able to overcome the socioeconomic disparities that often exist in nutrition [55].
Further discussion
The present study has several strengths. First, the sample size was large and it was conducted in an established, long-term, and successful randomized trial. Second, because all study participants were at high risk for CVD, it was possible to assess adherence among participants who were less healthy compared to the general population. Because they also were likely to have poorer baseline diets, adherence was probably especially challenging for these individuals. Thus, significant predictors of adherence may be even more meaningful in this setting. Third, this is one of the few studies that has been able to assess long-term dietary adherence. This is critical, as long-term, high-quality dietary pattern is the relevant dietary exposure for the prevention of chronic disease. Fourth, mutually adjusting for a wide array of baseline characteristics minimized residual confounding. Lastly, significant measurement error is unlikely because only 0.3 % of covariate values were missing, a validated measure for assessing dietary adherence was used [46], and previous analyses show that self-reported dietary intake is highly correlated with biomarkers in this population [18, 23].
It is important to note that because the high adherence is not rare, the ORs do not approximate risk ratios (RRs) and thus should not be incorrectly interpreted as RRs. However, provided appropriate interpretation, ORs still provide valid estimates, and it is more appropriate to apply OR estimates to all individuals within a population. Furthermore, because an OR incorporates both success and failure symmetrically, it is less arbitrary than a RR and thus a more robust estimate [56].
There are also limitations in this study. The potential for measurement error always exists. To include as many people as possible in the present analyses, missing covariate values were imputed for 0.3 % of values. Recall bias, social desirability bias and differential misreporting are always possible when diet is self-reported. Finally, it is always possible that failure to control for unmeasured confounders may have distorted results for predictors of dietary adherence. However, analyses were adjusted for a wide array of important baseline characteristics, and a strong confounder unrelated to these characteristics is unlikely. This unique population of older Spanish participants at high risk for cardiovascular disease may have low generalizability to the general public at lower risk of CVD.
The relative success of a dietary intervention to induce changes in the overall food pattern has been more frequently ascribed to strategies related to negotiation, goal setting, self monitoring, and skill building [57–59]. Other strategies such as the training of dietitians, length and intensity of intervention, frequency of contacts, multiplicity of channels used for the delivery of the intervention, the initial motivation of participants for adherence, and the provision of appropriate means for feedback should not be forgotten.
It is clear that certain participants have greater difficulty complying with dietary interventions. Our results identify specific baseline characteristics that predict better adherence, which is an instrumental first step for designing personalized intervention delivery strategies. However, further research is needed to also identify barriers to dietary adherence. Identifying both individual and universal barriers will have important implications for exactly how to promote adherence, and allow for an even more targeted and personalized intervention approach.
Conclusion
Investigators should design dietary interventions for maximum dietary adherence. Long-term adherence is especially important. With a growing worldwide interest in interventions promoting the MedDiet, these results suggest the need for an early identification of participants with lower baseline adherence to a healthy diet and poorer health status. Additional efforts to promote adherence might be required among this group. Further research is needed to identify the most effective approach for overcoming the inherent difficulties in achieving optimal adherence, including identifying barriers to dietary change and adherence at an individual level. For multi-centered studies, it may be more effective to streamline intervention delivery by allocating participants to few large centers rather to many small centers; a higher volume of participants per dietitian in these large center will be more effective to obtain adherence. Dietary intervention studies designed to maximize adherence will contribute higher quality public health research and generate more effective and permanent dietary improvements among participants. This will ultimately decrease the burden of diet-related non-communicable diseases.
Abbreviations
CHD, coronary heart disease; CVD, cardiovascular disease; DBP, diastolic blood pressure; EVOO, extra virgin olive oil; FFQ, food frequency questionnaire; MedDiet, Mediterranean-type diet; MET, metabolic equivalent of task; OR, odds ratio; PREDIMED, PREvención con DIeta MEDiterránea; RCTs, randomized controlled trials; RR, risk ratio; SBP, systolic blood pressure; SD, standard deviation
Acknowledgements
N/A-everyone included in author list and funding section.
Funding
This study was funded by the Spanish Ministry of Health (ISCIII), PI1001407, Thematic Network G03/140, RD06/0045, FEDER (Fondo Europeo de Desarrollo Regional), and the Centre Català de la Nutrició de l’Institut d’Estudis Catalans. The Fundación Patrimonio Comunal Olivarero and Hojiblanca SA (Málaga, Spain), California Walnut Commission (Sacramento, CA), Borges SA (Reus, Spain), and Morella Nuts SA (Reus, Spain) donated the olive oil, walnuts, almonds and hazelnuts, respectively, used in the study. CIBEROBN is an initiative of ISCIII, Spain.
Availability of data and materials
If you do not wish to share your data, please state that data will not be shared, and state the reason. Due to PREDIMED confidentiality policies, data will not be shared.
Authors’ contributions
MKD, AG, MAMG designed the research. MKD conducted the research. MKD, AG, MAMG analyzed the data. MKD wrote the paper, with guidance and editing from AG, MAMG, MJ. AST was a primary PREDIMED dietitian. MAMG, DC, JSS, ER, RE, MF, EG-G, FA, ML, FJG, LSM, XP, JB, JVS, EV, SLM, XP, JB, EV were coordinators of subject recruitment. IZ assisted with administrative logistics. MKD, AG, MAMG had full access to all the data and the study and take responsibility for the integrity of the analysis. All authors revised the manuscript. All authors read and approved the final manuscript.
Authors’ information
N/A
Competing interests
The authors declare that they have no competing interests. None of the funding sources played a role in the design, collection, analysis or interpretation of the data or in the decision to submit the manuscript for publication.
Consent for publication
Not Applicable.
Ethics approval and consent to participate
During enrollment, investigators conducted face-to-face interviews with potential participants, during which the purpose and characteristics of the study were explained and informed consent was obtained from willing participants. The International Review Board (IRB) of Hospital Clinic in Barcelona, Spain, approved the study protocol in July 2002. Following this, IRBs of all other centers approved. Participants were randomized to one of three interventions after providing written consent. No harm or unintended effects were reported in any arm [40].
Additional files
Table S1. Odds of high adherence with the MedDiet intervention at two and three years of follow-up. Table S2. Odds of high adherence with the MedDiet intervention using alternate adherence score cut-points. Table S3. Odds of adherence with olive oil and nut consumption after 1 and 4 years of follow-up. Table S4. Odds of high adherence with the MedDiet intervention at one yeara, restricting the analyses to those participants recruited before 2006. Table S5. Adherence at one year of follow-up according to a 14-point dietary adherence score and year of recruitment into PREDIMED. Table S6. Odds of high adherence with the MedDiet intervention at one and four years of follow-upa, with alternate representation of “total workload”. (DOC 615 kb)
Figure S1. Validated 14-item questionnaire of mediterranean diet adherence (DOCX 205 kb)
Consort 2010 Checklist. (DOC 219 kb)
References
- 1.Ng M, Fleming T, Robinson M, et al. Global, regional, and national prevalence of overweight and obesity in children and adults during 1980–2013: a systematic analysis for the global burden of disease study 2013. Lancet. 2014;384(9945):766–81. doi: 10.1016/S0140-6736(14)60460-8. [DOI] [PMC free article] [PubMed] [Google Scholar]
- 2.Popkin BM, Adair LS, Ng SW. Global nutrition transition and the pandemic of obesity in developing countries. Nutr Rev. 2012;70(1):3–21. doi: 10.1111/j.1753-4887.2011.00456.x. [DOI] [PMC free article] [PubMed] [Google Scholar]
- 3.Mitrou PN, Kipnis V, Thiebaut AC, et al. Mediterranean dietary pattern and prediction of all-cause mortality in a US population: results from the NIH-AARP Diet and Health Study. Arch Intern Med. 2007;167(22):2461–8. doi: 10.1001/archinte.167.22.2461. [DOI] [PubMed] [Google Scholar]
- 4.Sofi F, Macchi C, Abbate R, Gensini GF, Casini A. Mediterranean diet and health status: an updated meta-analysis and a proposal for a literature-based adherence score. Public Health Nutr. 2014;17(12):2769–82. doi: 10.1017/S1368980013003169. [DOI] [PMC free article] [PubMed] [Google Scholar]
- 5.van den Brandt PA. The impact of a Mediterranean diet and healthy lifestyle on premature mortality in men and women. Am J Clin Nutr. 2011;94(3):913–20. doi: 10.3945/ajcn.110.008250. [DOI] [PubMed] [Google Scholar]
- 6.Tyrovolas S, Panagiotakos DB. The role of Mediterranean type of diet on the development of cancer and cardiovascular disease, in the elderly: a systematic review. Maturitas. 2010;65(2):122–30. doi: 10.1016/j.maturitas.2009.07.003. [DOI] [PubMed] [Google Scholar]
- 7.Chiva-Blanch G, Badimon L, Estruch R. Latest evidence of the effects of the Mediterranean diet in prevention of cardiovascular disease. Curr Atheroscler Rep. 2014;16(10):446. doi: 10.1007/s11883-014-0446-9. [DOI] [PubMed] [Google Scholar]
- 8.Sleiman D, Al-Badri MR, Azar ST. Effect of mediterranean diet in diabetes control and cardiovascular risk modification: a systematic review. Front Public Health. 2015;3:69. doi: 10.3389/fpubh.2015.00069. [DOI] [PMC free article] [PubMed] [Google Scholar]
- 9.Koloverou E, Esposito K, Giugliano D, Panagiotakos D. The effect of Mediterranean diet on the development of type 2 diabetes mellitus: a meta-analysis of 10 prospective studies and 136,846 participants. Metabolism. 2014;63(7):903–11. doi: 10.1016/j.metabol.2014.04.010. [DOI] [PubMed] [Google Scholar]
- 10.Beunza JJ, Toledo E, Hu FB, et al. Adherence to the Mediterranean diet, long-term weight change, and incident overweight or obesity: the Seguimiento Universidad de Navarra (SUN) cohort. Am J Clin Nutr. 2010;92(6):1484–93. doi: 10.3945/ajcn.2010.29764. [DOI] [PubMed] [Google Scholar]
- 11.Vadivel V, Kunyanga CN, Biesalski HK. Health benefits of nut consumption with special reference to body weight control. Nutrition. 2012;28(11–12):1089–97. doi: 10.1016/j.nut.2012.01.004. [DOI] [PubMed] [Google Scholar]
- 12.Benetou V, Trichopoulou A, Orfanos P, et al. Conformity to traditional Mediterranean diet and cancer incidence: the Greek EPIC cohort. Br J Cancer. 2008;99(1):191–5. doi: 10.1038/sj.bjc.6604418. [DOI] [PMC free article] [PubMed] [Google Scholar]
- 13.Schwingshackl L, Hoffmann G. Adherence to Mediterranean diet and risk of cancer: a systematic review and meta-analysis of observational studies. Int J Cancer. 2014;135(8):1884–97. doi: 10.1002/ijc.28824. [DOI] [PubMed] [Google Scholar]
- 14.Esposito K, Giugliano D. Mediterranean diet and type 2 diabetes. Diabetes Metab Res Rev. 2014;30(Suppl 1):34–40. doi: 10.1002/dmrr.2516. [DOI] [PubMed] [Google Scholar]
- 15.Esposito K, Kastorini CM, Panagiotakos DB, Giugliano D. Mediterranean diet and weight loss: meta-analysis of randomized controlled trials. Metab Syndr Relat Disord. 2011;9(1):1–12. doi: 10.1089/met.2010.0031. [DOI] [PubMed] [Google Scholar]
- 16.Martinez-Gonzalez MA, de la Fuente-Arrillaga C, Nunez-Cordoba JM, et al. Adherence to Mediterranean diet and risk of developing diabetes: prospective cohort study. BMJ. 2008;336(7657):1348–51. doi: 10.1136/bmj.39561.501007.BE. [DOI] [PMC free article] [PubMed] [Google Scholar]
- 17.Di Daniele N, Petramala L, Di Renzo L, et al. Body composition changes and cardiometabolic benefits of a balanced Italian Mediterranean Diet in obese patients with metabolic syndrome. Acta Diabetol. 2013;50(3):409–16. doi: 10.1007/s00592-012-0445-7. [DOI] [PubMed] [Google Scholar]
- 18.Estruch R, Martinez-Gonzalez MA, Corella D, et al. Effects of a Mediterranean-style diet on cardiovascular risk factors: a randomized trial. Ann Intern Med. 2006;145(1):1–11. doi: 10.7326/0003-4819-145-1-200607040-00004. [DOI] [PubMed] [Google Scholar]
- 19.Martinez-Gonzalez MA, Guillen-Grima F, De Irala J, et al. The Mediterranean diet is associated with a reduction in premature mortality among middle-aged adults. J Nutr. 2012;142(9):1672–8. doi: 10.3945/jn.112.162891. [DOI] [PubMed] [Google Scholar]
- 20.Dietary Gudielines for Americans: 2015–2020. Eighth Edition. 2015. http://health.gov/dietaryguidelines/2015/guidelines/. Accessed 19 April 2016.
- 21.Inelmen EM, Toffanello ED, Enzi G, et al. Predictors of drop-out in overweight and obese outpatients. Int J Obes (Lond) 2005;29(1):122–8. doi: 10.1038/sj.ijo.0802846. [DOI] [PubMed] [Google Scholar]
- 22.Douketis JD, Macie C, Thabane L, Williamson DF. Systematic review of long-term weight loss studies in obese adults: clinical significance and applicability to clinical practice. Int J Obes (Lond) 2005;29(10):1153–67. doi: 10.1038/sj.ijo.0802982. [DOI] [PubMed] [Google Scholar]
- 23.Zazpe I, Sanchez-Tainta A, Estruch R, et al. A large randomized individual and group intervention conducted by registered dietitians increased adherence to Mediterranean-type diets: the PREDIMED study. J Am Diet Assoc. 2008;108(7):1134–44. doi: 10.1016/j.jada.2008.04.011. [DOI] [PubMed] [Google Scholar]
- 24.Tuomilehto J, Lindstrom J, Eriksson JG, et al. Prevention of type 2 diabetes mellitus by changes in lifestyle among subjects with impaired glucose tolerance. N Engl J Med. 2001;344(18):1343–50. doi: 10.1056/NEJM200105033441801. [DOI] [PubMed] [Google Scholar]
- 25.Howard BV, Van Horn L, Hsia J, et al. Low-fat dietary pattern and risk of cardiovascular disease: the Women's health initiative randomized controlled dietary modification trial. JAMA. 2006;295(6):655–66. doi: 10.1001/jama.295.6.655. [DOI] [PubMed] [Google Scholar]
- 26.Knowler WC, Barrett-Connor E, Fowler SE, et al. Reduction in the incidence of type 2 diabetes with lifestyle intervention or metformin. N Engl J Med. 2002;346(6):393–403. doi: 10.1056/NEJMoa012512. [DOI] [PMC free article] [PubMed] [Google Scholar]
- 27.Tinker LF, Rosal MC, Young AF, et al. Predictors of dietary change and maintenance in the Women's health initiative dietary modification trial. J Am Diet Assoc. 2007;107(7):1155–66. doi: 10.1016/j.jada.2007.04.010. [DOI] [PubMed] [Google Scholar]
- 28.McClain AD, Otten JJ, Hekler EB, Gardner CD. Adherence to a low-fat vs. low-carbohydrate diet differs by insulin resistance status. Diabetes Obes Metab. 2013;15(1):87–90. doi: 10.1111/j.1463-1326.2012.01668.x. [DOI] [PMC free article] [PubMed] [Google Scholar]
- 29.Women's Health Initiative Study G Dietary adherence in the Women's health initiative dietary modification trial. J Am Diet Assoc. 2004;104(4):654–8. doi: 10.1016/j.jada.2004.01.014. [DOI] [PubMed] [Google Scholar]
- 30.Pijls LT, de Vries H, van Eijk JT, Donker AJ. Adherence to protein restriction in patients with type 2 diabetes mellitus: a randomized trial. Eur J Clin Nutr. 2000;54(4):347–52. doi: 10.1038/sj.ejcn.1600961. [DOI] [PubMed] [Google Scholar]
- 31.Steptoe A, Perkins-Porras L, Rink E, Hilton S, Cappuccio FP. Psychological and social predictors of changes in fruit and vegetable consumption over 12 months following behavioral and nutrition education counseling. Health Psychol. 2004;23(6):574–81. doi: 10.1037/0278-6133.23.6.574. [DOI] [PubMed] [Google Scholar]
- 32.Epstein DE, Sherwood A, Smith PJ, et al. Determinants and consequences of adherence to the dietary approaches to stop hypertension diet in African-American and white adults with high blood pressure: results from the ENCORE trial. J Acad Nutr Diet. 2012;112(11):1763–73. doi: 10.1016/j.jand.2012.07.007. [DOI] [PMC free article] [PubMed] [Google Scholar]
- 33.Alhassan S, Kim S, Bersamin A, King AC, Gardner CD. Dietary adherence and weight loss success among overweight women: results from the A TO Z weight loss study. Int J Obes (Lond) 2008;32(6):985–91. doi: 10.1038/ijo.2008.8. [DOI] [PMC free article] [PubMed] [Google Scholar]
- 34.Aggarwal B, Liao M, Allegrante JP, Mosca L. Low social support level is associated with non-adherence to diet at 1 year in the Family Intervention Trial for Heart Health (FIT Heart) J Nutr Educ Behav. 2010;42(6):380–8. doi: 10.1016/j.jneb.2009.08.006. [DOI] [PMC free article] [PubMed] [Google Scholar]
- 35.Zazpe I, Estruch R, Toledo E, et al. Predictors of adherence to a Mediterranean-type diet in the PREDIMED trial. Eur J Nutr. 2010;49(2):91–9. doi: 10.1007/s00394-009-0053-7. [DOI] [PubMed] [Google Scholar]
- 36.Wang JB, Pierce JP, Ayala GX, et al. Baseline depressive symptoms, completion of study assessments, and behavior change in a long-term dietary intervention among breast cancer survivors. Ann Behav Med. 2015;49(6):819–27. doi: 10.1007/s12160-015-9716-1. [DOI] [PMC free article] [PubMed] [Google Scholar]
- 37.Bautista-Castano I, Molina-Cabrillana J, Montoya-Alonso JA, Serra-Majem L. Variables predictive of adherence to diet and physical activity recommendations in the treatment of obesity and overweight, in a group of Spanish subjects. Int J Obes Relat Metab Disord. 2004;28(5):697–705. doi: 10.1038/sj.ijo.0802602. [DOI] [PubMed] [Google Scholar]
- 38.Martinez-Gonzalez MA, Salas-Salvado J, Estruch R, et al. Benefits of the mediterranean diet: insights from the PREDIMED study. Prog Cardiovasc Dis. 2015;58(1):50–60. doi: 10.1016/j.pcad.2015.04.003. [DOI] [PubMed] [Google Scholar]
- 39.Parekh N, Zizza C. Life course epidemiology in nutrition and chronic disease research: a timely discussion. Adv Nutr. 2013;4(5):551–3. doi: 10.3945/an.113.004275. [DOI] [PMC free article] [PubMed] [Google Scholar]
- 40.Willett WC, Koplan JP, Nugent R, Dusenbury C, Puska P, Gaziano TA, et al. Prevention of chronic disease by means of diet and lifestyle changes. In: Jamison DT, Breman JG, Measham AR, et al., editors. Disease control priorities in developing countries. 2. Washington DC: World Bank; 2006. [Google Scholar]
- 41.Estruch R, Ros E, Salas-Salvado J, et al. Primary prevention of cardiovascular disease with a Mediterranean diet. N Engl J Med. 2013;368(14):1279–90. doi: 10.1056/NEJMoa1200303. [DOI] [PubMed] [Google Scholar]
- 42.Martinez-Gonzalez MA, Corella D, Salas-Salvado J, et al. Cohort profile: design and methods of the PREDIMED study. Int J Epidemiol. 2012;41(2):377–85. doi: 10.1093/ije/dyq250. [DOI] [PubMed] [Google Scholar]
- 43.Salas-Salvado J, Garcia-Arellano A, Estruch R, et al. Components of the Mediterranean-type food pattern and serum inflammatory markers among patients at high risk for cardiovascular disease. Eur J Clin Nutr. 2008;62(5):651–9. doi: 10.1038/sj.ejcn.1602762. [DOI] [PubMed] [Google Scholar]
- 44.World Medical Association General A World medical association declaration of Helsinki: ethical principles for medical research involving human subjects. J Int Bioethique. 2004;15(1):124–9. doi: 10.3917/jib.151.0124. [DOI] [PubMed] [Google Scholar]
- 45.Martinez-Gonzalez MA, Garcia-Arellano A, Toledo E, et al. A 14-item Mediterranean diet assessment tool and obesity indexes among high-risk subjects: the PREDIMED trial. PLoS One. 2012;7(8) doi: 10.1371/journal.pone.0043134. [DOI] [PMC free article] [PubMed] [Google Scholar]
- 46.Schroder H, Fito M, Estruch R, et al. A short screener is valid for assessing Mediterranean diet adherence among older Spanish men and women. J Nutr. 2011;141(6):1140–5. doi: 10.3945/jn.110.135566. [DOI] [PubMed] [Google Scholar]
- 47.Fernandez-Ballart JD, Pinol JL, Zazpe I, et al. Relative validity of a semi-quantitative food-frequency questionnaire in an elderly Mediterranean population of Spain. Br J Nutr. 2010;103(12):1808–16. doi: 10.1017/S0007114509993837. [DOI] [PubMed] [Google Scholar]
- 48.Willett WC. Nutritional epidemiology. 3. New York: Oxford University Press; 2013. [Google Scholar]
- 49.Elosua R, Marrugat J, Molina L, Pons S, Pujol E. Validation of the Minnesota leisure time physical activity questionnaire in spanish men. The MARATHOM investigators. Am J Epidemiol. 1994;139(12):1197–209. doi: 10.1093/oxfordjournals.aje.a116966. [DOI] [PubMed] [Google Scholar]
- 50.Elosua R, Garcia M, Aguilar A, Molina L, Covas MI, Marrugat J. Validation of the Minnesota leisure time physical activity questionnaire in spanish women. Investigators of the MARATDON group. Med Sci Sports Exerc. 2000;32(8):1431–7. doi: 10.1097/00005768-200008000-00011. [DOI] [PubMed] [Google Scholar]
- 51.Artigao LM, Llavador JJ, Puras A, et al. Evaluation and validation of Omron Hem 705 CP and Hem 706/711 monitors for self-measurement of blood pressure. Aten Primaria. 2000;25(2):96–102. doi: 10.1016/S0212-6567(00)78470-8. [DOI] [PMC free article] [PubMed] [Google Scholar]
- 52.Canto JG, Every NR, Magid DJ, et al. The volume of primary angioplasty procedures and survival after acute myocardial infarction. National Registry of Myocardial Infarction 2 Investigators. N Engl J Med. 2000;342(21):1573–80. doi: 10.1056/NEJM200005253422106. [DOI] [PubMed] [Google Scholar]
- 53.Lawson PJ, Flocke SA. Teachable moments for health behavior change: a concept analysis. Patient Educ Couns. 2009;76(1):25–30. doi: 10.1016/j.pec.2008.11.002. [DOI] [PMC free article] [PubMed] [Google Scholar]
- 54.De Bourdeaudhuig I, va Oost P. Family members' influence on decision making about food: differences in perception and relationship with healthy eating. Am J Health Promot. 1998;13(2):73–81. doi: 10.4278/0890-1171-13.2.73. [DOI] [PubMed] [Google Scholar]
- 55.Drewnowski A, Darmon N. The economics of obesity: dietary energy density and energy cost. Am J Clin Nutr. 2005;82(1 Suppl):265S–73. doi: 10.1093/ajcn/82.1.265S. [DOI] [PubMed] [Google Scholar]
- 56.Cook TD. Advanced statistics: Up with odds ratios! a case for odds ratios when outcomes are common. Acad Emerg Med. 2002;9:1430–4. doi: 10.1111/j.1553-2712.2002.tb01616.x. [DOI] [PubMed] [Google Scholar]
- 57.Papadaki A, Wood L, Sebire SJ, Jago R. Adherence to the Mediterranean diet among employees in South West England: Formative research to inform a web-based, work-place nutrition intervention. Prev Med Rep. 2015;29(2):223–8. doi: 10.1016/j.pmedr.2015.03.009. [DOI] [PMC free article] [PubMed] [Google Scholar]
- 58.Bravata DM, Sanders L, Huang J, et al. Efficacy and safety of low-carbohydrate diets: a systematic review. JAMA. 2003;289:1837–50. doi: 10.1001/jama.289.14.1837. [DOI] [PubMed] [Google Scholar]
- 59.McCahon D, Daley AJ, Jones J, Haslop R, Shajpal A, Taylor A, Wilson S, Dowswell G. Enhancing adherence in trials promoting change in diet and physical activity in individuals with a diagnosis of colorectal adenoma; a systematic review of behavioural intervention approaches. BMC Cancer. 2015;7(15):505. doi: 10.1186/s12885-015-1502-8. [DOI] [PMC free article] [PubMed] [Google Scholar]
Associated Data
This section collects any data citations, data availability statements, or supplementary materials included in this article.
Data Availability Statement
If you do not wish to share your data, please state that data will not be shared, and state the reason. Due to PREDIMED confidentiality policies, data will not be shared.