

Abstract
Background. Positive associations have been noted between temperature and diarrhea incidence, but considerable uncertainty surrounds quantitative estimates of this relationship because of pathogen-specific factors and a scarcity of data on the influence of meteorological factors on the risk of disease. Quantifying these relationships is important for disease prevention and climate change adaptation.
Methods. To address these issues, we performed a systematic literature review of studies in which at least 1 full year of data on the monthly incidence of diarrheagenic Escherichia coli were reported. We characterized seasonal patterns of disease incidence from 28 studies. In addition, using monthly time- and location-specific weather data for 18 studies, we performed univariate Poisson models on individual studies and a meta-analysis, using a generalized estimating equation, on the entire data set.
Results. We found an 8% increase in the incidence of diarrheagenic E. coli (95% confidence interval, 5%–11%; P < .0001) for each 1°C increase in mean monthly temperature. We found a modest positive association between 1-month-lagged mean rainfall and incidence of diarrheagenic E. coli, which was not statistically significant when we controlled for temperature.
Conclusions. These results suggest that increases in ambient temperature correspond to an elevated incidence of diarrheagenic E. coli and underscore the need to redouble efforts to prevent the transmission of these pathogens in the face of increasing global temperatures.
Keywords: Escherichia coli, seasonality, diarrhea, climate change
Although Escherichia coli are part of the normal human intestinal flora, 6 pathotypes cause diarrheal disease [1], and these diarrheagenic E. coli are the most common cause of bacterial diarrhea in children worldwide [2]. Together, pathogenic E. coli and Shigella species are responsible for an estimated 583 500 deaths [3] and 44 million disability-adjusted life years per year [4] globally. The recently published Global Enteric Multicenter Study identified Shiga toxin–producing enterotoxigenic E. coli (ETEC) as one of the leading causes of moderate-to-severe diarrhea in 7 locations in Africa and Asia [2].
Diarrheagenic E. coli infection manifests as watery or bloody diarrhea accompanied by mild-to-severe dehydration [1]. The bacteria are transmitted predominantly through fecal-oral contact via contaminated food and water [1]. Risk factors for E. coli–associated diarrhea include lack of infrastructure, lack of access to clean water, crowding, malnutrition, and low standards of hygiene and food handling [5, 6]. As such, climatic conditions that determine ambient temperature and precipitation patterns can influence E. coli transmission.
Understanding the relationship between climate and enteric diseases is critical because even relatively small proportional increases in the risk of diarrhea can represent a substantial overall climatic influence, given the high baseline burden of diarrheal diseases. The Intergovernmental Panel on Climate Change (IPCC) predicts that global surface temperature change for the end of the 21st century is likely to exceed 1.5°C relative to the period 1850–1900 [7]. Increases in local temperature have been linked to an increase in diarrhea incidence by a number of researchers, and even the most conservative estimates indicate a substantial influence of climate change on the incidence of diarrhea. However, there is considerable uncertainty surrounding these projections, primarily because of the scarcity of empirical data on the impact of climate on health [8]. There is even less certainty about the impact of expected alterations to the hydrologic cycle expected to result from global climate change. While heavy-rainfall events have been associated with outbreaks of diarrhea [9, 10], the impact of rainfall and flooding on diarrhea incidence is complex and depends on both biophysical and social factors [9, 11].
One of the primary sources of uncertainty of the impact of climate on diarrhea is likely the differential responses of different etiologic agents of diarrhea. Diarrheal diseases are caused by many different pathogens, each of which may exhibit different responses to environmental conditions. Traditional teaching holds that bacterial gastroenteritis occurs predominantly in the summer, whereas viral gastroenteritis occurs in the winter [12]. When E. coli was first linked to diarrheal disease, in 1945, Bray noted the significance of his finding as a cause of “summer diarrhea” [13]. However, to our knowledge the relationship between specific weather-related exposure variables and diarrheagenic E. coli has not been quantified to date.
We performed a systematic review and meta-analysis of the relationship between monthly incidence of E. coli–associated diarrhea and temperature and precipitation for specific locations and periods. Quantification of these relationships can provide rich detail to inform modeling efforts aimed at predicting the health responses to climatic shifts.
METHODS
Search Strategy and Selection Criteria
Studies were identified through a National Library of Medicine (PubMed) search on 23 March 2012, using the search terms shown in Figure 1. We excluded studies with “outbreak” or “travelers” in the title to restrict our search to studies presenting data on endemic disease. We selected studies published beginning in 1975, and we did not set any language restrictions on the search. To supplement the search strategy, reference lists from all included studies, as well as key review articles on E. coli epidemiology, were scanned for identification of relevant papers [14–18].
Figure 1.

Study selection process. aOther sources include key review articles on Escherichia coli epidemiology and reference lists of studies identified through the database search; bStudies that were based on in vitro research, case studies, or review articles; cStudies over a large or heterogeneous geographic area to which a single set of climate data could not reasonably apply; dStudies presented monthly incidence data on only a nonrandom subset of all samples collected; eStudies included travelers or military personnel stationed in an area.
Two researchers independently screened each title and abstract from the database search for relevance to this analysis. A study was included if (1) it was conducted continuously for ≥1 year, (2) it reported at least 25 confirmed cases of E. coli–associated diarrhea over the study period, (3) it reported monthly data on the number of patients with diarrhea caused by E. coli, (4) it was confined to a geographic area for which one set of climatologic data applied (ie, studies involving an entire country or large state/province were excluded), and (5) it used a surveillance study design. The results of case-control studies were included only if the authors reported monthly E. coli incidence for cases separately from controls. Studies on all diarrheagenic E. coli pathotypes were eligible for inclusion, but data on asymptomatic infections were not included.
All E. coli–associated diarrheal incidence data reported in the published papers were taken directly from tables or extracted from graphs, using Plot Digitizer software [19]. If only average data over several years were presented in the published paper, study authors were contacted to request original data; investigators in 2 studies [20, 21] responded and provided additional data.
Outcome Data
To ensure comparability of monthly E. coli figures across studies, several data-processing steps were completed. The monthly incidence (total number of new cases during each month) of E. coli–associated diarrhea was used, to avoid confounding results by changes in the monthly proportion of other pathogens to the total, in particular because the incidence of viral gastroenteritis tends to peak in winter months [22–25]. When studies reported a monthly rate of E. coli–associated diarrhea (eg, cases per 1000 patients per month), these rates were converted to monthly incidence by using the total number of E. coli–associated diarrhea cases reported for the study. When studies reported distinct monthly incidence for ≥2 pathotypes of E. coli, we summed the pathotypes. Individual data sets from a single publication were aggregated only if data sets for each pathotype included <25 cases. Redundant data sets (ie, multiple publications using the same data) were included only once.
Independent Variables
Our primary independent variables of interest were year-specific monthly temperature and precipitation level for each study location, corresponding to the months of collection of outcome data. Temperature data for each city were taken from the Hadley Centre CRUTEM4 data set, when available [26]; the Global Historical Climatology Network-Monthly (GHCN-M), version 3 (adjusted temperature), was used otherwise [27]. Monthly precipitation data for each city was taken from GHCN-M, version 2 [28]. Studies were only included only in the analyses of average and peak seasonality and not in the statistical models, if they did not have monthly temperature and/or rainfall data at the city level or if they included monthly case counts averaged over multiple years.
In addition, for each study location, we assembled data on covariates, including latitude, altitude, average monthly temperature, and average monthly precipitation level or number of days of rain per year, using data from Weatherbase [29] and World Health Organization mortality strata [30].
Seasonality Analysis
To compare overall seasonality of E. coli–associated diarrhea across study locations, we plotted E. coli incidence by month (averaged over all years) for each location. We also examined the peak month with the highest case load per study, as well as the season strength, as measured by the peak-to-mean ratio of monthly number of E. coli–associated diarrhea cases divided by the average number of cases for all months in a given study.
Statistical Modeling
We examined the relationship between climatic variables and E. coli–associated diarrhea incidence for each location to assess heterogeneity between studies. Generalized log-linear Poisson regression models were performed for each study location in the R Statistical Programming Language [31], with monthly E. coli–associated diarrhea case counts as a function of monthly mean temperature and monthly mean precipitation level. A Newey–West regression approach was used to account for serial correlation of monthly data points within studies [32]. Forest plots were constructed using the metan function in Stata, version 10.1 (College Station, Texas).
We pooled all studies together to obtain an overall association between monthly E. coli–associated diarrhea cases and mean monthly temperature and rainfall, using a generalized estimating equation (GEE) model [33] with a Poisson distribution and an autoregressive correlation structure, clustering by study. We used the R geeglm function in the geepack library, accounting for temporal gaps in the weather predictor data with the waves argument [34]. In all models, we included WHO mortality stratum as a binary variable (developed country vs high-mortality or low-mortality developing country) to control for level of development in the country where the study was conducted. We evaluated temperature and precipitation level in a combined multivariate model and also independently, because there were several studies with temperature but not rainfall data available. We evaluated 0- and 1-month lags for both temperature and rainfall data. We used corrected quasi-information criterion (QICC) values to select a final model involving data from papers with both rainfall and temperature data, using the MESS library for R [35, 36].
To examine the potential impact on the burden of diarrheal disease attributable to pathogenic E. coli as a result of predicted future climatic change, we performed a subanalysis focused on ETEC in Bangladesh because of the large concentration of available data (5 studies). We calculated Bangladesh-specific incident rate ratios (IRRs) from this subset of studies, using the same GEE models, to estimate the total number of additional cases of ETEC-associated diarrhea due to projected temperature increases of 1°C–4°C, in increments of 1°C. This range was based on the IPCC Fifth Assessment report [37] of regional area temperature change averages of Coupled Model Intercomparison Project Phase 5 (CMIP5) ensemble models for South Asia over 3 projection periods for the Representative Concentration Pathways (RCP) 4.5 scenario. We calculated baseline ETEC-associated diarrhea incidence in Bangladesh on the basis of 2010 ETEC-associated diarrhea prevalence and duration of disease estimates provided by the Institute for Health Metrics and Evaluation [3, 38]. Details on these calculations and a comparison with other approaches for estimating baseline ETEC incidence are available in the Supplementary Materials. We multiplied the baseline number of cases by the exponentiated Bangladesh-specific model coefficient, raised to the power of the different temperature increments. The difference between this result and the baseline number of cases provided a rough estimate of potential additional cases associated with changes in temperature.
RESULTS
Systematic Review
A total of 28 studies with 29 data sets were included in the final review (Figure 1 and Table 1). Included studies occurred between 1974 and 2010 in 15 countries across temperate (n = 13) and tropical (n = 15) latitudes, with the tropics defined as between 23°27′ north and south of the equator. While some study populations were limited to children, others included all ages. ETEC was the most commonly represented pathotype (n = 15); however, studies on enteropathogenic E. coli (EPEC), enteroaggregative E. coli (EAEC), and verotoxin-producing E. coli (VTEC), as well as combinations of these pathotypes, were also included. The overall percentage error from digitizing graphs and processing data to obtain E. coli–associated diarrhea incidence was 2.2%, calculated on the basis of the total number of E. coli–associated diarrhea cases in our data set.
Table 1.
Characteristics of Studies Included in the Systematic Review of Climatic Drivers of Diarrheagenic Escherichia coli Incidence
| Reference | E. coli Pathotype(s) | Location | Latitude | Altitude, m | Yearly Rainfall, mm, Mean | Yearly Temperature, °C, Mean | Study Period | Study Duration, mo | E. coli Cases, No. | Subject Age/Descriptor | Study Setting | Urban/Rural Setting | WHO Mortality Stratum | Temperaturea | Rainfalla | Peak Seasonb |
|---|---|---|---|---|---|---|---|---|---|---|---|---|---|---|---|---|
| Pai et al [39] | VTEC | Calgary, Canada | 51°N | 1083 | 420 | 4.1 | Jul 1984–Jun 1986 | 24 | 166 | All | Hospital based | Urban | Developed | +c | +c | Summer |
| Gurwith and Williams [40] | EPEC | Winnipeg, Canada | 50°N | 238 | 510 | 2 | Dec 1973–Nov 1975 | 24 | 120 | <16 y | Hospital based | Urban | Developed | NA | NA | Summer, fall |
| Klein et al [41] | STEC | Seattle, WA, USA | 47°N | 37 | 860 | 11 | Nov 1998–Oct 2001 | 36 | 39 | Children | Hospital based and private practice | Urban | Developed | +c | − | Summer, fall |
| Cohen et al [42] | EAEC | Cincinnati, OH, USA | 39°N | 195 | 987 | 13.6 | Mar 1999–Feb 2000 | 12 | 88 | Children | Hospital based | Urban | Developed | +c | − | NA |
| Kim et al [43] | ETEC | Seoul, South Korea | 37°N | 86 | 135 d | 12 | Feb 1984–Mar 1985 | 14 | 52 | <15 y | Hospital based and outpatient | Urban | LMD | − | − | Cool, dry |
| Samonis et al [44] | EPEC | Heraklion, Greece | 35°N | 39 | 483 | 18.7 | Jan 1992–Apr 1994 | 28 | 102 | <2 y | Hospital based | 30% urban; 60% rural |
Developed | + | + | NA |
| Santosham et al [45] | ETEC | Whiteriver, AZ, USA | 33°N | 1588 | 458 | 12.7 | Jan 1982–Dec 1984 | 36 | 28 | <3 y | Community | Rural | Developed | +c | NA | Warm |
| Rao et al [46] | ETEC | Abu Homos, Egypt | 31°N | 5 | 44 d | 20 | Mar 1995–Feb 1998 | 36 | 933 | <3 y | Community | Rural | LMD | NA | NA | Warm |
| Wierzba et al [47] | ETEC | Abu Homos | 31°N | 5 | 44 d | 20 | May 2000–May 2002 | 25 | 148 | <5 y | Clinic based | Rural | LMD | NA | NA | Warm |
| Wierzba et al [47] | ETEC | Benha, Egypt | 31°N | 15 | 20 | 21 | May 2000–May 2002 | 25 | 111 | <5 y | Clinic-based | Peri-urban | LMD | NA | NA | Warm |
| Alam et al [48] | EPEC | Karachi, Pakistan | 25°N | 21 | 210 | 26 | Jan 1997–Dec 2001 | 60 | 662 | All | Hospital based | Urban | HMD | NA | NA | Summer |
| Khan et al [49] | ETEC | Dhaka, Bangladesh | 23°Nd | 9 | 1970 | 26 | Jan 1983–Dec 1984 | 24 | 472 | All | Hospital based | Urban | HMD | NA | NA | Spring, autumn |
| Qadri et al [50] | ETEC | Dhaka | 23°Nd | 9 | 1970 | 26 | Apr 2002–Oct 2004 | 31 | 242 | <2 y | Community | Urban | HMD | NA | NA | Spring |
| Baqui et al [51] | ETEC | Matlab, Bangladesh | 23°Nd | 10 | 2350 | 25 | May 1983–Apr 1984 | 12 | 369 | All | Diarrheal treatment center | Rural | HMD | +c | − | Hot, dry |
| Black et al [52] | ETEC | Matlab | 23°Nd | 10 | 2350 | 25 | Apr 1978–Mar 1979 | 12 | 280 | <5 y | Community | Rural | HMD | + | NA | Hot |
| Black et al [53] | ETEC | Matlab | 23°Nd | 10 | 2350 | 25 | Feb 1977–Jan 1979 | 24 | 4184 | All | Clinic based | Rural | HMD | +c | +c | Hot, dry |
| Chowdhury et al [54] | ETEC | Dhaka | 23°Nd | 9 | 1970 | 26 | Mar 2008–Feb 2010 | 24 | 1248 | All | Hospital based | Urban | HMD | NA | NA | NA |
| Qadri et al [55] | ETEC | Dhaka | 23°Nd | 9 | 1970 | 26 | Sep 1996–Aug 1998 | 24 | 662 | All | Hospital based | Urban | HMD | +a | +a | Hot |
| Stoll et al [56] | ETEC | Dakha | 23°Nd | 9 | 1970 | 26 | Dec 1979–Nov 1980 | 12 | 624 | All | Hospital based | Urban | HMD | +c | +c | Hot, dry |
| Samal et al [57] | All | Bhubaneswar, India | 20°Nd | 44 | 1554 | 27 | Jan 2004–Dec 2006 | 36 | 669 | All | Hospital based | Urban | HMD | NA | NA | NA |
| Estrada-Garcia et al [58] | EPEC, ETEC | Mexico City, Mexico | 19°Nd | 2239 | 682 | 15 | Jan 1998–Dec 1998 | 12 | 25 | <3 y | Community | Peri-urban | LMD | + | NA | Rainy |
| Cisse et al [59] | EPEC | Dakar, Senegal | 14°Nd | 24 | 41 d | 24 | Feb 1983–May 1988 | 64 | 92 | <15 y | Hospital based | Urban | HMD | NA | NA | Cool, dry |
| Mutanda [60] | EPEC | Nairobi, Kenya | 1°Sd | 1623 | 750 | 19 | May 1975–Apr 1976 | 12 | 28 | Children | Hospital based | Urban | HMD | − | − | NA |
| Guerrant et al [61] | ETEC | Pacatuba, Brazil | 4°Sd | 24 | 1460 | 27 | May 1978–Oct 1980 | 30 | 33 | <5 y | Community | Poor urban and rural | LMD | NA | NA | Warm, rainy |
| Cassel-Beraud et al [62] | EPEC, ETEC | Antananarivo, Madagascar | 18°Sd | 1275 | 1360 | 18 | Nov 1988–Oct 1989 | 12 | 133 | <14 y | Hospital based | Urban | HMD | +c | +c | Warm and rainy |
| Gatti et al [63] | ETEC | Campinas, Brazil | 23°Sd | 660 | 130 d | 22 | Oct 1985–Sep 1986 | 12 | 27 | <2 y | Community | Urban | LMD | −c | −c | NA |
| Robins-Browne et al [64] | EPEC | Johannesburg, South Africa | 26°S | 1699 | 720 | 16 | Oct 1974–Sep 1975 | 12 | 55 | <2 y | Hospital based | Urban | HMD | +c | NA | Hot |
| Househam et al [65] | EPEC | Cape Town, South Africa | 34°S | 42 | 112 d | 17 | Apr 1981–Mar 1982 | 12 | 470 | <1 y | Hospital based | Urban | HMD | +c | NA | Warm, dry |
| Sinclair et al [66] | All | Melbourne, Australia | 37°S | 131 | 560 | 14 | Sep 1997–Feb 1999 | 18 | 53 | All | Community | Urban | Developed | +c | −c | NA |
Abbreviations: EPEC, enteropathogenic E. coli; ETEC, enterotoxigenic E. coli; HMD, high-mortality developing country; LMD, low-mortality developing country; NA, not available; VTEC, verotoxin-producing E. coli.
a Data denote the sign of the coefficient from generalized linear models performed to determine the relationship between monthly incidence of E. coli and monthly temperature or monthly rainfall in studies for which these data were available.
b Data denote the peak season of cases and reflect the authors’ terminology.
c Statistically significant (P < .05).
d Tropical latitude.
Seasonality
The distribution of cases by month for each study is shown in Supplementary Figure 1. The temperate latitudes demonstrated stronger season strength than the tropics, with average ratios of peak to mean levels of 2.7 in the temperate northern hemisphere and 3.6 in the temperate southern hemisphere, compared with 2.4 in the tropics; the difference in these ratios between temperate and tropical climates was not significant (P = .216). In the temperate latitudes, cases in the majority of studies (69%) peaked in the summer months (June–August in the northern hemisphere and December–February in the southern hemisphere); cases in none of the studies peaked in the winter months (December–February in the northern hemisphere and June–August in the southern hemisphere; Table 2).
Table 2.
Summary of Seasonal Peaks of Escherichia coli–Associated Diarrhea Cases Reported by Studies, by Geographic Location
| Location | Peak Month, Studies, No. (%)a |
Ratio of Peak to Mean Values, Meanb |
|||
|---|---|---|---|---|---|
| Dec–Feb | Mar–May | Jun–Aug | Sep–Nov | ||
| Northern hemisphere (>23°N) | 0 (0) | 1 (8) | 9 (69) | 3 (23) | 2.73 |
| Southern hemisphere (>23°S) | 2 (67) | 1 (33) | 0 (0) | 0 (0) | 3.56 |
| Tropics (23°N–23°S) | 1 (6) | 10 (63) | 5 (31) | 0 (0) | 2.42 |
a Peak month reflects the single calendar month averaged over all years of the study with the highest E. coli–associated diarrhea case load.
b Calculated as the mean number of cases in the month with the most cases, divided by the mean number of cases per month over the course of the entire study. The ratio reported here reflects the ratio of peak to mean values by geographic location.
Association With Climate Variables
The majority of studies showed a positive association between the incidence of diarrheagenic E. coli infection and temperature (Figure 2). Of the 18 studies for which monthly temperature data were available, a positive association was observed in 15 (83%); this relationship was statistically significant for 8 (44%; P < .05). Only 3 studies showed a negative correlation (17%), and this relationship was only statistically significant for 1 study (6%). Results of the analysis of association between mean monthly rainfall and E. coli–associated diarrhea cases were more varied, and the effect sizes were much smaller. Of 13 studies with monthly rainfall data, a positive association was observed in 6 (46%); this relationship was statistically significant for only 1 study (8%). Six studies (46%) showed a negative correlation, and this relationship was also statistically significant for only 1 study (8%).
Figure 2.

Forest plots show incidence rate ratios (IRR) and 95% confidence intervals, calculated with generalized log-linear Poisson regression models and using Newey–West standard errors, for the relationship between E. coli incidence and (A) monthly mean temperature (ºC); (B) monthly rainfall (cm) for each study. Abbreviations: CI, confidence interval; IRR, incidence rate ratio.
Final model results for the pooled GEE analyses of the best-fit models according to QICC values for temperature and rainfall alone and in combination are shown in Table 3; the full set of models evaluated is shown in the Supplementary Materials. Substantial effects were consistently observed for WHO mortality strata across all models. The estimate of the IRR for temperature in the final model that included rainfall (n = 13) was 1.08 (95% confidence interval [CI], 1.05–1.11), and the estimate of the IRR for temperature in the model without rainfall that included the full set of data (n = 18) was 1.10 (95% CI, 1.05–1.20). The best-fit model included precipitation level (1-month lag), although precipitation level was not significantly associated with diarrhea in this model (P = .4270). The IRR for the model with precipitation level alone was 1.02 (95% CI, 1.00–1.03).
Table 3.
Results of Generalized Estimating Equation Models With Poisson Distribution, Controlling for Serial Correlation and Clustering by Study
| Model, Variable | IRR (95% CI)a | P | Studies, No. | Months, No. | QICCb |
|---|---|---|---|---|---|
| All studies | |||||
| Precipitation only, 1-mo lag | |||||
| Precip-lag1 | 1.02 (1.00–1.03) | .0169 | 13 | 229 | −21 588 |
| Developing vs developed | 7.30 (2.20–24.16) | .0011 | … | … | … |
| Temperature only, no lag | |||||
| Temp-lag0 | 1.10 (1.05–1.20) | .0003 | 18 | 301 | −22 922 |
| Developing vs developed | 5.63 (1.24–25.44) | .0248 | … | … | … |
| Temperature (no lag) plus precipitation (1-mo lag)c | |||||
| Temp-lag0 | 1.08 (1.05–1.11) | <.0001 | 13 | 229 | −22 945 |
| Precip-lag1 | 1.01 (.99–1.02) | .4270 | … | … | … |
| Developing vs developed | 3.63 (1.21–10.85) | .0210 | … | … | … |
| Bangladesh studies only | |||||
| Precipitation only, 1-mo lag | |||||
| Precip-lag1 | 1.01 (1.01–1.02) | .0012 | 4 | 56 | −24 013 |
| Temperature only, no lag | |||||
| Temp-lag0 | 1.11 (1.06–1.16) | <.0001 | 5 | 63 | −24 031 |
| Temperature (no lag) plus precipitation (1-mo lag) | |||||
| Temp-lag0 | 1.05 (1.01–1.09) | .0071 | 4 | 60 | −24 108 |
| Precip-lag1 | 1.01 (.99–1.02) | .2999 | … | … | … |
a Incidence rate ratios (IRRs) and 95% confidence intervals (CIs) are shown for a 1°C change in temperature and a 1 cm change in rainfall.
b Corrected quasi-information criterion (QICC) values are shown for each model, based on running all models in a common data set.
c Best-fit model, as evaluated by lowest corrected quasi-information criterion (QICC) value.
Predictive Models
For the Bangladesh subanalysis, the estimates for the IRR for temperature in the final model that included rainfall (n = 4) was 1.05 (95% CI, 1.01–1.09), and the estimate of the IRR for temperature in the model without rainfall that included the full set of data (n = 5) was 1.11 (95% CI, 1.05–1.16). The estimate of the IRR for precipitation level alone (n = 4) was 1.01 (95% CI, 1.01–1.02). Under median estimates of predicted temperate change of 0.8°C in the near future (2016–2035), 1.6°C in the middle century (2046–2065), and 2.1°C at the end of the century (2081–2100), using the final model we estimated potential additional cases of ETEC-associated diarrhea in Bangladesh of 794 076 (95% CI, 239 726–1 649 685), 1 625 073 (95% CI, 483 989–3 422 796), and 2 163 955 (95% CI, 638 995–4 597 742), respectively (Figure 3).
Figure 3.
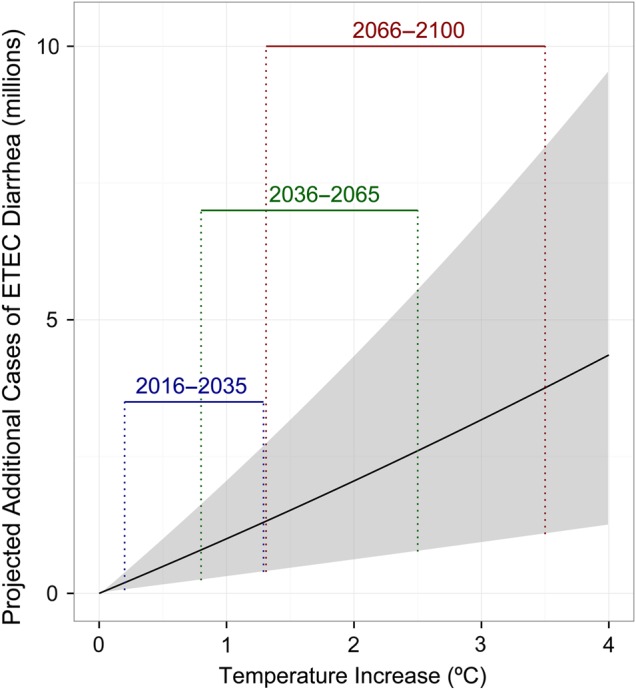
Estimates of potential annual increase in enterotoxigenic E. coli (ETEC) diarrhea cases in Bangladesh under future climate scenarios. Derived by applying pooled analysis risk estimates for the association between temperature and ETEC diarrhea in Bangladesh to Intergovernmental Panel on Climate Change (IPCC) projections for temperature increases in South Asia of 0.8°C in the near term (2016–2035), 1.6°C in the middle century (2046–2065), and 2.1°C at the end of the century (2081–2100).
DISCUSSION
The results of this review show that diarrheagenic E. coli incidence demonstrates distinct seasonality, with the highest incidence in warmer months, dampened incidence in cooler months, and modest increases in months of high average rainfall.
Through analyses of seasonality (Table 2), models of individual studies (Figure 2), and a pooled model of all of the studies (Table 3) in our data set, we find that cases of pathogenic E. coli peak at warmer times of the year. Our best-fit pooled model suggests that, on average, across all studies and all E. coli pathotypes analyzed and controlling for country development status and 1-month lagged rainfall, a 1°C increase in mean temperature is associated with an increase in the incidence of diarrheagenic E. coli of 8% (95% CI, 5%–11%). This relationship is stronger when using the full data set available for temperature, without controlling for precipitation (10%; 95% CI, 5%–20%).
By comparison, in a meta-analysis of published studies of the association between diarrheal diseases and temperature, Carlton et al [67] reported a 7% (95% CI, 3%–10%) increase in all-cause diarrhea for a 1°C increase in mean temperature, with significant heterogeneity by pathogen taxa. All-cause diarrhea includes cases due to enteric viruses, such as rotavirus and norovirus, that are known to peak during cooler periods [22–24]. Carlton et al's [67] estimate for studies of bacterial diarrhea was similar to all-cause diarrhea, with a value of 7% (95% CI, 4%–10%), but for viral diarrhea it was −4% (95% CI, −18% to 11%). There were insufficient data for a meta-analysis of diarrhea attributable to protozoan pathogens [67]. Less than half of the papers included in the review by Carlton et al [67] controlled for rainfall, and none of the papers focused on pathogenic E. coli.
The positive association between temperature and the incidence of diarrheagenic E. coli could reflect pathogen factors, host factors, environmental factors, or some interaction of these mechanisms. Increased temperatures can increase replication rates and survival of bacteria in the environment and can result in alterations in E. coli gene expression [68]. Research on E. coli O157 has shown both greater transmission at warmer ambient temperatures and decreased survival of bacteria under conditions of temperature fluctuation [69]. Human exposure may be higher during warmer months, and higher temperatures may alter human susceptibility due to host physiology [70]. Increased pathogen loading from animal reservoirs may also occur during warmer months [71].
We found a modest positive association of 2% (95% CI, 0%–3%) between 1-month lagged mean monthly rainfall level and the incidence of diarrheagenic E. coli, although this relationship was not statistically significant when controlling for temperature.
This may reflect a very weak association with rainfall, or it may be a result of the exposure variable, the response variable, or the analysis approach used. Rainfall level is heterogeneous over small spatial scales, so there may be error inherent in the rainfall values for each location. Mean monthly rainfall might also be an inappropriate measure of the relationship between precipitation events and E. coli disease, because extreme precipitation events are likely a more important predictor than average rainfall [10]. Large E. coli outbreaks have been documented after unusually heavy rains [72], and heavy rainfall events likely contribute more to outbreaks than to underlying endemic seasonality. Our model also would not have captured nonlinear effects between rainfall and diarrheal diseases observed by several researchers [9, 73, 74]. A mechanistic, systems-based approach may be necessary to fully untangle these more complex relationships [75].
Previously, Kolstad and Johansson [8] estimated that the incidence of diarrheal disease will increase by up to 22%–29% by 2099, based on various emissions scenarios, and 5 reported estimates of the relative risk of diarrhea for each 1°C increase in temperature of 3%–11%. The authors of that review and others highlight the need for empirical data on diarrhea-climate relationships, which we provide here. We focus our estimates on potential future cases of ETEC-associated diarrhea in Bangladesh, the specific pathogen and country for which we had sufficient data available for such an analysis. This subanalysis is based on several assumptions, such as baseline ETEC prevalence (Supplementary Materials), future projected temperature changes, and choice of best-fit model. Perhaps most importantly, the estimates of future disease depend on persistence of current conditions in the future, such as water, sanitation, and hygiene infrastructure, and development and introduction of vaccines. Still, our estimates suggest almost 800 000 additional cases of ETEC-associated diarrhea in Bangladesh in the near term (2016–2035), when temperatures are expected to increase by 0.8°C, and 2.2 million additional cases by the end of the century, when temperatures are expected to increase by 2.1°C (Figure 3).
These estimates are not meant to represent precise predictions of future cases, given the uncertainty of the estimates related to the reasons mentioned above. Yet the Bangladesh example illustrates how even relatively small percentage increases in disease can have an immense public health impact under new climate scenarios, given the magnitude of diarrheal disease worldwide.
The majority of the studies in our review were performed in developing countries, where diarrheagenic E. coli is more prevalent and water, sanitation, and hygiene infrastructure is less developed. Our estimates of the association may therefore apply more to the developing country context, where bacterial enteric pathogens are more prevalent [3].
Another limitation of this analysis was the scarcity of pathotype-specific monthly incidence data. Each E. coli pathotype varies in disease ecology and epidemiology and likely responds somewhat differently to climatologic perturbations. Even within the ETEC pathotype, Shiga toxin–producing strains and heat-labile enterotoxin–producing strains can exhibit different seasonal trends [76, 77]. Still, this E. coli–specific review provides more insights than previous reviews on all-cause diarrhea.
Our focus on diarrhea as an outcome ignores other potential sequelae of enteric infections, such as stunting, cognitive impairment, and other long-term metabolic consequences that may result from enteric infections, that could even further magnify the impact of increased transmission of pathogenic E. coli under future climatic conditions [78].
Last, our analysis is ecological in nature, and we were only able to adjust for a limited set of potential confounders for which we had data available. Systems-based, mechanistic analysis may be necessary to augment this epidemiological approach, to establish causative explanations of the observed associations [75].
For diarrheal diseases in particular, development status is tightly related to factors related to pathogen transmission, such as sanitation infrastructure, drinking water distribution systems, and safe food-handling practices. Unsurprisingly, in our models, development status, as measured by WHO mortality stratum, was strongly associated with incidence of diarrhea. It is therefore important to control for development status when performing analyses of the impact of climatic drivers on human health.
Our results have implications that can be applied toward the control of diarrheal diseases. Given limited resources, knowledge of how diarrheal pathogens respond to the local climate can help public health officials better target the timing of hygiene education campaigns, pathogen-specific interventions, or water treatment efforts at those times of year when interventions are likely to prevent the most disease. This analysis also suggests that efforts to produce vaccines should increasingly focus on bacteria such as pathogenic E. coli, given the expected increases in these diseases under future temperatures.
Despite the uncertainty associated with our model predictions, assuming a steady state—with no changes to local conditions—the relative risk of increased disease due to elevated temperature that was found in this analysis represents significant human morbidity and mortality and suggests an urgency to redouble efforts to prevent the transmission of these pathogens in the face of increasing global temperatures.
Supplementary Data
Supplementary materials are available at http://jid.oxfordjournals.org. Consisting of data provided by the author to benefit the reader, the posted materials are not copyedited and are the sole responsibility of the author, so questions or comments should be addressed to the author.
Notes
Acknowledgments. We thank Gouthami Rao, who served as a second reviewer for screening studies.
Disclaimer. The content is solely the responsibility of the authors and does not necessarily represent the official views of the National Institutes of Health (NIH).
Financial support. This work was supported by the Fogarty International Center (grant R21TW009032) and the National Institute for Allergy and Infectious Diseases (grant K01AI103544 to K. L.), NIH; and the Emory School of Medicine Discovery Program (to R. P.).
Potential conflicts of interest. All authors: No reported conflicts. All authors have submitted the ICMJE Form for Disclosure of Potential Conflicts of Interest. Conflicts that the editors consider relevant to the content of the manuscript have been disclosed.
References
- 1.Kaper JB, Nataro JP, Mobley HL. Pathogenic Escherichia coli. Nat Rev Microbiol 2004; 2:123–40. [DOI] [PubMed] [Google Scholar]
- 2.Kotloff KL, Nataro JP, Blackwelder WC et al. Burden and aetiology of diarrhoeal disease in infants and young children in developing countries (the Global Enteric Multicenter Study, GEMS): a prospective, case-control study. Lancet 2013; 382:209–22. [DOI] [PubMed] [Google Scholar]
- 3.Lozano R, Naghavi M, Foreman K et al. Global and regional mortality from 235 causes of death for 20 age groups in 1990 and 2010: a systematic analysis for the Global Burden of Disease Study 2010. Lancet 2012; 380:2095–128. [DOI] [PMC free article] [PubMed] [Google Scholar]
- 4.Murray CJ, Vos T, Lozano R et al. Disability-adjusted life years (DALYs) for 291 diseases and injuries in 21 regions, 1990–2010: a systematic analysis for the Global Burden of Disease Study 2010. Lancet 2012; 380:2197–223. [DOI] [PubMed] [Google Scholar]
- 5.Pruss-Ustun A, Bartram J, Clasen T et al. Burden of disease from inadequate water, sanitation and hygiene in low- and middle-income settings: a retrospective analysis of data from 145 countries. Trop Med Int Health 2014; 19:894–905. [DOI] [PMC free article] [PubMed] [Google Scholar]
- 6.Wolf J, Pruss-Ustun A, Cumming O et al. Assessing the impact of drinking water and sanitation on diarrhoeal disease in low- and middle-income settings: systematic review and meta-regression. Trop Med Int Health 2014; 19:928–42. [DOI] [PubMed] [Google Scholar]
- 7.IPCC. Climate change 2013: the physical science basis. Working group I contribution to the Fifth Assessment Report of the Intergovernmental Panel on Climate Change. Summary for policymakers. Switzerland: Intergovernmental Panel on Climate Change, 2013. [Google Scholar]
- 8.Kolstad EW, Johansson KA. Uncertainties associated with quantifying climate change impacts on human health: a case study for diarrhea. Environ Health Perspect 2011; 119:299–305. [DOI] [PMC free article] [PubMed] [Google Scholar]
- 9.Carlton EJ, Eisenberg JN, Goldstick J, Cevallos W, Trostle J, Levy K. Heavy Rainfall Events and Diarrhea Incidence: The Role of Social and Environmental Factors. Am J Epidemiol 2014; 179:344–52. [DOI] [PMC free article] [PubMed] [Google Scholar]
- 10.Curriero FC, Patz JA, Rose JB, Lele S. The association between extreme precipitation and waterborne disease outbreaks in the United States. Am J Public Health 2001; 91:1194–9. [DOI] [PMC free article] [PubMed] [Google Scholar]
- 11.Hashizume M, Wagatsuma Y, Faruque AS et al. Factors determining vulnerability to diarrhoea during and after severe floods in Bangladesh. J Water Health 2008; 6:323–32. [DOI] [PubMed] [Google Scholar]
- 12.Black R, Lanata CF. Epidemiology of diarrhoeal diseases in developing countries. In: Blaser MJ, Smith PD, Ravdin JI, Greenberg HB, Guerrant RL. Infections of the gastrointestinal tract. New York: Raven Press, 1995:13–36. [Google Scholar]
- 13.Bray J. Isolation of antigenically homogeneous strains of Bact. coli neopolitanum from summer diarrhoea of infants. J Pathol Bacteriol 1945; 57:239–47. [Google Scholar]
- 14.Nataro JP, Kaper JB. Diarrheagenic Escherichia coli. Clin Microbiol Rev 1998; 11:142–201. [DOI] [PMC free article] [PubMed] [Google Scholar]
- 15.Qadri F, Svennerholm AM, Faruque AS, Sack RB. Enterotoxigenic Escherichia coli in developing countries: epidemiology, microbiology, clinical features, treatment, and prevention. Clin Microbiol Rev 2005; 18:465–83. [DOI] [PMC free article] [PubMed] [Google Scholar]
- 16.Okeke IN. Diarrheagenic Escherichia coli in sub-Saharan Africa: status, uncertainties and necessities. J Infect Dev Ctries 2009; 3:817–42. [DOI] [PubMed] [Google Scholar]
- 17.Ochoa TJ, Contreras CA. Enteropathogenic Escherichia coli infection in children. Curr Opin Infect Dis 2011; 24:478–83. [DOI] [PMC free article] [PubMed] [Google Scholar]
- 18.Gupta SK, Keck J, Ram PK, Crump JA, Miller MA, Mintz ED. Part III. Analysis of data gaps pertaining to enterotoxigenic Escherichia coli infections in low and medium human development index countries, 1984–2005. Epidemiol Infect 2008; 136:721–38. [DOI] [PMC free article] [PubMed] [Google Scholar]
- 19.Huwaldt JA. Plot digitizer. In: SourceForge.net Boston: Free Software Foundation, 2011. [Google Scholar]
- 20.Samonis G, Maraki S, Christidou A, Georgiladakis A, Tselentis Y. Bacterial pathogens associated with diarrhoea on the island of Crete. Eur J Epidemiol 1997; 13:831–6. [DOI] [PubMed] [Google Scholar]
- 21.Klein EJ, Stapp JR, Clausen CR et al. Shiga toxin-producing Escherichia coli in children with diarrhea: a prospective point-of-care study. J Pediatr 2002; 141:172–7. [DOI] [PubMed] [Google Scholar]
- 22.Ahmed SM, Lopman BA, Levy K. A systematic review and meta-analysis of the global seasonality of norovirus. PLoS One 2013; 8:e75922. [DOI] [PMC free article] [PubMed] [Google Scholar]
- 23.Levy K, Hubbard AE, Eisenberg JN. Seasonality of rotavirus disease in the tropics: a systematic review and meta-analysis. Int J Epidemiol 2009; 38:1487–96. [DOI] [PMC free article] [PubMed] [Google Scholar]
- 24.Patel MM, Pitzer VE, Alonso WJ et al. Global seasonality of rotavirus disease. Pediatr Infect Dis J 2013; 32:e134–47. [DOI] [PMC free article] [PubMed] [Google Scholar]
- 25.Jagai JS, Sarkar R, Castronovo D et al. Seasonality of rotavirus in South Asia: a meta-analysis approach assessing associations with temperature, precipitation, and vegetation index. PLoS One 2012; 7:e38168. [DOI] [PMC free article] [PubMed] [Google Scholar]
- 26.Jones PD, Lister DH, Osborn TJ, Harpham C, Salmon M, Morice CP. Hemispheric and large-scale land surface air temperature variations: An extensive revision and an update to 2010. J Geophys Res 2012; 117(D5):D05127. [Google Scholar]
- 27.Lawrimore JH, Menne MJ, Gleason BE et al. An overview of the Global Historical Climatology Network monthly mean temperature data set, version 3. J Geophys Res 2011; 116:D19121. [Google Scholar]
- 28.Peterson TC, Vose RS. An overview of the Global Historical Climatology Network temperature database. Bull American Meteorological Society 1997; 78:2837–49. [Google Scholar]
- 29.Weatherbase http://www.weatherbase.com. Accessed 12 July 2012.
- 30.WHO. The world health report 2003—shaping the future. List of Member States by WHO region and mortality stratum. Geneva: World Health Organization, 2003. [Google Scholar]
- 31.R Core Team. R: A language and environment for statistical computing. Vienna, Austria: R Foundation for Statistical Computing, 2013. [Google Scholar]
- 32.Newey W, West K. A simple, positive, semi-definite, heteroskedasticity and autocorrelation consistent covariance matrix. Econometrica 1987; 55:703–8. [Google Scholar]
- 33.Liang K, Zeger SL. Longitudinal data analysis using generalized linear models. Biometrika 1986; 73:13–22. [Google Scholar]
- 34.Højsgaard S, Halekoh U, Yan J. The R Package geepack for Generalized Estimating Equations. J Stat Softw 2006; 15:1–11. [Google Scholar]
- 35.Pan W. Akaike's information criterion in generalized estimating equations. Biometrics 2001; 57:120–5. [DOI] [PubMed] [Google Scholar]
- 36.Ekstrom C. MESS: Miscellaneous Esoteric Statistical Scripts. R package version 0.3–2. http://CRAN.R-project.org/package=MESS. Accessed 11 February 2016.
- 37.Christensen JH, Kumar KK, Aldrian E et al. Climate phenomena and their relevance for future regional climate change. In: Stocker TF, Qin D, Plattner G-K et al. Climate change 2013: the physical science basis contribution of Working Group I to the Fifth Assessment Report of the Intergovernmental Panel on Climate Change. Cambridge, United Kingdom: and New York, NY: Cambridge University Press, 2013. [Google Scholar]
- 38.Forouzanfar MH. IHME global burden of disease age specific diarrhea prevalence by pathogen for Bangladesh, 2010. 2014.
- 39–66.These references are available in the Supplementary Appendix.
- 67.Carlton EJ, Woster AP, DeWitt P, Goldstein RS, Levy K. A systematic review and meta-analysis of ambient temperature and diarrhoeal diseases. Int J Epidemiol 2016; 45:117–30. [DOI] [PMC free article] [PubMed] [Google Scholar]
- 68.van Elsas JD, Semenov AV, Costa R, Trevors JT. Survival of Escherichia coli in the environment: fundamental and public health aspects. ISME J 2011; 5:173–83. [DOI] [PMC free article] [PubMed] [Google Scholar]
- 69.Semenov AV, van Bruggen AH, van Overbeek L, Termorshuizen AJ, Semenov AM. Influence of temperature fluctuations on Escherichia coli O157:H7 and Salmonella enterica serovar Typhimurium in cow manure. FEMS Microbiol Ecol 2007; 60:419–28. [DOI] [PubMed] [Google Scholar]
- 70.Dowell SF. Seasonal variation in host susceptibility and cycles of certain infectious diseases. Emerg Infect Dis 2001; 7:369–74. [DOI] [PMC free article] [PubMed] [Google Scholar]
- 71.Lal A, Hales S, French N, Baker MG. Seasonality in human zoonotic enteric diseases: a systematic review. PLoS One 2012; 7:e31883. [DOI] [PMC free article] [PubMed] [Google Scholar]
- 72.Auld H, MacIver D, Klaassen J. Heavy rainfall and waterborne disease outbreaks: the Walkerton example. J Toxicol Environ Health Part A 2004; 67:1879–87. [DOI] [PubMed] [Google Scholar]
- 73.Hashizume M, Armstrong B, Hajat S et al. Association between climate variability and hospital visits for non-cholera diarrhoea in Bangladesh: effects and vulnerable groups. Int J Epidemiol 2007; 36:1030–7. [DOI] [PubMed] [Google Scholar]
- 74.Singh RB, Hales S, de Wet N, Raj R, Hearnden M, Weinstein P. The influence of climate variation and change on diarrheal disease in the Pacific Islands. Environ Health Perspect 2001; 109:155–9. [DOI] [PMC free article] [PubMed] [Google Scholar]
- 75.Mellor JE, Levy K, Zimmerman J et al. Planning for climate change: The need for mechanistic systems-based approaches to study climate change impacts on diarrheal diseases. Sci Total Environ 2016; 548–549:82–90. [DOI] [PMC free article] [PubMed] [Google Scholar]
- 76.Wierzba TF, Abdel-Messih IA, Abu-Elyazeed R et al. Clinic-based surveillance for bacterial- and rotavirus-associated diarrhea in Egyptian children. Am J Trop Med Hyg 2006; 74:148–53. [PubMed] [Google Scholar]
- 77.Qadri F, Saha A, Ahmed T, Al Tarique A, Begum YA, Svennerholm AM. Disease burden due to enterotoxigenic Escherichia coli in the first 2 years of life in an urban community in Bangladesh. Infect Immun 2007; 75:3961–8. [DOI] [PMC free article] [PubMed] [Google Scholar]
- 78.Guerrant RL, DeBoer MD, Moore SR, Scharf RJ, Lima AA. The impoverished gut--a triple burden of diarrhoea, stunting and chronic disease. Nat Rev Gastroenterol Hepatol 2013; 10:220–9. [DOI] [PMC free article] [PubMed] [Google Scholar]
Associated Data
This section collects any data citations, data availability statements, or supplementary materials included in this article.