Abstract
Summary: Ribosome profiling is a recently developed high-throughput sequencing technique that captures approximately 30 bp long ribosome-protected mRNA fragments during translation. Because of alternative splicing and repetitive sequences, a ribosome-protected read may map to many places in the transcriptome, leading to discarded or arbitrary mappings when standard approaches are used. We present a technique and software that addresses this problem by assigning reads to potential origins proportional to estimated transcript abundance. This yields a more accurate estimate of ribosome profiles compared with a naïve mapping.
Availability and implementation: Ribomap is available as open source at http://www.cs.cmu.edu/∼ckingsf/software/ribomap.
Contact: carlk@cs.cmu.edu
Supplementary information: Supplementary data are available at Bioinformatics online.
1 Introduction
Ribosome profiling (ribo-seq) provides snapshots of the positions of translating ribosomes by sequencing ribosome-protected fragments (Ingolia et al., 2009, 2012). The distribution of ribo-seq footprints along a transcript, called the ribosome profile, can be used to analyze translational regulation and discover alternative initiation (Gao et al., 2015), alternative translation and frameshifting (Michel et al., 2012), and may eventually lead to a better understanding of the regulation of cell growth, the progression of aging (Kuersten et al., 2013) and the development of diseases (Hsieh et al., 2012; Thoreen et al., 2012). Different environmental conditions such as stress or starvation alter the ribosome profile patterns (Ingolia et al., 2009; Gerashchenko et al., 2012), indicating possible changes in translational regulation.
In higher eukaryotes, alternative transcription initiation, pre-mRNA splicing, and 3′ end formation result in the production of multiple isoforms for most genes. The resulting isoforms can have dramatically different effects on mRNA stability (Lareau et al., 2007) and translation regulation (Sterne-Weiler et al., 2013). However, to date ribosome profiling analyses have been conducted at the gene, rather than isoform, level using either a single ‘representative’ isoform (e.g. Guo et al., 2010) or exon union profiles (e.g. Olshen et al., 2013). The lack of isoform-level analysis of ribo-seq data is partially due to the absence of the necessary bioinformatic tools. Here, we present a conceptual framework and software (Ribomap) to quantify isoform-level ribosome profiles. By accounting for multi-mapping sequence reads using RNA-seq estimates of isoform abundance, Ribomap produces accurate isoform-specific ribosome profiles.
The challenge in estimating isoform ribosome profiles is that a short ribo-seq read may map to many different transcripts. Ambiguous mappings are not rare in ribo-seq data and can be caused by either repetitive sequences along the genome or alternative splicing (Ingolia, 2014). For example, in the human Hela cell ribo-seq data (GSM546920, Guo et al., 2010), among all mapped reads (about 50% of all reads), only 14% can be uniquely mapped to a single location of a single mRNA isoform, 22% can be mapped to multiple regions on the reference genome due to repetitive sequences, and 64% can be mapped to multiple mRNAs due to alternative splicing. Ribomap deals with both types of ambiguous mappings, and therefore does not discard multi-mapped reads, resulting in more of the data being used. In this example, the mapping rate of Ribomap is 50% compared to 7% if only uniquely mapped reads are used.
Estimation of mRNA isoform abundance from RNA-seq has also had to deal with ambiguous mappings (Jiang and Wong, 2009; Mortazavi et al., 2008; Pachter, 2011). However, unlike in RNA-seq, coverage in ribo-seq is highly non-uniform regardless of sequencing bias since ribosomes move along mRNAs at non-uniform rates, and it is in fact the non-uniformities that are of interest (Ingolia, 2014). Further, ambiguous mappings are much worse for ribo-seq data since the read length cannot exceed the ribosome size (approximately 30 bp), while paired-end and longer reads can be generated from RNA-seq experiments to reduce the problem of ambiguous mappings. Methods developed for transcript abundance are therefore not applicable to assigning ribo-seq reads.
By observing that ambiguous mappings are mainly caused by multiple isoforms (Supplementary Fig. S2), Ribomap assigns ribo-seq reads to locations using estimated transcript abundance of the candidate locations. On synthetic data, our approach yields a more precise estimation of ribosome profiles compared with a pure mapping-based approach. Further, the ribosome abundance derived using our method correlates better with the transcript abundance on real ribo-seq data.
2 Approach
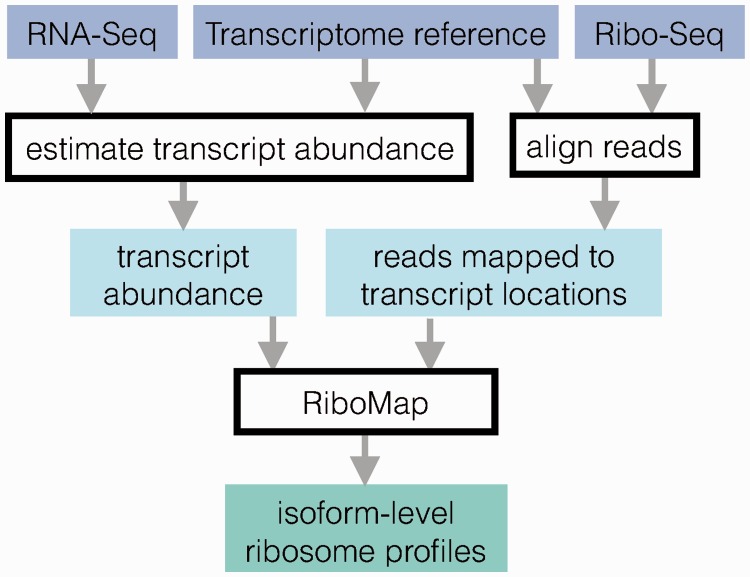
Ribomap works in 3 stages (Fig. 1; see also Supplementary Material):
Fig. 1.
Ribomap pipeline for estimating ribosome profiles
Transcript abundance estimation. Since RNA-seq experiments should always be performed in parallel with ribo-seq (Ingolia, 2014), the abundance αt per base of each transcript t can be estimated from the RNA-seq data using Sailfish (Patro et al., 2014), an ultra-fast mRNA isoform quantification package. Ribomap also accepts transcript abundance estimations from cufflinks (Trapnell et al., 2010) and eXpress (Roberts and Pachter, 2013).
Mapping ribo-seq reads to the reference transcriptome. We obtain all the transcript-location pairs Lr where the read sequence r matches the transcript sequence by aligning the entire set of ribo-seq reads R to the transcriptome with STAR (Dobin et al., 2013).
Ribosome profile estimation. Let cr be the number of ribo-seq reads with sequence r. Ribomap sets the number of footprints crti with sequence r that originate from a specific location i on transcript t to be proportional to the transcript abundance αt of transcript t: , where the denominator is the total transcript abundance with a sequence matching r. The total number of reads cti that are assigned to transcript t, location i, is then . The cti give the profiles for each transcript. The sum is needed here because there can exist multiple read sequences being mapped to the same transcript location due to sequencing errors, so the final estimated ribosome count for a transcript location should be the sum of the estimated count for all matched read sequences.
3 Results and discussion
To evaluate the performance of Ribomap, we synthetically generated ribo-seq reads with known ground truth profiles using transcript abundance of GSM546921 RNA-seq data (Guo et al., 2010) and a dynamic range of initiation rates. Ribosome occupancy probabilities for locations on a given transcript were simulated using the ribosome flow model (Reuveni et al., 2011). Errors were added to the reads using a Poisson process with a rate of 0.5%, which was estimated from the ribo-seq data GSM546920 (Guo et al., 2010). For comparison, we also test a naïve approach, called ‘Star prime’, that maps each read to a single candidate location. More details are in Supplementary material.
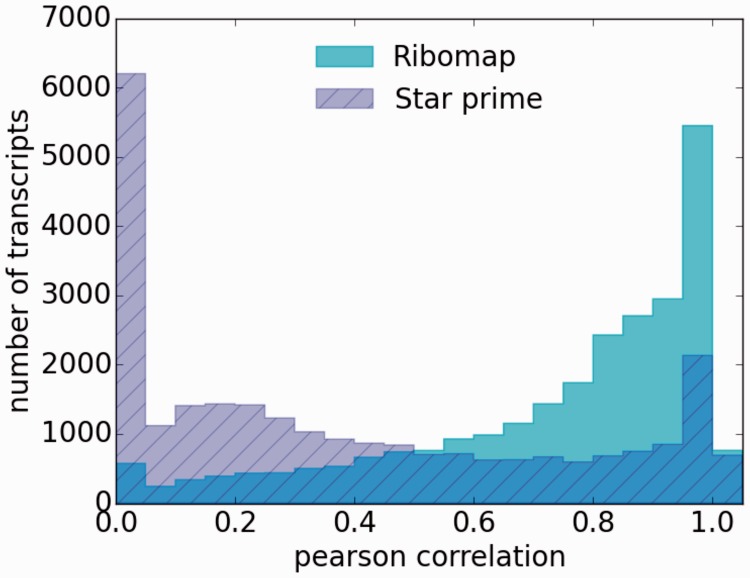
The Pearson correlation coefficients between Ribomap’s ribosome profiles and the ground truth is significantly higher than that of Star prime (Fig. 2): 81% of our profiles have a higher Pearson correlation (Mann–Whitney U test ) and 68% have a smaller root mean square error (Mann–Whitney U test ). This suggests that Ribomap more accurately recovers the ribosome profiles than the standard mapping procedure applied to isoforms.
Fig. 2.
Histogram of the Pearson correlation between the footprint assignments and the ground truth profiles. Ribomap has a significant higher Pearson correlation (median: 0.83) than Star prime (median: 0.28). The spike at 0 of Star prime is due to STAR not assigning footprints to transcripts that are estimated to be present
The good correlation between the ground truth profile and the estimated profile also leads to a good estimation of the total ribosome loads on a transcript. Ribomap’s ribosome loads estimation on non-synthetic ribo-seq data (GSM546920, Guo et al., 2010) correlates well with the estimated transcript abundance (Pearson r = 0.71). We do not expect a perfect correlation due to isoform-specific translational regulation. On the other hand, the pure mapping-based approach of Star prime does not correlate as well (r = 0.28).
Through two lines of evidence, on real and synthetic ribo-seq data, we show that Ribomap produces useful, high-quality ribosome profiles along individual isoforms. It can serve as a useful first step for downstream analysis of translational regulation from ribo-seq data.
Supplementary Material
Funding
This work is funded in part by the Gordon and Betty Moore Foundation’s Data-Driven Discovery Initiative through Grant GBMF4554 to Carl Kingsford. It has been partially funded by the US National Science Foundation [CCF-1256087, CCF-1319998]; and US National Institutes of Health [R21HG006913, R01HG007104]. C.K. received support as an Alfred P. Sloan Research Fellow.
Conflict of Interest: none declared.
References
- Dobin A. et al. (2013) STAR: ultrafast universal RNA-seq aligner. Bioinformatics, 29, 15–21. [DOI] [PMC free article] [PubMed] [Google Scholar]
- Gao X. et al. (2015) Quantitative profiling of initiating ribosomes in vivo. Nat. Methods, 12, 147–153. [DOI] [PMC free article] [PubMed] [Google Scholar]
- Gerashchenko M.V. et al. (2012) Genome-wide ribosome profiling reveals complex translational regulation in response to oxidative stress. Proc. Natl. Acad. Sci. U. S. A., 109, 17394–17399. [DOI] [PMC free article] [PubMed] [Google Scholar]
- Guo H. et al. (2010) Mammalian microRNAs predominantly act to decrease target mRNA levels. Nature, 466, 835–840. [DOI] [PMC free article] [PubMed] [Google Scholar]
- Hsieh A.C. et al. (2012) The translational landscape of mTOR signalling steers cancer initiation and metastasis. Nature, 485, 55–61. [DOI] [PMC free article] [PubMed] [Google Scholar]
- Ingolia N.T. et al. (2009) Genome-wide analysis in vivo of translation with nucleotide resolution using ribosome profiling. Science, 324, 218–223. [DOI] [PMC free article] [PubMed] [Google Scholar]
- Ingolia N.T. et al. (2012) The ribosome profiling strategy for monitoring translation in vivo by deep sequencing of ribosome-protected mRNA fragments. Nat. Protoc., 7, 1534–1550. [DOI] [PMC free article] [PubMed] [Google Scholar]
- Ingolia N.T. (2014) Ribosome profiling: new views of translation, from single codons to genome scale. Nat. Rev. Genet., 15, 205–213. [DOI] [PubMed] [Google Scholar]
- Jiang H., Wong W.H. (2009) Statistical inferences for isoform expression in RNA-Seq. Bioinformatics, 25, 1026–1032. [DOI] [PMC free article] [PubMed] [Google Scholar]
- Kuersten S. et al. (2013) Translation regulation gets its ‘omics’ moment. Wiley Interdiscip. Rev. RNA, 4, 617–630. [DOI] [PMC free article] [PubMed] [Google Scholar]
- Lareau L.F. et al. (2007) Unproductive splicing of SR genes associated with highly conserved and ultraconserved DNA elements. Nature, 446, 926–929. [DOI] [PubMed] [Google Scholar]
- Michel A.M. et al. (2012) Observation of dually decoded regions of the human genome using ribosome profiling data. Genome Res., 22, 2219–2229. [DOI] [PMC free article] [PubMed] [Google Scholar]
- Mortazavi A. et al. (2008) Mapping and quantifying mammalian transcriptomes by RNA-Seq. Nat. Methods, 5, 621–628. [DOI] [PubMed] [Google Scholar]
- Olshen A.B. et al. (2013) Assessing gene-level translational control from ribosome profiling. Bioinformatics, 29, 2995–3002. [DOI] [PMC free article] [PubMed] [Google Scholar]
- Pachter L. (2011). Models for transcript quantification from RNA-Seq. arXiv preprint arXiv: 11043889. [Google Scholar]
- Patro R. et al. (2014) Sailfish enables alignment-free isoform quantification from RNA-seq reads using lightweight algorithms. Nat. Biotechnol., 32, 462–464. [DOI] [PMC free article] [PubMed] [Google Scholar]
- Reuveni S. et al. (2011) Genome-scale analysis of translation elongation with a ribosome flow model. PLoS Comput. Biol., 7, e1002127. [DOI] [PMC free article] [PubMed] [Google Scholar]
- Roberts A., Pachter L. (2013) Streaming fragment assignment for real-time analysis of sequencing experiments. Nat. Methods, 10, 71–73. [DOI] [PMC free article] [PubMed] [Google Scholar]
- Sterne-Weiler T. et al. (2013) Frac-seq reveals isoform-specific recruitment to polyribosomes. Genome Res., 23, 1615–1623. [DOI] [PMC free article] [PubMed] [Google Scholar]
- Thoreen C.C. et al. (2012) A unifying model for mTORC1-mediated regulation of mRNA translation. Nature, 485, 109–113. [DOI] [PMC free article] [PubMed] [Google Scholar]
- Trapnell C. et al. (2010) Transcript assembly and quantification by RNA-Seq reveals unannotated transcripts and isoform switching during cell differentiation. Nat. Biotechnol., 28, 511–515. [DOI] [PMC free article] [PubMed] [Google Scholar]
Associated Data
This section collects any data citations, data availability statements, or supplementary materials included in this article.


