Abstract
Study Objectives:
To analyze the temporal organization of the sleep-wake cycle under food entrainment in the rat.
Methods:
Eighteen male Sprague-Dawley rats were chronically implanted for polysomnographic recording. During the baseline (BL) protocol, rats were recorded under a 12:12 light-dark (LD) schedule in individual isolation chambers with food and water ad libitum. Food entrainment was performed by means of a 4-h food restriction (FR) protocol starting at photic zeitgeber time 5. Eight animals underwent a 3-h phase advance of the FR protocol (A-FR). We compared the mean curves and acrophases of wakefulness, NREM sleep, and REM sleep under photic and food entrainment and after a phase advance in scheduled food delivery. We further evaluated the dynamics of REM sleep homeostasis and the NREM sleep EEG delta wave profile.
Results:
A prominent food-anticipatory arousal interval was observed after nine or more days of FR, characterized by increased wakefulness and suppression of REM sleep propensity and dampening of NREM sleep EEG delta activity. REM sleep exhibited a robust nocturnal phase preference under FR that was not explained by a nocturnal REM sleep rebound. The mean curve of sleep-wake states and NREM sleep EEG delta activity remained phase-locked to the timing of meals during the A-FR protocol.
Conclusions:
Our results support the hypothesis that under food entrainment, the sleep-wake cycle is coupled to a food-entrainable oscillator (FEO). Our findings suggest an unexpected interaction between FEO output and NREM sleep EEG delta activity generators.
Citation:
Castro-Faúndez J, Díaz J, Ocampo-Garcés A. Temporal organization of the sleep-wake cycle under food entrainment in the rat. SLEEP 2016;39(7):1451–1465.
Keywords: food entrainment, sleep chronobiology, REM sleep homeostasis, NREM sleep homeostasis, food restriction
Significance.
The mammalian circadian system times metabolism and behavior within the frame of the 24-hour cycle, determining diurnal, nocturnal or crepuscular phase preference of sleep-wake states. Here we show that a 24 hour eat/fast cycle operates as an efficient time cue for the rat's sleep-wake cycle. The coupling of sleep-wake state generators to scheduled feeding gives support to the notion that the circadian system is composed by a complex array of oscillators that includes a food-entrainable oscillator. This results may help to understand how feeding schedules contribute to the robustness of the output of the circadian system under ecological conditions and, on the other hand, how chronodisruption may emerge as consequence of mistimed feeding.
INTRODUCTION
Growing evidence supports reciprocal control between sleep and metabolic regulation processes, given that the functional maps of sleep-wake state generators overlap those of neural processes controlling appetite, hunger, and energy storage.1 Obesity and metabolic imbalances are associated with signifi-cant modifications in the architecture of the sleep-wake cycle,2 and chronic and acute sleep deprivation provoke considerable metabolic changes.3–5 Circadian rhythms, whose molecular machineries interact with energy-sensing molecules,6 directly modulate the timing of sleep-wake states and neuroendocrine mechanisms involved in energy homeostasis.7–9 Although the pivotal role of circadian processes in connecting sleep and metabolism is clear, little is known about the role of circadian processes entrained by an eat-fast cycle in modulating the timing of sleep-wake states.
Studies carried out in nocturnal and crepuscular rodents subjected to regular 24-hour eat-fast cycles with food restriction protocols have identified systematic phase adjustments in the rest-activity rhythm.10,11 Typically, a consistent food-anticipatory activity (FAA) interval emerges after 5-7 days of scheduled feeding, consisting of an intense bout of locomotor activity 2-3 hours prior to the timed food delivery. Because the FAA phenomenon complies with canonical circadian properties, it is considered a reliable marker of a food-entrainable oscillator (FEO).12,13 The anatomical substrate of the FEO is still undetermined, although it is presumed to be a distributed network of oscillators14,15 located outside the light-entrainable circadian clock of the hypothalamic suprachiasmatic nucleus.16 The strength of the FEO has been demonstrated by the phase adjustment of most of the peripheral circadian oscillators and several overt rhythms to scheduled eat-fast cycles.13,17
The temporal organization of the sleep-wake cycle under photic entrainment has been extensively studied, described, and modeled in humans and in animal models.18 A circa-dian process generated in the suprachiasmatic hypothalamic light-entrainable oscillator (LEO) modulates the activity of sleep-wake state generators.18,19,20 Current models also include hourglass or homeostatic mechanisms that contribute to the consolidation of sleep states and maintenance of stable daily quotas of non-REM (NREM) sleep and REM sleep.21–25 In the present study, we evaluate the hypothesis that the rat sleep-wake cycle is coupled to the FEO under food entrainment, by analyzing the temporal profile of the sleep-wake cycle and the distribution of acrophases for each state under two stable food entrainment protocols.
METHODS
Experiments complied with American Physiological Society policies and were supervised by the Bioethics Committee of the Faculty of Medicine, University of Chile. Eighteen male Sprague-Dawley rats weighing 250-300 grams were kept in individual cages under a 12:12 LD schedule, at an ambient temperature of 21-24°C, with unlimited access to food and water unless otherwise indicated. Illumination during the light phase was set at around 300 lux.
Electrode Implantation
Under ketamine (50 mg/kg)/ xylazine (10 mg/kg) anesthesia, rats were placed in a stereotaxic instrument and implanted with 2 stainless steel epidural and neck muscle electrodes, for EEG and EMG, respectively (Medwire Corp., Mt. Vernon, NY). The electrode array was protected and permanently affixed to the skull with dental acrylic and anchoring cranial screws (Fine Science Tools Inc., North Vancouver, BC, Canada). Analgesics (ketoprofen, 5 mg/kg) and antibiotics (enrofloxacin, 0.2 mg/kg) were administered after the procedure and for the following 3 days. Thereafter, rats were placed in 30 × 30 × 25 cm cages inside a 65 × 60 × 60 cm sound-isolated cube.
Polysomnographic Recording and Sleep Scoring
After at least one week of recovery, rats were connected to the sleep-recording system by means of a counterbalanced cable attached to a slip-ring (Airflyte Electronics, Bayonne, NJ). A computer-based data acquisition system sampled, displayed, and stored EEG and EMG data. The EEG channel was bandpass analog-filtered (0.5-30 Hz) and amplified by a factor of 2500-5000. The band-pass for EMG was band-pass analog-filtered (30-100) Hz and amplified by a factor of 5000-10000. Both signals were notch-filtered (50 Hz). After this signal conditioning, recordings were sampled at 250 Hz and acquired by means of an amplifier (Grass Model 15LT, Astro-Med, Inc., West Warwick, RI).
A spectrogram was obtained from the nuchal EMG channel by means of fast Fourier transform (FFT), performed in Igor Pro V6.3 (www.wavemetrics.com). The EMG amplitude in the 70-90 Hz band was integrated for each 15-s epoch. The resulting vector (i.e., EMG activity) was converted to logarithmic scale as log-normal distributions were obtained for low and high EMG amplitudes.
Successive 15-s epochs were visually assigned to wakefulness, NREM sleep, or REM sleep in an off-line analysis by 2 independent scorers. Each epoch was assigned to the state that occupied > 50% of that epoch, as previously described.26 Briefly, wakefulness was identified by the presence of desynchronized EEG and phasic EMG activity. NREM sleep corresponded to epochs with high-amplitude slow wave (1-4 Hz) EEG activity accompanied by sleep spindles (10-15 Hz) and low neck muscle tonus. REM sleep was identified by the presence of sustained theta (6-9 Hz) activity coupled with neck muscle atonia.
Analysis of NREM Sleep EEG Delta Activity
EEG analyses were performed in Igor Pro V6.3. Using FFT, a spectrogram (15-s time resolution) was obtained from the EEG channel. Delta activity was computed from the spectrogram as the integrated delta power (0.5-4 Hz) for each 15-s epoch. Every epoch had been previously scored as wakefulness, NREM sleep, or REM sleep. To avoid the effect of sleep fragmentation on NREM sleep EEG delta activity, only NREM sleep episodes lasting ≥ 2 min (8 epochs) were considered. The hypnogram was smoothed thereafter to incorporate isolated epochs of wakefulness or REM sleep separating 2 consolidated (2-min) NREM sleep episodes. The delta power of isolated wake or REM sleep epochs was excluded from computation. Finally, first and last epochs of the train of successive consolidated NREM sleep episodes were also eliminated from computation. The resulting daily fluctuation vector (24 values) for NREM sleep delta power was normalized (z-scored: mean = 0, SD = 1) for comparison among the experimental animals. The average and standard deviation of this vector was then computed for the BL and FR conditions.
Experimental Design
Eighteen animals were successively subjected to baseline (BL) and scheduled food-restriction protocols (FR). A subset of 8 animals completed a subsequent experiment with a phase advance in the scheduled food restriction (A-FR). The same LD schedule was maintained throughout the study. Hours are denominated either according to the photic zeitgeber time (ZT) or feeding time (FT), as appropriate. ZT 0 corresponds to the first hour after lights-on, and FT 0 to the first hour of food exposure under scheduled feeding conditions. When we refer to a given hour, we mean the 1-h interval that starts at that time, e.g., “ZT 6” refers to the interval from 6:00-6:59. Equivalently, a 2-h block corresponds to the 2-h interval starting at the designated ZT.
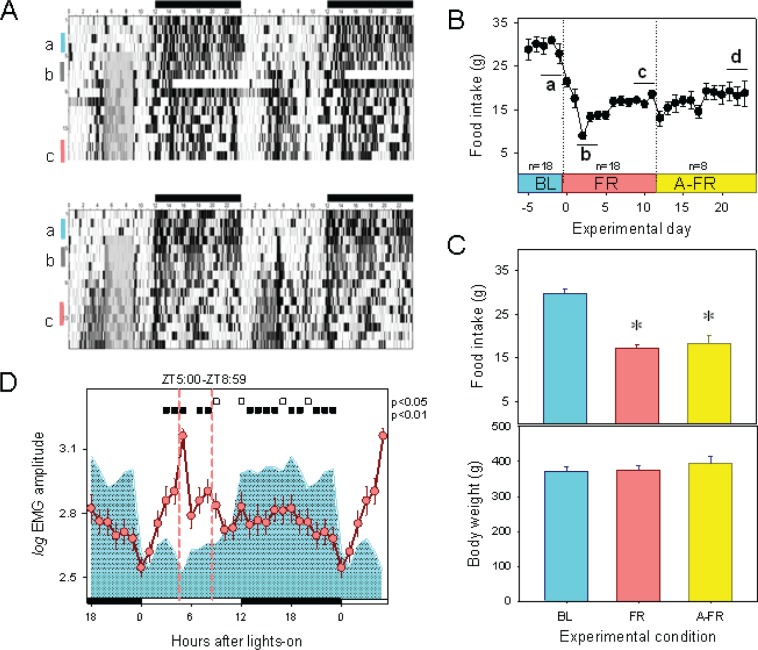
Under BL conditions, food was available ad libitum. The BL protocol was performed until at least 3 days of optimal recording were completed. Thereafter, a 4-h FR protocol was imposed. A daily quota of 40 g of rat food (LabDiet 5P00, Prolab RMH3000) was delivered at ZT 5 and withdrawn at ZT 8:59. The rat food intake was estimated daily as the weight difference in grams between the offered and withdrawn food. The FR protocol lasted for 12 days (Figure 1), and sleep records were obtained during the final 3 days. To determine the timing of the food-anticipatory activity (FAA) onset, the first 7 animals of the sample were continuously recorded starting at BL. FAA was estimated by visual inspection of the temporal distribution of the highest tercile of EMG levels in the double plot (Figure 1A). All 7 animals showed FAA within the first week of FR. To prevent damage to the electrode implants from mechanical stress during prolonged continuous recordings, the remaining 11 animals of the sample were disconnected after BL recording and reconnected at the ninth day of FR until at least 3 days of optimal recordings under the FR protocol were obtained.
Figure 1.
EMG, food intake, and body weight during BL, FR, and A-FR protocols. (A) Double plots of EMG activity obtained in two representative animals recorded before and during scheduled food restriction The four-hour FR protocol started at ZT 5 (gray area on raster plot), after a BL period of ad libitum food intake. Light-dark cycle indicated at upper abscissa. Vertical bars on left ordinate indicate selected 48-h interval when polysomnographic samples were obtained under BL (a), initial FR (b), and late FR (c) conditions. (B) Average (± SEM) food intake across experimental protocol. Intervals identified as a, b, c, and d correspond to experimental days when polysomnographic recordings were obtained under BL, initial FR, late FR, and advanced-FR (A-FR) conditions, respectively (see Results). (C) Average (± SEM) food intake and body weight under BL, late FR, and A-FR conditions. * = significant differences vs. BL (P < 0.001, post hoc Bonferroni multiple comparison test after one-way ANOVA). (D) Mean curve of EMG amplitude under BL (cyan area) and FR (reddish circles). Values correspond to the hourly mean of (log) EMG amplitude (± SEM) obtained for 18 animals after at least 9 days of FR (segment c in rasterplot). Filled and open squares under upper abscissa indicate significant differences vs. baseline (2-tailed paired t-test after significant 2-way rmANOVA).
After completing the FR condition, the feeding window was phase-advanced by 3 h (A-FR condition). Under the A-FR condition, 40 g of rat food were delivered at ZT 2 and withdrawn at ZT 5:59. Animals were reconnected after the ninth day of A-FR and recorded for at least 3 days (Figure 1B). Sleep data were obtained for the 8 animals that completed a 12-day A-FR period with optimal polysomnographic records.
Data Analysis and Statistics
Statistical analysis was carried out using Intercooled Stata 9.2 for Windows (StataCorp, College Station, TX), and circular statistics were performed on custom-made spreadsheets in accordance with procedures described in the literature.27,28 Each day of recording was summarized into a state-by-epoch array containing 5760 assignments that were processed to demarcate episodes of REM sleep, NREM sleep, and wakefulness. The variables analyzed were: amount of wakefulness, NREM, and REM sleep; REM/ total sleep time (REM/ TST) ratio; REM sleep debt; REM sleep transitions (REMsT); number of long REM sleep episodes (REMsLE); REM sleep transition index; REM sleep consolidation rate; sleep-wake state acrophases; and NREM sleep EEG slow wave activity. Variables were collapsed into 12-h blocks corresponding to light and dark phases, 12 consecutive 2-h blocks, and hours.
Amounts of wakefulness, NREM, and REM sleep correspond to the number of 15-s epochs observed at the corresponding time-window, expressed in minutes. The REM/ TST ratio was expressed as a percentage. REM sleep debt corresponds to the difference between the cumulative amount of REM sleep observed during the given experimental interval and the cumulative amount of REM sleep during the corresponding baseline interval. REM sleep transitions correspond to the number of NREM-to-REM sleep transitions during the given recording period. Long REM sleep episodes were defined by a duration threshold set at the limit of the second-and third-longest terciles of the individual pool of REM sleep episodes obtained under baseline conditions. Long REM-sleep episodes averaged 2.8 min. The REM sleep transition index corresponds to the frequency of NREM-to-REM sleep transitions, expressed as events per 10 min of NREM sleep.29 The consolidation rate corresponds to the long REM sleep episode incidence over total number of REM sleep transitions for a given interval, expressed as percentage.24,30 Mean curves for BL and FR variables were obtained by averaging 2 baseline or food-restriction days per rat at the corresponding time resolution. A minimum of 10% NREM sleep per recording interval was required for REM/ TST and REM sleep transition index estimations, and at least one NREM-to-REM sleep transition was required for consolidation rate estimations. Sleep-wake state acrophases were estimated using mean angle calculation as described by Zar.28 For the NREM sleep EEG delta power analysis, only NREM sleep episodes longer than 8 consecutive 15-s epochs (2 min) were considered. If a NREM sleep episode was interrupted by a single 15-s epoch of another state, that epoch was omitted and the episode was considered as one event. Epochs with transitions between NREM sleep and other states were eliminated from the analysis.
Mean curves for the sleep-wake state variables were subjected to a two-way repeated-measures analysis of variance (rmANOVA) with factors “zeitgeber time” or “feeding time” and “feeding schedule.” One-way rmANOVA was used to analyze REM sleep debt for the factor “zeitgeber time.” P values for the rmANOVAs are presented with Huynh-Feldt correction. Two-tailed paired t-tests were performed as post hoc comparisons for significant factors or factor interactions found in rmANOVAs. Holm-Bonferroni correction was applied for paired multiple comparisons. Rayleigh's test was used for each rat to estimate the significance of the mean angles of the sleep-wake states. Second-order population mean angles were obtained by pooling significant individual mean angles for the sleep-wake states (Hotelling procedure) for each experimental condition. Second-order parametric tests were performed on population angles.28
RESULTS
Animals were subjected to a 4-h FR protocol after a baseline recording period with ad libitum feeding. Food entrainment was demonstrated by the emergence of FAA in the 2- to 3-h interval prior to the feeding interval, as shown in the EMG raster plot (Figure 1A). A robust FAA was clearly present at the end of the first week of the food-restriction protocol, as documented for the 7 animals that were recorded uninterruptedly during BL and FR conditions. Mean curves of EMG activity obtained in the 18 experimental animals demonstrate that, in contrast to the characteristic nocturnal predominance of activity during BL, a 2-h (ZT 3 and ZT 4) anticipatory increment in EMG activity is present under FR and part of the feeding interval (rmANOVA for factors “zeitgeber time”*“feeding schedule” was F23,391 = 26.48, P < 0.001). The nocturnal EMG amplitude under FR remained below BL values (Figure 1D). Compared to BL, there was a significant decrease in food in-take under late FR and A-FR (one-way ANOVA F2,36 = 45.1, for factor “feeding schedule,” post hoc Holm-Bonferroni-corrected paired t-test, P < 0.001) as presented in Figure 1C. No significant increase or decrease in body weight was observed under FR or A-FR conditions (Figure 1C).
Sleep-Wake States under FR before the Emergence of FAA
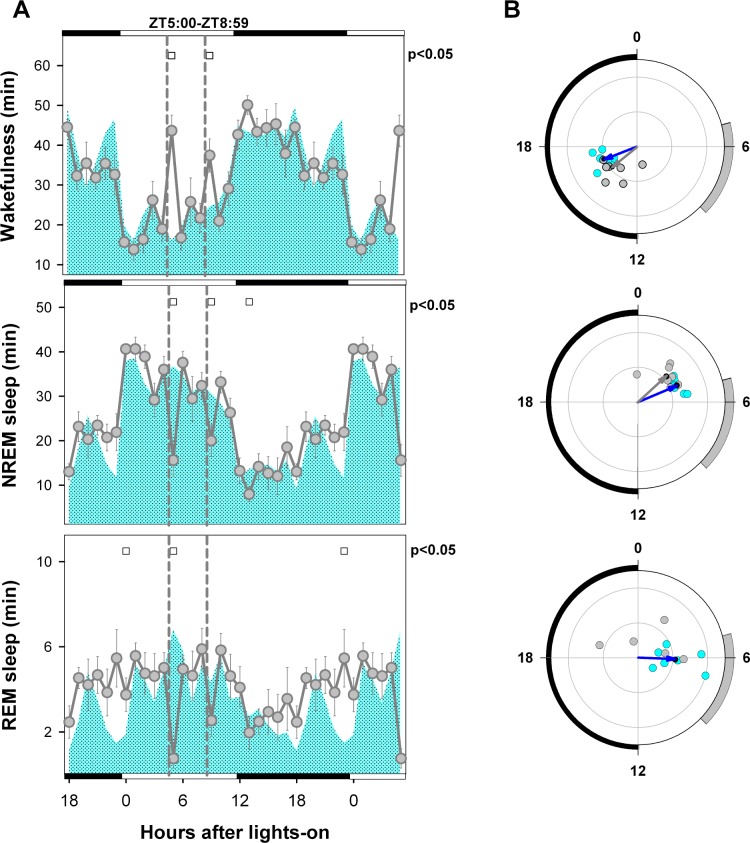
Polysomnographic data obtained from 7 rats during initial FR (days 2-4 after beginning FR, see Figure 1A and 1B), before the emergence of FAA, showed no significant differences vs. BL in total amount of wakefulness (BL vs. initial FR, paired t-test, P = 0.691), NREM sleep (P = 0.950), REM sleep (P = 0.192), or REM/TST ratio (P = 0.210), nor were there any significant differences in light-dark phase distribution of the states (rmANOVA for “phase”*“feeding schedule” interaction: wakefulness F1,6 = 2.51, P = 0.164; NREM sleep F 1,6 = 1.88, P = 0.219; REM sleep F1,6 = 5.16, P = 0.063; REM/ TST ratio F1,6 = 4.53, P = 0.077). The corresponding mean curves for each state revealed no anticipatory phenomena, with significant changes occurring reactively after presentation and retirement of food (ZT 5 and ZT 9 respectively, Figure 2A). A transient increase in REM sleep at dawn (ZT 23 and ZT 0) was observed. Mean angles under BL and initial FR conditions were ZT 16.6 and ZT 15.3 for wakefulness and ZT 4.5 and ZT 3.2 for NREM sleep, respectively, with no significant differences between conditions for either state (parametric test for paired samples of angles, P < 0.05), as depicted in Figure 2B. The baseline REM sleep mean angle was ZT 6.2, and no significant mean angle was obtained for the initial FR period (F = 1.97, P > 0.05, one-sample second-order Hotelling Test; Figure 2B).
Figure 2.
Mean curve and circular statistics of sleep-wake states under BL and initial FR conditions. (A) Mean curves for baseline (cyan area) and initial FR (gray circles, ± SEM) conditions obtained for 7 animals. Open squares under upper abscissa indicate significant differences vs. baseline (2-tailed paired t-test after significant 2-way rmANOVA). The initial and final 6 h of the light-dark cycle are double-plotted. Photoperiod indicated on the abscissa and vertical dashed lines delimits the food availability window (ZT 5:00–ZT 8:59). (B) Blue and gray arrows correspond to BL and FR mean vectors, respectively (Hotelling second-order analysis of angles). Cyan (BL) and gray (FR) dots correspond to averaged individual acrophases for the corresponding vector. Note that the REM sleep FR vector is not significant. Radial ordinate corresponds to the magnitude (r) of the mean vector (total radius = 0.5). Zeitgeber time is indicated on the circular abscissa. The black semicircle delimits the dark phase, and the gray arc indicates the feeding interval under the food restriction condition.
Sleep-Wake Cycle States under Steady-State Food Entrainment
Table 1 summarizes sleep-wake cycle state statistics for the 18 rats under BL and FR protocols after FFA onset. Data correspond to 48-h continuous samples under BL and FR conditions acquired during the final days of the ad libitum (BL) condition and after 9 days of FR (Figure 1A and 1B). The baseline daily quota of REM sleep was 6.8%, and this amount was not significantly affected by FR (7.3%, paired t-test, P = 0.195). Wakefulness decreased from 51.1% at BL to 45.8% under FR (paired t-test, P = 0.016); conversely, NREM sleep increased from 42.1 to 47% (paired t-test, P = 0.020).
Table 1.
General statistics for BL vs. FR conditions.
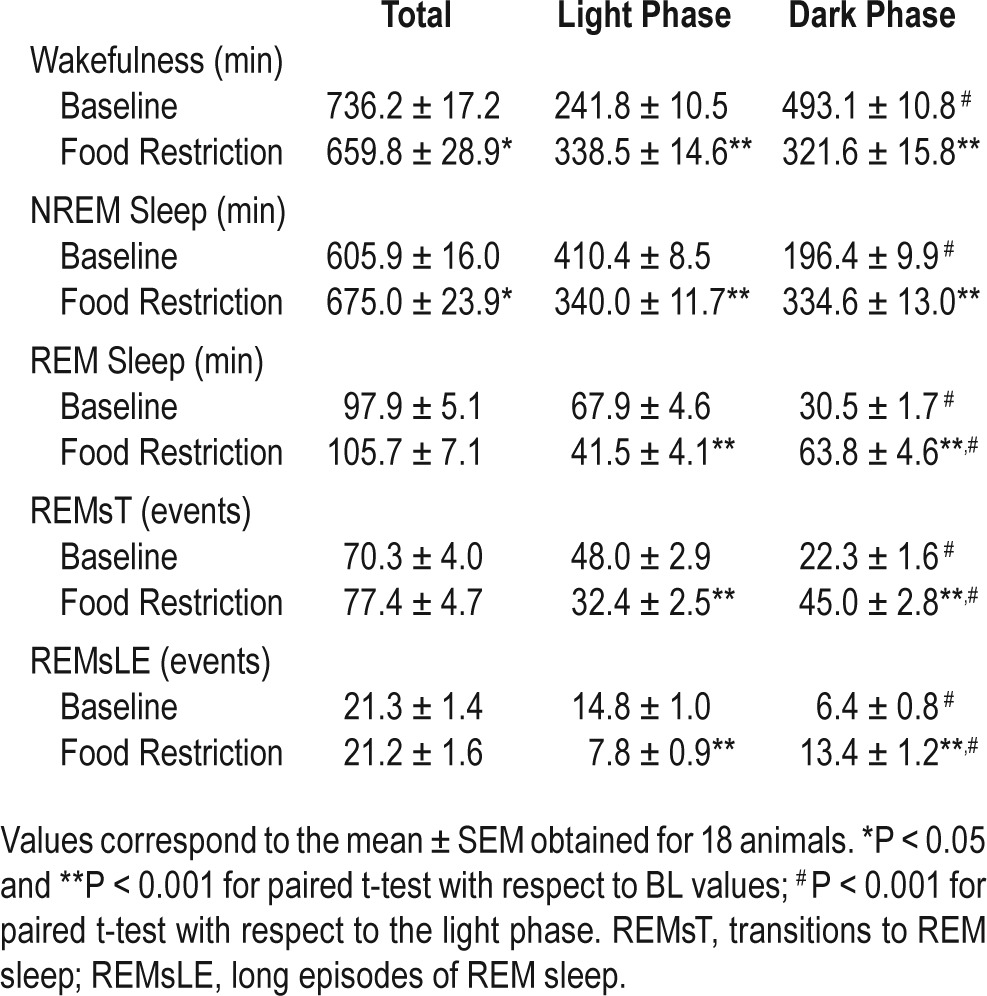
As expected, BL wakefulness showed a nocturnal phase preference (67.1% of total wakefulness), and NREM sleep and REM sleep showed diurnal phase preferences (67.6% and 69% of total amounts of the 2 states, respectively). Under FR, diurnal time in wakefulness increased significantly (rmANOVA for “phase”*“feeding schedule” interaction, F 1,17 = 282.8, P < 0.001; BL vs. FR, paired t-test, P < 0.001), and nocturnal wakefulness concurrently decreased by 34% (paired t-test, P < 0.001). As a consequence, there was a loss of diurnal-nocturnal difference (paired t-test, P = 0.186). The amount of nocturnal NREM sleep increased by 70.4% vs. BL (rmANOVA for “phase”*“feeding schedule” interaction, F 1,17 = 453.7, P < 0.001; paired t-test, P < 0.001), and diurnal NREM sleep decreased by 17.2% (paired t-test, P < 0.001), also producing a loss of diurnal-nocturnal difference for NREM sleep (paired t-test, P = 0.516). A 109.1% increase in nocturnal REM sleep (rmANOVA for “phase”*“feeding schedule” interaction, F1,17 = 60.3, P < 0.001; BL vs. FR, paired t-test, P < 0.001), associated with a 38.8% decrease in diurnal REM sleep (BL vs. FR, paired t-test, P < 0.001), resulted in an inverted phase preference, with 60.6% of total REM sleep concentrated during the dark phase under FR (D vs. L, paired t-test, P = 0.001). Changes in REMsT (rmANOVA for “phase”*“feeding schedule” interaction, F 1,17 = 118.79, P < 0.001) and REMsLE incidence (rmANOVA for “phase”*“feeding schedule” interaction, F1,17 = 49.79, P < 0.001) are consistent with the nocturnal REM sleep preference under FR conditions.
Mean Curves of Sleep-Wake Cycle States under Steady-State Food Entrainment
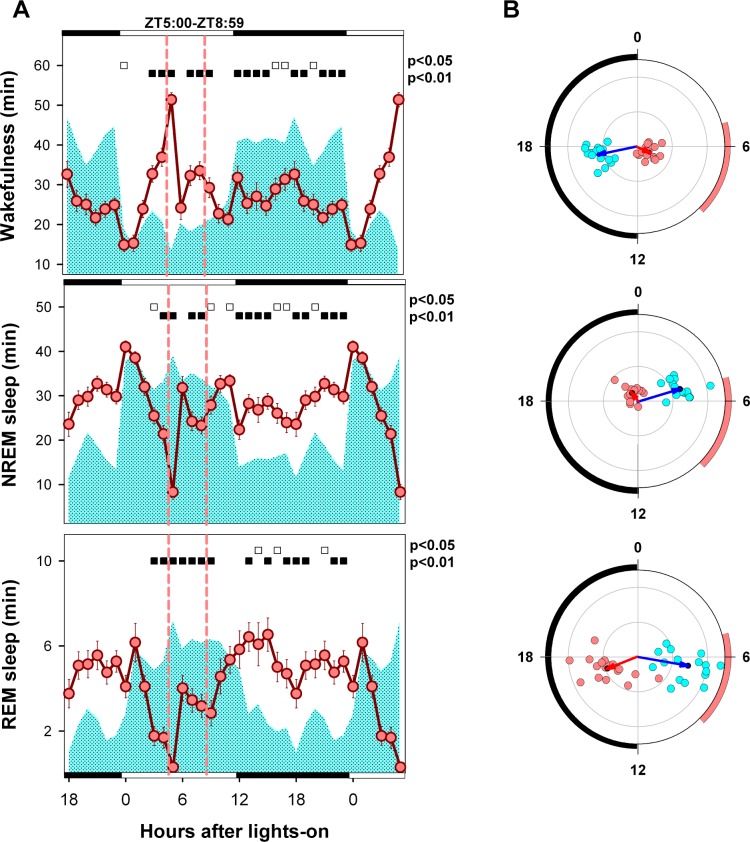
After the emergence of FAA under scheduled FR, a sharp 277% increase in wakefulness occurred in coincidence with food presentation at ZT 5 (13 vs. 51 minutes during BL and FR conditions, respectively, paired t-test, P < 0.001; rmANOVA for “zeitgeber time”*“feeding schedule” interaction, F23,387 = 22.9, P < 0.001). This increase was preceded by a significant upsurge in wakefulness vs. BL during ZT 3 and ZT 4. Levels higher than BL were also sustained between ZT 7 and ZT 9. During the dark phase, the amount of nocturnal wakefulness remained below 70% of baseline for nearly the entire ZT 12–ZT 23 interval (Figure 3A). The timing of wakefulness was mirrored by the timing of NREM sleep (rmANOVA for “zeitgeber time”*“feeding schedule” interaction, F23,387 = 22.1, P < 0.001). Under FR, NREM sleep exhibited a relatively flat profile, interrupted by an early morning peak (ZT 0–ZT 1) followed by 19% and 35.9% drops vs. BL at ZT 3 and ZT 4, respectively, in coincidence with the wakefulness bout prior to food presentation. The amount of NREM sleep remained relatively stable during the ZT6–ZT 23 interval, with values lower than BL during the second half of the light phase and higher than BL during the entire dark phase. The hourly mean curve for REM sleep showed a continuous drop vs. BL during the ZT 3–ZT 9 interval and a nearly continuous increase during the dark phase (rmANOVA for “zeitgeber time”*“feeding schedule” interaction, F23,387 = 13.6, P < 0.001). There were marked 63.6% and 68.1% drops vs. baseline for REM sleep levels during ZT 3 and ZT 4, respectively, in coincidence with the food-anticipatory wakefulness interval.
Figure 3.
Mean curve of sleep-wake states under BL and food entrainment. (A) Cyan area depicts baseline mean curves, and reddish circles correspond to the hourly mean time of the state (± SEM) obtained for 18 animals after at least 9 days of FR. Filled and open squares under upper abscissa indicate significant differences vs. baseline (two-tailed paired t-test after significant 2-way rmANOVA). (B) Blue and red arrows correspond to BL and FR mean vectors. Cyan (BL) and reddish (FR) dots correspond to averaged individual acrophases for the corresponding vector. Radial ordinate corresponds to the magnitude (r) of the mean vector (total radius = 0.5). Legend as in Figure 3 except that the reddish arc indicates the feeding interval.
Circular Distribution of Sleep-Wake Cycle States under Steady-State Food Entrainment
The REM sleep mean angle at BL was at ZT 6.7 (one-sample second-order Hotelling test, F = 40.6, P < 0.0005, Figure 3B). Under FR, individual mean angles were significant for 17 rats, all clustered within the first half of the dark phase (range ZT 9.1–19.4), with the population REM sleep mean angle at ZT 16.6 (one-sample second-order Hotelling test, F = 42.3, P < 0.001). Under FR, the REM sleep mean angle exhibited a phase displacement of 9.9 hours vs. BL (parametric test for paired samples of angles, F = 67.6, P < 0.001, n = 17). There was a nocturnal phase preference for wakefulness among the 18 animals under BL conditions, with a population mean angle centered at midnight (ZT 17.2, range ZT 15.7–18.6; one-sample second-order Hotelling test, F = 184.9, P < 0.0005). Under FR, 2 animals lost phase preference, with the remaining 16 showing mean angles distributed loosely around midday. The estimated acrophase of wakefulness under FR was ZT 7.73 (range ZT 4.67–12.33; one-sample second-order Hotelling test, F = 29.6, P < 0.001). There was a significant shift in the acrophase for wakefulness under FR vs. BL (parametric test for paired samples of angles, F = 124.2, P < 0.001, n = 16). A diurnal NREM sleep phase preference was observed under BL conditions (acrophase at ZT 4.9, range ZT 3.6–6.2; one-sample second-order Hotelling test F = 138.9, P < 0.001), and widely dispersed phase preferences were observed under FR, all timed during the second half of the dark phase (acrophase at ZT 21.5, range ZT 12.0–ZT 2.3; one-sample second-order Hotelling test, F = 14.9, P < 0.001).
The amplitude of the mean curve was estimated using the magnitude (r) of the mean vector. There was a strong effect of “feeding schedule” (F1,17 = 56.54, P < 0.001) and a significant interaction effect for “feeding schedule” and “sleep-wake state” on r in the corresponding two-way rmANOVA (F2,28 = 4.76, P = 0.031; Figure 4). Each state showed a significant decrease in amplitude under FR, most notably wakefulness (0.231 to 0.085, paired t-test, P < 0.001) and NREM sleep (0.254 to 0.069, paired t-test, P < 0.001). The amplitude of the mean curve for REM sleep also dropped significantly under FR (0.314 to 0.206, paired t-test, P < 0.001) but remained higher than those for wakefulness or NREM sleep (post hoc Holm-Bonferroni-corrected paired t-test, P < 0.05).
Figure 4.
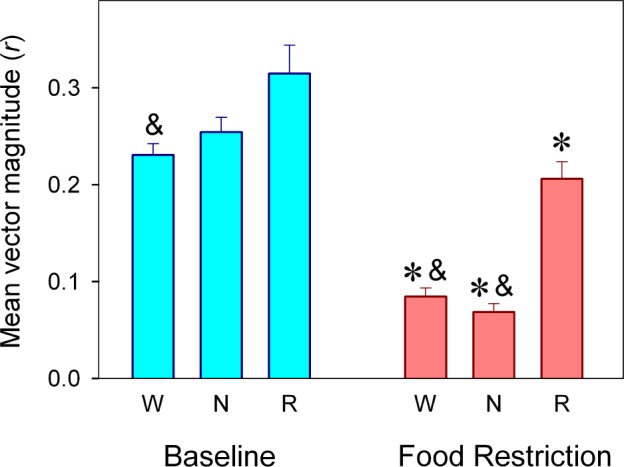
Magnitude (r) of mean vector for the sleep-wake cycle states under BL and food entrainment. Values correspond to averages r values (± SEM) obtained for wakefulness (W, n = 16 rats), NREM sleep (N, n = 16 rats), and REM sleep (R, n = 17 rats). * = P < 0.05 between conditions, according to post hoc paired t-test after significant rmANOVA; & = significant differences vs. REM sleep within condition, according to Holm-Bonferroni-corrected paired t-test. See text for statistical details.
Sleep-Wake Cycle States during the Food-Anticipatory Activity Interval
Figure 5 provides a closer look at the interval preceding the scheduled feeding window under FR (ZT 0–ZT 4). Compared to BL conditions, the temporal pattern adopted by each of the states and the REM/TST ratio under FR conditions exhibited a characteristic reconfiguration (rmANOVA for “zeitgeber time”*“feeding schedule” interaction, wakefulness: F4,68 = 8.21, P < 0.001; NREM sleep: F4,68 = 8.21, P < 0.001; REM sleep F 4,68 = 11.3, P < 0.0001; and REM/TST: F4,68 = 9.99, P < 0.001). A food-anticipatory wakefulness interval under FR was demonstrated as a monotonic increase in wakefulness starting at ZT 2. As compared to BL, there was an 43.8% increment of wakefulness during the ZT 2–ZT 4 interval (paired t-test, P < 0.001). The food-anticipatory wakefulness interval (ZT 2– ZT 4) occurred at the expense of 28.1% and 51.5% decreases in NREM sleep (BL vs. FR, paired t-test, P = 0.003) and REM sleep (BL vs. FR, paired t-test, P < 0.001), respectively. The decreasing trend for NREM sleep observed during the ZT 2– ZT 4 interval mirrored that of wakefulness, with the amount of NREM-sleep at ZT 4 dropping to 52.1% of the amount at ZT 0 (P < 0.001, Holm-Bonferroni-corrected paired t-test) under FR conditions. There was a disproportionately higher loss of REM sleep during the ZT 3–ZT 4 interval, resulting in a cumulative 65.9% debt (BL vs. FR, paired t-test, P < 0.001). The selective REM sleep loss is reflected in the drop in REM/TST ratio at ZT 3–ZT 4 (13.1% vs. 6.0% under BL and FR conditions, respectively, paired t-test, P = 0.003).
Figure 5.
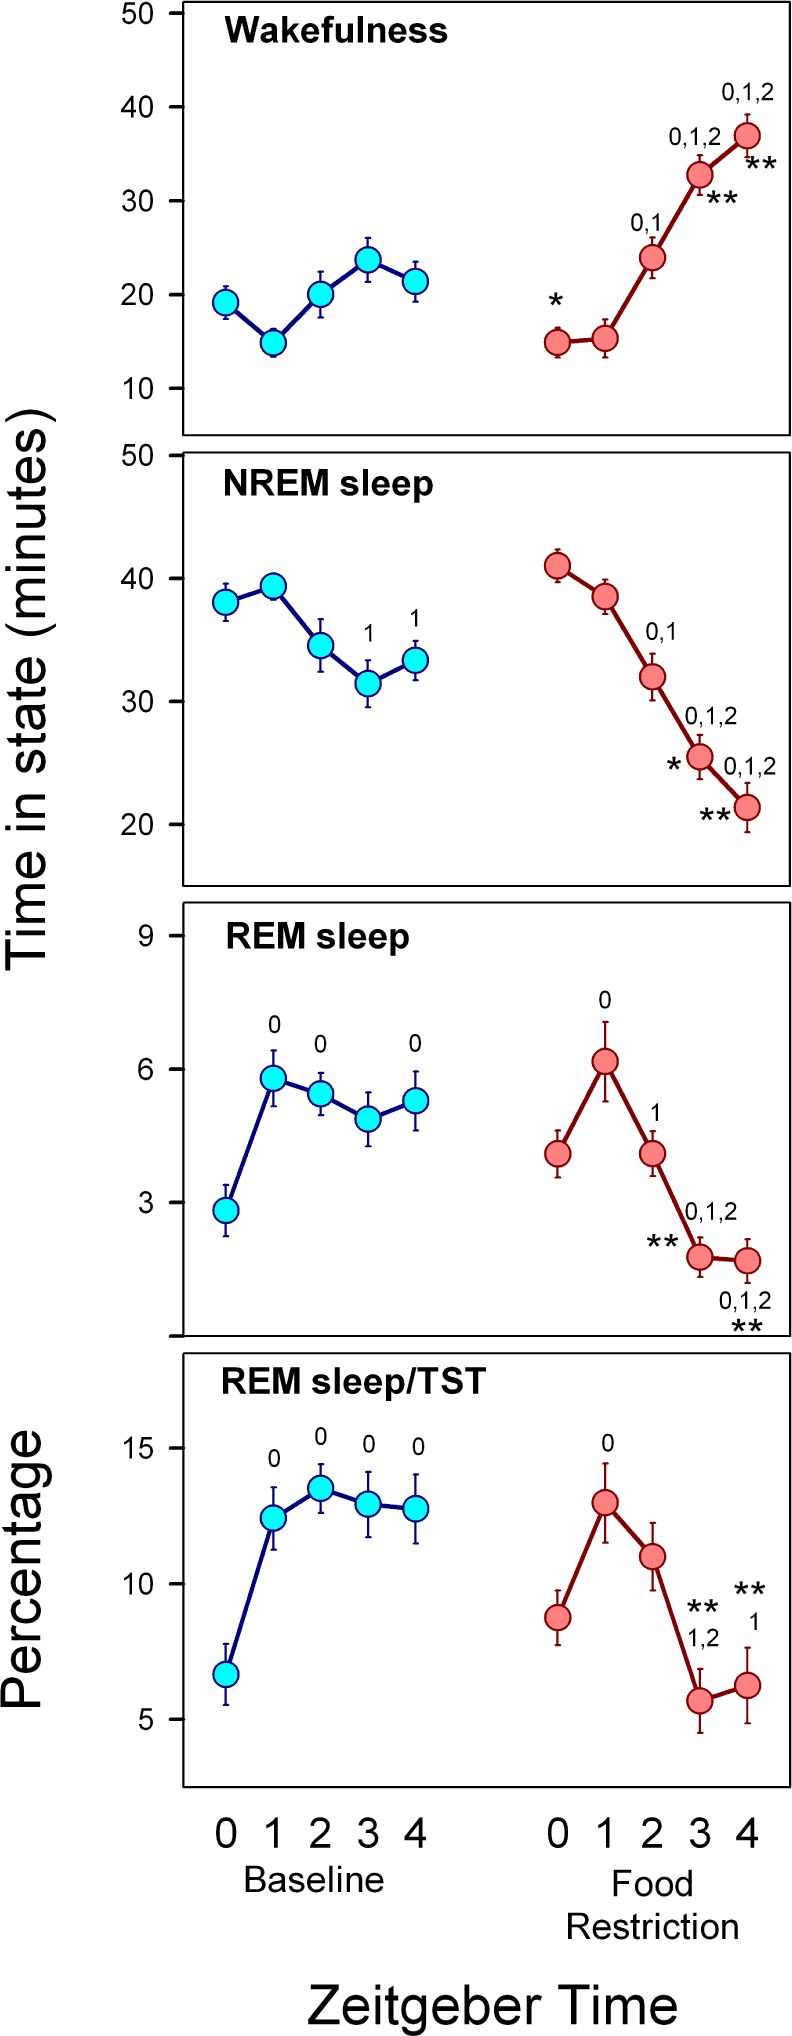
Sleep-wake states during food anticipation interval. Hourly averages (± SEM, n = 18 rats) of time in each state and REM/TST ratio during the ZT 0–ZT 4 interval under baseline (cyan symbols) and food restriction (reddish symbols) conditions. Numbers associated with the curves identify the zeitgeber time vs. which current value exhibits significant differences within the experimental condition (post hoc paired t-test indicating a significant difference according to Holm-Bonferroni correction, after significant rmANOVA). * = P < 0.01 paired t-test between conditions at the corresponding zeitgeber time.
REM Sleep Propensity Parameters under Steady-State Food Entrainment
A direct consequence of the FR protocol was the negative balance of diurnal REM sleep vs. BL that progressed throughout the light phase (Figure 6). REM sleep debt increased monotonically during the feeding window and reached its maximum at ZT 11 (one-way rmANOVA for factor “zeitgeber time,” F 23 = 26.8, P < 0.001). A gradual return to baseline levels of cumulative REM sleep by ZT 17 was observed during the dark phase. The buildup of REM sleep debt occurred within the 6-h interval that started at ZT 3 and included the food-anticipatory wake interval and the entire scheduled feeding window. REM sleep debt amounted to 21.1 min at ZT 9, corresponding to 59.4% of the REM sleep accumulated under BL conditions at the corresponding zeitgeber time (paired t-test, P < 0.001). The REM/ TST ratio was lower during FR vs. BL throughout most of the ZT 3–ZT 10 period, with the situation partially reversed during the dark phase at ZT 13, ZT 17, and ZT 22 (rmANOVA for “zeitgeber time”*“feeding schedule” interaction, F23,362 = 6.86, P < 0.001, Figure 6). The decreased REM/ TST ratio was associated with a significant decrease in the transition index during the light phase, in particular during the ZT 1–ZT 8 interval under FR conditions (rmANOVA for “zeitgeber time”*“feeding schedule” interaction, F11,182 = 9.00, P < 0.001, Figure 6). During the dark phase, the transition index increased by an average of 0.20 vs. BL (paired t test, P = 0.024). There were no significant differences for consolidation rate between BL and FR conditions (rmANOVA for factors “zeitgeber time,” “feeding schedule,” or interaction).
Figure 6.
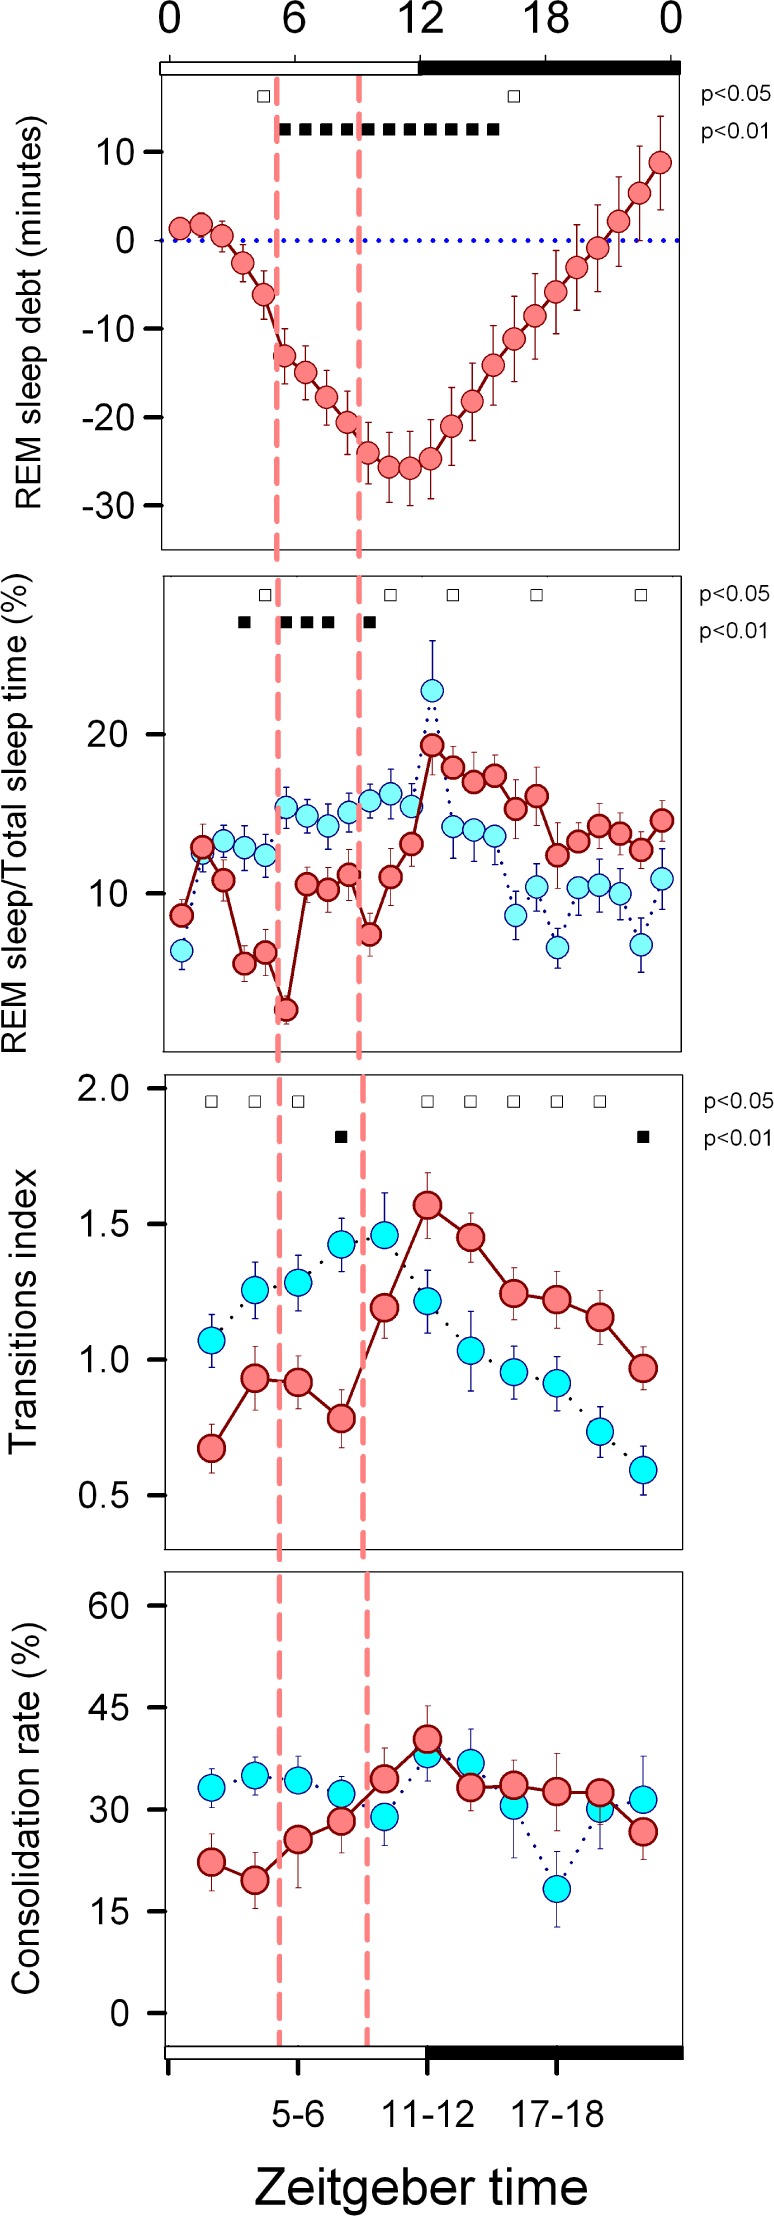
Homeostatic and propensity parameters of REM sleep. Symbols represent hourly (REM sleep debt and REM/TST ratio) or 2-h (Transition index and Consolidation rate) averages (± SEM) obtained for 18 animals under baseline (cyan circles) or FR conditions (reddish circles). Filled and open squares under upper abscissa indicate significant differences vs. baseline (2-tailed paired t-test after significant rmANOVA). Vertical dashed lines delimit the food availability window (ZT 5:00–ZT 8:59). The 2-h block at ZT 23–0 was omitted from the transition index and consolidation rate graphs.
Sleep-Wake Cycle States after a Phase Advance of the Food-Restriction Protocol
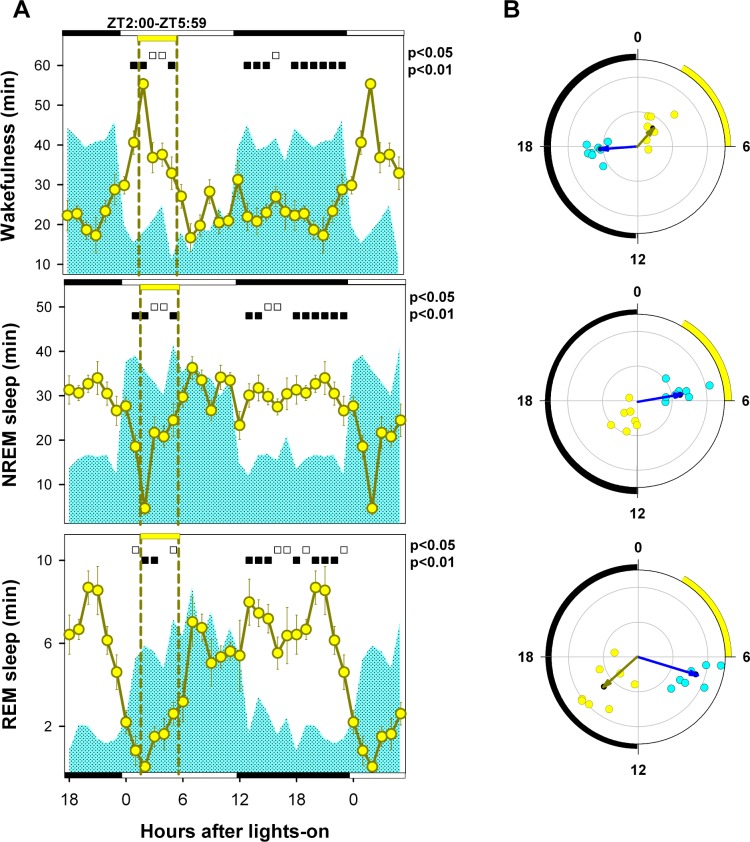
Figure 7 presents data for 8 animals that completed at least 9 days of data recording after a 3-h phase advance of the scheduled feeding window, from ZT 5–8:59 (FR condition) to ZT 2–5:59 (A-FR condition). A significant reduction of total time in wakefulness was observed under A-FR vs. BL conditions (646.6 vs. 719.3 minutes, respectively, Holm-Bonferroni-corrected paired t-test, P = 0.011; oneway rmANOVA for factor “feeding schedule”, wakefulness: F 2,14 = 23.46, P < 0.001) but no significant changes were observed for NREM (670.2 vs. 613.5, P = 0.096) or REM sleep (122.8 vs. 98.4, P = 0.131).
Figure 7.
Three-hour phase advance of food-restriction protocol. (A) Values correspond to the hourly mean time (± SEM) of the state obtained for 8 animals under BL (cyan area) and recorded for at least one week after the phase advance of the scheduled feeding window (A-FR, yellow circles). Open squares under upper abscissa indicate significant differences with respect to BL (2-tailed paired t-test after significant 2-way rmANOVA). Horizontal white and black bars illustrate photoperiodic conditions. Yellow horizontal bar under upper abscissa and vertical dashed lines indicate the timing of the feeding window under A-FR. (B) Blue and yellow arrows correspond to BL and A-FR mean vectors. Cyan (BL) and reddish (A-FR) dots correspond to individual acrophases averaged for the corresponding vector. Note that the NREM sleep vector under A-FR is not significant. Radial ordinate corresponds to the magnitude (r) of the mean vector (total radius = 0.5). Yellow arc indicates the feeding interval in its advanced position.
When compared to BL (Figure 7A), the advanced feeding schedule had a strong effect on the mean curves of the sleep-wake states (two-way rmANOVA for “zeitgeber time”*“feeding schedule” interaction, wakefulness: F23,161 = 16.29, P < 0.001; NREM sleep F23,161 = 15.82, P < 0.001; REM sleep: F23,161 = 11.26, P < 0.001). As observed for the FR condition (Figure 3A), a food-anticipatory wakefulness interval associated with significant reductions in NREM and REM sleep is evident under A-FR vs. BL conditions at ZT 1. There were also significant differences in mean angle under BL and A-FR conditions for wakefulness (ZT 17.7 vs. ZT 2.6, parametric test for paired samples of angles, F = 56.7, P < 0.0005, n = 8) and REM sleep (ZT 7.1 vs. ZT 15.3, parametric test for paired samples of angles, F = 30.3, P < 0.001, n = 8). The mean angle for NREM sleep under the A-FR condition was not significant (one-sample second-order Hotelling test, F = 0.82, P > 0.05), and the BL mean angle was ZT 5.5 (Figure 7B).
Coupling of the Sleep-Wake Cycle to the Feeding Schedule
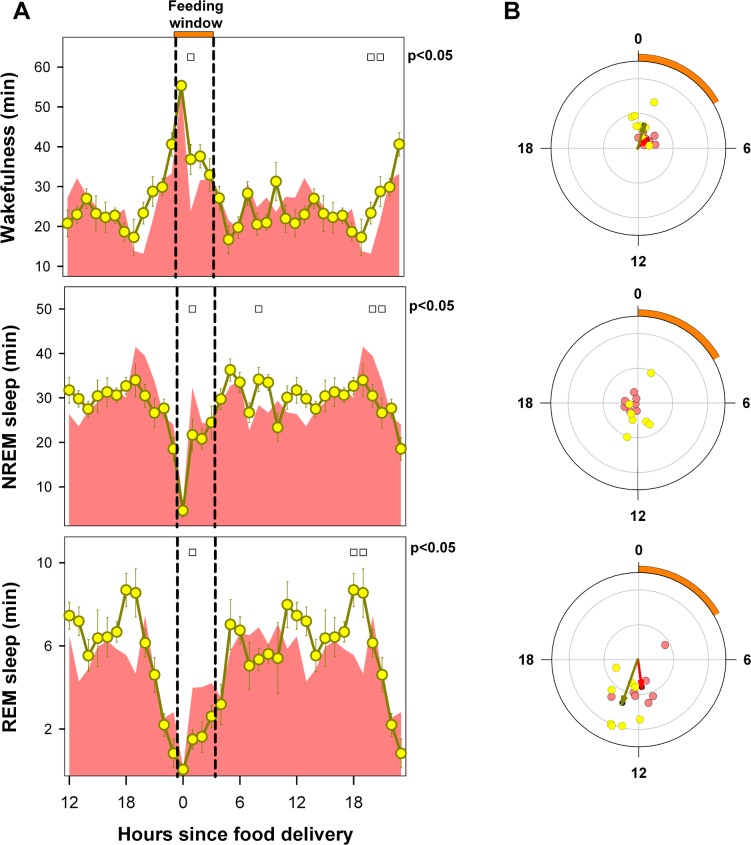
When aligned according to feeding time (FT), there was a close match between FR and A-FR for the mean curves by state (Figure 8A), with minor and sporadic differences (twoway rmANOVA interaction of factors “feeding time” and “feeding schedule”; wakefulness: F23,161 = 1.89, P = 0.022; NREM sleep: F23,161 = 2.07, P = 0.013; REM sleep: F23,161 = 2.12, P = 0.012). No differences were observed between the mean angles (Figure 8B) for wakefulness (FT 3.0 under FR vs. FT 0.8 under A-FR, parametric test for paired samples of angles, P > 0.05, n = 8) and REM sleep (FT 11.6 under FR vs. FT 13.4 under A-FR, parametric test for paired samples of angles, P > 0.05, n = 7). NREM sleep under FR displayed a mean angle of FT 17.6, but under A-FR there was no significant phase preference (one-sample second-order Hotelling test, P > 0.05).
Figure 8.
Mean curves of sleep-wake states under FR (reddish area) and A-FR (yellow circles) conditions. Values correspond to the hourly mean time of the state (± SEM) obtained for 8 animals that completed at least 9 days of the FR and A-FR protocols. (A) Data are aligned according to feeding time (orange horizontal bar at upper abscissa and vertical dashed lines). Open squares under upper abscissa indicate significant differences between protocols (P < 0.05, 2-tailed paired t-test after significant 2-way rmANOVA). (B) Red and yellow arrows correspond to FR and A-FR mean vectors. Reddish (FR) and yellow (AFR) dots correspond to individual acrophases averaged for the corresponding vector. Note that the NREM sleep vector under A-FR is not significant. Radial ordinate corresponds to the magnitude (r) of mean vector (total radius = 0.5). Orange arc indicates the feeding interval starting at feeding time 0.
NREM Sleep Slow Wave Activity under FR and after A-FR
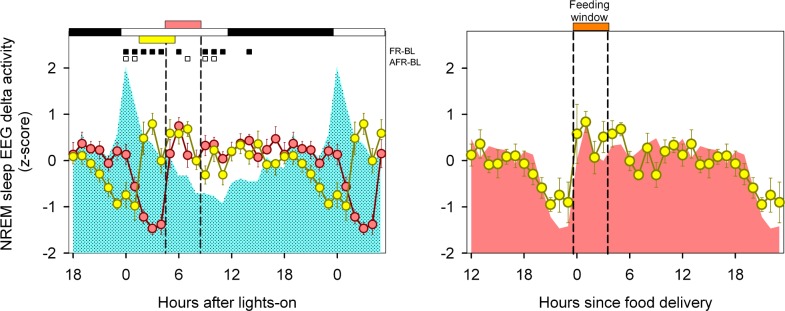
Mean curves of normalized NREM sleep EEG delta power density were obtained for BL, FR, and A-FR conditions. Only consolidated (> 2-min) NREM sleep episodes were included for statistical analysis. Mean curve profiles were compared by photic zeitgeber time (two-way rmANOVA for “zeitgeber time”*“feeding schedule” interaction, F46,313 = 6.6, P = 0.006). Normalized NREM sleep EEG delta power densities under A-FR displayed similar profiles to those obtained under FR, advanced by 3 h. Under both FR and A-FR, there was a drastic reduction in the normalized NREM sleep EEG delta density prior to the feeding window with an immediate increase after food delivery (Figure 9A). In Figure 9B, the mean curves for normalized NREM sleep delta power under FR and A-FR were superimposed according to feeding time, and no significant differences were detected (two-way rmANOVA for “feeding time”*“feeding schedule” interaction, F23,157 = 0.99, P = 0.426).
Figure 9.
Normalized NREM sleep EEG delta activity. (A) Mean curves of normalized NREM sleep delta activity under BL (cyan area), FR (reddish circles), and A-FR (yellow circles), aligned according to photic zeitgeber time. Data correspond to hourly values (± SEM) obtained in 8 animals that completed at least 9 days of the FR and A-FR protocols. Significant differences vs. BL are indicated by squares under upper abscissa (P < 0.05, Holm-Bonferroni-corrected 2-tailed paired t-test after significant 2-way rmANOVA). Horizontal white and black bars indicate photoperiodic conditions. Reddish and yellow horizontal bars indicate the feeding window under FR and A-FR, respectively. (B) Mean curves for FR (reddish area) and A-FR, aligned according to feeding time (orange horizontal bar).
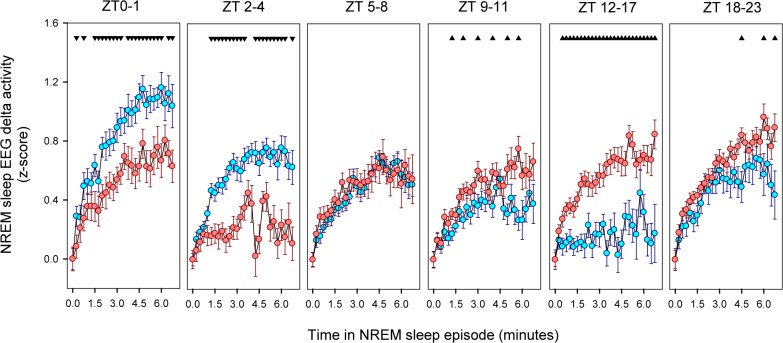
To further analyze the dynamics of NREM sleep EEG delta power density, we explored the build-up of NREM sleep delta activity within consolidated (> 2 min) NREM sleep episodes under BL and FR (Figure 10). Typically, delta activity increases from the beginning of the episode up to a final plateau after approximately 3 minutes of consolidated NREM sleep. Under BL conditions, the delta plateau level is maximal at the beginning of the light phase (ZT 0-1) declining to a minimum during the first half of the night. In contrast, the NREM sleep delta plateau under FR remains relatively stable across the LD cycle, with a notorious dampening during the food anticipatory arousal interval (ZT 2-4).
Figure 10.
Build-up of delta activity within NREM sleep episodes. Data correspond to mean (± SEM) of normalized delta activity of 18 animals under BL and FR (cyan and reddish symbols respectively) obtained at one 15-s epoch time resolution. The first unequivocal NREM sleep epoch of the episode was considered zero level. Data were analyzed within 6 blocks defined for its biological significance: ZT 0–1, before Food Anticipatory Interval; ZT 2–4, Food Anticipatory Interval; ZT 5–8, food availability window; ZT 9-11, from end of food availability window to lights-off; ZT 12–17, first half of dark phase; and ZT 18–23, second half of dark phase. Up and down arrowheads indicate higher or lower values respect to BL (paired t-test comparisons, P < 0.05, after 2-way rmANOVA for factors epoch and protocol within each block).
DISCUSSION
The food restriction protocol we chose was in line with the bulk of reports on food entrainment in rats.13 Data show that rats subjected to scheduled FR can anticipate a daily meal at any time of day31; nevertheless, most studies on food entrainment have been performed by restricting food during the rest phase (the light phase, for nocturnal species) when the activity bout associated with food anticipation can be unequivocally detected. In our study, the sleep-wake cycle was analyzed before and after steady-state food entrainment and after resynchronization to a phase advance of the feeding schedule.
Food Entrainment and Anticipation of Arousal
The FAA phenomenon is the accepted marker of the FEO11 and has been measured by several procedures including wheel-running, locomotor activity, body temperature, and lever pressing.12,31 In our design, activity was measured by means of nuchal electromyogram (EMG). We also obtained continuous polysomnographic recordings in seven animals throughout the BL and FR periods. FAA was estimated by visual inspection of the EMG epochs, depicted in individual raster plots. The whole sample completed the experiment and showed gradual and consistent anticipatory EMG activity increases during the first week of the FR protocol (Figure 1A). The temporal profile of EMG activity obtained under FR (Figure 1D) closely parallels that of wakefulness with a robust anticipatory interval observed during the second week of scheduled FR (Figure 3). A detailed analysis within feeding condition demonstrate that in coincidence with the monotonic increase in wakefulness and NREM sleep decrease, there was a 2-hour interval of selective suppression of REM sleep as evidenced by the reduction in REM/ TST ratio (Figure 5). Coincidently, the probability of NREM-to-REM sleep transitions (Figure 6) and normalized NREM sleep EEG slow wave activity was also affected prior to scheduled feeding (Figure 9 and Figure 10).
Documented sleep- and waking-state anticipatory phenomena associated with food entrainment in the rat are scarce and difficult to interpret. Sleep studies under FR protocols in rats have been performed by means of 12-hour meal intervals.32–34 In one report, the experimental procedure consisted of simultaneous food and water restriction, with a finding of increased wakefulness one hour prior to the diurnal meal interval.33 In this case, the results may be influenced by complex interactions between factors for which the experiments did not control, given that factors such as water deprivation may directly affect the sleep-wake state profiles.35 One obstacle to interpreting food entrainment results obtained under 12:12 eat-fast cycles is that this protocol is considered a weak zeitgeber, as it fails to produce FAA.36 In fact, none of the above-mentioned reports documented the presence of FAA.
Our results are consistent with anticipatory polysomno-graphic phenomena observed in mice subjected to effective food entrainment. When four-hour meals were timed during the light phase, reduced REM sleep expression one hour prior to diurnal meal timing has been reported.37,38 Similarly, suppression of NREM sleep delta activity occurs several hours prior to the diurnal meal.38 The similarity of neurophysiological phenomena observed in our rats and those documented in mouse experiments suggests that, at least within murid species, there is a common neurobiological substrate for the output that couples the FEO to sleep-wake state generators and sustains the FAA. The FAA appears to be the expression of a complex anticipatory arousal process that, along with stimulating active wakefulness, involves the interference of NREM-to-REM sleep transitions and the occurrence of the deepest stages of NREM sleep.
Phase Preference of the Sleep-Wake Cycle States under Food Entrainment
With respect to baseline, minor deviations were observed in the mean curves of the sleep-wake cycle under FR before the emergence of FAA (Figure 2A). Polysomnographic data obtained during days 2-4 after beginning the FR showed mostly reactive increases in wakefulness related to food delivery and removal, at ZT 5 and ZT 8, respectively. Circular statistics demonstrate no significant changes in the acrophases of wakefulness and NREM sleep (Figure 2B). Individual REM sleep acrophases exhibit high dispersion and loss of a significant mean vector, reflecting the uncoordinated increase in nocturnal REM sleep observed within the sample (Figure 2B). Moderate increases in nocturnal REM sleep have been reported in rats recorded during a short-term protocol of meals restricted to the light phase, without a defined phase preference according to cosinor rhythmometry.34 Increases in nocturnal REM sleep several days prior to the emergence of FAA have been also observed in mice.38 Early adjustments of the REM sleep phase preference, before the emergence of the FAA, may reflect the asynchronous coupling of several physiologic processes to the FEO, as has been also observed for peripheral oscillators.39,40
There is a clear effect of food entrainment on the temporal profiles and mean angles of sleep-wake states after one week of FR (Figure 3). The most notable effects were the food-anticipatory arousal interval, the nocturnal transposition of REM sleep, and the dampening of the 24-hour modulation of the states vs. BL. There was an important decrease in the magnitude of the acrophase vectors of wakefulness and NREM sleep, with 63.3% and 70.0% reductions, respectively, in contrast to the moderate 34.5% decrease in REM sleep (Figure 4). The displacement of the wakefulness mean angle to the light phase is fueled by the diurnal activity related to food anticipation and feeding, with the NREM sleep mean angle mirroring that of wakefulness. Circular statistics demonstrate a 9.9-h clockwise displacement in the phase preference of REM sleep under steady-state food entrainment (Figure 3). Our results are in line with long-term FR experiments that reported decreased amplitudes for wakefulness and NREM sleep modulation and increased nocturnal REM sleep when meals were restricted to the light phase.32,41,42
Coupling of the Sleep-Wake Cycle to the FEO
After achieving stable food entrainment under FR, we shifted the feeding window from ZT 5-8 (FR) to ZT 2-5 (A-FR). Once rats were re-entrained to the advanced feeding schedule, it was apparent that the sleep-wake cycle profile observed under A-FR was advanced by three hours vs. FR (Figure 3 and 7). When aligned according to feeding time, there was a close match between FR and A-FR for wakefulness, NREM sleep and REM sleep mean curves. In particular, food-anticipatory arousal phenomena, such as the increase in wakefulness that mirrors the monotonic decrease in NREM sleep along with suppression of REM sleep (Figure 8A), and the relative dampening of NREM sleep delta-wave activity, remains strongly phase-locked to feeding time (Figure 9B). To further document the coupling process between FEO and the sleep-wake cycle, we estimated the phase relationship between the eat-fast cycle and the acrophase of the states. When aligned according to feeding time, no significant differences were observed for wakefulness or REM sleep acrophases under FR vs. A-FR (Figure 8B), supporting that a stable phase relationship between the eat-fast cycle and the timing of sleep-wake states is established when meals are circumscribed to the first half of the light phase.
REM Sleep Propensity under Food Entrainment
Apparent REM sleep debt under FR increased during the whole light phase and returned to baseline values during the night (Figure 6). There was an absolute shortage of 21.1 minutes of REM sleep vs. BL between ZT 3 and ZT 8, equivalent to nearly four hours of REM sleep deprivation. As the daily quota of REM sleep was unaffected, it could be hypothesized that the observed nocturnal phase preference for REM sleep under FR is the result of homeostatic compensation of the state, where the forced intrusion of wakefulness occurring prior to and simultaneously with the diurnal feeding window depletes diurnal REM sleep, triggering a compensatory nocturnal REM sleep rebound.
Our results, however, do not support a homeostatic explanation for the observed nocturnal phase preference of REM sleep, as propensity parameters did not parallel the buildup of apparent REM sleep debt under FR. The transition index remained below BL values during the entire light phase, including the time when apparent REM sleep debt was maximal, at ZT 10-11 (Figure 6). The observed diurnal increase in apparent REM sleep debt would also affect the REM/ TST ratio, as increased REM sleep pressure favors the overrepresentation of REM sleep within sleep episodes.43 As observed in Figure 6, the REM/ TST ratio was reduced vs. BL during the light phase and modestly increased three hours after REM sleep debt reached its maximum (ZT 13). Increased REM sleep propensity due to sleep deprivation has been also reported to increase the consolidation of REM sleep episodes, reflected in an increased consolidation rate.24 As depicted in Figure 6, the consolidation rate of REM sleep episodes was unaffected when compared to BL throughout the light-dark cycle.
We propose that the most parsimonious interpretation of our data is that under food entrainment, the timing of REM sleep is coupled to the output of the FEO, which assigns a minimal quota for the state in coincidence with the expected meal interval, and a major portion of REM sleep is displaced in phase opposition vs. the food-anticipatory arousal interval as indicated by the estimated REM sleep acrophase when aligned according to feeding time (Figure 8). The lack of detectable homeostatic response occurring during the light phase under FR is equivalent to the absence of a REM sleep rebound in response to selective REM sleep deprivation observed in humans,44 rats,45 and degus,30 when selective REM sleep deprivation is timed during the active phase.
EEG Delta Activity under Food Entrainment
The dependence of NREM sleep EEG delta power on previous wakefulness and sleep history has been thoroughly documented and modeled in humans21,46 and other mammalian species, including the rat.22,47 Excluding pharmacological or specific environmental interventions (reviewed for rats in22), the expression of NREM sleep EEG delta activity rises progressively as a function of waking time, and decreases during sustained NREM sleep episodes, a phenomenon that has been attributed to an underlying wake-NREM sleep dependent hourglass or homeostatic process.21,46–48
The NREM sleep delta EEG data presented in this report were normalized by means of a z-score procedure, applied on daily basis. This means that caution should be taken when comparing BL, FR and A-FR spectral values as they reflect the relative activity within feeding condition. The prolonged intervals of wakefulness that we observed during the food-anticipatory arousal interval would allow us to predict a relative increase in EEG delta activity in NREM sleep episodes occurring during this period. In contrast, our rats exhibited a paradoxical dampening of normalized NREM sleep EEG slow-wave density in anticipation to scheduled meals (Figure 9A).
The relative dampening of NREM sleep EEG delta power appears to be phase locked to the zeitgeber food, as was observed under FR and A-FR protocols when NREM sleep EEG delta activity was aligned to feeding time (Figure 9B), suggesting that NREM sleep EEG delta activity is under the modulation of the output of the food entrained circadian system. Evidences of a weak interaction between circadian modulation of NREM sleep EEG delta activity have been obtained in humans48–50 and animal models (mice,51 rats,52–54 and degus55), when the dominating circadian output is supposed to be coupled to the hypothalamic LEO.9,18,21 An accurate description of the NREM sleep homeostatic process in the rat was proposed by Deboer.52 According to his model, the final plateau of the delta build-up process (upper asymptote), which is reached after 3 minutes since the beginning of the NREM sleep episode, is a confident reporter of the process S. The lower normalized delta values that characterize the plateau during the food anticipatory arousal interval (Figure 10) further support that the NREM sleep hourglass process is interfered by food entrainment. The notorious decrease of NREM sleep slow wave activity during the food-anticipatory arousal interval suggests that there is a singular interaction between the circadian output under food entrainment and the wake-NREM sleep hourglass mechanism.
In sum, the results presented here support the hypothesis that under food entrainment, the temporal organization of wakefulness, NREM sleep and REM sleep is coupled to the food-entrainable oscillator. Considering that sleep-wake cycle executive mechanisms are thoroughly distributed among high-ranking regulatory neural circuits,19,56 food entrainment should involve a radical reconfiguration of the circadian system. The coupling of NREM sleep EEG delta activity to the circadian food-entrainable oscillator was an unexpected outcome that may characterize the food-entrained operation mode of the circadian system.
DISCLOSURE STATEMENT
This was not an industry supported study. Funding for this study was provided by Grant Fondecyt 1100245. Dr. Javiera Castro was supported by a fellowship from the National Council of Science and Technology (CONICYT Chile) and a fellowship of Guillermo Puelma Foundation. The authors have indicated no financial conflicts of interest. The work was performed at the Laboratorio de Sueño y Cronobiología, Programa de Fisiología y Biofísica, Instituto de Ciencias Biomédicas, Facultad de Medicina, Universidad de Chile, Santiago, Chile.
ACKNOWLEDGMENTS
Thanks are due to Christian López for excellent animal care and Jorge Estrada for helping in experimental procedures.
REFERENCES
- 1.Willie JT, Chemelli RM, Sinton CM, Yanagisawa M. To eat or to sleep? Orexin in the regulation of feeding and wakefulness. Annu Rev Neurosci. 2001;24:429–58. doi: 10.1146/annurev.neuro.24.1.429. [DOI] [PubMed] [Google Scholar]
- 2.Beccuti G, Pannain S. Sleep and obesity. Curr Opin Clin Nutr Metab Care. 2011;14:402–12. doi: 10.1097/MCO.0b013e3283479109. [DOI] [PMC free article] [PubMed] [Google Scholar]
- 3.Van Cauter E, Spiegel K, Tasali E, Leproult R. Metabolic consequences of sleep and sleep loss. Sleep Med. 2008;9:S23–8. doi: 10.1016/S1389-9457(08)70013-3. [DOI] [PMC free article] [PubMed] [Google Scholar]
- 4.Davies SK, Ang JE, Revell VL, et al. Effect of sleep deprivation on the human metabolome. Proc Natl Acad Sci U S A. 2014;111:10761–6. doi: 10.1073/pnas.1402663111. [DOI] [PMC free article] [PubMed] [Google Scholar]
- 5.Möller-Levet CS, Archer SN, Bucca G, et al. Effects of insufficient sleep on circadian rhythmicity and expression amplitude of the human blood transcriptome. Proc Natl Acad Sci U S A. 2013;110:E1132–41. doi: 10.1073/pnas.1217154110. [DOI] [PMC free article] [PubMed] [Google Scholar]
- 6.Peek CB, Ramsey KM, Marcheva B, Bass J. Nutrient sensing and the circadian clock. Trends Endocrinol Metab. 2012;23:312–8. doi: 10.1016/j.tem.2012.02.003. [DOI] [PMC free article] [PubMed] [Google Scholar]
- 7.Gamble KL, Berry R, Frank SJ, Young ME. Circadian clock control of endocrine factors. Nat Rev Endocrinol. 2014;10:466–75. doi: 10.1038/nrendo.2014.78. [DOI] [PMC free article] [PubMed] [Google Scholar]
- 8.Hastings M, O'Neill JS, Maywood ES. Circadian clocks: regulators of endocrine and metabolic rhythms. J Endocrinol. 2007;195:187–98. doi: 10.1677/JOE-07-0378. [DOI] [PubMed] [Google Scholar]
- 9.Dijk DJ, von Schantz M. Timing and consolidation of human sleep, wakefulness, and performance by a symphony of oscillators. J Biol Rhythms. 2005;20:279–90. doi: 10.1177/0748730405278292. [DOI] [PubMed] [Google Scholar]
- 10.Mendoza J, Gourmelen S, Dumont S, Sage-Ciocca D, Pévet P, Challet E. Setting the main circadian clock of a diurnal mammal by hypocaloric feeding. J Physiol. 2012;590:3155–68. doi: 10.1113/jphysiol.2012.230300. [DOI] [PMC free article] [PubMed] [Google Scholar]
- 11.Stephan FK. Food Entrainable Oscillators in Mammals. In: Takahashi JS, Turek FW, Moore RY, editors. Circadian clocks, handbook of behavioral neurobiology. Volume 12. New York: Kluwer Academic/ Plenum Publishers; 2001. pp. 223–46. [Google Scholar]
- 12.Mistlberger RE. Circadian food-anticipatory activity: formal models and physiological mechanisms. Neurosci Biobehav Rev. 1994;18:171–95. doi: 10.1016/0149-7634(94)90023-x. [DOI] [PubMed] [Google Scholar]
- 13.Mistlberger RE. Food-anticipatory circadian rhythms: concepts and methods. Eur J Neurosci. 2009;30:1718–29. doi: 10.1111/j.1460-9568.2009.06965.x. [DOI] [PubMed] [Google Scholar]
- 14.Mistlberger RE. Neurobiology of food anticipatory circadian rhythms. Physiol Behav. 2011;104:535–45. doi: 10.1016/j.physbeh.2011.04.015. [DOI] [PubMed] [Google Scholar]
- 15.Carneiro BT, Araujo JF. The food-entrainable oscillator: a network of interconnected brain structures entrained by humoral signals? Chronobiol Int. 2009;26:1273–89. doi: 10.3109/07420520903404480. [DOI] [PubMed] [Google Scholar]
- 16.Stephan FK. Limits of entrainment to periodic feeding in rats with suprachiasmatic lesions. J Comp Physiol. 1981;143:401–10. [Google Scholar]
- 17.Escobar C, Cailotto C, Angeles-Castellanos M, Salgado Delgado R, Buijs RM. Peripheral oscillators: the driving force for food-anticipatory activity. Eur J Neurosci. 2009;30:1665–75. doi: 10.1111/j.1460-9568.2009.06972.x. [DOI] [PubMed] [Google Scholar]
- 18.Mistlberger RE. Circadian regulation of sleep in mammals: Role of the suprachiasmatic nucleus. Brain Res Rev. 2005;49:429–54. doi: 10.1016/j.brainresrev.2005.01.005. [DOI] [PubMed] [Google Scholar]
- 19.Saper CB, Chou TC, Scammell TE. The sleep switch: hypothalamic control of sleep and wakefulness. Trends Neurosci. 2001;24:726–31. doi: 10.1016/s0166-2236(00)02002-6. [DOI] [PubMed] [Google Scholar]
- 20.Saper CB, Lu J, Chou TC, Gooley J. The hypothalamic integrator for circadian rhythms. Trends Neurosci. 2005;28:152–7. doi: 10.1016/j.tins.2004.12.009. [DOI] [PubMed] [Google Scholar]
- 21.Borbély AA, Achermann P. Sleep homeostasis and models of sleep regulation. J Biol Rhythms. 1999;14:557–68. doi: 10.1177/074873099129000894. [DOI] [PubMed] [Google Scholar]
- 22.Deboer T. Meerlo P, Benca RM, Abel T, editors. Behavioral and electrophysiological correlates of sleep and sleep homeostasis. Springer-Verlag Berlin Heidelberg, Curr Top Behav Neurosci. 2015;25:1–24. doi: 10.1007/7854_2013_248. [DOI] [PubMed] [Google Scholar]
- 23.Parmeggiani PL, Cianci T, Calasso M, Zamboni G, Perez E. Quantitative analysis of short term deprivation and recovery of desynchronized sleep in cats. Electroencephalogr Clin Neurophysiol. 1980;50:293–302. doi: 10.1016/0013-4694(80)90157-1. [DOI] [PubMed] [Google Scholar]
- 24.Franken P. Long-term vs. short-term processes regulating REM sleep. J Sleep Res. 2002;11:17–28. doi: 10.1046/j.1365-2869.2002.00275.x. [DOI] [PubMed] [Google Scholar]
- 25.Amici R, Cerri M, Ocampo-Garcés A, et al. Cold exposure and sleep in the rat: REM sleep homeostasis and body size. Sleep. 2008;31:708–15. doi: 10.1093/sleep/31.5.708. [DOI] [PMC free article] [PubMed] [Google Scholar]
- 26.Ocampo-Garcés A, Ibáñez F, Perdomo G, Torrealba F. Orexin-B-saporin lesions in the lateral hypothalamus enhance photic masking of rapid eye movement sleep in the albino rat. J Sleep Res. 2011;20:3–11. doi: 10.1111/j.1365-2869.2010.00864.x. [DOI] [PubMed] [Google Scholar]
- 27.Vivaldi EA, Wyneken U, Roncagliolo M, Ocampo A, Zapata AM. Measures of location and dispersion of sleep state distributions within the circular frame of a 12:12 light:dark schedule in the rat. Sleep. 1994;17:208–19. doi: 10.1093/sleep/17.3.208. [DOI] [PubMed] [Google Scholar]
- 28.Zar JH. Biostatistical analysis. 4th ed. Englewood Cliffs: Prentice-Hall; 1999. [Google Scholar]
- 29.Ocampo-Garcés A, Molina E, Rodríguez A, Vivaldi E. Homeostasis of REM sleep after total and selective sleep deprivation in the rat. J Neurophysiol. 2000;84:2699–702. doi: 10.1152/jn.2000.84.5.2699. [DOI] [PubMed] [Google Scholar]
- 30.Ocampo-Garcés A, Hernández F, Palacios AG. REM sleep phase preference in the crepuscular Octodon degus assessed by selective REM sleep deprivation. Sleep. 2013;36:1247–56. doi: 10.5665/sleep.2896. [DOI] [PMC free article] [PubMed] [Google Scholar]
- 31.Petersen CC, Patton DF, Parfyonov M, Mistlberger RE. Circadian food anticipatory activity: entrainment limits and scalar properties re-examined. Behav Neurosci. 2014;128:689–702. doi: 10.1037/bne0000017. [DOI] [PubMed] [Google Scholar]
- 32.Bodosi B, Gardi J, Hajdu I, Szentirmai E, Obal F, Jr, Krueger JM. Rhythms of ghrelin, leptin, and sleep in rats: effects of the normal diurnal cycle, restricted feeding, and sleep deprivation. Am J Physiol Regul Integr Comp Physiol. 2004;287:R1071–9. doi: 10.1152/ajpregu.00294.2004. [DOI] [PubMed] [Google Scholar]
- 33.Roky R, Kapás L, Taishi P, Fang J, Krueger J. Food restriction alters the diurnal distribution of sleep in rats. Physiol Behav. 1999:67, 697–703. doi: 10.1016/s0031-9384(99)00137-7. [DOI] [PubMed] [Google Scholar]
- 34.Wiater MF, Mukherjee S, Li AJ, et al. Circadian integration of sleep-wake and feeding requires NPY receptor expressing neurons in the mediobasal hypothalamus. Am J Physiol Regul Integr Comp Physiol. 2011;301:R1569–83. doi: 10.1152/ajpregu.00168.2011. [DOI] [PMC free article] [PubMed] [Google Scholar]
- 35.Martelli D, Luppi M, Cerri M, et al. Waking and sleeping following water deprivation in the rat. PLoS One. 2012;7:e46116. doi: 10.1371/journal.pone.0046116. [DOI] [PMC free article] [PubMed] [Google Scholar]
- 36.Stephan FK, Becker G. Entrainment of anticipatory activity to various durations of food access. Physiol Behav. 1989;46:731–41. doi: 10.1016/0031-9384(89)90359-4. [DOI] [PubMed] [Google Scholar]
- 37.Mieda M, Williams SC, Sinton CM, Richardson JA, Sakurai T, Yanagisawa M. Orexin neurons function in an efferent pathway of a food-entrainable circadian oscillator in eliciting food- anticipatory activity and wakefulness. J Neurosci. 2004;24:10493–501. doi: 10.1523/JNEUROSCI.3171-04.2004. [DOI] [PMC free article] [PubMed] [Google Scholar]
- 38.Szentirmai E, Kapás L, Sun Y, Smith RG, Krueger JM. Restricted feeding-induced sleep, activity, and body temperature changes in normal and preproghrelin-deficient mice. Am J Physiol Regul Integr Comp Physiol. 2010;298:R467–77. doi: 10.1152/ajpregu.00557.2009. [DOI] [PMC free article] [PubMed] [Google Scholar]
- 39.Wu T, Jin Y, Ni Y, Zhang D, Kato H, Fu Z. Effects of light cues on re-entrainment of the food-dominated peripheral clocks in mammals. Gene. 2008;419:27–34. doi: 10.1016/j.gene.2008.04.010. [DOI] [PubMed] [Google Scholar]
- 40.Tahara Y, Shibata S. Chronobiology and nutrition. Neuroscience. 2013;253:78–88. doi: 10.1016/j.neuroscience.2013.08.049. [DOI] [PubMed] [Google Scholar]
- 41.Alvarenga TA, Andersen ML, Papale LA, Antunes IB, Tufik S. Influence of long-term food restriction on sleep pattern in male rats. Brain Res. 2005;1057:49–56. doi: 10.1016/j.brainres.2005.07.024. [DOI] [PubMed] [Google Scholar]
- 42.Salin-Pascual RJ, Upadhyaya U, Shiromani PJ. Effects of hypocaloric diet on sleep in young and old rats. Neurobiol Aging. 2002;23:771–6. doi: 10.1016/s0197-4580(02)00030-1. [DOI] [PubMed] [Google Scholar]
- 43.Ocampo-Garcés A, Vivaldi E. Short-term homeostasis of REM sleep assessed in an intermittent REM sleep deprivation protocol in the rat. J Sleep Res. 2002;11:81–9. doi: 10.1046/j.1365-2869.2002.00281.x. [DOI] [PubMed] [Google Scholar]
- 44.Werth E, Cote KA, Gallmann E, Borbély AA, Achermann P. Selective REM sleep deprivation during daytime I. Time course of interventions and recovery sleep. Am J Physiol Regul Integr Comp Physiol. 2002;283:R521–6. doi: 10.1152/ajpregu.00462.2001. [DOI] [PubMed] [Google Scholar]
- 45.Wurts SW, Edgar DM. Circadian and homeostatic control of rapid eye movement (REM) sleep: promotion of REM tendency by the suprachiasmatic nucleus. J Neurosci. 2000;20:4300–10. doi: 10.1523/JNEUROSCI.20-11-04300.2000. [DOI] [PMC free article] [PubMed] [Google Scholar]
- 46.Daan S, Beersma DG, Borbély AA. Timing of human sleep: recovery process gated by a circadian pacemaker. Am J Physiol. 1984;246:R161–83. doi: 10.1152/ajpregu.1984.246.2.R161. [DOI] [PubMed] [Google Scholar]
- 47.Franken P, Tobler I, Borbély AA. Sleep homeostasis in the rat: simulation of the time course of EEG slow-wave activity. Neurosci Lett. 1991;130:141–4. doi: 10.1016/0304-3940(91)90382-4. [DOI] [PubMed] [Google Scholar]
- 48.Dijk DJ. Regulation and functional correlates of slow wave sleep. J Clin Sleep Med. 2009;5(2 Suppl):S6–15. [PMC free article] [PubMed] [Google Scholar]
- 49.Dijk DJ, Czeisler CA. Contribution of the circadian pacemaker and the sleep homeostat to sleep propensity, sleep structure, electroencephalographic slow waves and sleep spindle activity in humans. J Neurosci. 1995;15:3526–38. doi: 10.1523/JNEUROSCI.15-05-03526.1995. [DOI] [PMC free article] [PubMed] [Google Scholar]
- 50.Lazar AS, Lazar ZI, Dijk DJ. Circadian regulation of slow waves in human sleep: Topographical aspects. NeuroImage. 2015;116:123–34. doi: 10.1016/j.neuroimage.2015.05.012. [DOI] [PMC free article] [PubMed] [Google Scholar]
- 51.Curie T, Mongrain V, Dorsaz S, Mang GM, Emmenegger Y, Franken P. Homeostatic and circadian contribution to EEG and molecular state variables of sleep regulation. Sleep. 2013;36:311–23. doi: 10.5665/sleep.2440. [DOI] [PMC free article] [PubMed] [Google Scholar]
- 52.Deboer T. Sleep and sleep homeostasis in constant darkness in the rat. J Sleep Res. 2009;18:357–64. doi: 10.1111/j.1365-2869.2008.00728.x. [DOI] [PubMed] [Google Scholar]
- 53.Yasenkov R, Deboer T. Interrelations and circadian changes of electroencephalogram frequencies under baseline conditions and constant sleep pressure in the rat. Neuroscience. 2011;180:212–21. doi: 10.1016/j.neuroscience.2011.01.063. [DOI] [PubMed] [Google Scholar]
- 54.Vyazovskiy VV, Achermann P, Tobler I. Sleep homeostasis in the rat in the light and dark period. Brain Res Bull. 2007;74:37–44. doi: 10.1016/j.brainresbull.2007.05.001. [DOI] [PubMed] [Google Scholar]
- 55.Kas MJ, Edgar DM. Circadian timed wakefulness at dawn opposes compensatory sleep responses after sleep deprivation in Octodon degus. Sleep. 1999;22:1045–53. doi: 10.1093/sleep/22.8.1045. [DOI] [PubMed] [Google Scholar]
- 56.Brown RE, Basheer R, McKenna JT, Strecker RE, McCarley RW. Control of sleep and wakefulness. Physiol Rev. 2012;92:1087–187. doi: 10.1152/physrev.00032.2011. [DOI] [PMC free article] [PubMed] [Google Scholar]


