Abstract
To extend our understanding of the genetic basis of human immune function and dysfunction, we performed an expression quantitative trait locus (eQTL) study of purified CD4+ T cells and monocytes, representing adaptive and innate immunity, in a multi-ethnic cohort of 461 healthy individuals. Context-specific cis- and trans-eQTLs were identified, and cross-population mapping allowed, in some cases, putative functional assignment of candidate causal regulatory variants for disease-associated loci. We note an over-representation of T cell–specific eQTLs among susceptibility alleles for autoimmune diseases and of monocyte-specific eQTLs among Alzheimer’s and Parkinson’s disease variants. This polarization implicates specific immune cell types in these diseases and points to the need to identify the cell-autonomous effects of disease susceptibility variants.
It is necessary to understand the functional consequences of disease-associated genetic variation as we strive to unravel the causal chain of events linking genetic risk factors to clinical syndromes. Because most disease-associated variants localize to noncoding regions of the genome, an initial role of their function can be inferred from their proximity to a gene and association to gene expression levels (1–6) or to epigenomic features derived from representative tissues and cell types (7, 8). Given the central role of inflammation in many diseases, we leveraged differences in the genetic structure of human populations to systematically interrogate the role of peripheral blood cell types that represent the lymphoid (CD4+ T lymphocyte) and myeloid (CD14+CD16− monocyte) arms of the immune system. These distinct programs of gene expression were profiled as part of the of Immune Variation (ImmVar) Project.
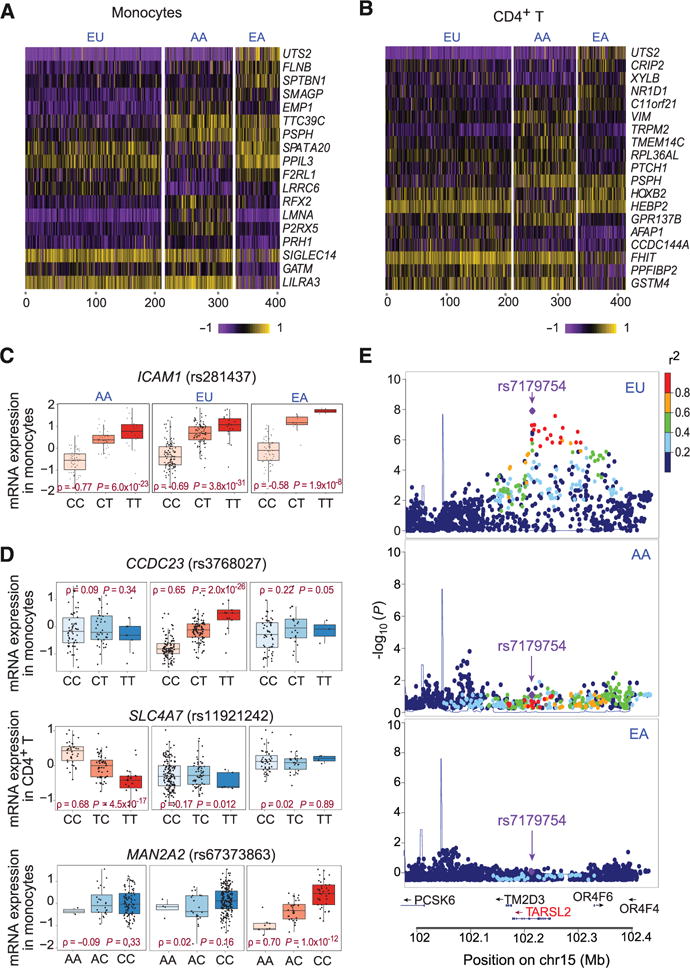
We used a rigorous sampling and cell purification protocol, minimizing circadian and experimental noise, to generate gene expression profiles from blood cells of 461 healthy individuals sampled in Boston, Massachusetts, including African Americans (AA), European Americans (EU), and East Asian Americans (EA) (Table 1, fig. S1, and table S1) (see also supplementary materials and methods). We purified naïve CD4+ CD62Lhi T cells, chosen to minimize experiential or environment-linked variation in effector/memory pools. Similarly, CD14+CD16− monocytes are a recent and short-lived cell population that is less likely to reflect an individual’s life history. We quantified the extent of differential gene expression between each pairwise combination of populations using the VST statistic for each of the 19,114 genes passing quality control (fig. S2). VST (range: 0 to 1) is similar to the fixation index (FST): It quantifies the proportion of expression-level variance explained by population-level differences (1). The low median pairwise VST estimates (ranging from 0.005 to 0.009) suggest minimal gene expression variance between populations. Nonetheless, several genes are highly differentiated (VST > 0.2; top 1% of all VST scores) in expression between pairs of human populations (Fig. 1, A and B, and tables S2 and S3).
Table 1.
Significant cis-eQTLs detected at FDR = 0.05. N/A, not applicable.
| Population | Monocyte
|
CD4+ T cell
|
Shared
|
||
|---|---|---|---|---|---|
| No. of participants | No. of genes | No. of participants | No. of genes | No. of genes | |
| European American | 211 | 3090 | 213 | 2352 | 1178 |
| African American | 112 | 1318 | 112 | 722 | 259 |
| East Asian | 78 | 1181 | 82 | 592 | 215 |
| ≥Two populations | N/A | 1352 | N/A | 739 | 328 |
| Three populations | 401 | 537 | 407 | 255 | 102 |
| Nonredundant | 401 | 3703 | 407 | 2672 | 1372 |
| Meta-analysis | 401 | 6210 | 407 | 4975 | 2789 |
Fig. 1. Transcriptome variation among human populations.

Heat map of genes that are differentially expressed (VST > 0.2) in monocytes (A) and T cells (B). (C) Example of a cis-eQTL shared across populations. (D) Examples of population-specific cis-eQTLs. (E) Regional association plots of an EU-specific cis-eQTL in the TARSL2 locus.
For each human population and cell type, we associated residual RNA expression phenotypes with genotyped or imputed (using reference haplotypes from The 1000 Genomes Project) (9) SNPs in a ±T1-Mb window around the transcription start site of each gene. Of the 19,114 genes tested in T cells, we detected 2352, 592, and 722 genes with evidence of a cis expression quantitative trait locus (eQTL) effect in EU, EA, and AA participants, respectively [false discovery rate (FDR) = 0.05] (Table 1 and tables S4 to S6). In monocytes, we detected more genes with cis-eQTLs: 3090, 1181, and 1318 in EU, EA, and AA participants, respectively (Table 1 and tables S7 to S9). Up to 70% of the genes with cis-eQTLs in monocytes replicate associations noted in a previous study (4) (fig. S3).
We used a Bayesian model average (BMA) and a hierarchical model (HM) (10) to jointly analyze the three human populations in a single framework. This method was applied separately to each cell type. With BMA-HM, we observed a high degree of cross-population sharing, with 96% [95% confidence interval (CI): 89 to 100%] and 94% (95% CI: 83 to 100%) of cis-eQTLs being shared by all three populations in monocytes and T cells, respectively (Fig. 1C). A small number of population-specific cis-eQTLs were found (Fig. 1, D and E). Using a different approach, a measure of the proportion of overlap estimated from the enrichment of low P values (π1) (11), we observe a similarly high degree of pairwise population sharing of cis-eQTLs (70 to 90%) (table S10).
The direction of allelic effect [that is, whether a given cis-eQTL is associated with an allele in the same (or opposite) direction across pairs of populations] is highly conserved: When the top single-nucleotide polymorphism (SNP)–gene pair is shared across pairs of populations, all cis-eQTLs are concordant, suggesting that causal regulatory variation generally affects gene expression in the same direction in all populations (figs. S4 and S5). Similarly, the effect size of shared cis-eQTLs is significantly correlated (Pearson’s r = 0.70 to 0.87) in each pairwise combination of populations for the same cell type (figs. S6 and S7), suggesting little population-specific modulation of eQTL effect.
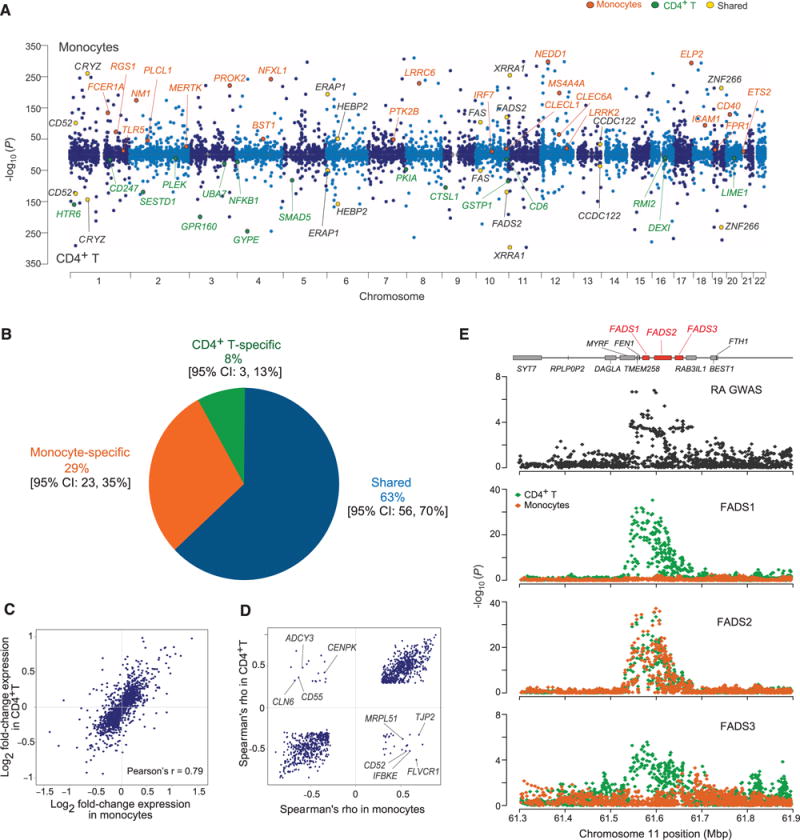
A meta-analysis maximized our power to detect cis-eQTLs in 401 participants with monocyte data and 407 with T cell data; we used a random effects model optimized to detect associations under heterogeneity (12). We detected 50% more genes with cis-eQTLs in the meta-analysis: 6210 genes in monocytes and 4975 genes in T cells (Fig. 2A and tables S11 and S12). Up to 17% of genes in monocytes and 14% of genes in T cells demonstrate multiple independent eQTL effects (figs. S8 and S9). In addition, among the genes with shared effects across populations, the number of candidate causal variants in strong linkage disequilibrium (LD) with the lead SNP was reduced by more than 50% to an average of 21.2 SNPs when an LD threshold of r2 > 0.8 with the lead SNP is considered in the meta-analysis (fig. S10).
Fig. 2. Comparison of meta-analysis results from each cell type.

(A) Manhattan plots of the most significant cis-eQTL per gene in monocytes (top) and T cells (bottom). The highlighted genes are representative of genes that (i) are shared, (ii) are cell-specific, or (iii) overlap with a disease association. (B) Inference of the proportion of cis-eQTL sharing between the two cell types using a Bayesian hierarchical model. (C) Expression-level fold-change for the most significant cis-eQTLs in T cells and monocytes. (D) Spearman’s ρ (direction of allelic effect on gene expression) for the most significant cis-eQTLs shared by the two cell types. We highlight genes that have discrepant directions of effect. (E) Example of a context-specific cis-eQTL in a rheumatoid arthritis locus. Mbp, megabase pairs.
To identify trans-eQTLs in which a SNP is associated with expression of a distal gene (>1 Mb from the SNP or on a different chromosome), we performed a trans-eQTL meta-analysis in our data. At a conservative Bonferroni-corrected threshold of P < 3 × 10⁻¹², we identified 482 trans-eQTL associations (427 are interchromosomal) involving 55 genes specific to monocytes, 31 genes specific to T cells, and 4 genes shared by both cell types (figs. S11 and S12 and tables S13 and S14). Our results support the existence of trans-eQTLs, but their mechanism remains largely unknown.
We assessed the proportion of cell type–specific cis-eQTLs with BMA-HM (10) and estimated that 29% of cis-eQTLs are specific to monocytes, whereas 8% are specific to T cells, with 63% shared across cell types (Fig. 2B). Using a different approach that estimates the likelihood of eQTL rediscovery (11), we obtain similar estimates of sharing: π1 = 69, 68, and 62% in the EU, AA, and EA participants (table S15). With reference epigenomic data from the ENCODE project (13), the cell type–specific cis-eQTLs were relatively enriched (quantified by relative risk) in the histone marks and deoxyribonuclease (DNase) I sites derived from the pertinent cell type (fig. S13). For instance, Tcell–specific cis-eQTLs were more likely to coincide with DNase I sites derived from naïve CD4+ T cells than from monocytes. This confluence of epigenomic annotations and functional analysis results strengthens the interpretation of such epigenomic annotations, which are inferred to relate to functional effects of given variants.
We went on to examine whether cis-eQTLs shared across cell types have similar direction and effect sizes. The comparison of the effect size for an eQTL (most significant SNP per gene) in the two cell types (Fig. 2C) showed concordance in effect size for most eQTLs (Pearson’s r = 0.79). However, in 42 genes, the most significant SNP was associated with discordant directional effects across cell types: The allele associated with higher expression in one cell type is associated with lower expression in the other (Fig. 2D and fig. S14). We identified another dimension of cell type specificity: 6% of genes with cis-eQTLs shared across cell types are influenced by different, independent SNPs in each of the two cell types. Furthermore, 7% of independent SNPs in T cells and 11% in monocytes were associated with expression levels of more than one gene, with several SNPs affecting different genes in a cell type–dependent manner (Fig. 2E).
Leveraging 6341 SNPs (LD-pruned to r2 < 0.4) associated with one or more of 415 human diseases or traits [National Institutes of Health genome-wide association study (GWAS) catalog] (14), we note 887 independent SNPs that influence expression of 1088 genes in cis (tables S16 and S17). To distinguish coincidental colocalizations of GWAS and eQTL associations, we used regulatory trait concordance (RTC) scores (15), which assesses whether a cis-eQTL and a trait association are tagging the same functional variant. Applying a stringent RTC threshold of 0.9, we identified 106 GWAS SNPs in T cells for which the trait and expression associations may be tagging the same effect; in monocytes, 123 GWAS SNPs met this criterion. Given the cell types profiled in our study, we found the expected significant enrichment (permutation P < 1 × 10⁻⁴) for cis-eQTLs among autoimmune disease–associated variants: Of the 425 GWAS SNPs associated with one or more autoimmune disease, 143 have cis-regulatory effects on 164 genes in monocytes and/or T cells (fig. S15 and tables S18 and S19).
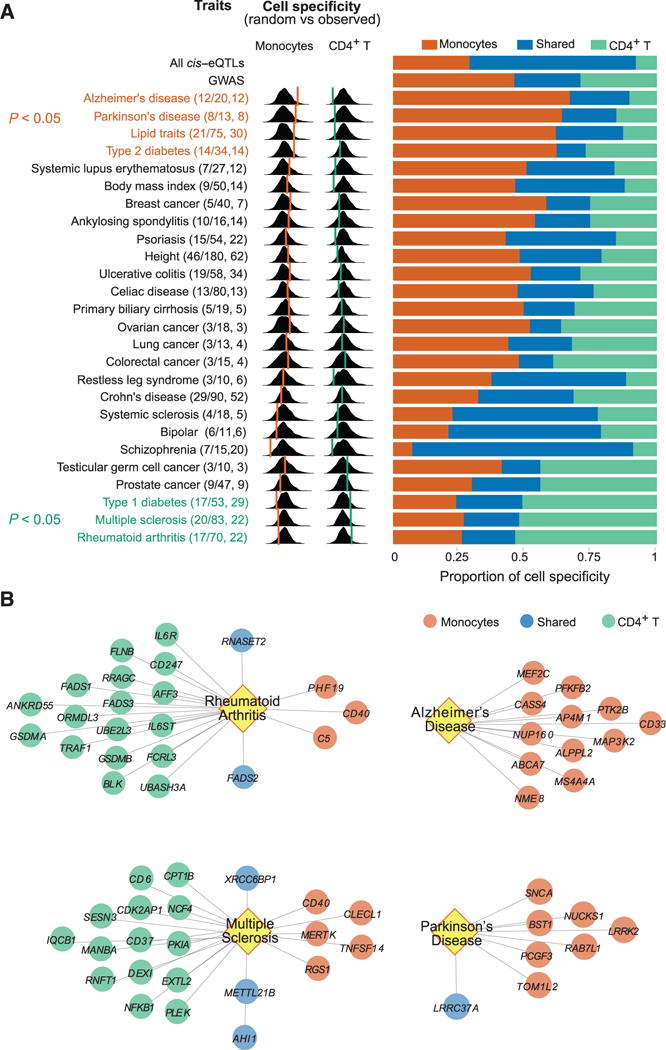
Disease and trait-associated cis-eQTLs show more cell type specificity than average cis-eQTLs. Using BMA-HM, we find that 46% of all trait-associated variants are monocyte-specific, 29% are Tcell–specific, and 25% are shared (Fig. 3A). In addition, variants associated with some diseases display a preponderance of T cell–specific cis-regulatory effects: These include susceptibility alleles for multiple sclerosis, rheumatoid arthritis, and type 1 diabetes (Fig. 3, A and B). On the other hand, Alzheimer’s disease (AD), Parkinson’s disease (PD), lipid traits, and type 2 diabetes susceptibility alleles are enriched in monocyte-specific effects (Fig. 3, A and B). In fact, the AD susceptibility alleles are significant eQTLs only in monocytes (Fig. 3B and figs. S16 and S17). Because the targeted genes are mostly expressed in both monocytes and T cells, this observed polarization is not driven by the lack of expression of the implicated genes in T cells (fig. S18).
Fig. 3. Polarization of cis-regulatory effects for disease-associated variants.

(A) (Left) For each evaluated trait, we report, in parentheses, the number of trait-associated (GWAS) SNPs with cis-eQTL effects over the total number of SNPs, and the number of genes influenced by one or more of these SNPs. For each trait, we present the distribution of the proportion of cell specificity (estimated using a Bayesian hierarchical model) observed for each of 1000 random samplings of matched SNP sets. The proportion of cell-specific cis-eQTL effects observed for a given trait is shown over this distribution using an orange line for monocytes and a green line for T cells. (Right) We report the proportion of cis-eQTLs that are monocyte-specific (orange), shared (blue), and T cell–specific (green). (B) Four diseases with significant polarization (FDR < 0.05) in the distribution of cis-eQTLs: Multiple sclerosis and rheumatoid arthritis are enriched in T cell effects (green), whereas Alzheimer’s and Parkinson’s diseases are enriched in monocyte effects (orange).
On the basis of these results, we suggest that the inflammatory component of susceptibility to neurodegenerative diseases may be more strongly driven by the myeloid compartment of the immune system. This is consistent with the altered phagocytic function that we have reported in monocytes of individuals carrying the CD33 AD susceptibility variant (16). The putative role of inflammation has previously been invoked in aging-related neurodegenerative diseases such as AD and PD (17), but our results bring a genetic underpinning and candidate pathways to these observations. Because our study examines young and healthy individuals, we provide support for a role of myeloid cells in the prodromal phase of neurodegenerative diseases. Functionally, we cannot say that blood-derived monocytes themselves are the key cell type; they are likely to be proxies for the infiltrating macrophages (which differentiate from monocytes) and/or resident microglia found at the sites of neuropathology. Both of these cell types share many of the transcriptome patterns of monocytes.
Despite its inherent logistic challenges, the profiling of purified primary cells from multiple human populations was clearly beneficial in several respects, including the reduction of the credible set of variants associated with a given trait. Though the majority of eQTLs are shared, the ImmVar study provides clear examples of context specificity of eQTLs and has yielded insights into the relative role of two representative cell types in exerting the functional consequences of disease-associated variants. Further, the depletion of disease-associated eQTLs with effects in both cell types is intriguing and suggests that the evolutionary history of cell-specific and pleiotropic variants is an important area of future investigation. Overall, this component of the ImmVar Project represents a strong foundation for future explorations of the role of disease susceptibility variants in an increasingly diverse matrix of cell types, stimuli, and in vivo contexts.
Supplementary Material
Acknowledgments
We thank the study participants in the Phenogenetic Project for their contributions. We are grateful to T. Flutre and X. Wen for assistance with running the Bayesian model averaging software. This work was supported by U.S. National Institute of General Medical Sciences grant RC2 GM093080 (C.B.). T.R. is supported by the NIH F32 Fellowship (F32 AG043267). Gene expression data are deposited in the National Center for Biotechnology Information Gene Expression Omnibus under accession no. GSE56035.
Footnotes
Supplementary Materials
www.sciencemag.org/content/344/6183/519/suppl/DC1
Materials and Methods
References (18–31)
References and Notes
- 1.Stranger BE, et al. PLOS Genet. 2012;8:e1002639. doi: 10.1371/journal.pgen.1002639. [DOI] [PMC free article] [PubMed] [Google Scholar]
- 2.Lappalainen T, et al. Nature. 2013;501:506–511. doi: 10.1038/nature12531. [DOI] [PMC free article] [PubMed] [Google Scholar]
- 3.Battle A, et al. Genome Res. 2014;24:14–24. doi: 10.1101/gr.155192.113. [DOI] [PMC free article] [PubMed] [Google Scholar]
- 4.Fairfax BP, et al. Nat Genet. 2012;44:502–510. doi: 10.1038/ng.2205. [DOI] [PMC free article] [PubMed] [Google Scholar]
- 5.Westra HJ, et al. Nat Genet. 2013;45:1238–1243. doi: 10.1038/ng.2756. [DOI] [PMC free article] [PubMed] [Google Scholar]
- 6.Nicolae DL, et al. PLOS Genet. 2010;6:e1000888. doi: 10.1371/journal.pgen.1000888. [DOI] [PMC free article] [PubMed] [Google Scholar]
- 7.Trynka G, et al. Nat Genet. 2013;45:124–130. doi: 10.1038/ng.2504. [DOI] [PMC free article] [PubMed] [Google Scholar]
- 8.Maurano MT, et al. Science. 2012;337:1190–1195. doi: 10.1126/science.1222794. [DOI] [PMC free article] [PubMed] [Google Scholar]
- 9.Abecasis GR, et al. Nature. 2012;491:56–65. doi: 10.1038/nature11632. [DOI] [PMC free article] [PubMed] [Google Scholar]
- 10.Flutre T, Wen X, Pritchard J, Stephens M. PLOS Genet. 2013;9:e1003486. doi: 10.1371/journal.pgen.1003486. [DOI] [PMC free article] [PubMed] [Google Scholar]
- 11.Storey JD, Tibshirani R. Proc Natl Acad Sci USA. 2003;100:9440–9445. doi: 10.1073/pnas.1530509100. [DOI] [PMC free article] [PubMed] [Google Scholar]
- 12.Han B, Eskin E. Am J Hum Genet. 2011;88:586–598. doi: 10.1016/j.ajhg.2011.04.014. [DOI] [PMC free article] [PubMed] [Google Scholar]
- 13.Bernstein BE, et al. Nature. 2012;489:57–74. [Google Scholar]
- 14.Hindorff LA, et al. Proc Natl Acad Sci USA. 2009;106:9362–9367. doi: 10.1073/pnas.0903103106. [DOI] [PMC free article] [PubMed] [Google Scholar]
- 15.Nica AC, et al. PLOS Genet. 2010;6:e1000895. doi: 10.1371/journal.pgen.1000895. [DOI] [PMC free article] [PubMed] [Google Scholar]
- 16.Bradshaw EM, et al. Nat Neurosci. 2013;16:848–850. doi: 10.1038/nn.3435. [DOI] [PMC free article] [PubMed] [Google Scholar]
- 17.Glass CK, Saijo K, Winner B, Marchetto MC, Gage FH. Cell. 2010;140:918–934. doi: 10.1016/j.cell.2010.02.016. [DOI] [PMC free article] [PubMed] [Google Scholar]
Associated Data
This section collects any data citations, data availability statements, or supplementary materials included in this article.


