Abstract
When integral membrane proteins are visualized in detergents or other artificial systems, an important layer of information is lost regarding lipid interactions and their effects on protein structure. This is especially relevant to proteins for which lipids play both structural and regulatory roles. Here, we demonstrate the power of combining electron cryo-microscopy with lipid nanodisc technology to ascertain the structure of the TRPV1 ion channel in a native bilayer environment. Using this approach, we determined the locations of annular and regulatory lipids and showed that specific phospholipid interactions enhance binding of a spider toxin to TRPV1 through formation of a tripartite complex. Furthermore, phosphatidylinositol lipids occupy the binding site for capsaicin and other vanilloid ligands, suggesting a mechanism whereby chemical or thermal stimuli elicit channel activation by promoting release of bioactive lipids from a critical allosteric regulatory site.
Transporters and ion channels reside in biological membranes, where lipids play important structural and regulatory roles1–3. However, structural characterization of protein-lipid interactions is challenging in detergent-based systems, making implementation of more native, lipid-based environments an important goal. For crystallographic approaches, this has been achieved through the use of lipidic-cubic phase systems4,5 or formation of two-dimensional crystals in lipid bilayers6. For single particle electron microscopy, one approach is to reconstitute proteins into spherical liposomes for random-spherically constrained single particle reconstruction7. Another is to use lipid nanodiscs, hockey puck-like structures in which a lipid bilayer patch is encircled by an amphipathic scaffolding protein8. Both approaches mimic the native lipid environment and can enhance functionality and thermal stability9,10. Moreover, nanodisc-embedded proteins are often monodisperse and especially suitable for single particle electron cryo-microscopy (cryo-EM)11,12. Nevertheless, membrane protein structures determined with these systems have achieved limited resolution to-date, failing to reveal detailed protein-lipid interactions.
Cryo-EM can now be used to obtain structures of many biological macromolecules at near atomic resolution13–15. An important next goal is to enable cryo-EM to define interactions between small molecules and their protein targets at the atomic level. The heat- and capsaicin-activated ion channel, TRPV1, is an excellent model with which to address these challenges. This sensory receptor is modulated by membrane lipids and their metabolites, and activated or inhibited by various ligands, including vanilloid compounds and peptide toxins16,17. Moreover, TRPV1 structures in multiple conformational states have recently been determined by cryo-EM under conditions in which purified channel protein was stabilized with an amphipathic polymer18,19. These structures provide a standard against which other preparations can be assessed. Here we show that high-resolution structures can be obtained when TRPV1 is embedded in a nanodisc and use this system to characterize channel-lipid interactions, revealing novel structural mechanisms underlying ligand binding and channel gating.
Structure of TRPV1 in lipid nanodiscs
We reconstituted purified TRPV1 protein into lipid nanodiscs generated with different membrane scaffold proteins (MSPs) (Extended Data Fig. 1). For structural analysis, we favored preparations using MSP2N2, which forms nanodiscs of ~150Å diameter and is sufficient to accommodate TRPV1 without imposing spatial constraint (Extended Data Fig. 1d). Indeed, cryo-EM images of frozen hydrated samples revealed monodispersed TRPV1-nanodisc particles. 2D class averages showed TRPV1 tetramers with distinct channel features floating within the nanodisc (top view) (Fig. 1a). Transmembrane helices and cytoplasmic domains were clearly visible within a disc-like density contributed by the lipid bilayer (side views). Importantly, the presence of the bilayer and MSP did not preclude accurate image alignment.
Figure 1. TRPV1 structures determined in lipid nanodisc.
a, Side and top views of reference-free 2D class averages of TRPV1 in nanodiscs, showing transmembrane helices and lipid bilayer. b, Side and top views of 3D reconstruction of TRPV1-ligand-nanodisc complex. Individual channel subunits are color-coded with two molecules of DkTx (purple) atop the channel and a molecule of RTX (red) in the vanilloid binding pocket. Densities of the nanodisc (grey) and well-resolved lipids (blue) are also shown.
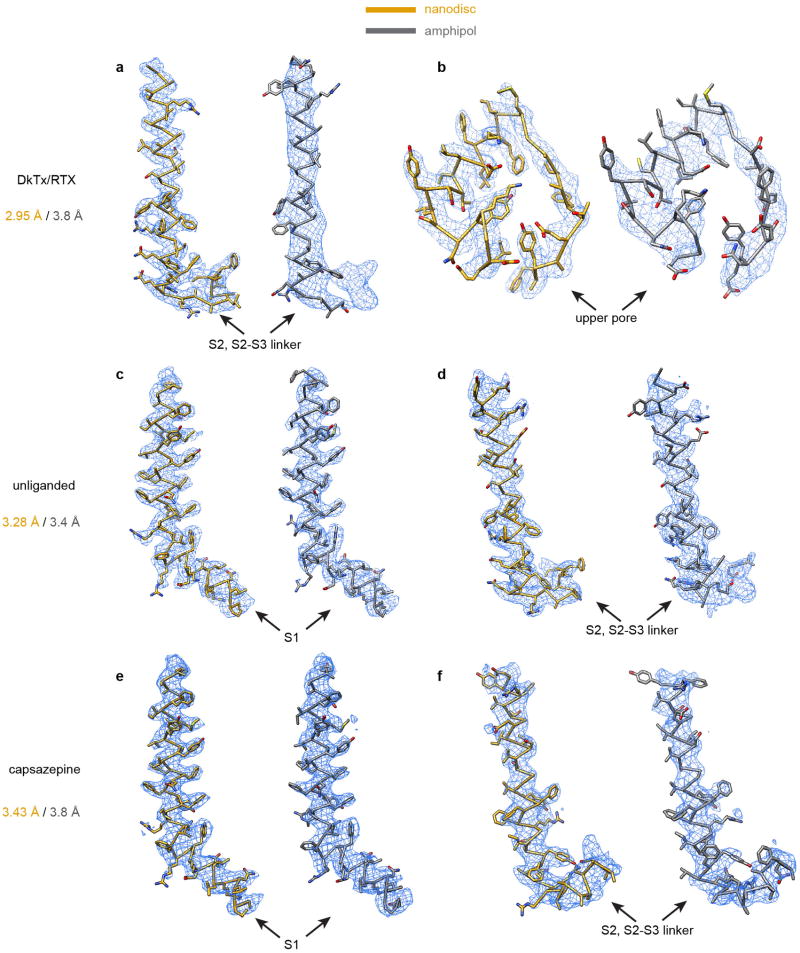
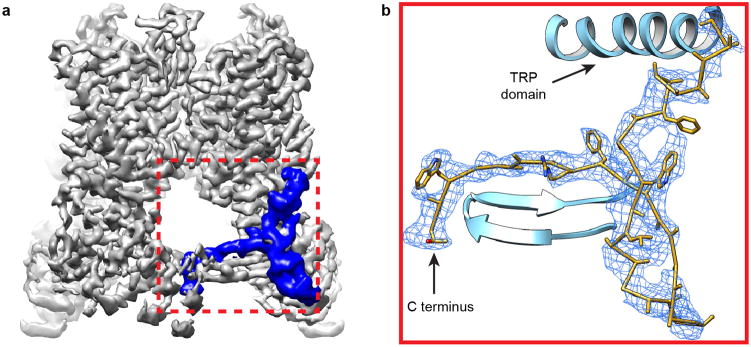
We determined three structures of TRPV1 in nanodiscs, including unliganded, agonist-bound, and antagonist-bound states at resolutions of 3.2, 2.9, and 3.4Å, respectively (Fig. 1b; Extended Data Figs. 2–4). These structures can be compared directly to those previously obtained in amphipol18,19. Generally speaking, density maps determined with nanodiscs were of superior quality. This is especially evident when examining side chain densities within transmembrane regions or connecting loops that face lipids, such as S1 and S2 helices and the S2–S3 linker (Extended Data Fig. 5a–f). Interestingly, improvements were not limited to transmembrane regions, but also extended to cytoplasmic domains, enabling us to build a model including previously unresolved regions (Extended Data Fig. 6a, b). These improved density features may reflect enhanced stability of the channel in the nanodisc, but other technical advances also contribute (Extended Data Table 1). The nanodisc- and amphipol-stabilized structures of a given conformational state are essentially identical, albeit with some specific differences that may relate to lipid and/or ligand binding (see below).
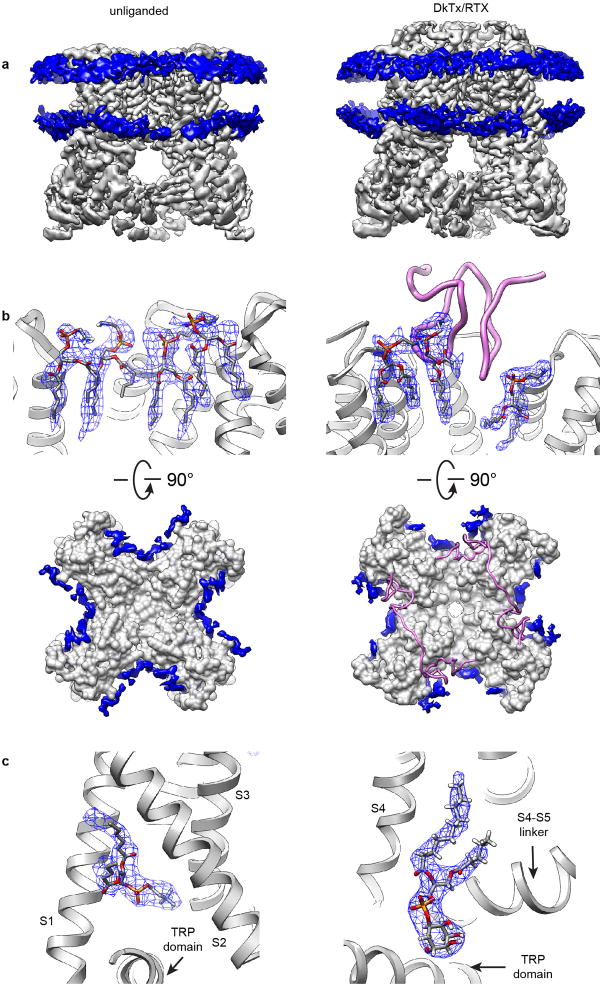
Two layers of continuous density corresponding to lipid head groups mark the bilayer boundaries and surround the channel (Fig. 1a, b and Extended Data Fig. 7a). Furthermore, well-resolved lipid-like densities associate with various regions of the channel, indicative of well-ordered lipids that form specific protein interactions (Fig. 1b and Extended Data Fig. 7b, c). These include annular lipids that fill crevices between subunits and reside within the outer leaflet surrounding pore-forming domains of the channel, reminiscent of voltage gated potassium channels20. We also observed lipids in hydrophobic clefts, as exemplified by a density within the lower segment of the S1–S4 domain, whose shape and local environment suggest that it represents a molecule of phosphatidylcholine (Extended Data Fig. 7c). Indeed, we observed a similar density in this location for TRPV1 in amphipol19, suggesting that an endogenous, tightly bound lipid helps stabilize a hydrophobic crevice within the S1–S4 domain, which remains stationary during channel gating18.
Lipid-channel-toxin tripartite complex
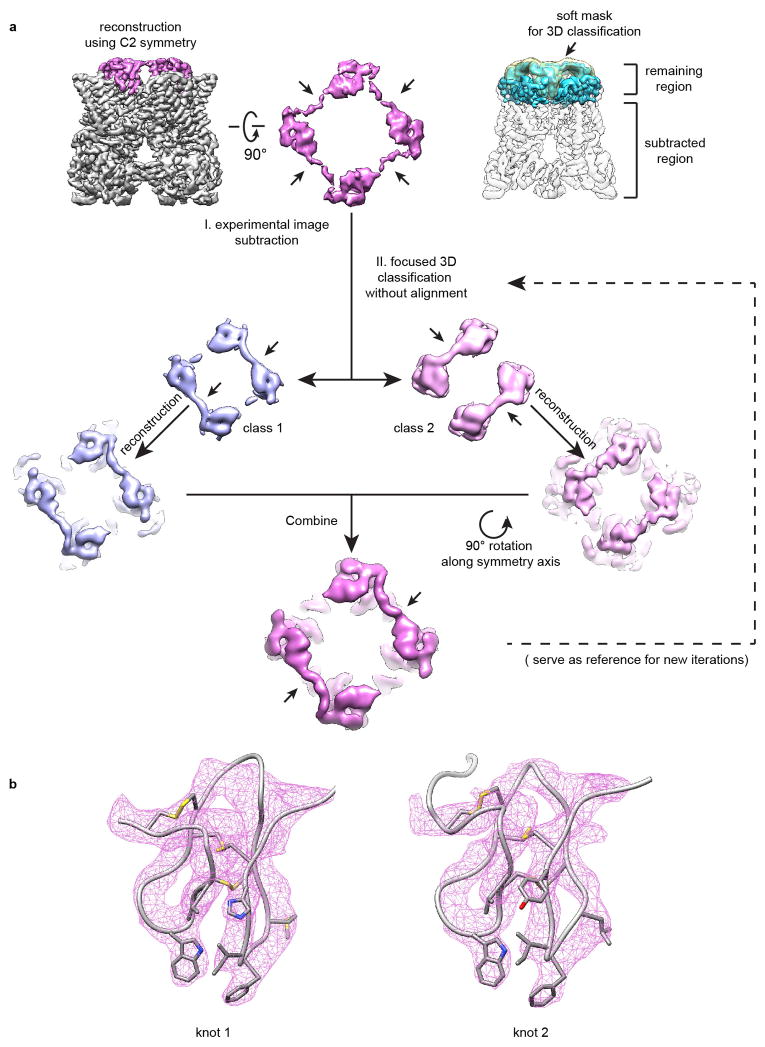
TRPV1 can be stably trapped in its fully open state when exposed to resiniferatoxin (RTX) - an ultra-potent vanilloid agonist18,21 - plus double-knot toxin (DkTx), a bivalent tarantula peptide that consists of two nearly identical inhibitor cysteine knot (ICK) motifs joined by a short (7 amino acid) linker22. Two DkTx molecules bind to one TRPV1 tetramer such that each knot assumes a specific orientation with respect to the channel, suggesting that two DkTx molecules adopt an anti-parallel configuration18. In our current nanodisc structure, we initially applied C4 symmetry to achieve optimal resolution, yielding a 2.9Å map of the nanodisc-stabilized, RTX/DkTx-activated channel, compared to 3.8Å for the amphipol-stabilized complex (Fig. 2a and Extended Data Fig. 8). To gain further information about non-equivalent regions of the toxin, we applied C2 symmetry independently, which was insufficient to reveal specific features associated with each knot and their relationship to one another, indicating that some particle images were misaligned by 90° around the symmetry axis. Focused classification on the toxin and adjacent regions enabled us to partially separate the two possible orientations to obtain an improved C2 averaged map, as evidenced by more pronounced features within the antiparallel linker connecting the ICK knots (Fig. 2b and Extended Data Fig. 8).
Figure 2. Structural details of tripartite toxin-channel-lipid complex.
a, Sequence of DkTx (top) showing location of intramolecular disulfide bonds and finger-like loops formed primarily by residues conserved between toxin knots (orange). Hydrophobic residues enable fingers to penetrate the lipid bilayer by ~9Å (bottom). b, Schematic top down view showing antiparallel arrangement of two DkTx molecules (purple) binding at subunit interfaces of a TRPV1 homo-tetramer (subunits are color-coded). c, Cutaway view depicting one DkTx molecule interacting with two adjacent TRPV1 subunits (grey) and associated lipids (blue spheres; red and orange spheres depict phosphate head groups). Superimposed ribbon diagram (light blue) denotes location of transmembrane α-helices for one channel subunit. d, Detailed view of boxed region in (c) showing interactions between lipids and amino acid side chains from channel and toxin (dotted line, hydrogen bond). Helices from three neighboring channel subunits are color-coded as in (b).
With improved maps, we rebuilt and refined the atomic model of the fully open channel with associated ligands. For DkTx, three canonical disulfide bonds are clearly resolved, as are most side chains in regions that interact with TRPV1 (Fig. 2a and Extended Data Fig. 8b). Here we find that residues involved in channel interaction are highly conserved between ICK knots, consistent with the fact that side chain densities of these residues were well resolved even when C4 symmetry was applied. Interestingly, the density of the linker domain is also well resolved (Fig. 2c), revealing a taut and constrained conformation that likely contributes to high avidity interaction with the channel22.
The nanodisc system enabled us to determine where interactions occur with respect to the lipid bilayer. Two hydrophobic fingers from each ICK knot insert into the bilayer (Fig. 2a) and several phospholipid densities at these sites are well resolved, likely reflecting their stabilization through specific toxin interactions (Fig. 2c, d and Extended Data Fig. 7b). For example, a tryptophan side chain in finger 1 (Trp11 of knot 1 and Trp53 of knot 2) interacts with the aliphatic tail of a phospholipid whose head group forms a polar interaction with Arg534 in TRPV1, located in the extracellular loop connecting S3 and S4 helices. This sort of tripartite complex between toxin, lipid, and channel is also seen proximal to finger 2, where a phenylalanine side chain (Phe27 of knot 1 and Phe67 of knot 2) is stabilized through hydrophobic interaction with an aliphatic lipid tail. Furthermore, the lipid head group is coordinated by the side chain of Ser629 at the top of the channel’s pore helix domain, as well as by interaction with Tyr453 from S1 of the adjacent channel subunit (Fig. 2d). Thus, together with the newly refined apo model, we see that gating-associated side chain movements within outer pore loops and pore helices are more clearly visualized compared with our previous structures in amphipols (Extended Data Fig. 5b). These new observations demonstrate how potential side chain clashes between DkTx and the apo channel are relieved through lateral shifts in the outer pore loops and pore helices, primarily through reorientation of aromatic side chains (Fig. 3a). Moreover, they suggest a structural mechanism for how toxin binding stabilizes the open state.
Figure 3. Movement of protein and lipids associated with toxin binding.
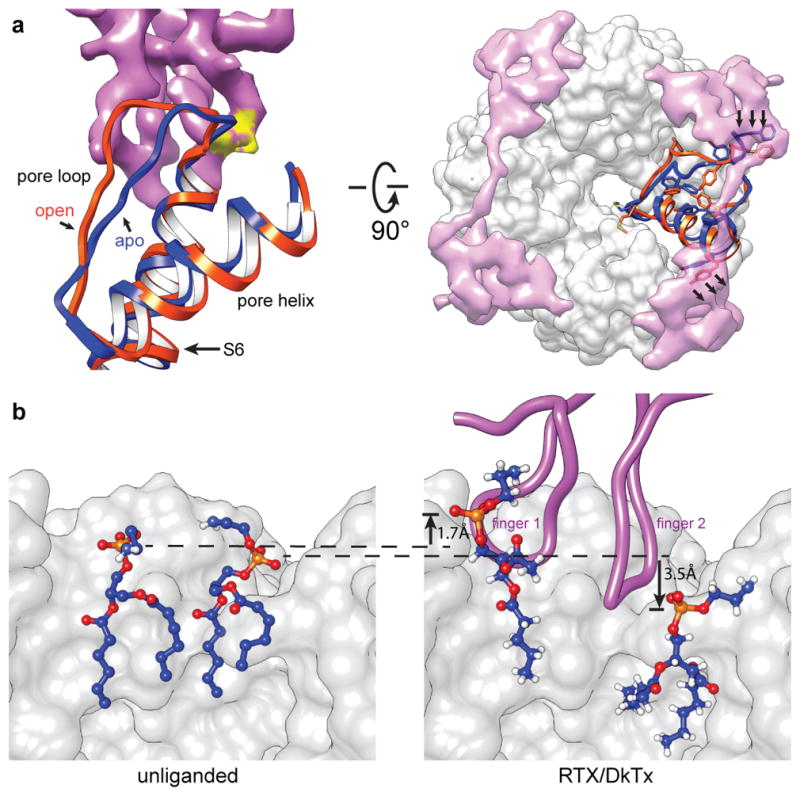
a, Movement of pore loop, pore helix, and part of S6 domain from closed (blue) to open (orange) states upon DkTx (purple) binding. Without such movement, one finger of DkTx would clash (yellow region) with the unliganded channel at the top of S6. Top down view (right) shows two DkTx molecules atop TRPV1 (grey density). Toxin binding is associated with lateral shifts of the pore helix and loop (arrows), as well as large rearrangements of aromatic side chains within these regions. b, Two annular lipids (shown in blue, with phosphate in orange and oxygen in red) at the channel-toxin interface undergo both lateral and vertical movements upon DkTx binding. Dashed lines mark original position of phosphate groups in the absence of toxin (left); arrows indicate displacement of lipids in the presence of toxin (right).
The nanodisc preparation also reveals local distortions in the lipid environment associated with toxin binding. For example, insertion of DkTx into the bilayer results in lateral and upward displacement of a phospholipid adjacent to finger 1, as well as lateral and downward displacement of another phospholipid proximal to finger 2 (Fig. 3b). The resulting energetic penalty may be compensated by toxin-channel interactions, as well as by new interactions formed between the channel and displaced lipids (Figs. 2d and 3b). Such a tripartite arrangement likely determines the overall affinity and kinetics of toxin binding.
A resident lipid in the vanilloid pocket
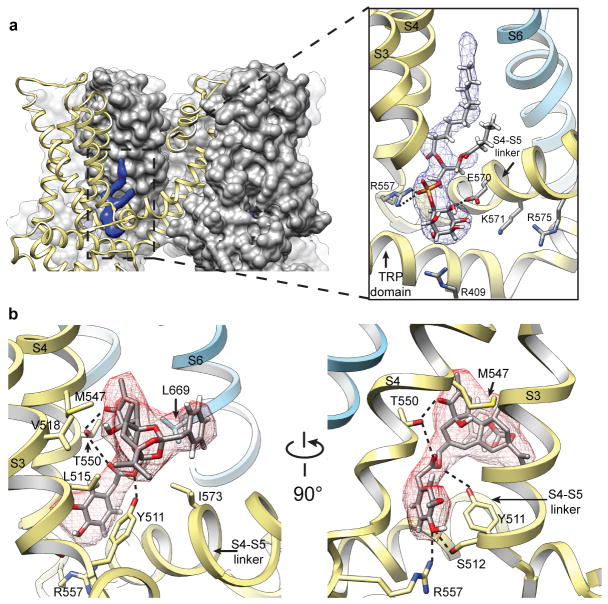
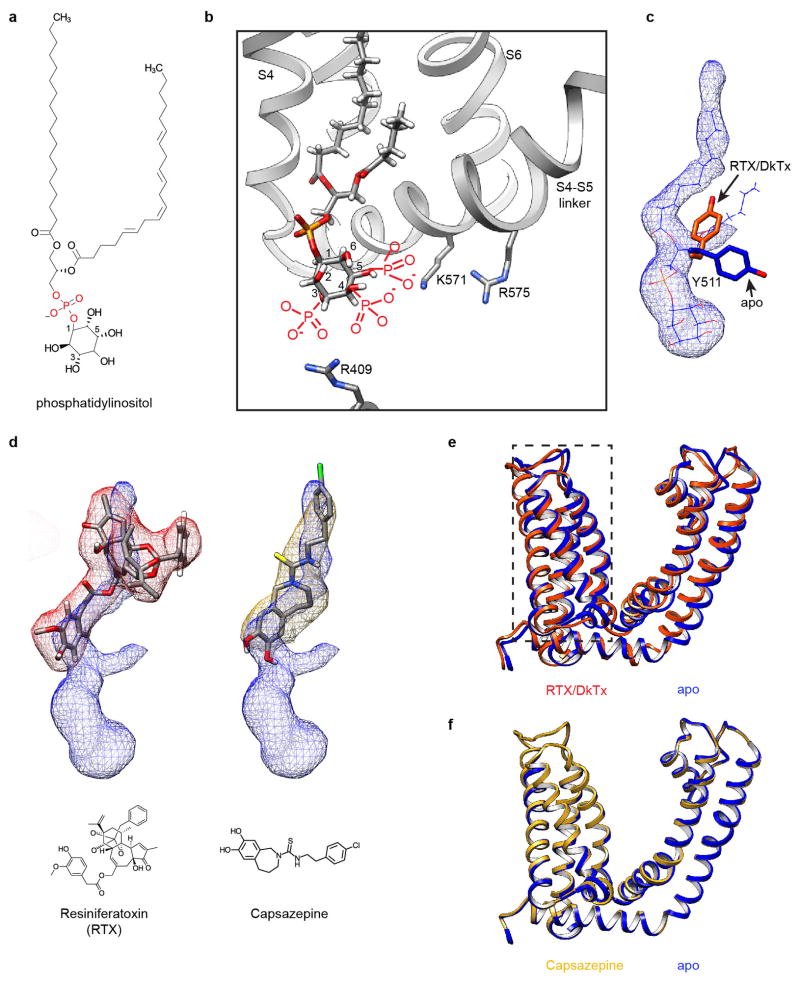
A particularly striking density within the vanilloid binding pocket of the apo channel can be confidently interpreted as a phosphatidylinositol lipid whose branched acyl chains extend upward between S4 of one subunit and S5 and S6 of an adjacent subunit, within a hydrophobic cleft facing the lipid bilayer. The inositol ring is bounded on each side by S3 and the elbow of the S4–S5 linker, with the TRP domain below (Fig. 4a). Polar interactions, such as that between Arg557 at the bottom of S4 and the hydroxyl group of the phosphate on position 1, or between Glu570 in the S4–S5 linker and a hydroxyl group on position 6 of the inositol ring, further enhance stability (Fig. 4a and Extended Data Fig. 9a). Detailed analysis of the local protein environment suggests that additional phosphate groups at positions 3, 4 and/or 5 of the inositol ring could form electrostatic interactions with Arg409 in a cytoplasmic N-terminal segment preceding S1 or Lys571 and Arg575 within the S4–S5 linker (Fig. 4a and Extended Data Fig. 9a, b). If so, then this pocket could favor a range of phosphatidylinositide species.
Figure 4. Shared binding pocket for phosphatidylinositol lipids and vanilloid ligands.
a, Surface representation of TRPV1 (grey) in cutaway view revealing location of bound co-factor (blue). Superimposed ribbon diagram (yellow) denotes location of transmembrane α-helices for one channel subunit. Detailed view of boxed region shows how co-factor density (blue mesh) accommodates a molecule of phosphatidylinositol (PI). Positive and negative side chains from S4 and S4–S5 linker, respectively, can form ionic interactions with negatively charged phosphate or hydroxyl moieties on inositol ring. Helices from a neighboring subunit (light blue) are also shown. b, Density for resiniferatoxin (RTX, red mesh) is well fit by its atomic structure. Residues essential for RTX sensitivity (Y511, M547, T550) lie in close proximity to the ligand and can engage in electrostatic or hydrophobic interactions. Densities for PI and RTX define overlapping, but non-identical sites (also see Extended Data Fig. 9).
A similar, albeit less well resolved density was observed at this locale in our amphipol-stabilized structure19, suggesting that a tightly associated lipid is retained during channel purification. This, or other associated lipids may derive from the soybean lipid extract that was added to improve protein stability, but it is also possible that they are of cellular origin.
Mechanism of vanilloid action
We next examined the structure of the vanilloid pocket when occupied by various ligands (Extended Data Fig. 9c, d). With nanodiscs, we could discern ligand structures in much greater detail compared to amphipol-stabilized structures. For example, RTX could be precisely fit by its atomic structure (Fig. 4b), and in a manner consistent with mutagenesis and modeling studies23–28. For the capsaicin-like homovanillyl ester moiety, key interactions include a hydrogen bond between Thr550 and the carbonyl oxygen proximal to the vanilloid moiety, as well as between Ser512 and Arg557 and the vanilloid moiety at the hydroxyl group. Tyr511, which assumes distinct rotomers in apo versus liganded TRPV1 structures18, engages in hydrogen bonding with the ester oxygen of RTX. The five-membered diterpene ring component of RTX is stabilized by hydrophobic interactions with several amino acids, including Leu515, Val518, Met547, and Ile573, as well as Leu669 from a neighboring subunit. These residues form a hydrophobic pocket that accommodates the heterocyclic region of the drug, likely accounting for high affinity binding of this potent agonist.
Comparison of apo versus RTX-bound states suggests that vanilloid agonists function by displacing the resident phosphatidylinositol lipid. Indeed, RTX docks within the same pocket otherwise occupied by one acyl chain of the lipid. Absence of the other acyl chain allows for reorientation of Tyr511 to further stabilize RTX binding (Extended Data Fig. 9c, d). At the same time, RTX binding coordinates interaction between Arg557 and Glu570 to re-occupy the space vacated by the inositol head group, consequently pulling the S4–S5 linker away from the central axis to facilitate opening of the lower gate (Fig. 5 and Extended Data Fig. 9e). This mechanism is further supported by analysis of a capsazepine-bound structure (determined in either amphipol or nanodisc), in which this competitive vanilloid antagonist29 occupies the same hydrophobic pocket as RTX, but apparently without facilitating the key interaction between Arg557 and Glu570 (Fig. 5 and Extended Data Fig. 9f). Indeed, mutations at these sites abrogate capsaicin-evoked responses, whereas charge-swapping mutations (R557E and E570R) partially restore channel function28,30, consistent with our model. Parenthetically, we did not observe significant movement within the S1–S4 region (Extended Data Fig. 9e), indicating that the static nature of this voltage sensor-like domain as previously described18 is not merely an artifact of amphipol packing.
Figure 5. Structural rearrangements associated with vanilloid binding.
a, Ribbon diagrams depicting relative locations of S4, S4–S5 linker, S6 and TRP domain helices in the presence of phosphatidylinositol (blue, left), resiniferatoxin (orange, middle), or capsazepine (gold, right). Vanillyl ring of RTX uniquely stabilizes interaction between Arg557 and Glu570 to facilitate movement of the S4–S5 linker away from the central axis of the channel (indicated by red arrows), thereby facilitating opening of the lower gate through coupled movements (indicated by black arrows).
Concluding remarks
Membrane proteins have been reconstituted into lipid nanodiscs and studied by single particle cryo-EM11,12, but our results now show that this system can be taken to atomic resolution, enabling detailed structural analysis of lipid-protein interactions in a more native or stable environment. A main concern about using nanodiscs for cryo-EM was that the bilayer mass would weaken the power of image alignment and limit achievable resolution of imbedded proteins. Our results now show that this is not a problem. Indeed, as in the case of amphipol-stabilized TRPV1, the transmembrane core reached highest resolution, indicating that image alignment was not adversely affected by the nanodisc. In addition to enabling visualization of specific, tightly bound lipids, the nanodisc provides a defined contour for the bilayer in relation to protein structure while revealing local deformations such as those associated with toxin binding.
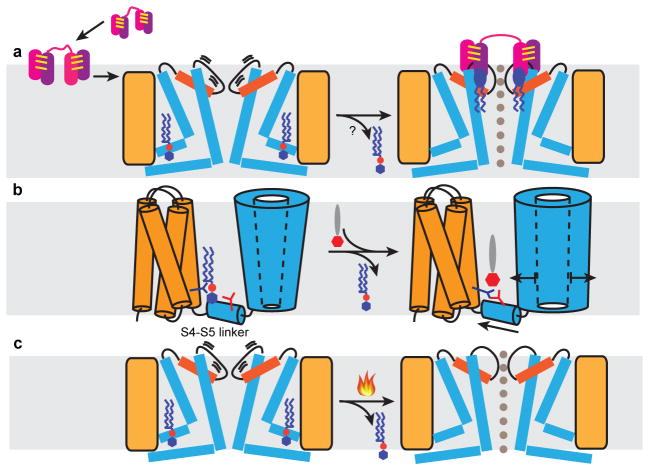
Biophysical and biochemical studies suggest that amphipathic ICK toxins, such as hanatoxin and SGTx1, first partition into the lipid bilayer, then engage their channel target through moderate affinity protein-protein interactions31. Furthermore, binding affinity may be enhanced by formation of a toxin-lipid-channel trimolecular complex32,33. Our DkTx-bound TRPV1 structure supports this concept by showing that hydrophobic fingers of the toxin insert almost halfway (~9Å) through the outer leaflet of the bilayer, interaction surfaces between DkTx and TRPV1 are not extensive, and membrane lipids form bridging interactions between toxin and channel (Fig. 6a). Indeed, we achieved significantly better resolution for the RTX/DkTx-bound channel, likely reflecting enhanced stability of such a tripartite complex. Overall, our findings are consistent with recent modeling studies based on a nuclear magnetic resonance structure of DkTx34. Lastly, DkTx is uniquely bivalent, and our structure suggests that the taut linker region connecting the two ICK knots has evolved to perfectly match the distance between subunit binding sites, which, together with the specific anti-parallel orientation of toxin binding, likely contributes to the remarkable avidity and specificity of the DkTx-TRPV1 interaction.
Figure 6. Mechanistic models for TRPV1 activation.
a, Proposed mechanism for DkTx action. Two hydrophobic fingers (purple and pink) of each ICK knot (joined by three intramolecular disulfide bonds, yellow lines) enable the toxin to partition into the lipid bilayer (grey shade) and subsequently target TRPV1. In the closed state, the upper pore region of the channel (orange, pore helix; thick line, pore loop) undergoes brief spontaneous excursions to an open state, enabling DkTx to dock. Several annular lipids (blue ellipse with zigzag tails) bind at the channel-toxin interface to further stabilize the open state through formation of a tripartite complex. Resident phosphatidylinositides (blue hexagon attached to red sphere with zigzag tails) in the vanilloid pocket may leave upon toxin binding to facilitate allosteric opening of the lower gate. b, Proposed mechanism for vanilloid agonist action. Phosphatidylinositide co-factor binds in vanilloid pocket to stabilize the channel in its closed state. Vanilloid agonist (red hexagon attached to grey ellipse) displaces phosphatidylinositide to facilitate formation of a salt bridge between Arg557 (dark blue branch) and Glu570 (red branch), consequently pulling the S4–S5 linker away from the channel’s central axis to open the lower gate. c, Heat may open the channel through a similar mechanism involving thermal displacement of resident phosphatidylinositides.
Many TRP channels function as ‘receptor-operated’ channels that are modulated by phospholipase C-mediated phosphatidylinositol-4,5-bisphosphate (PIP2) hydrolysis35,36. However, structural mechanisms governing phosphatidylinositide-mediated regulation remain poorly understood. For TRPV1, it is not clear whether PIP2 or other phosphatidylinositides bind directly to the channel, or function as obligatory co-factors, allosteric inhibitors, or both2,37. Moreover, channel domains that specify phosphatidylinositide sensitivity have not been unambiguously identified. We now show that phosphatidylinositides function as endogenous, tightly bound co-factors that stabilize TRPV1 in its resting state by serving as competitive vanilloid antagonists and negative allosteric modulators. At the same time, phosphatidylinositides may function as positive, obligatory co-factors whose binding to TRPV1 in the closed state primes the channel for subsequent activation by vanilloids or other stimuli (Fig. 6b). Thus, our structures suggest a dual role for phosphatidylinositides through interactions at this single site. Moreover, structure-function studies suggest that regions within the TRPV1 C-terminus interact with PIP2 (ref 38–41) and thus additional mechanisms may contribute to phosphatidylinositide regulation of TRPV1 or other TRP subtypes. Our findings, together with those describing PIP2 interactions with inwardly rectifying potassium channels42, demonstrate that phosphatidylinositides can interact with membrane proteins in diverse ways. It is tempting to speculate that temperature-dependent displacement of endogenous phosphatidylinositides contributes to heat-evoked activation of TRPV1 (Fig. 6c).
METHODS
Protein expression, purification and nanodisc reconstitution
A minimal functional rat TRPV1 construct was expressed and purified as previously described 19. Membrane scaffold proteins MSP2N2 and MSP1E3 were expressed and purified from E. coli, and detergent solubilized TRPV1 protein incorporated into lipid nanodisc as previously described10, with modifications. Briefly, 2.5 mg soybean polar lipid extract (Avanti) dissolved in chloroform was dried using argon stream and residual chloroform further removed by vacuum desiccation (~ 3hrs). Lipids were then rehydrated in buffer (20 mM HEPES, 150mM NaCl, 2mM TCEP, 14 mM DDM, pH 7.4) and sonicated, resulting in a clear lipid stock at 10mM concentration. Purified MBP-TRPV1 protein (0.7–1.5 mg ml−1) solubilized in 0.5 mM DDM was mixed with the soybean lipid stock and MSP2N2 (~3mg ml−1) at various molar ratios and incubated on ice for 30 minutes. Specifically, we achieved the best result using the ratio (TRPV1 monomer : MSP : soybean lipid = 1:1:150 – 1:1.5:225) for MSP2N2 and 1:1:100 for MSP1E3. Bio-beads SM2 (20 mg per 1ml mixture, Bio-rad) were added to initiate the reconstitution by removing detergents from the system and the mixture incubated at 4°C for one hour with constant rotation. A second batch of Bio-beads (equal amount) together with TEV protease (40 μg per 1mg TRPV1) was then added and the sample incubated at 4°C overnight. Bio-beads were then removed and the reconstitution mixture cleared by centrifugation before subsequent separation on a Superose 6 column (GE) in buffer (20 mM HEPES, 150mM NaCl, 2mM TCEP, pH 7.4). Reconstitution was assessed by size exclusion chromatography, SDS-PAGE, and negative stain EM (Extended Data Fig. 1). The peak corresponding to tetrameric TRPV1 reconstituted in lipid nanodisc was collected for analysis by both negative stain and cryo-EM. TRPV1-nanodisc particles were mono-dispersed as assessed by negative stain EM (Extended Data Fig. 1c).
EM data acquisition and analysis
Grids of TRPV1-nanodisc complexes for negative-stain EM were prepared following an established protocol43. Specifically, 2.5 μl of purified TRPV1-nanodisc complex (0.05 – 0.1mg ml−1) was applied to glow-discharged EM grids covered by a thin layer of continuous carbon film and stained with 0.75% (w/v) uranyl formate. Negatively stained EM grids were imaged on a Tecnai T12 microscope (FEI Company) with a thermoionic electron source (LaB6) and operated at 120 kV. Images were recorded at a nominal magnification of 52,000X and a defocus set to −1.5 μm using a 4k×4k scintillator based charge-coupled device camera (UltraScan 4000, Gatan), corresponding to a pixel size of 2.02Å on the specimen.
For cryo-EM, 2.5 μl of purified TRPV1-nanodisc complex (~0.5 mg ml−1 concentration and supplied with 2.5% (v/v) glycerol) was applied to a glow-discharged Quantifoil grid (holey carbon film with 1.2μm hole size and 1.3 μm hole spacing on 400 mesh Cu grid), blotted with a Vitrobot Mark III (FEI Company) using 8-s blotting time with 100% humidity at 5°C, and plunge frozen in liquid ethane cooled by liquid nitrogen. For preparation of TRPV1-nanodisc in complex with agonists or antagonist, reconstituted channel complex was mixed with RTX (final concentration 50 μM; molecular weight 628 Da) and DkTx (final concentration 20 μM; molecular weight 8.5 kDa), or capsazepine (20 μM; molecular weight 377 Da), 20 minutes before vitrification, as described above.
Cryo-EM images of frozen hydrated TRPV1-nanodisc particles were collected on a TF30 Polara electron microscope (FEI Company) equipped with a field emission electron source and operated at 300 kV. Images were recorded at a nominal magnification of 31,000 X using a K2 Summit direct electron detector camera (Gatan) operated in super-resolution counting mode following an established protocol 44. Images have a calibrated physical pixel size of 1.22 Å per pixel on the specimen. The dose rate on the camera was set to be 8.2 counts (corresponding to 9.9 electrons) per physical pixel per second. The total exposure time was 6 s, leading to a total accumulated dose of 41 electrons per Å2 on the specimen. Each image was fractionated into 30 subframes, each with an accumulation exposure time of 0.2 s. All dose-fractionated cryo-EM images were recorded using a semi-automated acquisition program UCSFImage4 (ref 45). Images were recorded with a defocus in a range from −0.7 to −2.2 μm.
Image processing
Defocus of all images was determined using CTFFIND4 (ref 46). Negative stain EM images were 2 × 2 binned for particle picking and subsequent image processing. SamViewer, an interactive image analysis program written in Python, was used for all 2D image display and manual particle picking. Individual particles were manually picked, boxed out from micrograph and normalized to have a mean of 0 and a standard deviation of 1. Usually a total of 1000 – 2000 particles were picked manually. For 2D classification, particles were first corrected for contrast transfer function (CTF) by flipping the phase using ‘ctfapply’ (written by X. Li), and then subjected to ten cycles of correspondence analysis, k-means classification and multi-reference alignment, using SPIDER operations ‘CA S’, ‘CL KM’ and ‘AP SH’ (ref 47). 2D class averages generated from manually picked particles then served as references for a subsequent automatic particle picking procedure implemented in a Python script ‘samautopick.py’, as previously described19. All picked particles were then screened visually and particles without clear, defined structural features were removed interactively. The selected particles were again subjected to the same 2D analysis and 2D class averages were assessed (Extended data figure 1).
For cryo-EM images, dose fractionated super-resolution image stacks of frozen, hydrated TRPV1-nanodisc images were first binned 2 × 2 by Fourier cropping, resulting in a pixel size of 1.22 Å, for motion correction and further image processing. Each image stack was subjected to whole-frame motion correction 44, followed by correction at individual pixel level using program UcsfDfCorr (written by Shawn Zheng). A sum of all corrected subframes, calculated following a dose weighting scheme 48, was used for further processing. Particle picking was performed similarly as described above. Selected particles after visual screening were boxed out, and subjected directly to maximal likelihood-based 3D classification procedures implemented in RELION 49. A previous density map of TRPV1 solubilized in amphipol (EMDB code 5778) was low-pass filtered to a resolution of 60 Å and used as initial reference for 3D classification. Stable classes from 3D classification were then iteratively refined and reclassified to obtain the most homogeneous subset for the final 3D reconstruction. All refinements followed the gold-standard refinement procedure, in which the data set was divided into two half sets, and refined independently. Once refinement was converged, the final data set was subjected to the ‘postprocessing’ procedure of RELION in which a soft mask was calculated and applied to the two half-maps before the corrected Fourier shell coefficient (FSC) was calculated. B-factor estimation and map sharpening were also performed in this step using an automated procedure. C4-symmetry was applied in all 3D classification and refinement steps unless specifically noted. The final resolution was estimated using the FSC = 0.143 criterion 50 on corrected FSC curves in which the influences of the mask were removed. Local resolution was estimated from unbinned and unsharpened raw density maps using ResMap 51. Number of particles in each dataset and other details related to data processing are summarized in Extended Data Table 1. Conformations of TRPV1 alone or with ligands are very similar whether determined in amphipol or nanodisc.
For TRPV1-RTX/DkTx nanodisc dataset, two 3D reconstructions were first determined independently to resolutions of 2.95 Å with C4 symmetry and 3.24 Å with C2 symmetry. These two reconstructions are very similar. We then performed a 3D classification focusing on DkTx and its peripheral region in TRPV1, following a procedure outlined in Extended Data Fig 8a. Specifically, a volume that includes DkTx and peripheral densities in TRPV1 was masked out from the C2-symmetrized 3D reconstruction. The density after masking was back-projected and convoluted with the CTF to yield a 2D image for all individual particles using its assigned Euler angles and defocus parameters from the reconstruction. These images were firstly scaled and normalized to the corresponding experimental particle images and then subtracted from the experimental particle images, resulting a particle stack in which every particle image contains only signals for the focused region. These procedures were implemented into a Python script ‘projection_subtraction.py’ (written by E. Palovcak) using the filt_ctf and math.sub.optimal functions from the SPARX and EMAN2 libraries, respectively 52,53 The modified particle images were then subjected to 3D classification in RELION with a soft mask around DkTx, and without further alignment. Two major classes representing two possible orientations of DkTx (as judged by the linker region) were identified and unsubtracted particles belong to each class were separated and used for two independent reconstructions with pre-determined Euler angles. These two reconstructions were aligned to each other using ‘fit in map’ in UCSF Chimera 54 and summed yielding a density map with enhanced two-fold symmetry feature. This density map was used as the reference model for a second round of focused 3D classification to further optimize classification result.
We also determined the structure of capsasepine-bound TRPV1 in amphipol A8-35 (Anatrace). In brief, TRPV1 (~ 0.5 mg/ml) in amphipol was mixed with capsazepine (final concentration 50 μM) at 4 °C for ~ 30 minutes prior to application to grids. Procedures for grid preparation, data acquisition and image processing were the same as described 19. The final resolution of the reconstruction (3.8 Å) was calculated using the ‘post-processing’ procedure of RELION in which a soft mask was calculated and applied to the two half-maps using default parameters.
Model building
Atomic models of TRPV1 in apo (Protein Data Bank, (PDB) code 3J5P) or fully open states (PDB code 3J5Q), previously determined when the channel was solubilized in amphipol, were initially docked into maps of unliganded or agonist bound TRPV1-nanodisc complex using UCSF Chimera. With improved resolution and stability afforded by the nanodisc system, we were able to remodel side-chains and local geometry to higher accuracy. TRPV1 models were first adjusted and real-space refined using COOT 55. Unliganded TRPV1 model was then used for modeling capsazepine-bound structure with minor adjustment due to high similarity between the two structures. DkTx was remodeled according to the improved map from focused analysis (see above). All models for ligands or associated lipids, except for RTX, were generated using elBOW 56 module in PHENIX 57 together with their geometric constraints. RTX model and constraints were generated using a web server ‘PRODRG’ 58. For simplicity, all annular lipids in the structure were modeled as phosphatidylethanolamine (PE), and the acyl chains of all lipids were modeled as 1 – 8 carbon length according to specific densities. Models for all ligands were docked into densities and refined using COOT. Full models of TRPV1 (residue 335–751, corresponding to well-resolved regions in maps) in complex with ligands and lipids were then subjected to global refinement and minimization in real space using the module ‘phenix.real_space_refine’ 59 in PHENIX. For cross validation60, the refined structures were first randomly displaced by 0.1Å and then refined against one of the half maps generated in RELION following the same procedures described above. FSC curves were calculated between the refined model and half map 1 (‘work’, used in test refinement), the refined model and half map 2 (‘free’, not used in test refinement), and the refined model and summed map. The small gap between the work and the free FSC curves indicated little effect of over-fitting of atomic models. The geometries of all models were assessed using ‘comprehensive model validation’ section in PHENIX and MolProbity 61, and detailed information was listed in Extended Data Table 1.
Figures were prepared using UCSF Chimera and 2D EM images were extracted using SamViewer.
Extended Data
Extended Data Figure 1. Reconstitution of TRPV1 into lipid nanodisc.
a, Size exclusion chromatography of TRPV1 channel reconstituted into lipid nanodisc using MSP2N2. Void volume and peaks corresponding to TRPV1 and cleaved MBP are indicated. b, SDS-PAGE of detergent solubilized MBP-TRPV1 fusion protein and material from nanodisc reconstituted with TRPV1 following MBP cleavage (middle peak in a). Note the presence of both bands for TRPV1 and MSP2N2. c, Representative micrograph of negative-stained TRPV1-nanodisc sample showing mono-dispersed and homogeneous particles. d, Reference-free 2D class averages of particles in (c) revealing band-like density contributed by the lipid disc (side view) and tetrameric arrangement of channel subunits (top view). e, 2D class averages of the same protein reconstituted into MSP1E3 nanodisc, which is smaller in diameter. Note the extra space within the disc offered by MSP2N2 scaffold protein in (d).
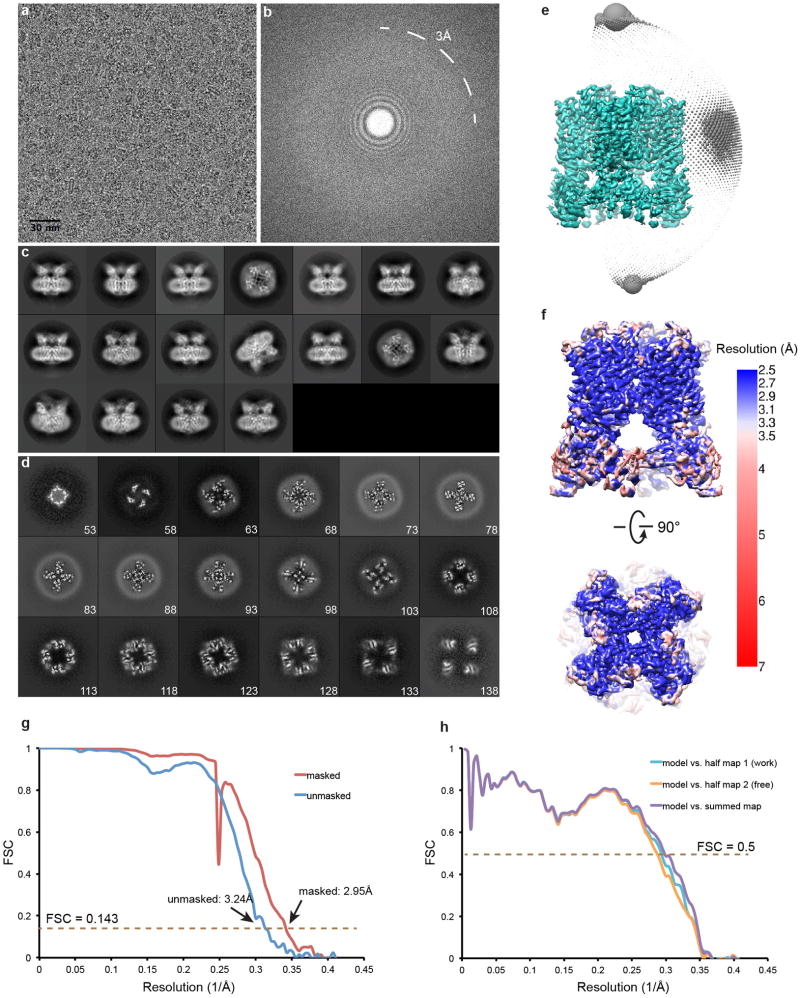
Extended Data Figure 2. Single-particle cryo-EM of unliganded TRPV1 in lipid nanodisc.
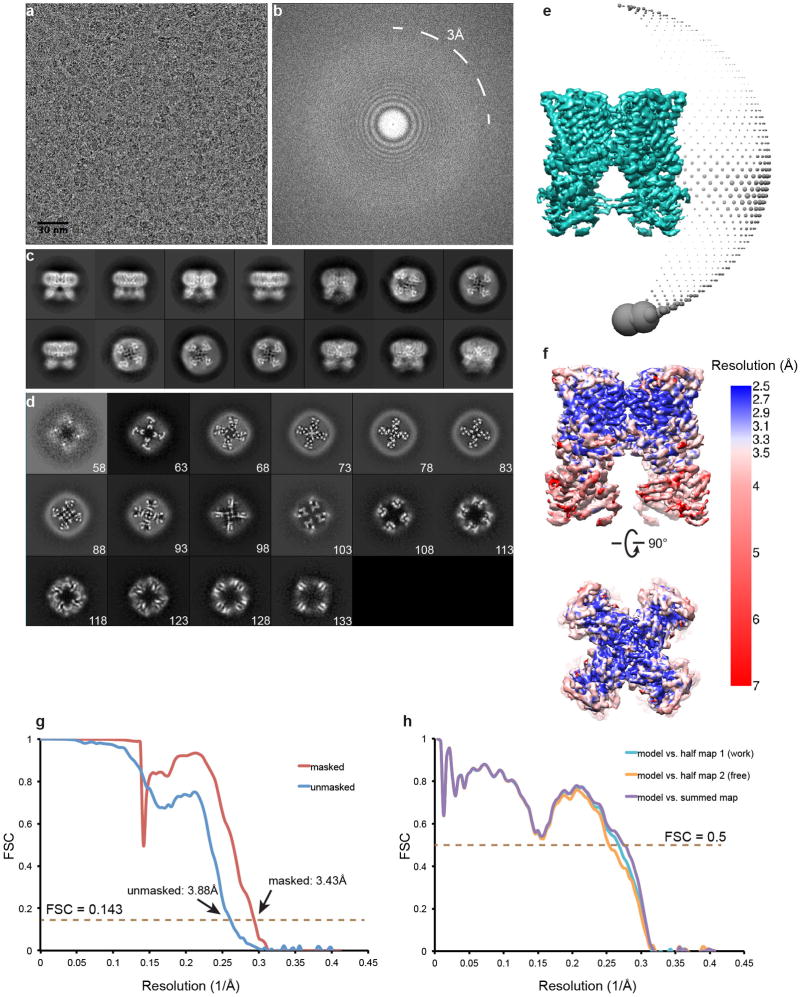
a, Representative raw micrograph of apo TRPV1 in nanodisc. b, Fourier transform of image in (a). Note Thon rings are visible to up to 3Å. c, Gallery of 2D class averages. d, Slices through the unsharpened density map at different levels along the channel symmetry axis (numbers start from extracellular side). e, Euler angle distribution of all particles included in the calculation of the final 3D reconstruction. Position of each sphere (grey) relative to the density map (green) represents its angle assignment and the radius of the sphere is proportional to the amount of particles in this specific orientation. f, Final 3D density map colored with local resolution in side and top views. g, FSC curves between two independently refined half maps before (blue) and after (red) the post-processing in RELION. h, FSC curves for cross validation: model versus summed map (purple), model versus half map 1 (used in test refinement, cyan), model versus half map 2 (not used in test refinement, orange). Small differences between the “work” and the “free” curves indicate little effect of over-fitting.
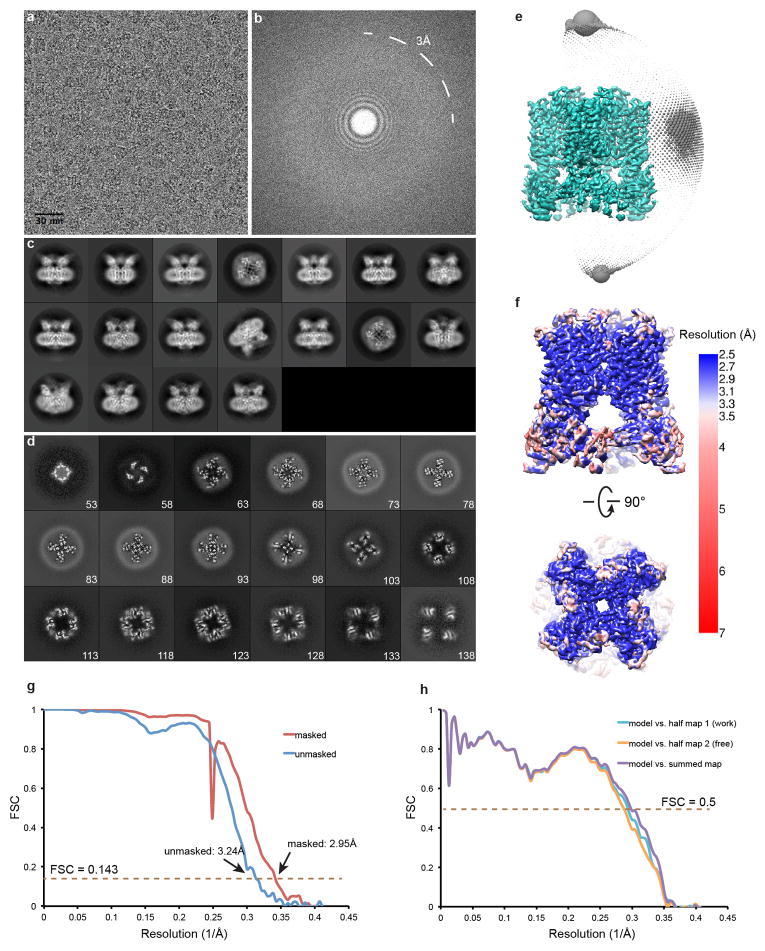
Extended Data Figure 3. Single-particle cryo-EM studies of agonist-bound TRPV1 in lipid nanodisc.
a, Representative raw micrograph of TRPV1-RTX/DkTx in nanodisc. b, Fourier transform of image in (a). c, Gallery of 2D class averages. d, Slices through the unsharpened density map at different levels along the channel symmetry axis (numbers start from extracellular side). e, Euler angle distribution of all particles included in the calculation of the final 3D reconstruction. Position of each sphere (grey) relative to the density map (green) represents its angle assignment and the radius of the sphere is proportional to the amount of particles in this specific orientation. f, Final 3D density map colored with local resolution in side and top views. g, FSC curves between two independently refined half maps before (blue) and after (red) the post-processing in RELION. h, FSC curves for cross validation: model versus summed map (purple), model versus half map 1 (used in test refinement, cyan), model versus half map 2 (not used in test refinement, orange). Small differences between the “work” and the “free” curves indicate little effect of over-fitting.
Extended Data Figure 4. Single-particle cryo-EM studies of antagonist-bound TRPV1 in lipid nanodisc.
a, Representative raw micrograph of TRPV1/capsazepine complex in nanodisc. b, Fourier transform of image in (a). c, Gallery of 2D class averages. d, Slices through the unsharpened density map at different levels along the channel symmetry axis (numbers start from extracellular side). e, Euler angle distribution of all particles included in the calculation of the final 3D reconstruction. Position of each sphere (grey) relative to the density map (green) represents its angle assignment and the radius of the sphere is proportional to the amount of particles in this specific orientation. f, Final 3D density map colored with local resolution in side and top views. g, FSC curves between two independently refined half maps before (blue) and after (red) the post-processing in RELION. h, FSC curves for cross validation: model versus summed map (purple), model versus half map 1 (used in test refinement, cyan), model versus half map 2 (not used in test refinement, orange). Small differences between the “work” and the “free” curves indicate little effect of over-fitting.
Extended Data Figure 5. Improved resolution for structures determined in nanodisc.
Comparison of density maps (blue mesh) determined from nanodisc- and amphipol-stabilized TRPV1 at various regions of the channel facing the lipid bilayer or at the bilayer surface. Refined atomic models (gold, nanodisc; grey, amphipol) are fit to corresponding densities. Side chain densities were significantly improved in nanodisc-stabilized TRPV1-DkTx/RTX structure (a, b), and notable improvement was also seen for unliganded (c, d) and capsazepine-bound (e, f) channels in nanodisc.
Extended Data Figure 6. Newly resolved TRPV1 cytoplasmic region in nanodisc-stabilized structure.
a, A region in TRPV1 C-terminus, previously unresolved in amphipol-stabilized structures (blue) is clearly resolved in the nanodisc-stabilized structure. b, Enlarged view of boxed region in (a) showing density map (blue mesh) and superimposed model (gold). Previously resolved TRP domain and N-terminal β-strands are depicted in ribbon diagram format (cyan).
Extended Data Figure 7. Categories of lipid densities observed in TRPV1 structures.
a, Two continuous layers of density (blue) contributed by lipid head groups of bilayer within nanodisc are shown for apo channel (left) and channel in complex with RTX/DkTx (right). b, Atomic model of annular lipids could be built into well resolved densities (blue mesh) surrounding the channel protein. DkTx is shown as ribbon diagram (pink). Top-down views show distribution of resolved annular lipids (blue) in inter-subunit crevices at the outer leaflet of the membrane. c, Well-resolved densities (blue mesh) in the structures representing a phosphatidylcholine molecule (left) and a phosphatidylinositol molecule (right). Transmembrane helices of TRPV1 close to the binding site are also shown as ribbon diagrams (grey).
Extended Data Figure 8. Focused analysis of DkTx density map.
a, Flow-chart showing procedures of focused 3D classification of DkTx and proximal regions (see Methods section for details). b, Atomic models for both knots of DkTx are superimposed on density maps (pink mesh).
Extended Data Figure 9. Lipid co-factor and vanilloids at the vanilloid binding site of TRPV1.
a, Chemical structure of phosphatidylinositol. b, Local environment of the phosphatidylinositol binding site may accommodate multiple phosphatidylinositide species with phosphate substituents at 3, 4 and/or 5 positions of the inositol ring (drawn in red). Adjacent regions of the channel are shown as ribbon diagram (grey). c, Tyr511 assumes two possible orientations that differ in apo versus agonist-bound states of the TRPV1 channel. In the apo state, one acyl chain of the resident phosphatidylinositol lipid (blue mesh superimposed with atomic model) prevents the Tyr511 side chain from assuming the upward rotamer position. d, Density maps of vanilloids (resiniferatoxin, red mesh; capsazepine, gold mesh) superimposed with density of the bound phosphatidylinositol lipid (blue mesh), suggesting that they occupy overlapping, but not identical sites. Atomic models for both drugs and their chemical structures are also shown. e, Overlap of transmembrane region of one TRPV1 subunit corresponding to apo (blue) and RTX/DkTx-bound (orange) states. Note the relatively small conformational change of the voltage sensor-like domain (S1–S4, boxed region). f, Overlap of transmembrane region of one TRPV1 subunit corresponding to apo (blue) and capsazepine-bound (gold) states.
Extended Data Table 1.
Comparison of imaging/data-processing variables between nanodisc and amphipol datasets
| unliganded | DkTx/RTX | capsazepine | |
|---|---|---|---|
|
| |||
| Data collection/processing | |||
| Voltage (kV) | 300 | 300 | 300 |
| Magnification | 31000 | 31000 | 31000 |
| Defocus range (μn) | −0.7 – −2.2 | −0.7 – −2.2 | −0.7 – −2.2 |
| Pixel size (Å) | 1.2156 | 1.2156 | 1.2156 |
| Total electron dose (e−/Å2) | 41 | 41 | 41 |
| Exposure time (s) | 6 | 6 | 6 |
| Number of images | 1000 | 1200 | 1219 |
| Number of frames per image | 30 | 30 | 30 |
| Initial particle number | 159193 | 218787 | 198831 |
| Final particle number | 30689 | 73929 | 80725 |
| Resolution (unmasked, Å) | 3.53 | 3.24 | 3.88 |
| Resolution (masked, Å) | 3.28 | 2.95 | 3.43 |
|
| |||
| Refinement | |||
| Number of atoms | 13360 | 13722 | 11928 |
| Protein | 11804 | 12570 | 11744 |
| Ligand | 1556 | 1152 | 184 |
| R.m.s deviations | |||
| Bond lengths (Å) | 0.011 | 0.011 | 0.024 |
| Bond angles (°) | 0.911 | 1.246 | 1.502 |
| Ramachandran | |||
| Favored (%) | 90.3 | 86.9 | 86.9 |
| Allowed (%) | 9.2 | 12.9 | 11.8 |
| Outlier (%) | 0.5 | 0.2 | 1.3 |
| Molprobity score | 2.13 | 2.25 | 2.55 |
| Unliganded | DkTx/RTX | Capsazepiine | ||||
|---|---|---|---|---|---|---|
|
| ||||||
| nanodisc | amphipol | nanodisc | amphipol | nanodisc | amphipol | |
| Defocus range (μn) | −0.7– −2.2 | −1.5– −3.0 | −0.7– −2.2 | −1.5– −3.0 | −0.7 – −2.2 | −0.8 – −2.2 |
| Number of images | 1000 | 946 | 1200 | −1000 | 1219 | 1002 |
| Motion correction | UcsfDfCorr | MotionCorr | UcsfDfCorr | MotionCorr | UcsfDfCorr | MotionCorr |
| Initial particle # | 159193 | 97166 | 218787 | 148670 | 198831 | 81709 |
| Final particle # | 30689 | 35645 | 73929 | 36158 | 80725 | 47477 |
| Resolution (Å) | 3.28 | 3.28 | 2.95 | 3.8 | 3.43 | 3.8 |
Acknowledgments
We thank our lab colleagues, past and present, for many helpful discussions and manuscript critique, Candice Paulsen and Evan Green for helping with initial screening for nanodisc reconstitution, and Eugene Palovcak for providing scripts for focused classification. This work was supported by grants from the National Institutes of Health (R01NS047723 and R37NS065071 to D.J., S10OD020054, R01GM098672, P01GM111126 and P50GM082250 to Y.C.). Y.C. is an Investigator with the Howard Hughes Medical Institute.
Footnotes
Author Contributions
Y.G. carried out protein purification, nanodisc reconstitution, and detailed cryo-EM experiments, including data acquisition, image processing, atomic model building and refinement of TRPV1-nanodisc complexes. E.C. carried out cryo-EM experiments of TRPV1-capsazepine complex solubilized in amphipol. All authors contributed to experimental design, data analysis, and manuscript preparation.
Author Information
The 3D cryo-EM density maps of TRPV1-nanodisc complexes without low-pass filter and amplitude modification have been deposited in the Electron Microscopy Data Bank under the accession numbers EMD-8118 (TRPV1-nanodisc), EMD-8117 (TRPV1-RTX/DkTx-nanodisc), EMD-8119 (TRPV1-capsazepine-nanodisc) and EMD-8120 (TRPV1-capsazepine in amphipol). Particle image stacks after motion correction related to TRPV1-nanodisc and TRPV1-RTX/DkTx-nanodisc are deposited for download at http://www.ebi.ac.uk/pdbe/emdb/empiar/ with identification number EMPIAR-10059. Atomic coordinates for the atomic model of TRPV1 in nanodisc, TRPV1-RTX/DkTx in nanodisc and TRPV1-capsazepine in nanodisc have been deposited in the Protein Data Bank under the accession number 5IRZ, 5IRX and 5IS0.
The authors declare no competing financial interests.
References
- 1.Hilgemann DW. Getting ready for the decade of the lipids. Annu Rev Physiol. 2003;65:697–700. doi: 10.1146/annurev.physiol.65.092101.142453. [DOI] [PubMed] [Google Scholar]
- 2.Hille B, Dickson EJ, Kruse M, Vivas O, Suh BC. Phosphoinositides regulate ion channels. Biochim Biophys Acta. 2015;1851:844–856. doi: 10.1016/j.bbalip.2014.09.010. [DOI] [PMC free article] [PubMed] [Google Scholar]
- 3.Lee AG. Biological membranes: the importance of molecular detail. Trends Biochem Sci. 2011;36:493–500. doi: 10.1016/j.tibs.2011.06.007. [DOI] [PubMed] [Google Scholar]
- 4.Caffrey M. A lipid’s eye view of membrane protein crystallization in mesophases. Curr Opin Struct Biol. 2000;10:486–497. doi: 10.1016/s0959-440x(00)00119-6. [DOI] [PubMed] [Google Scholar]
- 5.Landau EM, Rosenbusch JP. Lipidic cubic phases: a novel concept for the crystallization of membrane proteins. Proc Natl Acad Sci U S A. 1996;93:14532–14535. doi: 10.1073/pnas.93.25.14532. [DOI] [PMC free article] [PubMed] [Google Scholar]
- 6.Gonen T, et al. Lipid-protein interactions in double-layered two-dimensional AQP0 crystals. Nature. 2005;438:633–638. doi: 10.1038/nature04321. [DOI] [PMC free article] [PubMed] [Google Scholar]
- 7.Wang L, Sigworth FJ. Structure of the BK potassium channel in a lipid membrane from electron cryomicroscopy. Nature. 2009;461:292–295. doi: 10.1038/nature08291. [DOI] [PMC free article] [PubMed] [Google Scholar]
- 8.Bayburt TH, Grinkova YV, Sligar SG. Self-Assembly of Discoidal Phospholipid Bilayer Nanoparticles with Membrane Scaffold Proteins. NanoLetters. 2002;2:853–856. [Google Scholar]
- 9.Banerjee S, Huber T, Sakmar TP. Rapid incorporation of functional rhodopsin into nanoscale apolipoprotein bound bilayer (NABB) particles. Journal of molecular biology. 2008;377:1067–1081. doi: 10.1016/j.jmb.2008.01.066. [DOI] [PubMed] [Google Scholar]
- 10.Ritchie TK, et al. Chapter 11 - Reconstitution of membrane proteins in phospholipid bilayer nanodiscs. Methods Enzymol. 2009;464:211–231. doi: 10.1016/S0076-6879(09)64011-8. [DOI] [PMC free article] [PubMed] [Google Scholar]
- 11.Efremov RG, Leitner A, Aebersold R, Raunser S. Architecture and conformational switch mechanism of the ryanodine receptor. Nature. 2015;517:39–43. doi: 10.1038/nature13916. [DOI] [PubMed] [Google Scholar]
- 12.Frauenfeld J, et al. Cryo-EM structure of the ribosome-SecYE complex in the membrane environment. Nat Struct Mol Biol. 2011;18:614–621. doi: 10.1038/nsmb.2026. [DOI] [PMC free article] [PubMed] [Google Scholar]
- 13.Bai XC, McMullan G, Scheres SH. How cryo-EM is revolutionizing structural biology. Trends Biochem Sci. 2015;40:49–57. doi: 10.1016/j.tibs.2014.10.005. [DOI] [PubMed] [Google Scholar]
- 14.Cheng Y. Single-Particle Cryo-EM at Crystallographic Resolution. Cell. 2015;161:450–457. doi: 10.1016/j.cell.2015.03.049. [DOI] [PMC free article] [PubMed] [Google Scholar]
- 15.Kuhlbrandt W. Cryo-EM enters a new era. Elife. 2014;3:e03678. doi: 10.7554/eLife.03678. [DOI] [PMC free article] [PubMed] [Google Scholar]
- 16.Bevan S, Quallo T, Andersson DA. Trpv1. Handb Exp Pharmacol. 2014;222:207–245. doi: 10.1007/978-3-642-54215-2_9. [DOI] [PubMed] [Google Scholar]
- 17.Julius D. TRP channels and pain. Annu Rev Cell Dev Biol. 2013;29:355–384. doi: 10.1146/annurev-cellbio-101011-155833. [DOI] [PubMed] [Google Scholar]
- 18.Cao E, Liao M, Cheng Y, Julius D. TRPV1 structures in distinct conformations reveal activation mechanisms. Nature. 2013;504:113–118. doi: 10.1038/nature12823. [DOI] [PMC free article] [PubMed] [Google Scholar]
- 19.Liao M, Cao E, Julius D, Cheng Y. Structure of the TRPV1 ion channel determined by electron cryo-microscopy. Nature. 2013;504:107–112. doi: 10.1038/nature12822. [DOI] [PMC free article] [PubMed] [Google Scholar]
- 20.Long SB, Tao X, Campbell EB, MacKinnon R. Atomic structure of a voltage-dependent K+ channel in a lipid membrane-like environment. Nature. 2007;450:376–382. doi: 10.1038/nature06265. [DOI] [PubMed] [Google Scholar]
- 21.Szallasi A, Blumberg PM. Resiniferatoxin, a phorbol-related diterpene, acts as an ultrapotent analog of capsaicin, the irritant constituent in red pepper. Neuroscience. 1989;30:515–520. doi: 10.1016/0306-4522(89)90269-8. [DOI] [PubMed] [Google Scholar]
- 22.Bohlen CJ, et al. A bivalent tarantula toxin activates the capsaicin receptor, TRPV1, by targeting the outer pore domain. Cell. 2010;141:834–845. doi: 10.1016/j.cell.2010.03.052. [DOI] [PMC free article] [PubMed] [Google Scholar]
- 23.Chou MZ, Mtui T, Gao YD, Kohler M, Middleton RE. Resiniferatoxin binds to the capsaicin receptor (TRPV1) near the extracellular side of the S4 transmembrane domain. Biochemistry. 2004;43:2501–2511. doi: 10.1021/bi035981h. [DOI] [PubMed] [Google Scholar]
- 24.Gavva NR, et al. Molecular determinants of vanilloid sensitivity in TRPV1. J Biol Chem. 2004;279:20283–20295. doi: 10.1074/jbc.M312577200. [DOI] [PubMed] [Google Scholar]
- 25.Hanson SM, Newstead S, Swartz KJ, Sansom MSP. Capsaicin Interaction with TRPV1 Channels in a Lipid Bilayer: Molecular Dynamics Simulation. Biophysical journal. 2015;108:1425–1434. doi: 10.1016/j.bpj.2015.02.013. [DOI] [PMC free article] [PubMed] [Google Scholar]
- 26.Jordt SE, Julius D. Molecular basis for species-specific sensitivity to “hot” chili peppers. Cell. 2002;108:421–430. doi: 10.1016/s0092-8674(02)00637-2. [DOI] [PubMed] [Google Scholar]
- 27.Phillips E, Reeve A, Bevan S, McIntyre P. Identification of species-specific determinants of the action of the antagonist capsazepine and the agonist PPAHV on TRPV1. J Biol Chem. 2004;279:17165–17172. doi: 10.1074/jbc.M313328200. [DOI] [PubMed] [Google Scholar]
- 28.Yang F, et al. Structural mechanism underlying capsaicin binding and activation of the TRPV1 ion channel. Nat Chem Biol. 2015;11:518–524. doi: 10.1038/nchembio.1835. [DOI] [PMC free article] [PubMed] [Google Scholar]
- 29.Bevan S, et al. Capsazepine: a competitive antagonist of the sensory neurone excitant capsaicin. Br J Pharmacol. 1992;107:544–552. doi: 10.1111/j.1476-5381.1992.tb12781.x. [DOI] [PMC free article] [PubMed] [Google Scholar]
- 30.Boukalova S, Marsakova L, Teisinger J, Vlachova V. Conserved residues within the putative S4–S5 region serve distinct functions among thermosensitive vanilloid transient receptor potential (TRPV) channels. Journal of Biological Chemistry. 2010;285:41455–41462. doi: 10.1074/jbc.M110.145466. [DOI] [PMC free article] [PubMed] [Google Scholar]
- 31.Lee SY, MacKinnon R. A membrane-access mechanism of ion channel inhibition by voltage sensor toxins from spider venom. Nature. 2004;430:232–235. doi: 10.1038/nature02632. [DOI] [PubMed] [Google Scholar]
- 32.Milescu M, et al. Interactions between lipids and voltage sensor paddles detected with tarantula toxins. Nat Struct Mol Biol. 2009;16:1080–1085. doi: 10.1038/nsmb.1679. [DOI] [PMC free article] [PubMed] [Google Scholar]
- 33.Milescu M, et al. Tarantula toxins interact with voltage sensors within lipid membranes. J Gen Physiol. 2007;130:497–511. doi: 10.1085/jgp.200709869. [DOI] [PMC free article] [PubMed] [Google Scholar]
- 34.Bae C, et al. Structural insights into the mechanism of activation of the TRPV1 channel by a membrane-bound tarantula toxin. Elife. 2016;5 doi: 10.7554/eLife.11273. [DOI] [PMC free article] [PubMed] [Google Scholar]
- 35.Hardie RC. TRP channels and lipids: from Drosophila to mammalian physiology. J Physiol. 2007;578:9–24. doi: 10.1113/jphysiol.2006.118372. [DOI] [PMC free article] [PubMed] [Google Scholar]
- 36.Qin F. Regulation of TRP ion channels by phosphatidylinositol-4,5-bisphosphate. Handb Exp Pharmacol. 2007:509–525. doi: 10.1007/978-3-540-34891-7_30. [DOI] [PubMed] [Google Scholar]
- 37.Rohacs T. Phosphoinositide regulation of TRPV1 revisited. Pflugers Arch. 2015;467:1851–1869. doi: 10.1007/s00424-015-1695-3. [DOI] [PMC free article] [PubMed] [Google Scholar]
- 38.Cao E, Cordero-Morales JF, Liu B, Qin F, Julius D. TRPV1 channels are intrinsically heat sensitive and negatively regulated by phosphoinositide lipids. Neuron. 2013;77:667–679. doi: 10.1016/j.neuron.2012.12.016. [DOI] [PMC free article] [PubMed] [Google Scholar]
- 39.Prescott ED, Julius D. A modular PIP2 binding site as a determinant of capsaicin receptor sensitivity. Science. 2003;300:1284–1288. doi: 10.1126/science.1083646. [DOI] [PubMed] [Google Scholar]
- 40.Ufret-Vincenty CA, et al. Mechanism for phosphoinositide selectivity and activation of TRPV1 ion channels. J Gen Physiol. 2015;145:431–442. doi: 10.1085/jgp.201511354. [DOI] [PMC free article] [PubMed] [Google Scholar]
- 41.Ufret-Vincenty CA, Klein RM, Hua L, Angueyra J, Gordon SE. Localization of the PIP2 sensor of TRPV1 ion channels. J Biol Chem. 2011;286:9688–9698. doi: 10.1074/jbc.M110.192526. [DOI] [PMC free article] [PubMed] [Google Scholar]
- 42.Hansen SB, Tao X, MacKinnon R. Structural basis of PIP2 activation of the classical inward rectifier K+ channel Kir2.2. Nature. 2011;477:495–498. doi: 10.1038/nature10370. [DOI] [PMC free article] [PubMed] [Google Scholar]
- 43.Booth DS, Avila-Sakar A, Cheng Y. Visualizing proteins and macromolecular complexes by negative stain EM: from grid preparation to image acquisition. J Vis Exp. 2011 doi: 10.3791/3227. [DOI] [PMC free article] [PubMed] [Google Scholar]
- 44.Li X, et al. Electron counting and beam-induced motion correction enable near-atomic-resolution single-particle cryo-EM. Nat Methods. 2013;10:584–590. doi: 10.1038/nmeth.2472. [DOI] [PMC free article] [PubMed] [Google Scholar]
- 45.Li X, Zheng S, Agard DA, Cheng Y. Asynchronous data acquisition and on-the-fly analysis of dose fractionated cryoEM images by UCSFImage. J Struct Biol. 2015;192:174–178. doi: 10.1016/j.jsb.2015.09.003. [DOI] [PMC free article] [PubMed] [Google Scholar]
- 46.Rohou A, Grigorieff N. CTFFIND4: Fast and accurate defocus estimation from electron micrographs. J Struct Biol. 2015;192:216–221. doi: 10.1016/j.jsb.2015.08.008. [DOI] [PMC free article] [PubMed] [Google Scholar]
- 47.Frank J, et al. SPIDER and WEB: processing and visualization of images in 3D electron microscopy and related fields. Journal of structural biology. 1996;116:190–199. doi: 10.1006/jsbi.1996.0030. [DOI] [PubMed] [Google Scholar]
- 48.Grant T, Grigorieff N. Measuring the optimal exposure for single particle cryo-EM using a 2.6 A reconstruction of rotavirus VP6. Elife. 2015;4:e06980. doi: 10.7554/eLife.06980. [DOI] [PMC free article] [PubMed] [Google Scholar]
- 49.Scheres SHW. RELION: implementation of a Bayesian approach to cryo-EM structure determination. Journal of structural biology. 2012;180:519–530. doi: 10.1016/j.jsb.2012.09.006. [DOI] [PMC free article] [PubMed] [Google Scholar]
- 50.Scheres SHW, Chen S. Prevention of overfitting in cryo-EM structure determination. Nature methods. 2012;9:853–854. doi: 10.1038/nmeth.2115. [DOI] [PMC free article] [PubMed] [Google Scholar]
- 51.Kucukelbir A, Sigworth FJ, Tagare HD. Quantifying the local resolution of cryo-EM density maps. Nature methods. 2014;11:63–65. doi: 10.1038/nmeth.2727. [DOI] [PMC free article] [PubMed] [Google Scholar]
- 52.Hohn M, et al. SPARX, a new environment for Cryo-EM image processing. J Struct Biol. 2007;157:47–55. doi: 10.1016/j.jsb.2006.07.003. [DOI] [PubMed] [Google Scholar]
- 53.Tang G, et al. EMAN2: an extensible image processing suite for electron microscopy. Journal of structural biology. 2007;157:38–46. doi: 10.1016/j.jsb.2006.05.009. [DOI] [PubMed] [Google Scholar]
- 54.Pettersen EF, et al. UCSF Chimera--a visualization system for exploratory research and analysis. J Comput Chem. 2004;25:1605–1612. doi: 10.1002/jcc.20084. [DOI] [PubMed] [Google Scholar]
- 55.Emsley P, Lohkamp B, Scott WG, Cowtan K. Features and development of Coot. Acta Crystallographica Section D: Biological Crystallography. 2010;66:486–501. doi: 10.1107/S0907444910007493. [DOI] [PMC free article] [PubMed] [Google Scholar]
- 56.Moriarty NW, Grosse-Kunstleve RW, Adams PD. electronic Ligand Builder and Optimization Workbench (eLBOW): a tool for ligand coordinate and restraint generation. Acta Crystallographica Section D: Biological Crystallography. 2009;65:1074–1080. doi: 10.1107/S0907444909029436. [DOI] [PMC free article] [PubMed] [Google Scholar]
- 57.Adams PD, et al. PHENIX: a comprehensive Python-based system for macromolecular structure solution. Acta Crystallographica Section D: Biological Crystallography. 2010;66:213–221. doi: 10.1107/S0907444909052925. [DOI] [PMC free article] [PubMed] [Google Scholar]
- 58.van Aalten DMF, et al. PRODRG, a program for generating molecular topologies and unique molecular descriptors from coordinates of small molecules. Journal of computer-aided molecular design. 1996;10:255–262. doi: 10.1007/BF00355047. [DOI] [PubMed] [Google Scholar]
- 59.Afonine PV, Headd JJ, Terwilliger TC, Adams PD. New tool: phenix. real_space_refine. Computational Crystallography Newsletter. 2013;4:43–44. [Google Scholar]
- 60.Amunts A, et al. Structure of the yeast mitochondrial large ribosomal subunit. Science. 2014;343:1485–1489. doi: 10.1126/science.1249410. [DOI] [PMC free article] [PubMed] [Google Scholar]
- 61.Chen VB, et al. MolProbity: all-atom structure validation for macromolecular crystallography. Acta Crystallographica Section D: Biological Crystallography. 2009;66:12–21. doi: 10.1107/S0907444909042073. [DOI] [PMC free article] [PubMed] [Google Scholar]


