

Abstract
Background
Extracellular vesicles (EVs) are membrane-enclosed particles released by cells as a means of intercellular communication. They are potential novel biomarkers, as they are readily isolated from body fluids, and their composition reflects disease pathways. Whether these particles are released from sites of intestinal inflammation in Inflammatory Bowel Disease (IBD) has not previously been determined.
Methods
EVs were isolated by ultracentrifugation of colonic luminal fluid aspirates, and characterized according to surface proteins, and constituent mRNA and proteins. The effects of EVs on colonic epithelial cells and macrophages in culture were assessed at the transcriptional, translational and functional levels.
Results
Intestinal luminal aspirates contained abundant EVs, at a mean concentration of 4.3 × 10¹¹ particles/mL, and with a mean diameter of 146nm. EVs from IBD patients with a high endoscopic score (≥1) contained significantly higher mRNA and protein levels of IL-6, IL-8, IL-10 and TNF-α than EVs from healthy controls. EVs were absorbed by cultured colonic epithelial cells, leading to an increased translation of IL-8 protein by recipient cells when treated with EVs from IBD patients. EVs and EV-treated epithelial cells induced migration of a significantly greater number of macrophages than epithelial cells alone.
Conclusions
EVs shed from sites of intestinal inflammation in IBD patients have a distinct mRNA and protein profile from those of healthy individuals. These EVs have pro-inflammatory effects on the colonic epithelium, in vitro. Their stability in luminal samples, and their mRNA and protein content, identify them as a potential fecal biomarker that reflects mucosal inflammatory pathways.
Keywords: Inflammatory bowel disease, extracellular vesicles, colitis
INTRODUCTION
The mucosal inflammation noted in patients with ulcerative colitis (UC) and Crohn’s disease (CD) is characterized by an infiltration of the lamina propria by lymphocytes, macrophages and neutrophils1. The geographic distribution of this process within the intestinal tract is often variable, with normal mucosa existing adjacent to areas of intense inflammation, for reasons unknown2. The mechanisms that mediate such extension of sites of mucosal inflammation may provide insights into disease pathophysiology. In addition, there is growing interest in luminal factors shed from the inflamed mucosa that hold promise as biomarkers of disease activity3,4. Specifically, there is an unmet need for non-invasive biomarkers of IBD activity that distinguish underlying mucosal disease pathways in individuals. Fecal biomarkers, such as calprotectin, are reliable indicators of intestinal inflammation in general, but provide no understanding of dominant inflammatory pathways at work in the intestinal mucosa in any given patient5. These insights may be important as pathway-specific drugs become available6.
Extracellular vesicles (EVs), sometimes distinguished by size into ‘exosomes’ or ‘microparticles’, are membrane enclosed particles released from many cell types7. Ranging in size from 30 to 1000 nm, they have recently been recognized as key mediators of intercellular communication by serving as vehicles for transfer of bio-active molecules between cells8. EVs can transfer RNA and proteins to other cells for subsequent translation, or direct effect on cell functions9. EVs have been isolated from many biological fluids, including blood, urine, saliva, and breast milk, where their content is protected from endogenous proteases and nucleases by encapsulation in EV membranes10–12. Of particular interest for IBD pathogenesis, neutrophils, macrophages, lymphocytes, epithelial cells and commensal bacteria have all been shown to generate EVs, and their content and surface proteins reflect the cells of origin13–15. While an increased number of EVs has been detected in plasma / serum of patients with Crohn’s disease, the intestinal lumen remains an unexplored source of EVs in IBD patients16. Given the abundance of inflammatory and epithelial cells involved in IBD pathology, we hypothesized that, in patients with IBD, EVs that display the pro-inflammatory profile of their cells of origin are shed from sites of mucosal inflammation into the intestinal lumen, and eventually feces. They are accessible to sampling and analysis, and may thus represent a new non-invasive biomarker of IBD disease activity. In view of this, we isolated and characterized EVs from the intestinal lumen of patients with IBD, and determined their effects on the intestinal epithelium.
METHODS
Sample Collection
Intestinal luminal aspirates (LAs) were collected by aspiration of approximately 10 mL of luminal fluid from the colon during colonoscopy, under an IRB-approved protocol (2013P000347). Samples were centrifuged at 2,000× g for 15 min at 4°C to remove debris and cellular components. Aliquots of supernatants were stored at −80°C for subsequent EV analysis.
EV isolation
Stored samples were thawed on ice and further centrifuged at 10,000 ×g for 30 min at 4°C17. Crude EVs were prepared by ultracentrifugation of the supernatant at 100,000 ×g for 90 min at 4°C, using the Type SW40Ti rotor (Beckman Coulter, Pasadena CA). After centrifugation, supernatants were decanted, and the pellets were suspended in filtered (0.22μm PVDF filter, Celltreat Scientific, MA) 1× phosphate buffer saline (PBS; Corning, Manassas, VA), and multiple aliquots were stored at −80°C.
Transmission electron microscopy (TEM)
EV pellets were re-suspended in 0.22μm filtered 1× PBS and were pipetted (30μL) onto 200-mesh nickel formvar-coated grids (Electron Microscopy Sciences, 1560 Industry Road, Hatfield, PA). After allowing EVs to settle onto the grids for 5 min, liquid was removed from the grid with the Whatman paper. Grids were then stained with 10μL of 2% Uranyl Acetate for 1.5 min. Liquid was removed, and grids were dried overnight. The dried grids were imaged with a JEOL 1400 Transmission Electron Microscope (JEOL USA Inc. 11 Dearborn Rd, Peabody, MA).
Nanoparticle tracking analysis
The particle size distribution of EVs prepared by ultracentrifugation was analyzed by a nanoparticle tracking device (Nanosight LM20, Amesbury, UK)18. In this method, particles are visualized by their scattering of a focused laser beam and the collection of the scattered light by a standard optical microscope fitted with a charge-coupled device (CCD) video camera. The software calculates EV size and concentration from the video using the Strokes-Einstein equation.
Flow cytometry preparation and labeling
EV pellets were re-suspended in 0.22μm-filtered 1× PBS with an antibody or combination of antibodies in a ratio of 5 to 1000. APC/Cy7-conjugated anti-human CD14, APC-conjugated anti-human CD63, FITC-conjugated anti-human CD66b, PE-conjugated anti-human CD227 (MUC-1), and isotype-matched conjugated control antibodies were purchased from BioLegend (San Diego, CA). FITC-conjugated anti-human CD45 and its isotype control antibody were purchased from eBioscience Inc. (San Diego, CA). After 30min incubation at RT, EVs were suspended in a total volume of 400μL of filtered 1× PBS and analyzed by MoFlo Astrios TM (Beckman Coulter, Inc.)19. The flow cytometric method for EVs was based on the nanoscale flow cytometry (nanoFCM), which made it possible to detect and characterize EVs smaller than 500. All controls and samples were acquired at a pressure differential of 0.3–0.5 PSI. At this PSI setting EVs were processed at 1,000–3,000 events per second. Data collected from the experiments were analyzed using Kaluza (analysis software from Beckman Coulter, Inc.). In preliminary standardization experiments, an EV gate was established on MoFlo Astrios by using the ApogeeMix (Cat#1493, Apogee Flow Systems, Hertforshire), which contains a mixture of plastic spheres (180nm, 240nm, 300nm, 590nm, 880nm and 1300nm diameter) and green fluorescent beads (110nm and 500nm diameter). The gate was drawn to encompass the two distinct fluorescent populations (110nm and 500nm) (Supplement Fig. 2A and B). Within the EV gate, CD63 positive gate was established in order to characterize the surface markers of CD63+ EVs (Supplement Fig. 2D). Both FS-Height (x-axis) and SS-Height (y-axis) were set to a logarithmic scale19.
mRNA analysis
EV filter tips from the collection filter (Hitachi Chemical Co. America, Ltd., R&D Center, Irvine, CA), were placed onto a 96-well frame, 80μL of lysis buffer (HCR) was added and incubated at 37°C for 10 min to release mRNA from EVs20,21. The 96-well frame was then placed onto an oligo(dT)-immobilized plate, and centrifuged for 5 min at 2,000 ×g at 4°C. The resultant oligo(dT)-immobilized plate was stored at 4°C overnight for the hybridization between poly(A)+ tail of mRNA and immobilized oligo(dT). cDNA was then directly synthesized in the same microplate by adding dNTPs (final 5mM), MMLV reverse transcriptase (final 2.7 U/μL), and RNasin (0.13 U/μL) (Life Technologies) and incubating at 37°C for 2 hours. The cDNA was diluted 1:1 with nuclease-free water, and used for subsequent real time polymerase chain reaction (PCR) using SYBR green methodology (iTaq, BioRad) in the final volume of 5μL in a 384-well plate. Each gene was amplified individually. The PCR condition was one cycle of 95°C for 5 min, followed by 40 cycles of 1 min 95°C denature, and 1 min 65°C annealing/extension in PRSIM7900 (Applied Biosystem, Foster City, CA). Melting curve analysis was performed every time to confirm that amplification was derived from a single peak. The cycle threshold (Ct) was determined by the analytical software (SDS, Applied Biosystem). According to our previous analysis, Ct=32 was used as a baseline. Primer sequences used in this study are summarized in the supplementary Table 1. To determine the stability of EV mRNA, fetal calf serum-derived purified standard EVs obtained from ultracentrifugation of FCS (Life Technologies) were incubated in PBS, LA, or fecal supernatants at 37°C for 30 minutes. Bovine hemoglobin (HBB) and GAPDH mRNA were quantified, using EV filter tips. Naked rat total RNA purchased from Clontech (Mountain View, CA) was also incubated in PBS, LA, or fecal supernatants at 37°C for 30 minutes, then rat ACTB and GAPDH mRNA levels were quantified.
Multiplex Cytokine Measurement
A magnetic bead-based multiplex human cytokine assay (Milliplex MAP Kit; EMD Millipore Corporation, St. Charles, MI) was used to simultaneously measure multiple cytokines in LA-derived EVs according to the manufacturer’s protocol. Briefly, EV pellets after ultracentrifugation were re-suspended in lysis buffer (1X PBS with 1% Triton-X100) with a tablet of protease inhibitor. Samples and standards were analyzed in triplicate, according to the manufacturer’s protocol. Drive fluid was added to each well, and the plate was run on MAGPIX Multiplex Reader (Luminex Corporation, Austin, TX). The analysis was done on xPONENT Software. The value for each sample was normalized to its total protein concentration. The total EV protein quantification was performed using a Bradford assay kit (Bio-Rad). The range of protein concentrations from 0.2 to 1.5mg/mL was used for a calibration graph.
Cell culture
Cells were obtained from American Type Culture Collection (ATCC, Manassas, VA) and grown at 37°C in a humidified atmosphere of 95% and 5% CO2. Human colon epithelial cell line (DLD-1) was routinely cultured in RPMI-1640 medium (Sigma-Aldrich) supplemented with 10% fetal calf serum (FCS, Life Technologies) and 1% penicillin/streptomycin. Mouse colon epithelial cell line (CMT-93) was cultured in Dulbecco’s modified Eagle medium (DMEM, Sigma Aldrich) supplemented with 10% FCS and 1% penicillin/streptomycin. FCS was depleted of bovine EV by filtration through a 0.22-μm PVDF filter (Celltreat Scientific) and ultracentrifugation at 100,000 xg for 90 min at 4°C. After 80% confluence, the cells were starved with serum-free medium prior to LA-derived EV exposure. After cells were treated with either LA-derived EVs of healthy controls (HC) or those of patients with IBD for a certain incubation period, the cells were washed extensively to remove free EV, and gene expression was measured by RT-PCR.
Exo-Glow
For fluorescent labeling of EV mRNA, Exo-Glow (System Bioscience), acridine organge nucleic acid-selective fluorescent dye, was added to the purified EV RNA in a ratio of 1 to 10 according to the manufacturer’s instructions. After EV mRNAs were fluorescently labeled, the labeled EVs were then added to DLD-1 cells. After 4 hours of incubation, the cells were gently washed with 1× PBS, followed by RNase treatment. Cells were then observed with a fluorescence microscope (460nm excitation, 650nm emission, Carl Zeiss Microscopy GmbH) at 40× magnification, using z-scale control feature.
Isolation of human macrophages from peripheral blood
Peripheral blood mononuclear cells (PBMCs) were isolated from whole blood samples from healthy donors, using Ficoll (Sigma-Aldrich). Monocytes were purified from PBMCs, using anti-CD14 magnetic beads (MitenyiBiotec, Leiden, The Netherlands) using MACS technology, according to the manufacturer’s protocol. For maturation into macrophages, monocytes were washed and cultured at a concentration of 2 × 10⁶ cells/mL in macrophage medium (RPMI-1640, Sigma-Aldrich), supplemented with 10% FCS, 1% penicillin/streptomycin, and 10ng/mL M-CSF (PeproTech, Rocky Hill, NJ) at 37°C in a humidified atmosphere of 95% and 5% CO2 for 5 days.
Migration Assay
Migration assays were performed in trans-well chambers with 5-μm pore polycarbonate membrane (Costar, Cambridge, MA)22. 5 × 10⁴ serum-starved macrophages were loaded into the migration chamber. Purified LA-derived EVs or DLD-1 cells that were pre-incubated with LA-derived EVs were placed in the lower chamber. Medium with 10% FCS and serum-free medium was used as a positive and a negative control, respectively. The cells were allowed to migrate for 10 hours at 37°C in a humidified atmosphere of 95% and 5% CO2. After incubation, the inserts were washed with 1× PBS. Non-migrated cells were gently removed using a cotton swab, and the migrated cells were fixed with 4% PFA for an hour. The cells were then stained with crystal violet solution, and the number of cells/field was counted on top of the membrane, using a 10× magnification. In order to track the EV movement during the migration, the EVs in the lower chamber were labeled with Exo-glow. After migration, the nucleic acids of macrophages were stained with stained with Hoechst 33258 (Thermofisher) for 3 min at room temperature in dark, and cells were analyzed with a fluorescence microscopy (Carl Zeiss Microscopy).
Statistical analysis
All samples were tested in triplicate, and each experiment repeated at least twice to test initial results. To compare mRNA and protein levels between two groups, parametric unpaired t-test was used. Heatmaps were used to compare mRNA profiles when they were detected from all samples. In contrast, when one of the samples was undetected, non-parametric unpaired Mann-Whitney U-test was used. P-values<0.05 were considered significant. The statistical analyses were performed using Excel (Microsoft) and Prism6 (GraphPad software, La Jolla, CA).
RESULTS
Characteristics of EVs in Luminal Aspirates (LAs)
Samples for this study were collected from 63 patients with IBD and 14 healthy controls (HC) (characteristics of IBD patients are provided in Supplementary Table 2). EVs obtained by ultracentrifugation were clearly visualized on 200-mesh nickel formvar-coated grids by transmission electron microscopy (TEM) (Fig. 1A). Most EVs had a spherical shape with a diameter of <200nm enclosed by a lipid bilayer. These particles were also determined to have a mean size of 146 ±0.5nm (range 50–700nm) by nanoparticle tracking analysis (NTA) (Fig. 1B). The size of these particles from both analyses is consistent with known features of EVs23. The mean concentration of EVs (by NTA) was similar in pooled LA samples from IBD patients (4.3±0.06 × 10¹¹ particles/mL, N=3) and healthy controls (5.3±0.35 × 10¹¹ particles/mL, N=3).
Figure 1.
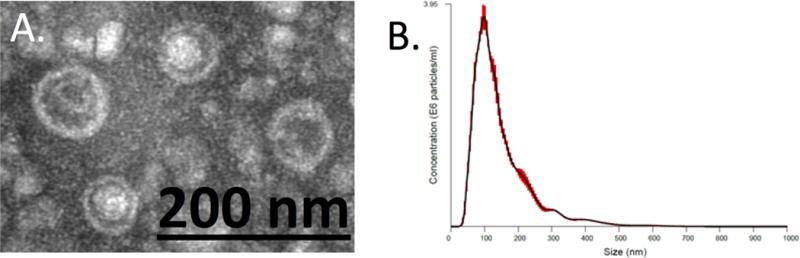
Characterization of LA-derived EVs. (A) Transmission electron microscopy (TEM) analysis of EVs obtained by ultracentrifugation showing spherical structures enclosed by a lipid bilayer. (B) Nanoparticle tracking analysis (NTA) of colonic EV obtained by ultracentrifugation. Distribution of EV particle concentration (y axis) by size (x axis). Red area is the standard error.
Since epithelial cells, lymphocytes, neutrophils and macrophages at sites of inflammation are all potential sources of EVs obtained from colonic aspirates, we next performed flow cytometry to identify the cell surface markers of these EVs. Flow cytometry of the cellular fraction of LA samples demonstrated that neutrophils are the predominant immune cells present in the lumen of patients with IBD, consistent with prior reports (Supplementary Fig. 1)24. Therefore, we performed flow cytometry to quantify CD14 (monocyte marker), CD45 (leukocyte marker), CD66b (neutrophil marker), and MUC-1 (epithelial marker) on isolated EVs. An EV gate was first established using the ApogeeMix, a mixture of 110nm and 500nm fluorescent beads (Supplementary Fig. 2A and B). Particles captured within the EV gate (Supplementary Fig. 2C) were further gated on CD63 positive, and both unstained and isotype-matched control antibodies were used to set the gate (Supplementary Fig. 2D). As a result, 8.5% and 39.5% of CD63 positive particles from LA samples from controls (HC) were positive for CD66b and MUC-1, respectively (Fig. 2A and B). In contrast, 10.8% and 47.4% of CD63 positive particles in the IBD samples were CD66b positive and MUC-1 positive, respectively (Fig. 2C and D). Less than 5% of CD63 positive particles were positive for CD14 and CD45 in both samples (data not shown). This data determines that luminal particles from IBD patients are in the EV size range (<500nm) and are CD63+/CD66b+ double positive and CD63+/MUC-1+ double positive, consistent with a neutrophil and epithelium origin.
Figure 2.
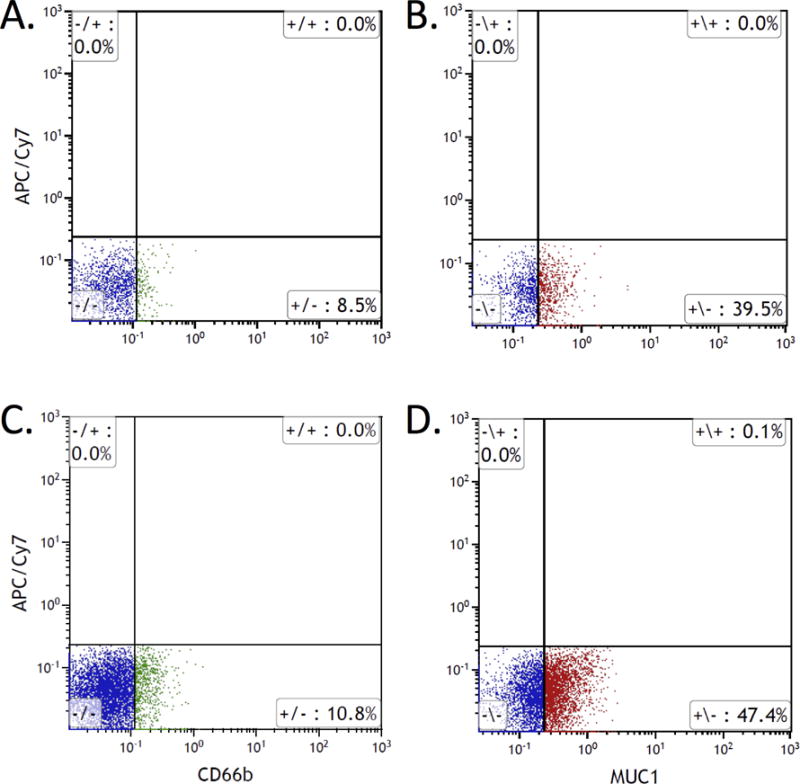
Flow cytometry analysis of EVs isolated from colonic luminal aspirates. Purified EVs from HC (A & B) and IBD patients (C & D) were stained with anti-CD63 combined with either anti-CD66b (A & C) or anti-MUC-1 (B & D). All images are the gating of CD63 positive particles within EV gate (see Supplementary Fig. 2).
EV Content
Given the differences in cell surface characteristics noted in EVs isolated from IBD patients as compared to healthy controls, we next sought to evaluate the mRNA and protein content of these EVs. An oligo(dT)-immobilized plate was used to capture eukaryotic mRNA from total RNA for PCR after lysis of isolated EVs20. As shown in Supplementary Fig. 3A, there was differential expression of mRNA between EV samples from HC and those from both UC and CD. In particular, there was significantly increased mRNA for TGFβ, DEFA3, and S100A9 in IBD patient derived EV samples, but decreased expression of MUC2 (Supplementary Fig. 3B–E). Interestingly, EV mRNA profiles also exhibited differential expression between different endoscopic grades of severity (Mayo endoscopy score) in patients with IBD (Fig. 3A). IRF5 and NFKB1, for example, were uniquely expressed in EVs from patients with more severe endoscopic disease. To determine if EV mRNA also remained intact in fecal samples as in LA samples, we spiked samples of PBS, LA and feces with fetal calf serum-derived purified standard EVs, then measured bovine Hemoglobin and GAPDH. As can be seen in Supplementary Figure 4A, the levels of mRNA for bovine GAPDH and Hemoglobin were similar in both fecal and LA samples, confirming the integrity of EV mRNA in fecal samples. In contrast, the levels of naked mRNA for rat ACTB and GAPDH were significantly lower in fecal and LA samples than in PBS (Supplementary Fig. 4B).
Figure 3.
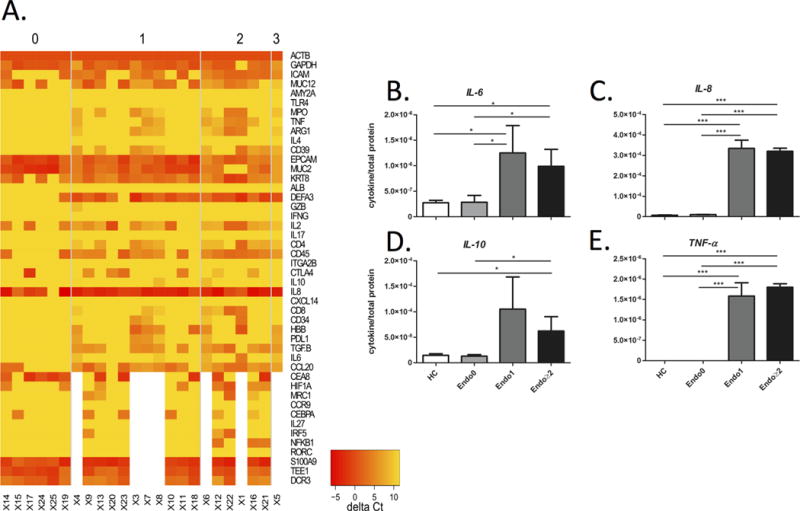
Levels of mRNA and cytokine proteins in lysed EVs from patients grouped according to Mayo endoscopic score. (A) Heatmap of normalized mRNA data was compared among Mayo score 0, 1, 2 and 3; yellow and red indicates lower expression and higher expression, respectively. (B–E) Each graph represents the mean cytokine level, normalized to its total protein concentration, as measured by ELISA in colonic EV samples from healthy controls (HC, N=3), and IBD patients with Mayo endoscopic scores of 0 (N=12), 1 (N=12), and ≥2 (N=12). Note that error bars are standard deviations.
Since EVs are known to contain proteins as well as genomic material, we used a multiplex ELISA to measure protein concentrations of 8 cytokines in lysed EVs. The levels of, IL-6, IL-8, IL-10, and TNF-α were all significantly higher in EVs from IBD patients with a Mayo score ≥ 1 as compared to those from healthy controls. In contrast, patients in endoscopic remission (Mayo score 0) had similar EV cytokine concentrations to healthy controls (Fig. 3B–E).
Effects of IBD Sample EVs on Epithelial Cells
Given the pro-inflammatory potential of constituent mRNA and proteins in EVs from IBD patients, we next evaluated their effects on epithelial cells in culture. To determine if colonocytes could absorb luminal EVs, isolated EVs from LA samples were labelled with acridine orange, a nucleic acid-selective fluorescent dye, and then co-cultured with DLD-1 cells (human colonocyte cell line) for 4 hours. As can be seen in Figure 4A, labelled EV mRNA was present within epithelial cells after washing with RNAse to remove unabsorbed EV mRNA. In Figure 4B, no fluorescent was detected in the negative control when co-culturing the cells with Exo-Glow dye only with the same washing method. To confirm that EV mRNA could be transferred to recipient cells, a mouse intestinal epithelial cell line (CMT-93) was also co-cultured with EVs from patient samples. As mice do not have an IL-8 gene any IL-8 mRNA detected in these cells could only be of EV origin. At 24 hours of incubation of CMT-93 cells with PBS or EVs from healthy controls or IBD patients, there was a significant increase in intra-cellular IL-8 mRNA in cells cultured with EVs from IBD patients (Fig. 4C). Since EVs from IBD patients contain higher amounts of IL-8 mRNA than from healthy controls (Supplementary Fig. 3A), we also confirmed that these EVs lead to an increase in intracellular IL-8 mRNA levels in human epithelial cells incubated with IBD EVs, when compared to EVs from controls (Fig. 4D).
Figure 4.
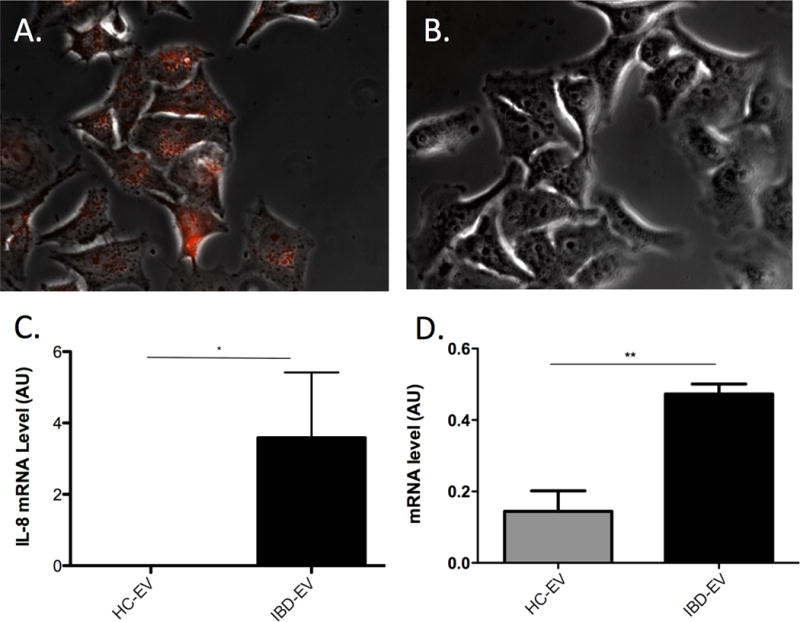
Absorption of EV RNA by epithelial cells. (A) Direct view of fluorescently labeled EV-RNA (red) observed by fluorescent microscopy in DLD-1 cells after 4 hours of co-culture and subsequent washing of cells with PBS and RNAse (40× magnification). (B) Image of negative control using Exo-Glow dye only with the same washing method. (C) Human IL-8 mRNA levels (AU) in CMT93 cell line (mouse colonocytes) after incubation with EVs from healthy controls (HC-EV) or IBD patients (IBD-EV) for 24 hours. (D) Human IL-8 mRNA levels (AU) in DLD-1 cell line (human colonocytes) after incubation with EVs from healthy controls (HC-EV) or IBD patients (IBD-EV) for 24 hours. Note that error bars are standard deviations.
To test whether other cell types also respond to EV absorption, we also measured the amount of IL-8 protein in the supernatant of cultured macrophages and epithelial cells (DLD-1) incubated with IBD-derived EVs, in contrast to cells cultured with PBS or control EVs. As can be seen in Figure 5, IBD-derived EVs induced a significantly greater secretion of IL-8 protein by macrophages (A) and epithelial cells (B) than EVs from healthy controls. This effect of IBD derived EVs was similar to the effect of bacterial lipopolysaccharide (LPS) on macrophages (Fig. 5A). However, IL-8 production by DLD-1 was not increased by LPS stimulation (Fig. 5B).
Figure 5.
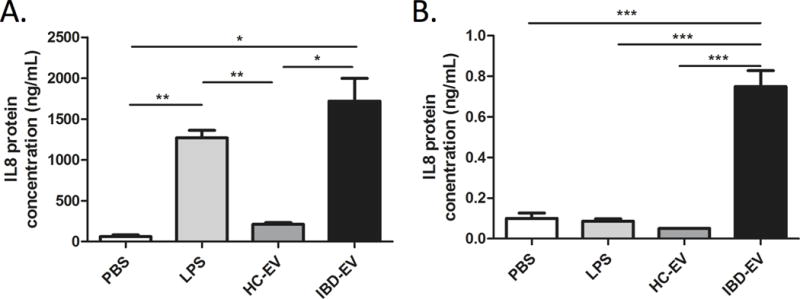
Effect of EVs on macrophages and epithelial cells IL-8 production. Human monocyte-derived macrophages and DLD-1 cell lines were incubated with PBS (negative control), lipopolysaccharide (LPS, positive control), EVs from healthy controls (HC-EV), or EVs from IBD patients (IBD-EV) for 24 hours, followed by analysis of supernatants for IL-8 protein levels by ELISA. Note that error bars are standard deviations.
To explore possible functional implications of luminal EVs in IBD, we next determined the effects of EVs on the migratory capacity of human monocyte-derived macrophages. We first confirmed that EV mRNA reaches the macrophages on the top of the migration well by labelling them with acridine orange, a nucleic acid-selective fluorescent dye. As can be seen in Figure 6A, macrophages at the top of the trans-well contained labelled EV mRNA 10 hours after introduction of EVs from patients with IBD into the lower compartment of the trans-well. Next, we quantified macrophage migration after exposure to IBD derived EVs, DLD-1 cells or DLD-1 cells that were pre-incubated with IBD derived EVs. Serum-free medium and 10% FCS were used as negative and positive controls, respectively. A mean of 382 macrophages per mm2 migrated to the central membrane after exposure to IBD derived EVs, compared to 326 cells per mm2 after exposure to DLD-1 cells pre-cultured with IBD derived EVs, and 9 cells per mm2 after exposure to medium alone ((p<0.01, Fig. 6B).
Figure 6.
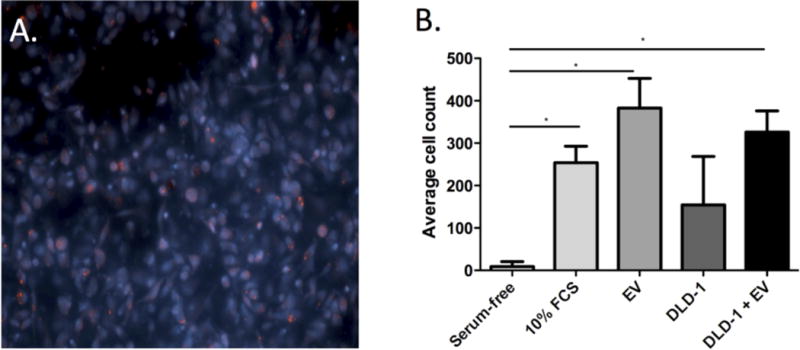
Macrophage migration assay. Images of marcophages on trans-well membranes after exposure of macrophages to EVs from IBD patients labelled with acridine orange (red), and the nucleic acids of macrophages were stained with Hoechst 33258 (blue) (A, 20× magnification); (B) Mean cell counts on the trans-well membrane after 10 hours of exposure of macrophages to serum-free medium (negative control), 10% FBS (positive control), EVs from IBD patients (IBD EV), DLD-1 cells alone, or DLD-1 cells cultured with IBD EVs. Note that error bars are standard deviations.
DISCUSSION
This is the first study, to our knowledge, to isolate and characterize luminal EVs from patients with IBD. Our data suggest that EV content reflects disease activity, as EV associated mRNA levels of key cytokines were differentially expressed between varying grades of endoscopic disease severity. Of particular importance for disease pathogenesis, EVs released into the intestinal lumen can be absorbed by epithelial cells and macrophages, leading to increased IL-8 expression and induction of macrophage migration; mechanisms that may underlie local propagation of inflammation.
Recent research on the properties of EVs has revealed them to be versatile ‘ambassadors’ for their original cells26. In cancer, circulating plasma EVs have been reported to contain cell-specific protein and RNA profiles that are evaluated for clinical use as biomarkers of cancer type and prognosis27,28. Considering the many cell types that interact at the mucosal interface, the intestinal lumen could be a rich source for disease-specific EVs in IBD. For example, commensal bacteria are known to release signaling vesicles29,30. Similarly, dendritic cells and regulatory T cells release exosomes with anti-inflammatory properties31,32. We demonstrate here that RNA contained in EV is stable in fecal samples. These properties make fecal / intestinal EVs an intriguing possibility for a new, completely non-invasive diagnostic tool. Although known fecal (calprotectin) and serum (CRP) biomarkers used in IBD can correlate with macroscopic indices of inflammation, they provide no insights into which inflammatory pathways may be predominant in a given individual. Our present data suggest that EV content may reflect the transcriptional activity of their originator cells at inflammatory sites, making them a potential companion diagnostic for pathway-specific drugs33.
Within a given endoscopic severity grade inter-patient differences in mRNA profiles were detectable, suggesting a potential role for EVs in assessing disease severity. In addition, our demonstration of the stability of EV RNA in fecal samples is an additional important characteristic. These properties warrant EVs being examined as potential companion diagnostic for pathway-specific drugs33. Beyond their observational value, there is also emerging data on the potential to harness EVs as therapeutic mediators34. This could have important implications for future IBD therapies delivered to the mucosa via EVs.
There are a number of questions that need to be addressed by further studies. We chose ultracentrifugation for EV isolation because it is the most widely published and most reproducible, but alternative isolation methods, like density gradient centrifugation, might however lead to a higher yield and possibly higher sensitivity. Our approximation of luminal EV concentration showed no significant difference between IBD patients and healthy controls, but needs to be interpreted with caution, in light of methodological limitations from their small size and lack of specific EV marker. However, in order to use EVs or EV components as a functional biomarker of IBD, the number or concentration may not be relevant. We show here that specific functional molecules like cytokines and cytokine mRNA that are encapsulated and thus conserved and protected by EVs can predict disease severity when normalized to an inherent control like total protein content or mRNA of a universally expressed protein. These internal standards for normalization need to be carefully tested before clinical application because the exact mechanisms of EV generation and packaging of RNA and protein contents remain unclear. Our intestinal luminal samples likely comprise a pool of heterogeneous EVs generated from many cell types in the mucosa. Our results from flow cytometry, RNA and protein analysis suggest predominant neutrophil origin of EVs, but it is likely that epithelial cells, lymphocytes and microbes in IBD patients contribute to the luminal EV pool and may have divergent contents and functional properties.
In conclusion, this study demonstrates that the intestinal lumen is a rich source of EVs, and these particles contain functional mRNA and proteins that can affect mucosal cells. This knowledge should stimulate further studies to link EV content to disease pathogenesis and target-specific pathways for biomarker development.
Supplementary Material
Supplementary Figure 1. Flow cytometry of the cellular fraction of luminal aspirates. Luminal aspirates were centrifuged to isolate the cellular components, and labelled with anti-CD45 and anti-14 antibodies to identify neutrophils and monocytes. (A) All cells / ungated. (B) CD45+ cells from outlined gate in (A). CD14 high/positive was labeled as monocytes and CD14 low/negative was labeled as neutrophils.
Supplementary Figure 2. Particle-size-based gating strategy. The ApogeeMix was subjected to flow cytometric analysis. The EV gate was designed to include both population of fluorescent beads (110nm and 500nm) and the area that are most likely show particles smaller than 500nm (A & B). (C) Representative colonic EV sample from IBD patients (41%). (D) CD63 positive gate was created based on the same sample single stained with anti-CD63 (18.4%).
Supplementary Figure. 3. Levels of EV mRNA in colonic samples from IBD patients and controls. (A) Heatmap of mRNA, normalized by ACTB, was compared among healthy control (HC), UC, and CD; yellow indicates lower expression and red indicates higher expression. (B–E) Scatter plots of mRNA levels (Arbitrary Unit, AU) in samples from healthy controls (HC, N=5), UC (N=9), and CD (N=10) patients, as assessed by RT-PCR.
Supplementary Figure 4. Stability of EV mRNA in LA and stool. (A) PBS, LA or fecal supernatants were incubated with fetal calf serum-derived purified standard EV at 37°C for 30 minutes, then bovine Hemoglobin (HBB) and GAPDH mRNA levels (1/Ct) were quantified as described in the Methods. (B) Naked rat total RNA was incubated with PBS, LA, or fecal supernatants at 37°C for 30 minutes, then rat ACTB and GAPDH mRNA levels (1/Ct) were quantified.
Acknowledgments
We are grateful to Adam S Cheifetz, Harry T Anastopoulos, Amanda Ting and the endoscopy nurses for collection of luminal samples, Marcin Zemla for generating the TEM image for us in Figure 1A, Kirsty M Danielson and Vasilis Toxavidis for flow cytometry analysis of EVs using nanoFCM, and Cindy Yamamoto for secretarial assistance.
Funding Statement:
Alan C Moss is supported by NIH grants K23DK084338 and R03DK105161-01. Simon C Robson is supported by NIH grants P01 HL107152 and Helmsley Charitable Trust 281574.5069091.0010. PCR, electron microscopy, filter tips and fecal bovine EVs were generously performed or supplied by Hitachi Chemical Co. America under a research agreement with Beth Israel Deaconess Medical Center.
Footnotes
Authorship Statement:
SM, LF, EC, and MM performed the laboratory experiments. SM, LF, MM and ACM collected and interpreted the data. SM, MM and ACM designed the experiments. All authors prepared and critically reviewed the manuscript and figures. ACM obtained funding and supervised the completion of the projects.
Competing Interest:
ACM and MM are the holders of a patent on the use of extracellular vesicles in diagnosis of inflammatory bowel disease. No other conflicts to declare.
References
- 1.Cader MZ, Kaser A. Recent advances in inflammatory bowel disease: Mucosal immune cells in intestinal inflammation. Gut. 2013;62(11):1653–1664. doi: 10.1136/gutjnl-2012-303955. [DOI] [PubMed] [Google Scholar]
- 2.Vasquez N, Mangin I, Lepage P, et al. Patchy distribution of mucosal lesions in ileal crohn’s disease is not linked to differences in the dominant mucosa-associated bacteria: A study using fluorescence in situ hybridization and temporal temperature gradient gel electrophoresis. Inflamm Bowel Dis. 2007;13(6):684–692. doi: 10.1002/ibd.20084. [DOI] [PubMed] [Google Scholar]
- 3.Halloran B, Chang J, Shih DQ, et al. Molecular patterns in human ulcerative colitis and correlation with response to infliximab. Inflamm Bowel Dis. 2014;20(12):2353–2363. doi: 10.1097/MIB.0000000000000239. [DOI] [PMC free article] [PubMed] [Google Scholar]
- 4.Holtta V, Klemetti P, Sipponen T, et al. IL-23/IL-17 immunity as a hallmark of crohn’s disease. Inflamm Bowel Dis. 2008;14(9):1175–1184. doi: 10.1002/ibd.20475. [DOI] [PubMed] [Google Scholar]
- 5.Sands BE. Biomarkers of inflammation in inflammatory bowel disease. Gastroenterology. 2015 doi: 10.1053/j.gastro.2015.07.003. [DOI] [PubMed] [Google Scholar]
- 6.Gerich ME, McGovern DP. Towards personalized care in IBD. Nat Rev Gastroenterol Hepatol. 2014;11(5):287–299. doi: 10.1038/nrgastro.2013.242. [DOI] [PubMed] [Google Scholar]
- 7.Yuana Y, Sturk A, Nieuwland R. Extracellular vesicles in physiological and pathological conditions. Blood Rev. 2013;27(1):31–39. doi: 10.1016/j.blre.2012.12.002. [DOI] [PubMed] [Google Scholar]
- 8.Wahlgren J, Karlson Tde L, Glader P, Telemo E, Valadi H. Activated human T cells secrete exosomes that participate in IL-2 mediated immune response signaling. PLoS One. 2012;7(11):e49723. doi: 10.1371/journal.pone.0049723. [DOI] [PMC free article] [PubMed] [Google Scholar]
- 9.Valadi H, Ekstrom K, Bossios A, Sjostrand M, Lee JJ, Lotvall JO. Exosome-mediated transfer of mRNAs and microRNAs is a novel mechanism of genetic exchange between cells. Nat Cell Biol. 2007;9(6):654–659. doi: 10.1038/ncb1596. [DOI] [PubMed] [Google Scholar]
- 10.Bretz NP, Ridinger J, Rupp AK, et al. Body fluid exosomes promote secretion of inflammatory cytokines in monocytic cells via toll-like receptor signaling. J Biol Chem. 2013;288(51):36691–36702. doi: 10.1074/jbc.M113.512806. [DOI] [PMC free article] [PubMed] [Google Scholar]
- 11.Koga Y, Yasunaga M, Moriya Y, et al. Exosome can prevent RNase from degrading microRNA in feces. J Gastrointest Oncol. 2011;2(4):215–222. doi: 10.3978/j.issn.2078-6891.2011.015. [DOI] [PMC free article] [PubMed] [Google Scholar]
- 12.Lasser C, Alikhani VS, Ekstrom K, et al. Human saliva, plasma and breast milk exosomes contain RNA: Uptake by macrophages. J Transl Med. 2011;9 doi: 10.1186/1479-5876-9-9. 9-5876-9-9. [DOI] [PMC free article] [PubMed] [Google Scholar]
- 13.Kang CS, Ban M, Choi EJ, et al. Extracellular vesicles derived from gut microbiota, especially akkermansia muciniphila, protect the progression of dextran sulfate sodium-induced colitis. PLoS One. 2013;8(10):e76520. doi: 10.1371/journal.pone.0076520. [DOI] [PMC free article] [PubMed] [Google Scholar]
- 14.Shen Y, Giardino Torchia ML, Lawson GW, Karp CL, Ashwell JD, Mazmanian SK. Outer membrane vesicles of a human commensal mediate immune regulation and disease protection. Cell Host Microbe. 2012;12(4):509–520. doi: 10.1016/j.chom.2012.08.004. [DOI] [PMC free article] [PubMed] [Google Scholar]
- 15.Smyth LA, Ratnasothy K, Tsang JY, et al. CD73 expression on extracellular vesicles derived from CD4+ CD25+ Foxp3+ T cells contributes to their regulatory function. Eur J Immunol. 2013;43(9):2430–2440. doi: 10.1002/eji.201242909. [DOI] [PubMed] [Google Scholar]
- 16.Leonetti D, Reimund JM, Tesse A, et al. Circulating microparticles from crohn’s disease patients cause endothelial and vascular dysfunctions. PLoS One. 2013;8(9):e73088. doi: 10.1371/journal.pone.0073088. [DOI] [PMC free article] [PubMed] [Google Scholar]
- 17.Greening DW, Xu R, Ji H, Tauro BJ, Simpson RJ. A protocol for exosome isolation and characterization: Evaluation of ultracentrifugation, density-gradient separation, and immunoaffinity capture methods. Methods Mol Biol. 2015;1295:179–209. doi: 10.1007/978-1-4939-2550-6_15. [DOI] [PubMed] [Google Scholar]
- 18.Gercel-Taylor C, Atay S, Tullis RH, Kesimer M, Taylor DD. Nanoparticle analysis of circulating cell-derived vesicles in ovarian cancer patients. Anal Biochem. 2012;428(1):44–53. doi: 10.1016/j.ab.2012.06.004. [DOI] [PubMed] [Google Scholar]
- 19.Nielsen MH, Beck-Nielsen H, Andersen MN, Handberg A. A flow cytometric method for characterization of circulating cell-derived microparticles in plasma. J Extracell Vesicles. 2014;3 doi: 10.3402/jev.v3.20795. eCollection 2014. [DOI] [PMC free article] [PubMed] [Google Scholar]
- 20.Mitsuhashi M. Ex vivo simulation of leukocyte function: Stimulation of specific subset of leukocytes in whole blood followed by the measurement of function-associated mRNAs. J Immunol Methods. 2010;363(1):95–100. doi: 10.1016/j.jim.2010.10.002. [DOI] [PubMed] [Google Scholar]
- 21.Murakami T, Oakes M, Ogura M, Tovar V, Yamamoto C, Mitsuhashi M. Development of glomerulus-, tubule-, and collecting duct-specific mRNA assay in human urinary exosomes and microvesicles. PLoS One. 2014;9(9):e109074. doi: 10.1371/journal.pone.0109074. [DOI] [PMC free article] [PubMed] [Google Scholar]
- 22.Falasca M, Raimondi C, Maffucci T. Boyden chamber. Methods Mol Biol. 2011;769:87–95. doi: 10.1007/978-1-61779-207-6_7. [DOI] [PubMed] [Google Scholar]
- 23.Wiklander OP, Nordin JZ, O’Loughlin A, et al. Extracellular vesicle in vivo biodistribution is determined by cell source, route of administration and targeting. J Extracell Vesicles. 2015;4:26316. doi: 10.3402/jev.v4.26316. [DOI] [PMC free article] [PubMed] [Google Scholar]
- 24.Handy LM, Ghosh S, Ferguson A. Investigation of neutrophil migration into the gut by cytology of whole gut lavage fluid. Eur J Gastroenterol Hepatol. 1995;7(1):53–58. [PubMed] [Google Scholar]
- 25.Lorincz AM, Schutte M, Timar CI, et al. Functionally and morphologically distinct populations of extracellular vesicles produced by human neutrophilic granulocytes. J Leukoc Biol. 2015 doi: 10.1189/jlb.3VMA1014-514R. [DOI] [PubMed] [Google Scholar]
- 26.Robbins PD, Morelli AE. Regulation of immune responses by extracellular vesicles. Nat Rev Immunol. 2014;14(3):195–208. doi: 10.1038/nri3622. [DOI] [PMC free article] [PubMed] [Google Scholar]
- 27.Baglio SR, Rooijers K, Koppers-Lalic D, et al. Human bone marrow- and adipose-mesenchymal stem cells secrete exosomes enriched in distinctive miRNA and tRNA species. Stem Cell Res Ther. 2015;6 doi: 10.1186/s13287-015-0116-z. 127-015-0116-z. [DOI] [PMC free article] [PubMed] [Google Scholar]
- 28.Yang J, Wei F, Schafer C, Wong DT. Detection of tumor cell-specific mRNA and protein in exosome-like microvesicles from blood and saliva. PLoS One. 2014;9(11):e110641. doi: 10.1371/journal.pone.0110641. [DOI] [PMC free article] [PubMed] [Google Scholar]
- 29.Elhenawy W, Debelyy MO, Feldman MF. Preferential packing of acidic glycosidases and proteases into bacteroides outer membrane vesicles. MBio. 2014;5(2):e00909–14. doi: 10.1128/mBio.00909-14. [DOI] [PMC free article] [PubMed] [Google Scholar]
- 30.Hickey CA, Kuhn KA, Donermeyer DL, et al. Colitogenic bacteroides thetaiotaomicron antigens access host immune cells in a sulfatase-dependent manner via outer membrane vesicles. Cell Host Microbe. 2015;17(5):672–680. doi: 10.1016/j.chom.2015.04.002. [DOI] [PMC free article] [PubMed] [Google Scholar]
- 31.Okoye IS, Coomes SM, Pelly VS, et al. MicroRNA-containing T-regulatory-cell-derived exosomes suppress pathogenic T helper 1 cells. Immunity. 2014;41(1):89–103. doi: 10.1016/j.immuni.2014.05.019. [DOI] [PMC free article] [PubMed] [Google Scholar]
- 32.Yang X, Meng S, Jiang H, Chen T, Wu W. Exosomes derived from interleukin-10-treated dendritic cells can inhibit trinitrobenzene sulfonic acid-induced rat colitis. Scand J Gastroenterol. 2010;45(10):1168–1177. doi: 10.3109/00365521.2010.490596. [DOI] [PubMed] [Google Scholar]
- 33.Roscoe DM, Hu YF, Philip R. Companion diagnostics: A regulatory perspective from the last 5 years of molecular companion diagnostic approvals. Expert Rev Mol Diagn. 2015;15(7):869–880. doi: 10.1586/14737159.2015.1045490. [DOI] [PubMed] [Google Scholar]
- 34.Kordelas L, Rebmann V, Ludwig AK, et al. MSC-derived exosomes: A novel tool to treat therapy-refractory graft-versus-host disease. Leukemia. 2014;28(4):970–973. doi: 10.1038/leu.2014.41. [DOI] [PubMed] [Google Scholar]
Associated Data
This section collects any data citations, data availability statements, or supplementary materials included in this article.
Supplementary Materials
Supplementary Figure 1. Flow cytometry of the cellular fraction of luminal aspirates. Luminal aspirates were centrifuged to isolate the cellular components, and labelled with anti-CD45 and anti-14 antibodies to identify neutrophils and monocytes. (A) All cells / ungated. (B) CD45+ cells from outlined gate in (A). CD14 high/positive was labeled as monocytes and CD14 low/negative was labeled as neutrophils.
Supplementary Figure 2. Particle-size-based gating strategy. The ApogeeMix was subjected to flow cytometric analysis. The EV gate was designed to include both population of fluorescent beads (110nm and 500nm) and the area that are most likely show particles smaller than 500nm (A & B). (C) Representative colonic EV sample from IBD patients (41%). (D) CD63 positive gate was created based on the same sample single stained with anti-CD63 (18.4%).
Supplementary Figure. 3. Levels of EV mRNA in colonic samples from IBD patients and controls. (A) Heatmap of mRNA, normalized by ACTB, was compared among healthy control (HC), UC, and CD; yellow indicates lower expression and red indicates higher expression. (B–E) Scatter plots of mRNA levels (Arbitrary Unit, AU) in samples from healthy controls (HC, N=5), UC (N=9), and CD (N=10) patients, as assessed by RT-PCR.
Supplementary Figure 4. Stability of EV mRNA in LA and stool. (A) PBS, LA or fecal supernatants were incubated with fetal calf serum-derived purified standard EV at 37°C for 30 minutes, then bovine Hemoglobin (HBB) and GAPDH mRNA levels (1/Ct) were quantified as described in the Methods. (B) Naked rat total RNA was incubated with PBS, LA, or fecal supernatants at 37°C for 30 minutes, then rat ACTB and GAPDH mRNA levels (1/Ct) were quantified.