Abstract
In preclinical cancer research, bioluminescence imaging with firefly luciferase and D-luciferin has become a standard to monitor biological processes both in vitro and in vivo. However, the emission maximum (λmax) of bioluminescence produced by D-luciferin is 562 nm where light is not highly penetrable in biological tissues. This emphasizes a need for developing a red-shifted bioluminescence imaging system to improve detection sensitivity of targets in deep tissue. Here we characterize the bioluminescent properties of the newly synthesized luciferin analogue, AkaLumine-HCl. The bioluminescence produced by AkaLumine-HCl in reactions with native firefly luciferase is in the near-infrared wavelength ranges (λmax=677 nm), and yields significantly increased target-detection sensitivity from deep tissues with maximal signals attained at very low concentrations, as compared with D-luciferin and emerging synthetic luciferin CycLuc1. These characteristics offer a more sensitive and accurate method for non-invasive bioluminescence imaging with native firefly luciferase in various animal models.
 D-luciferin is the standard bioluminescent substrate for in vitro and in vivo imaging. Here the authors introduce AkaLumine-HCl, a soluble luciferin analogue with a near-infrared emission maximum, which allows deep tissue imaging at lower concentrations than D-luciferin.
Bioluminescence is generated through an oxidation reaction between the enzyme luciferase and its substrate, luciferin1,2. In preclinical cancer research, bioluminescence imaging (BLI) with firefly luciferase (Fluc) and D-luciferin has become a standard to monitor tumour growth, protein–protein interactions and specific molecular activity in cell lines and mouse models3,4,5,6. The emission maximum (λmax) of bioluminescence produced by D-luciferin is 562 nm. In the visible light spectrum, haemoglobin (λ=∼415–577 nm) and melanin (λ<600 nm) dominate absorption, hindering the detection of signals emanating from deep tissues7,8. In recent times, cyclic alkylaminoluciferin (CycLuc1) (λmax=604 nm) demonstrated improved detection of targets in vivo by a significantly increased bioluminescence production over D-luciferin9. However, its short λmax keep it from maximizing the detection sensitivity of targets in deep tissue.
To address this issue, efforts have been made to develop a BLI system that uses near-infrared (NIR) wavelength range of around 650–900 nm, where signal penetration through biological tissues is greatly improved7. NIR bioluminescence for in vivo BLI has been achieved with a synthetic D-luciferin analogue (λmax=706 nm)10 and bioluminescence resonance energy transfer in aminoluciferin-conjugated NIR fluorescence dyes (λmax<800 nm)11. However, these attempts have failed to show a significant improvement in the detection of targets in vivo when compared with D-luciferin, owing to their low bioluminescence production.
We previously synthesized a novel luciferin analogue, AkaLumine, by replacing the aromatic structure in D-luciferin with a benzothiazole moiety12. Notably, the λmax of bioluminescence produced by AkaLumine is 675 nm, which displays high penetration in vivo. However, the high hydrophobicity of AkaLumine causes poor water solubility (<2 mM), which is a major drawback for its use in vivo. We thus screened water-soluble derivatives of AkaLumine. Here we report one of the derivatives, AkaLumine hydrochloride (AkaLumine-HCl) that is applicable for in vivo BLI. Akalumine-HCl emits light in the NIR wavelength ranges (λmax=677 nm) in reactions with native Fluc and yields increased detection sensitivity from deep-tissue targets with maximal signals attained at very low concentrations, as compared with D-luciferin and CycLuc1. These characteristics offer a more sensitive and accurate method for non-invasive BLI in various animal models using native Fluc.
Results
Characterization of AkaLumine-HCl
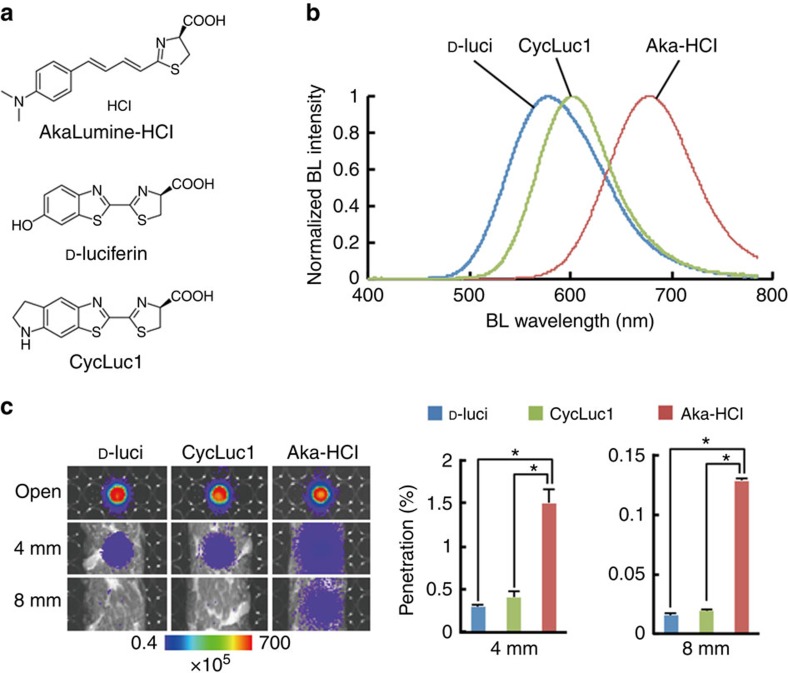
AkaLumine was able to detect targets in deep tissues of mouse tumour models with a significantly higher sensitivity than D-luciferin at the same concentration (Supplementary Fig. 1). To improve applicability of AkaLumine for in vivo imaging, we synthesized AkaLumine-HCl (Fig. 1a), which has high solubility in water (<40 mM). AkaLumine-HCl emitted NIR-shifted bioluminescence (λmax=677 nm) in reactions with Fluc (Fig. 1b) and greatly improved tissue penetration efficiency (Fig. 1c): AkaLumine-HCl bioluminescence showed 5- and 8.3-fold higher penetration than D-luciferin bioluminescence, and 3.7- and 6.7-fold higher penetration than CycLuc1 bioluminescence in 4- or 8-mm-thick tissue sections, respectively (Fig. 1c). A 60-fold higher concentration of D-luciferin was required to obtain signal intensity comparable to AkaLumine-HCl (150 μM versus 2.5 μM, respectively; Supplementary Fig. 2). These results suggest that AkaLumine-HCl is better suited for the detection of targets in deep tissue.
Figure 1. Properties of AkaLumine-HCl.
(a) Chemical structures of AkaLumine-HCl, D-luciferin and CycLuc1. (b) Bioluminescence emission spectra of D-luciferin (D-luci), CycLuc1 or AkaLumine-HCl (Aka-HCl). (c) Biological tissue penetration efficiency of bioluminescence generated by D-luci, CycLuc1 or Aka-HCl. Penetration efficiency indicates the relative bioluminescence intensities of the wells covered with a biological tissue (4- or 8-mm thick) versus open wells (open). n=3, *P<0.05 (t-test). Error bars indicate s.e.m.
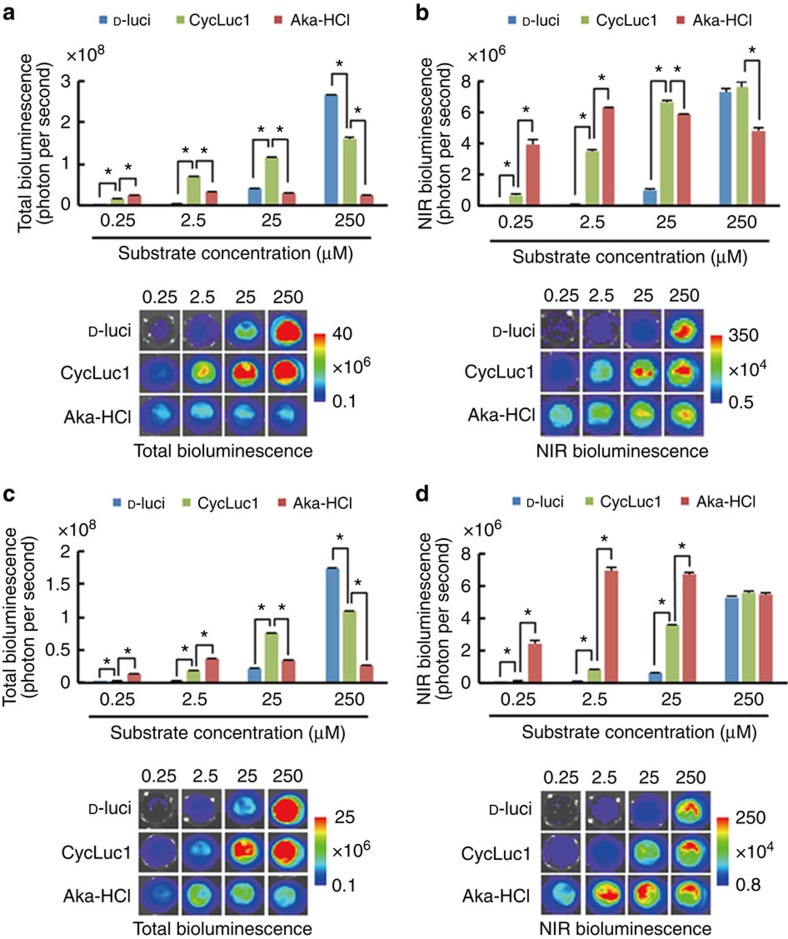
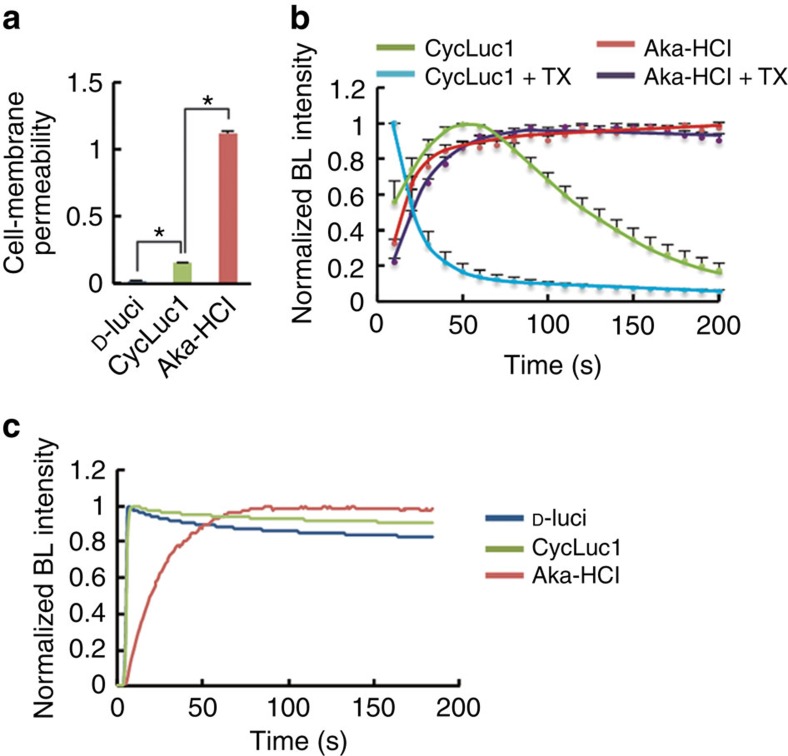
To evaluate the properties of AkaLumine-HCl in BLI at the cellular level, bioluminescence signals from LLC/luc (mouse lung carcinoma) and MDA-MB-231/luc (human breast carcinoma) cancer cell lines with constitutive expression of Fluc were analysed after treatments with increasing concentrations of D-luciferin, CycLuc1 and AkaLumine-HCl (Fig. 2). Interestingly, in both LLC/luc and MDA-MB-231/luc cells treated with AkaLumine-HCl, the signal was maximal at lower concentrations (by 2.5 μM), whereas the bioluminescence generated by D-luciferin and CycLuc1 increased as concentrations increased further, not appearing to reach a maximal signal even at 250 μM (Fig. 2). The bioluminescent signals in the NIR range, which provide a better correlation with in vivo images, from AkaLumine-HCl were strong and less influenced by their concentrations, whereas the ones from CycLuc1 and D-luciferin showed a dose-dependent increase and were weak at lower concentrations that are commonly reached in vivo by ordinary mouse experiments (Fig. 2b,d). These results illustrate the differences in dose dependence among the three agents, with AkaLumine-HCl appearing to be optimally effective at much lower doses than the others, an effect particularly evident when imaging in the NIR range. Both AkaLumine-HCl and CycLuc1 showed less dose dependency than D-luciferin and decreased in bioluminescence production at a high concentration in the reaction with recombinant Fluc protein (Supplementary Fig. 3) probably due to their low Km values (Table 1), which lead to saturation of Fluc with them at relatively low concentrations, and product inhibition effects, in which the mechanism is reported for D-luciferin13,14 but still unknown for CycLuc1 and AkaLumine-HCl. However, CycLuc1 showed a clear dose-dependent bioluminescence production with Fluc expressed in the cells (Fig. 2) at the same concentration range as the reaction with recombinant Fluc protein (Supplementary Fig. 3). This dose dependency of CycLuc1 is probably due to limited cell-membrane permeability, which is a major factor limiting enzyme–substrate interactions in cells, influencing bioluminescence production rate15,16,17. Comparison of bioluminescence production levels in intact and lysed cells shortly after treatments with the substrates revealed the differences in cell-membrane permeability among them: the cell-membrane permeability of AkaLumine-HCl was much greater than the others (Fig. 3a). Furthermore, pretreatment of the cells with Triton-X-100 greatly accelerated the bioluminescence production rate of CycLuc1 (Fig. 3b), revealing that the membrane permeability is the rate-limiting factor of the bioluminescence production by CycLuc1. On the other hand, AkaLumine-HCl showed similar bioluminescence production kinetics in intact or detergent-treated cells and in the reaction with recombinant Fluc protein (Fig. 3b,c). Taken together, small Km value and high cell-membrane permeability may be key factors for distinct bioluminescence production by AkaLumine-HCl in cells. This property is a significant advantage over D-luciferin and CycLuc1 for bioluminescence animal imaging, as variation in substrate bioavailability among tissues is one of the main issues hindering the acquisition of quantitative information of targets located in different parts of the body. In addition, we also confirmed the linear correlation of signal output with increasing numbers of LLC/luc and MDA-MB-231/luc cells following treatment with 25 μM AkaLumine-HCl (Supplementary Fig. 4).
Figure 2. Cellular imaging using AkaLumine-HCl.
Substrate dose dependency of total (a,c) or NIR (b,d) bioluminescence production in LLC/luc (a,b) or MDA-MB-231/luc (c,d) cells. The cells (4 × 10⁵ cells per well) were treated with the substrate at indicated concentrations. Images were acquired with 680±10 nm emission filter (right panels) or without a filter (left panels), to measure NIR bioluminescence or total bioluminescence signals, respectively. n=3, *P<0.05 (t-test). Error bars indicate s.e.m.
Table 1. Parameters of enzymatic reaction of luciferase substrate.
| Km±s.e.m. (μM) | Vmax±s.e.m. (× 106) | |
|---|---|---|
| D-luci | 107±14.7 | 13.8±0.71 |
| CycLuc1 | 1.06±0.06 | 7.00±0.09 |
| Aka-HCl | 2.06±0.63 | 2.07±0.23 |
Aka-HCl, AkaLumine-HCl, CycLuc1, cyclic alkylaminoluciferin; D-luci, D-luciferin.
Km and Vmax values of D-luci, CycLuc1 and Aka-HCl. These values were calculated from reactions with recombinant Fluc protein and the substrate in the presence of Mg-ATP.
Figure 3. Cell-membrane permeability of AkaLumine-HCl.
(a) Cell-membrane permeability of the substrates. Ratio of bioluminescence (BL) intensity indicates relative bioluminescence intensity of intact cells versus lysed cells treated with indicated substrates at 2.5 μM. n=3, *P<0.05 (t-test). (b) BL production in LLC/luc cells with or without pretreatment with 0.1% Triton X-100 (TX). BL intensity was measured every 10 s after addition of CycLuc1 or AkaLumine-HCl (Aka-HCl) (final concentration of 25 μM). BL intensity at each time point was normalized to the peak intensity. n=3. (c) BL production with recombinant Fluc protein. The substrates (final concentration of 25 μM) were reacted with recombinant Fluc proteins (20 μg ml−1). The reaction was initiated by the addition of ATP-Mg (final concentration of 80 μM). Data are representative of three independent experiments. Error bars indicate s.e.m.
Highly sensitive in vivo BLI using AkaLumine-HCl
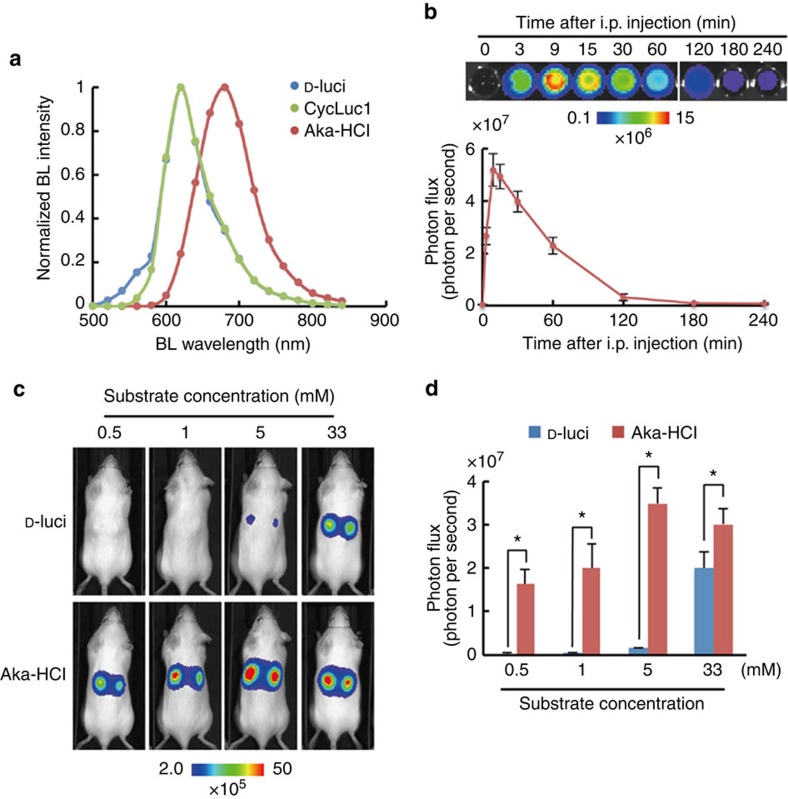
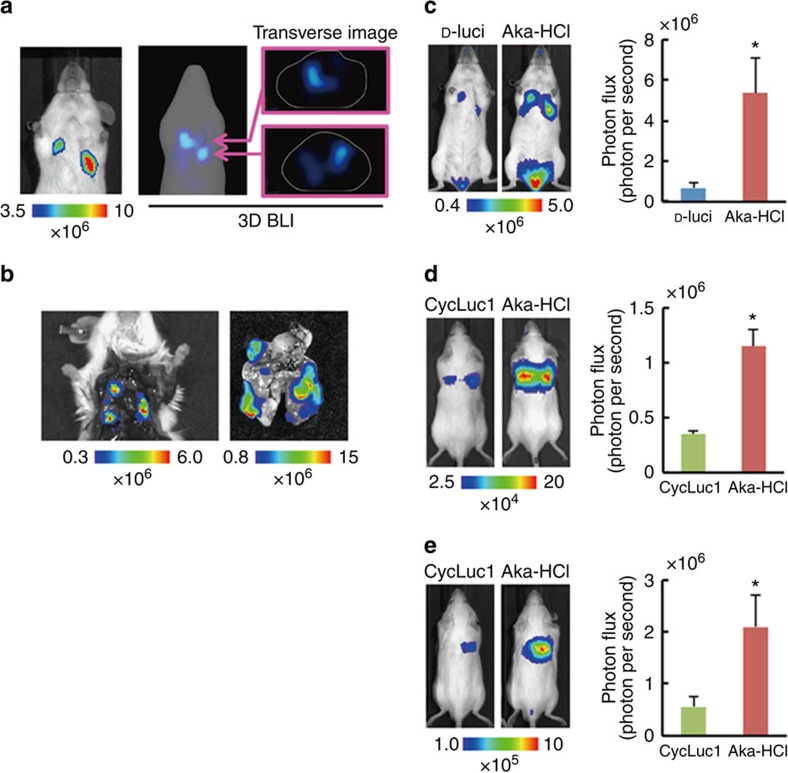
We then sought to assess the suitability of AkaLumine-HCl for in vivo BLI. AkaLumine-HCl emitted NIR-shifted bioluminescence from subcutaneous tumours with a similar spectrum to that obtained in the reactions with recombinant Fluc protein (Fig. 4a). In a time course of bioluminescence production in vivo, AkaLumine-HCl displayed a stable glow-type reaction at various injection doses and its bioluminescence production remained elevated longer at the higher concentrations (Supplementary Fig. 5); this temporally more stable bioluminescence production may be beneficial for acquiring images without influence of acquisition time. Furthermore, AkaLumine-HCl has a relatively longer half-life (∼40 min) in serum (Fig. 4b). These results suggest that AkaLumine-HCl would be a suitable substrate for in vivo imaging. To address this issue, we first compared the differences in in vivo detection sensitivity between bioluminescence signals generated by D-luciferin and AkaLumine-HCl in a subcutaneous tumour, which is one of the most easily detectable surface targets, after intraperitoneal injection with various doses of these substrates. AkaLumine-HCl was injected into the mice 4 h after D-luciferin injection, when D-luciferin bioluminescence was negligible (Supplementary Fig. 6a). The bioluminescence signals produced by AkaLumine-HCl were >40-fold higher than those of D-luciferin after injecting 1 mM substrates (Fig. 4c,d). This improvement in the detection of subcutaneous tumours is comparable to CycLuc1 (ref. 9). We then compared bioluminescence production between AkaLumine-HCl and CycLuc1 in subcutaneous tumours by intraperitoneal injection of 5 mM substrate into the same mice in order of CycLuc1 and AkaLumine-HCl at an 8- h interval, which was long enough to make CycLuc1 bioluminescence negligible (Supplementary Fig. 6b). Detection sensitivity of surface targets was comparable between 5 mM AkaLumine-HCl and CycLuc1 (Supplementary Fig. 7), reflecting the fact that the signals from the body surface are less influenced by tissue penetration efficiency and thus receive less benefit from NIR bioluminescence.
Figure 4. In vivo BLI of cancer cells using AkaLumine-HCl.
(a) Bioluminescence spectrum from subcutaneous tumours. Bioluminescence (BL) intensity was measured with 18 filters (500–840 nm) in IVIS Spectrum after injection of D-luciferin (D-luci), CycLuc1 and AkaLumine-HCl (Aka-HCl) into mice bearing subcutaneous LLC/luc tumours. Date are representative of three independent experiments. (b) Half-life of AkaLumine-HCl in serum. Recombinant Fluc proteins were reacted with blood sampled at indicated time after intraperitoneal injection of 5 mM AkaLumine-HCl. Representative BL images (upper) and quantitative analysis (bottom) of BL intensity generated by reaction with recombinant Fluc proteins and AkaLumine-HCl in sampled blood are shown. n=3. (c) Representative BL images of LLC/luc subcutaneous tumours and (d) quantitative analysis of BL production 15 min after intraperitoneal injection of 100 μl of D-luciferin (D-luci) or AkaLumine-HCl (Aka-HCl) with indicated concentration. n=6, *P<0.05 (t-test). The substrates were injected to the same mouse in the order of D-luci and Aka-HCl at a 4-h interval. Error bars indicate s.e.m.
Improved deep tissue imaging using AkaLumine-HCl
We then address whether AkaLumine-HCl could improve the detection sensitivity for targets located in deep tissues such as metastasis in mouse lung, which is one of the most difficult tissues for optical imaging due to high scattering and absorption of light18, as well as its location deep within the body (Fig. 5a,b). Bioluminescence images were acquired from the same mice bearing LLC/luc lung metastases after intraperitoneal injection in order of 33 mM D-luciferin and AkaLumine-HCl at a 4-h interval. Notably, AkaLumine-HCl displayed greatly enhanced signals emanating from metastasis in the lung (Fig. 5c), as demonstrated by 8.1-fold higher with AkaLumine-HCl as compared with D-luciferin administration (Fig. 5c). To evaluate the advantage of AkaLumine-HCl over CycLuc1 in detecting targets in deep tissue, we then compared bioluminescence images between AkaLumine-HCl- and CycLuc1-treated mice 15 min after intravenous injection of LLC/luc cells at the dose of 5 mM, which is the maximum concentration of CycLuc1 due to its low water solubility (Fig. 5d). AkaLumine-HCl exhibited 3.3-fold increase in detection sensitivity of disseminated cancer cells in the lung compared with CycLuc1 (Fig. 5d). The advantage of AkaLumine-HCl was further confirmed by imaging the same mice bearing lung metastasis after intraperitoneal injection of 5 mM substrates in order of CycLuc1 and AkaLumine-HCl (Fig. 5e), and in the inverse order (Supplementary Fig. 8) at an 8-h interval. AkaLumine-HCl displayed about fourfold increase in signals from lung metastasis compared with CycLuc1 (Fig. 5e and Supplementary Fig. 8).
Figure 5. Highly sensitive in vivo BLI of deep tissue tumours.
(a) Typical bioluminescence (BL) images of lung metastasis developed after intravenous injection of LLC/luc cells. Three-dimensional BLI (right panels) showed metastasis developed in deep lung tissues. The images were acquired after intraperitoneal injection of AkaLumine-HCl (33 mM). (b) Ex vivo BLI of metastatic lesions in the lung after removing sternum (left panel) and removed lung (right panel) of the mouse shown in a. (c) Representative BL images of LLC/luc lung metastasis (left panel) and quantitative analysis of BL production (right panel) at peak time after intraperitoneal injection of 100 μl of 33 mM substrates. n=7, *P<0.05 (t-test). (d) Representative BL images of LLC/luc disseminated in the lung (left panel) and quantitative analysis of BL production (right panel) at peak time after intraperitoneal injection of 100 μl of 5 mM substrates. n=8, *P<0.05 (t-test). Error bars indicate s.e.m. (e) Representative BL images of lung metastasis of LLC/luc (left panel) and quantitative analysis of BL production (right panel) at peak time after intraperitoneal injection of 100 μl of 5 mM substrates. n=8, *P<0.05 (t-test). Error bars indicate s.e.m.
Discussion
In this study, we demonstrate that the bioluminescence produced by AkaLumine-HCl achieved considerable penetration depths (Figs 1c and 5c–e) and exhibited small temporal fluctuation (Supplementary Fig. 5), much less influenced by its concentration (Figs 2 and 4d). The properties that enable more sensitive detection of targets in deep tissues and more accurate quantitative comparison of targets localizing to different parts of the body are significant advantages of AkaLumine-HCl over D-luciferin and CycLuc1, and therefore AkaLumine-HCl might become the preferred BLI substrate in preclinical studies. The small temporal fluctuation in signal production by AkaLumine-HCl in a mouse model (Supplementary Fig. 5) may be achieved by its properties of lower saturation concentration (Fig. 2), high membrane permeability (Fig. 3) and relatively longer circulation half-time in the serum (Fig. 4b). These properties may contribute to having the reaction rate remain constant in tumour cells for relatively long periods of time, leading to more accurate and efficient quantitative analysis of targets from many mice in limited time.
In this study, we demonstrated that AkaLumine-HCl significantly improved target detection sensitivity in deep lung metastases (Fig. 5c–e) by overcoming the fundamental limitation of short emission wavelength from D-luciferin and CycLuc1. Of note, a recent study detailed the synthesis of infra-luciferin (iLH2), which emits NIR bioluminescence of the longest-known wavelength via its reaction with mutant Fluc10. However, the iLH2 signal output was exceedingly low when compared with that of D-luciferin and, therefore, iLH2 requires chemical optimization for practical use in biological studies. AkaLumine-HCl exhibits a considerably high NIR bioluminescence production with native Fluc that is currently used in general in vivo BLI applications. As such, AkaLumine-HCl would be immediately available for use in a broad range of biological studies that use BLI in small animal models.
Methods
Synthesis of AkaLumine-HCl
AkaLumine was synthesized as previously described12. To prepare AkaLumine-HCl, 4 M HCl in Dioxane (0.5 ml) was added to a suspending solution of the AkaLumine (20 mg, 0.066 mmol). This mixture solution was centrifuged after vortex for 10 min. The supernatant and the precipitate were then subjected to solid–liquid separation. The obtained precipitate was washed with 1 ml ethylacetate three times and dried in vacuum to obtain the AkaLumine-HCl (20 mg, 0.059 mmol) as a light purple solid; 85% ee from chiral HPLC (retention time of L-isomer: 16.8 min, D-isomer: 17.6 min); 1H NMR (500 MHz, DMSO-d6):d 7.67 (dd, J=14.9, 11.5 Hz, 1H), 7.59 (d, J=9.16 Hz, 2H), 7.38 (d, J=15.1 Hz, 1H), 7.19 (dd, J=14.9, 11.5 Hz, 1H), 6.92 (br, 2H), 6.81 (d, J=14.9 Hz, 1H), 5.47 (dd, J=10.3, 5.5 Hz, 1H), 3.98 (dd, J=11.5, 5.5 Hz, 1H), 3.87 (dd, J=11.5, 10.3 Hz, 1H), 3.04 (s, 6H); 13C NMR (125 MHz, DMSO-d6) d 182.8, 169.8, 154.3, 150.9, 148.6, 131.0, 126.1, 123.6, 114.5, 66.5, 41.5, 34.39.
The optical purity of synthesized luciferin analogues was analysed by Thermo LC-MS (LCQ Fleet) using a chiral column (Daicel Chemical Industries, OZ-RH, 5 mm, 4.6–150 mm) with a linear gradient of 10–90% acetonitrile in 0.05% TFA in H2O over 30 min (flow rate 0.5 ml min−1) as eluent. 1H and 13C NMR spectra were recorded on JEOL ECA 500 instruments. Chemical shifts are reported in parts per million (d) downfield from internal tetramethylsilane (d ¼0) and coupling constants in Hertz. Infrared spectra were measured by Nicolet 6700 FT-IR Spectrometer using attenuated total reflection methods. AkaLumine-HCl (trade name: TokeOni, 808350-5MG) can be obtained from Sigma-Aldrich (St Louis, MO, USA).
Measurement of bioluminescence emission spectra
Bioluminescence emission spectra of D-luciferin (Promega, Madison, WI, USA), CycLuc1 (AOBIOUS INC., Gloucester, MA, USA) and AkaLumine-HCl were measured using an ATTO AB-1850 spectrophotometer (ATTO Co. Ltd, Tokyo, Japan). A reaction mixture was prepared by mixing 5 μl of a substrate (100 μM), 5 μl of QuantiLum Recombinant Luciferase solution (1 mg ml−1) (Promega) and 5 μl of potassium phosphate buffer (500 mM, pH 8.0). Luminescence reactions were then initiated by injecting 10 μl of ATP-Mg (200 μM) into the reaction mixture. Bioluminescence emission spectra were measured in 1 nm increments from 400 to 780 nm using 3 min of integration time.
Measurement of K m value
The bioluminescence intensities of D-luciferin, CycLuc1 and AkaLumine-HCl were measured in same conditions with measurement of bioluminescence spectrum, except substrate concentration. Final concentrations of the substrates were varied from 0.2 to 500 μM and 0.1 to 100 μM, respectively. Km and Vmax values of the substrates were determined from the integrated value of the bioluminescence intensity and calculated by the Lineweaver–Burk plots by using the Enzyme Kinetics Wizard in the commercially available SigmaPlot 9.0 software package (Systat Software Inc., San Jose, CA, USA).
Bioluminescence transmission assay using biological tissues
Bioluminescence signal from wells was measured with IVIS Spectrum (PerkinElmer, Boston, MA, USA) 1 min after the substrate (final concentration of 2.5 μM for D-lucfierin and AkaLumine-HCl, 50 nM for CycLuc1) was reacted with recombinant Fluc proteins (20 μg ml−1) in the presence of ATP-Mg (final concentration of 20 μM) in a black 96-well plate. A biological tissue (4-mm-thick sliced beef) was placed on the wells, to measure bioluminescence signal through the tissue, followed by acquiring bioluminescence images through two layers of the biological tissue. The following conditions were used for image acquisition: exposure time=10 s, binning=medium: 8, field of view=12.9 × 12.9 cm, and f/stop=1. The bioluminescence images were analysed by Living Image 4.3 software (PerkinElmer) specialized for IVIS system. Penetration efficiency (%) was calculated by dividing the signal intensities of the beef-covered wells by those of the corresponding uncovered wells.
Isolation of cancer cell lines stably expressing luc reporters
The murine lung carcinoma cell LLC, human breast cancer cell MDA-MB-231 and human prostate cancer cell PC-3 were obtained from ATCC (Rockville, MD, USA). LLC/luc and MDA-MB-231/luc cells were isolated after transfection with plasmid pEF/luc by calcium phosphate method as previously described19,20. PC-3/κB-luc was also isolated as previously described21. The cells were maintained at 37 °C in 5% FCS-DMEM (Nacalai Tesque, Kyoto, Japan) supplemented with penicillin (100 units per ml) and streptomycin (100 μg ml−1) and regularly checked for mycoplasma contamination by a mycoplasma check kit (Lonza, Basel, Switzerland). All the cell lines were independently stored and recovered from the original stock every time for each experiment.
In vitro BLI
The substrates were reacted with LLC/luc or MDA-MB-231/luc cells (4 × 10⁵ cells per well) in a black 96-well plate. Bioluminescence was measured using IVIS Spectrum 1 min after adding the substrates. The following conditions were used for image acquisition: open for total bioluminescence or 680±10 nm of an emission filter for NIR bioluminescence, exposure time=10 s, binning=medium: 8, field of view=12.9 × 12.9 cm and f/stop=1. The bioluminescence images were analysed by Living Image 4.3 software (PerkinElmer) specialized for IVIS system.
Cell-membrane permeability assay
Bioluminescence from lysed or intact LLC/luc (105 cells) was measured in a black 96-well plate using IVIS Spectrum. Lysed cells were prepared with 2 × Passive Lysis Buffer (Promega) supplemented with Tris-HCl (20 mM), EDTA (0.2 mM), ATP-Mg (500 nM), BSA (6 mg ml−1) and dithiothreitol (33 mM). The measurement was performed 1 min after adding the substrates (final concentration of 2.5 μM). The following conditions were used for image acquisition: open emission filter, exposure time=10 s, binning=medium: 8, field of view=12.9 × 12.9 cm and f/stop=1. The bioluminescence images were analysed by Living Image 4.3 software (PerkinElmer) specialized for IVIS system. Bioluminescence emission from LLC/luc (5 × 10⁵ cells) with or without pretreatment of 0.1% Triton-X-100 for 3 min was measured every 10 s for 200 s using a luminometer GL-210A (Microtec Co., Ltd, Chiba, Japan). Bioluminescence measurement was started by injection of the substrate (final concentration of 25 μM).
Mice
C57B/6 albino mice (female and male) or severe combined immunodeficient mice (male) were obtained from Charles River Laboratory Japan (Yokohama, Japan). All mice used were littermates or age-matched (7 weeks of age) females or males, were provided access to food and water ad libitum and were housed in the animal facilities at Tokyo Institute of Technology.
All the experimental procedures using mice were approved by the Animal Experiment Committees of Tokyo Institute of Technology (authorization numbers 2010006-3 and 2014005) and carried out in accordance with relevant national and international guidelines.
Tumour models
For subcutaneous tumour models, LLC/luc (3 × 10⁵ cells per 10 μl) or PC-3/κB-luc (1 × 10⁶ cells per 10 μl) suspended in PBS was mixed with an equal volume of Geltrex (Invitrogen) and subcutaneously or intratibially injected into C57B/6 albino mice (female) or severe combined immunodeficient mice (male), respectively. The experiments were performed 4 days after engraftment. For a model with disseminated cancer cells in the lung, C57B/6 albino mice (male) were intravenously injected with LLC/luc (1 × 10⁵ cells per 100 μl PBS) 15 min before in vivo BLI. For lung metastasis model, LLC/luc (5 × 10⁵ cells per 100 μl) suspended in PBS was injected from tail vein of C57B/6 albino mice (male). The experiments were performed 10–20 days after intravenous injection. These tumour models are well established and tumour growth is stable. Therefore, six samples are adequate sample size for evaluation of tumour growth in each experiment.
In vivo BLI
Bioluminescence images of subcutaneous tumours were acquired with IVIS Spectrum 15 min (unless otherwise indicated) after intraperitoneal injection with indicated amount of the substrates. As bioluminescence intensities from lung metastasis peaked at various time after a substrate injection, bioluminescence images of lung metastasis were sequentially acquired with IVIS Spectrum every 3 min for 30 min after intraperitoneal injection with the substrates and the highest bioluminescence intensities among the acquired images were selected for analysis. For comparing bioluminescence production between different substrates using the same mice, the images for AkaLumine-HCl were acquired 4 and 8 h after injection of D-luciferin and CycLucl, respectively. The following conditions were used for image acquisition: open emission filter, exposure time=60 s, binning=medium: 8, field of view=12.9 × 12.9 cm and f/stop=1. For three-dimensional BLI in lung metastasis model, a mouse injected with AkaLumine-HCl was subjected to BLI with three different wavelengths (660±10, 680±10 and 700±10 nm) of bioluminescence filters. The following conditions were used for imaging acquisition: exposure time=60 s, binning=medium: 8, field of view=12.9 × 12.9 cm and f/stop=1. The bioluminescence images were analysed by Living Image 4.3 software (PerkinElmer) specialized for IVIS system.
Ex vivo BLI
A mouse was scarified immediately after in vivo BLI by using AkaLumine-HCl and the lung was removed. Bioluminescence image of the lung was obtained with the following conditions: open emission filter, exposure time=30 s, binning=medium: 8, field of view=12.9 × 12.9 cm and f/stop=1. The bioluminescence images were analysed by Living Image 4.3 software (PerkinElmer) specialized for IVIS system.
Measurement of AkaLumine-HCl half-life in serum
Five microlitres of blood was sampled from tail vein and then mixed with 45 μl PBS, 25 μl recombinant Fluc protein (20 μg ml−1) and 25 μl ATP-Mg (80 μM) in a black 96-well plate, to measure bioluminescence intensity by IVIS Spectrum. The following conditions were used for image acquisition: exposure time=10 s, binning=medium, field of view=12.9 × 12.9 and f/stop=1. The bioluminescence images were analysed by Living Image 4.3 software.
Statistical analysis
Data are presented as means±s.e.m. and were statistically analysed with a two-sided Student's t-test. P-values<0.05 were considered statistically significant.
Data availability
The data that support the findings of this study are available from the corresponding author on request.
Additional information
How to cite this article: Kuchimaru, T. et al. A luciferin analogue generating near-infrared bioluminescence achieves highly sensitive deep-tissue imaging. Nat. Commun. 7:11856 doi: 10.1038/ncomms11856 (2016).
Supplementary Material
Supplementary Figures 1-8
Acknowledgments
We are grateful to Shigeaki Watanabe and Machiko Horiuchi (Summit Pharmaceuticals International Corporation, Tokyo, Japan) for discussion and technical support of IVIS. We are also grateful to Kuroganekasei Co. Ltd for synthesis of AkaLumine. This research was supported by a Grant-in-Aid for Scientific Research on Innovative Areas ‘Integrative Research on Cancer Microenvironment Network' from the Ministry of Education, Culture, Sports, Science and Technology of Japan (S.K.-K.), Adaptable and Seamless Technology Transfer Program through target-driven R&D JST and a Grant-in-Aid for challenging Exploratory Research (S.Ma).
Footnotes
Author contributions T.Ku. and S.I. contributed equally to this work. S.K.-K., S.Ma and H.N. designed and managed the overall project. T.Ku, S.M. and T.Ka. performed imaging experiments using cultured cells and animals. S.I. and M.K. synthesized AkaLumine-HCl and characterized the substrates in a test tube. T.Ku, S.I., H.N., S.Ma and S.K.-K. wrote the manuscript.
References
- Fraga H. Firefly luminescence: a historical perspective and recent developments. Photochem. Photochem. Photobiol. Sci. 7, 146–158 (2008). [DOI] [PubMed] [Google Scholar]
- Inouye S. Firefly luciferase: an adenylate-forming enzyme for multicatalytic functions. Cell. Mol. Life Sci. 67, 387–404 (2010). [DOI] [PMC free article] [PubMed] [Google Scholar]
- Rehemtulla A. et al. Rapid and quantitative assessment of cancer treatment response using in vivo bioluminescence imaging. Neoplasia 2, 491–495 (2000). [DOI] [PMC free article] [PubMed] [Google Scholar]
- Luker K. E. et al. Kinetics of regulated protein-protein interactions revealed with firefly luciferase complementation imaging in cells and living animals. Proc. Natl Acad. Sci. USA 101, 12288–12293 (2004). [DOI] [PMC free article] [PubMed] [Google Scholar]
- Harada H., Kizaka-kondoh S. & Hiraoka M. Optical imaging of tumor hypoxia and evaluation of efficacy of a hypoxia-targeting drug in living animals. Mol. Imaging Biol. 4, 182–193 (2005). [DOI] [PubMed] [Google Scholar]
- Ozaki M., Haga S. & Ozawa T. In vivo monitoring of liver damage using caspase-3 probe. Theranostics 2, 207–214 (2012). [DOI] [PMC free article] [PubMed] [Google Scholar]
- Weissleder R. & Ntziachristos V. Shedding light onto live molecular targets. Nat. Med. 9, 123–128 (2003). [DOI] [PubMed] [Google Scholar]
- Dawson B. et al. A theoretical and experimental study of light absorption and scattering by in vivo skin. Phys. Med. Biol. 25, 695–709 (1980). [DOI] [PubMed] [Google Scholar]
- Evans M. S. et al. A synthetic luciferin improves bioluminescence imaging in live mice. Nat. Methods 11, 393–395 (2014). [DOI] [PMC free article] [PubMed] [Google Scholar]
- Jathoul A. P., Grounds H., Anderson J. C. & Pule M. A. A dual-color far-red to near-infrared firefly luciferin analogue designed for multiparametric bioluminescence imaging. Angew. Chem. Int. Ed. Engl. 126, 1–6 (2014). [DOI] [PMC free article] [PubMed] [Google Scholar]
- Kojima R. et al. Rational design and development of near-infrared-emitting firefly luciferins available in vivo. Angew. Chem. Int. Ed. Engl. 52, 1175–1179 (2013). [DOI] [PubMed] [Google Scholar]
- Iwano S. et al. Development of simple firefly luciferin analogs emitting blue, green, red, and near-infrared biological window light. Tetrahedron 69, 3847–3856 (2013). [Google Scholar]
- Fontes R., Dukhovich A., Sillero A. & Sillero M. A. Synthesis of dehyroluciferin by firefly luciferase: effect of dehyroluciferin, coenzyme A and nucleoside riphosphates on the luminescent reaction. Biochem. Biophys. Res. Commun. 237, 445–450 (1997). [DOI] [PubMed] [Google Scholar]
- Ribeiro C. & Esteves da Silva J. C. Kinetics of inhibiton of firefly luciferase by oxyluciferin and dehyroluciferyl-adenylate. Photochem. Photobiol. Sci. 7, 1085–1090 (2008). [DOI] [PubMed] [Google Scholar]
- Craig F. F., Simmonds A. C., Watmore D., Mccaprat F. & White M. R. H. Membrane-permable luciferin esters for assay of firefly luciferase in live intact cells. Biochem. J. 276, 637–641 (1991). [DOI] [PMC free article] [PubMed] [Google Scholar]
- Shinde R., Perkins J. & Contag C. H. Luciferin derivatives for enhanced in vitro and in vivo bioluminescence assays. Biochemistry 45, 11103–11112 (2006). [DOI] [PubMed] [Google Scholar]
- Mofford D. M., Reddy G. R. & Miller S. C. Aminoluciferins extend firefly luciferase bioluminescence into near-infrared and can be prefrerred substrates over D-luciferin. J. Am. Chem. Soc. 136, 13277–13282 (2014). [DOI] [PMC free article] [PubMed] [Google Scholar]
- Cheong W. F., Prahl S. A. & Welch A. J. A review of optical properties of biological tissues. IEEE J. Quantum Electron. 26, 2166–2185 (1980). [Google Scholar]
- Chen C. & Okayama H. High-efficiency transformation of mammalian cells by plasmid DNA. Mol. Cell. Biol. 7, 2745–2752 (1987). [DOI] [PMC free article] [PubMed] [Google Scholar]
- Kizaka-Kondoh S. et al. Selective killing of hypoxia-inducible factor-1-active cells improves survival in a mouse model of invasive and metastatic pancreatic cancer. Clin. Cancer Res. 15, 3433–3441 (2009). [DOI] [PubMed] [Google Scholar]
- Fujita K. et al. Intracelluar CO release from composite of ferritin and ruthenium carbonyl complexes. J. Am. Chem. Soc. 136, 16902–16908 (2014). [DOI] [PubMed] [Google Scholar]
Associated Data
This section collects any data citations, data availability statements, or supplementary materials included in this article.
Supplementary Materials
Supplementary Figures 1-8
Data Availability Statement
The data that support the findings of this study are available from the corresponding author on request.


