

Abstract
Background
Cannabis use disorder is the most commonly reported illegal substance use disorder in the general population; although demand for assistance from health services is increasing internationally, only a minority of those with the disorder seek professional assistance. Treatment studies have been published, but pressure to establish public policy requires an updated systematic review of cannabis‐specific treatments for adults.
Objectives
To evaluate the efficacy of psychosocial interventions for cannabis use disorder (compared with inactive control and/or alternative treatment) delivered to adults in an out‐patient or community setting.
Search methods
We searched the Cochrane Central Register of Controlled Trials (CENTRAL; 2015, Issue 6), MEDLINE, EMBASE, PsycINFO, the Cumulaive Index to Nursing and Allied Health Literature (CINAHL) and reference lists of articles. Searched literature included all articles published before July 2015.
Selection criteria
All randomised controlled studies examining a psychosocial intervention for cannabis use disorder (without pharmacological intervention) in comparison with a minimal or inactive treatment control or alternative combinations of psychosocial interventions.
Data collection and analysis
We used standard methodological procedures as expected by The Cochrane Collaboration.
Main results
We included 23 randomised controlled trials involving 4045 participants. A total of 15 studies took place in the United States, two in Australia, two in Germany and one each in Switzerland, Canada, Brazil and Ireland. Investigators delivered treatments over approximately seven sessions (range, one to 14) for approximately 12 weeks (range, one to 56).
Overall, risk of bias across studies was moderate, that is, no trial was at high risk of selection bias, attrition bias or reporting bias. Further, trials included a large total number of participants, and each trial ensured the fidelity of treatments provided. In contrast, because of the nature of the interventions provided, participant blinding was not possible, and reports of researcher blinding often were unclear or were not provided. Half of the reviewed studies included collateral verification or urinalysis to confirm self report data, leading to concern about performance and detection bias. Finally, concerns of other bias were based on relatively consistent lack of assessment of non‐cannabis substance use or use of additional treatments before or during the trial period.
A subset of studies provided sufficient detail for comparison of effects of any intervention versus inactive control on primary outcomes of interest at early follow‐up (median, four months). Results showed moderate‐quality evidence that approximately seven out of 10 intervention participants completed treatment as intended (effect size (ES) 0.71, 95% confidence interval (CI) 0.63 to 0.78, 11 studies, 1424 participants), and that those receiving psychosocial intervention used cannabis on fewer days compared with those given inactive control (mean difference (MD) 5.67, 95% CI 3.08 to 8.26, six studies, 1144 participants). In addition, low‐quality evidence revealed that those receiving intervention were more likely to report point‐prevalence abstinence (risk ratio (RR) 2.55, 95% CI 1.34 to 4.83, six studies, 1166 participants) and reported fewer symptoms of dependence (standardised mean difference (SMD) 4.15, 95% CI 1.67 to 6.63, four studies, 889 participants) and cannabis‐related problems compared with those given inactive control (SMD 3.34, 95% CI 1.26 to 5.42, six studies, 2202 participants). Finally, very low‐quality evidence indicated that those receiving intervention reported using fewer joints per day compared with those given inactive control (SMD 3.55, 95% CI 2.51 to 4.59, eight studies, 1600 participants). Notably, subgroup analyses found that interventions of more than four sessions delivered over longer than one month (high intensity) produced consistently improved outcomes (particularly in terms of cannabis use frequency and severity of dependence) in the short term as compared with low‐intensity interventions.
The most consistent evidence supports the use of cognitive‐behavioural therapy (CBT), motivational enhancement therapy (MET) and particularly their combination for assisting with reduction of cannabis use frequency at early follow‐up (MET: MD 4.45, 95% CI 1.90 to 7.00, four studies, 612 participants; CBT: MD 10.94, 95% CI 7.44 to 14.44, one study, 134 participants; MET + CBT: MD 7.38, 95% CI 3.18 to 11.57, three studies, 398 participants) and severity of dependence (MET: SMD 4.07, 95% CI 1.97 to 6.17, two studies, 316 participants; MET + CBT: SMD 7.89, 95% CI 0.93 to 14.85, three studies, 573 participants), although no particular intervention was consistently effective at nine‐month follow‐up or later. In addition, data from five out of six studies supported the utility of adding voucher‐based incentives for cannabis‐negative urines to enhance treatment effect on cannabis use frequency. A single study found contrasting results throughout a 12‐month follow‐up period, as post‐treatment outcomes related to overall reduction in cannabis use frequency favoured CBT alone without the addition of abstinence‐based or treatment adherence‐based contingency management. In contrast, evidence of drug counselling, social support, relapse prevention and mindfulness meditation was weak because identified studies were few, information on treatment outcomes insufficient and rates of treatment adherence low. In line with treatments for other substance use, abstinence rates were relatively low overall, with approximately one‐quarter of participants abstinent at final follow‐up. Finally, three studies found that intervention was comparable with treatment as usual among participants in psychiatric clinics and reported no between‐group differences in any of the included outcomes.
Authors' conclusions
Included studies were heterogeneous in many aspects, and important questions regarding the most effective duration, intensity and type of intervention were raised and partially resolved. Generalisability of findings was unclear, most notably because of the limited number of localities and homogeneous samples of treatment seekers. The rate of abstinence was low and unstable although comparable with treatments for other substance use. Psychosocial intervention was shown, in comparison with minimal treatment controls, to reduce frequency of use and severity of dependence in a fairly durable manner, at least in the short term. Among the included intervention types, an intensive intervention provided over more than four sessions based on the combination of MET and CBT with abstinence‐based incentives was most consistently supported for treatment of cannabis use disorder.
Plain language summary
Psychosocial interventions for cannabis use disorder
Background
Cannabis use disorder is the most common illegal substance use disorder in the general population. Despite the large number of cannabis users seeking treatment, clinical trials conducted to explore the effectiveness of psychosocial interventions for cannabis use disorder are rare.
Study characteristics
Review authors included a total of 23 studies involving 4045 adult participants who used cannabis frequently. This review included participant groups made up of at least 70% daily or near daily users, or reported to have cannabis use disorder, or seeking treatment for cannabis use. Average age of participants was 28.2 years. Most participants were male (72.5% on average, excluding two trials that recruited only females). Most (15) studies were conducted in the USA, two in Germany, two in Australia and one each in Brazil, Canada, Switzerland and Ireland.
Studies compared seven different intervention types: cognitive‐behavioural therapy (CBT), motivational enhancement therapy (MET), a combination of MET and CBT (MET + CBT), contingency management (CM), social support (SS), mindfulness‐based meditation (MM) and drug education and counselling (DC).
Key findings
Similar to other illicit drug disorders, cannabis use disorder is not easily treated by psychosocial interventions provided in out‐patient and community settings. CBT in individual and group sessions and MET in individual sessions were the most consistently explored treatments; they have demonstrated effectiveness over control conditions. In particular, psychosocial treatment was consistently effective over no treatment in reducing the frequency of cannabis use (with nine studies showing superior outcomes and four showing comparable outcomes), quantity used per occasion (seven studies showing superior outcomes and two showing comparable outcomes) and severity of dependence (with seven studies showing superior outcomes and two showing comparable outcomes). In contrast, treatment was not likely to be more effective than no treatment in improving cannabis‐related problems (with four studies showing superior outcomes and seven showing comparable outcomes), motivation to quit (with no studies showing superior outcomes and three showing comparable outcomes), other substance use (with no studies showing superior outcomes and seven showing comparable outcomes) or mental health (with no studies showing superior outcomes and five showing comparable outcomes). Comparison of studies reporting treatment gains was possible for a subset of studies with short‐term follow‐up of approximately four months. This analysis found that those receiving any intervention reported fewer days of cannabis use, used fewer joints per day and reported fewer symptoms of dependence and fewer cannabis‐related problems. High‐intensity interventions of more than four sessions and those delivered over longer than one month, particularly MET + CBT interventions, were most effective. In addition, interventions were completed as intended by most participants. Notably, three studies investigated the effectiveness of psychosocial intervention compared with treatment as usual delivered at psychiatric out‐patient centres and reported little evidence of significant group differences in treatment outcomes. Finally, results from six studies, which included contingency management adjunct treatments, were mixed but suggested that improvements in cannabis use frequency and severity of dependence were likely when combined with CBT or with MET + CBT. Invesigators reported no adverse effects.
Quality of evidence
Evidence is current to July 2015. Two review authors (Le Foll and Copeland) received donations of nabiximols (Sativex) from GW Pharma, although no review authors received direct funding to complete this review. The quality of evidence among primary outcomes was very low to moderate and suffered serious limitations, as no trial assessed all treatment outcomes of interest, and variability among included measures was great. In addition, assessment of other substance use, including tobacco use, or use of additional treatments during the trial period was scarce. Participant drop‐out was also a concern; on average, more than 20% of participants across studies were lost at final follow‐up, but most studies addressed attrition bias via appropriate analysis plans. In contrast, we found little evidence of selective reporting or selection bias.
Summary of findings
for the main comparison.
| Psychosocial intervention compared with inactive control for cannabis use disorder | ||||||
|
Patient or population: adults with cannabis use disorder or frequent cannabis use Settings: out‐patient treatment Intervention: psychosocial intervention Comparison: inactive control | ||||||
| Outcomes | Illustrative comparative risks* (95% CI) | Relative effect (95% CI) | Number of participants (studies) | Quality of the evidence (GRADE) | Comments | |
| Assumed risk | Corresponding risk | |||||
| Inactive control | Psychosocial intervention | |||||
|
Cannabis use frequency at short‐term follow‐up |
Mean number of cannabis using days in the past 30 days ranged across control groups from 13.7 to 24.9 days | Mean number of cannabis using days among intervention groups was 5.67 lower | MD 5.67 (3.08 to 8.26) |
1144 (6) | ⊕⊕⊕⊝ Moderatea,b,c | |
| Point‐prevalence abstinence rates at short‐term follow‐up | Proportion of participants achieving abstinence ranged from 2.70% to 44.21%, with an average of 23.02% across treatments | Average relative risk for achieving abstinence following intervention compared with control was 2.55 | RR 2.55 (1.34 to 4.83) |
1166 (6) | ⊕⊕⊕⊝ Lowa,d,e |
|
|
Cannabis use quantity per day at short‐term follow‐up |
Mean number of joints smoked per day ranged across control groups from 1.2 to 3.6 | Mean number of joints smoked per day among intervention groups was 3.55 lower | SMD 3.55 (2.51 to 4.59) | 1600 (8) | ⊕⊝⊝⊝ Very lowa,b,e,f | |
|
Symptoms of dependence at short‐term follow‐up |
Mean number of symptoms of dependence ranged across control groups from 2.4 to 5.1 | Mean number of symptoms of dependence among intervention groups was 4.15 lower | SMD 4.15 (1.67 to 6.63) | 889 (4) | ⊕⊕⊕⊝ Lowa,d,g | |
|
Cannabis‐related problems at short‐term follow‐up |
Mean number of cannabis‐related problems ranged across control groups from 5.01 to 8.92 | Mean number of cannabis‐related problems among intervention groups was 3.34 lower | SMD 3.34 (1.26 to 5.42) | 2202 (6) | ⊕⊕⊝⊝ Lowa,b,c,e | |
| Retention in treatment | Proportion of participants completing treatment ranged from 50.0% to 88.7%, with an average of 71.8% across treatments | On average, 7 out of 10 participants completed treatment as it was intended | ES 0.71 (0.63 to 0.78) |
1424 (11) | ⊕⊕⊕⊕ Moderatea,e |
|
| *The basis for the assumed risk (e.g. median control group risk across studies) is provided in footnotes. The corresponding risk (and its 95% confidence interval) is based on the assumed risk in the comparison group and the relative effect of the intervention (and its 95% CI) CI: Confidence interval | ||||||
| GRADE Working Group grades of evidence High quality: Further research is very unlikely to change our confidence in the estimate of effect Moderate quality: Further research is likely to have an important impact on our confidence in the estimate of effect and may change the estimate Low quality: Further research is very likely to have an important impact on our confidence in the estimate of effect and is likely to change the estimate Very low quality: We are very uncertain about the estimate | ||||||
aAt least 1 study at high risk of other bias
bData conversions were required because of heterogeneity in assessments
cFollow‐up assessment periods varied (range, 7 weeks to 4 months)
dFollow‐up assessment periods varied substantially (range, 3 months to 237 days)
eHeterogeneity in outcome measures
fFollow‐up assessment periods varied substantially (range, 7 weeks to 237 days)
gSmall number of studies (4 studies)
Background
Cannabis use disorder is the most commonly reported illegal substance use disorder in the general population; demand for assistance from a health professional is increasing internationally (EMCDDA 2014b). Despite this, only a minority of those with a disorder seek professional assistance, and no particular treatment method or design is widely accepted and practiced. This review aimed to identify those psychosocial interventions for cannabis use that demonstrate improved outcomes in comparison with inactive control and/or alternative treatment conditions.
Description of the condition
Population‐based studies have consistently revealed that cannabis is the most widely used illegal substance in Western countries including Europe (5.7% reporting past year use; EMCDDA 2014a), North America (7.5% reporting past month use; SAMHSA 2014) and Australia (10.2% reporting past year use; AIHW 2014a). In many countries, among those accessing treatment for drug use disorders, cannabis is more commonly the principal drug of concern than heroin (EMCDDA 2014b).
Diagnostic criteria for cannabis use disorder are described in the Diagnostical and Statistical Manual of Mental Disorders, 5th Edition (DSM‐V) (DSM‐V 2013), and the 10th Revision of the International Statistical Classification of Diseases and Related Health Problems (ICD‐10) (WHO 1992). The distinction between cannabis abuse and dependence has been replaced by a unidimensional symptom count indicating severity of cannabis use disorder and a requirement of two or more symptoms for diagnosis.
Cannabis use disorder is characterised by a pattern of cannabis use that can cause clinically significant psychiatric distress (somatisation, depression, anxiety, irritability, phobic anxiety, paranoid ideation, psychoticism) and social impairment (family member complaining, lost friends, financial difficulty, impaired work or school performance, legal problems), as well as multiple adverse consequences associated with cannabis use (inability to stop using, feeling bad about using, procrastinating, loss of self confidence, memory loss and withdrawal symptoms) and repeated unsuccessful attempts to stop using (Budney 1999; Budney 2000; Stephens 1993a). Cannabis use persists despite these negative consequences, and most individuals with cannabis use disorder perceive themselves as unable to quit (Budney 2000; Copeland 2001b). It is very common for cannabis users to present with other substance use problems, most notably those related to use of tobacco. In fact, most cannabis users also smoke tobacco (Badiani 2015), and smoking tobacco may potentiate cannabis dependence (Hindocha 2015).
Lifetime rates of cannabis use disorder ‐ according to the recent DSM‐V classification ‐ have been estimated at 5.4% in the Australian general population (Mewton 2013) and 6.3% in the US population (Goldstein 2015), with national estimates from other countries yet to be published under this new classification. Epidemiological studies have estimated that around one in six of those who use cannabis during adolescence and one in two of daily cannabis users will meet the criteria for cannabis dependence (Anthony, 2006; van der Pol, 2013). Certain factors have been identified to be significantly associated with increased risk of cannabis use disorder diagnosis, including being male (Haberstick 2014) or meeting criteria for diagnosis of alcohol use disorder or affective disorders (Teesson 2012). Indeed, on the basis of a database representative of the US population, it has been estimated that 7% of males and 5.3% of females with lifetime exposure to cannabis will develop cannabis dependence at some point in life (Lev‐Ran 2013).
Description of the intervention
Despite these high levels of problematic use, only a minority of people who use cannabis seek assistance from a health professional (Teesson 2012). The demand for treatment for cannabis use disorder, nonetheless, is increasing internationally. In 1999, the US Treatment Episode Data Set recorded more than 220,000 admissions to publicly funded substance abuse treatment (SAMHSA 2002), primarily for cannabis use. This represented 14% of admissions to these facilities and a doubling of the rate since 1993. In 2000, that data set reported that cannabis accounted for 61% of all adolescent admissions (SAMHSA 2003), and in 2010, this prevalence was 49.5% among those 18 to 30 years of age (SAMHSA 2013). Australia has also seen a doubling in rates of cannabis treatment from 2000 to 2013, with the current rate fluctuating between 22% and 24% since 2008 (AIHW 2015). Indeed, the number of cannabis patients entering treatment has increased in the 25 countries across the globe for which data are available (from 73,000 in 2005 to 106,000 in 2010) (EMCDDA 2014b).
Primary treatment options for cannabis use disorder include cognitive‐behavioural and motivational approaches, which identify the importance of the individual or the social environment. These types of treatment approaches are collectively referred to as psychosocial treatments. More specifically, cognitive‐behavioural and relapse prevention approaches primarily emphasise identification and management of incremental patterns and thoughts, as well as external triggers, that lead to use. In addition, these approaches teach coping and problem‐solving skills and promote substitution of cannabis‐related behaviours with healthier alternatives (Beck 1993). In contrast, motivational interviewing approaches tend to emphasise the importance of self efficacy and positive change and attempt to build motivation in an empathic and non‐judgemental environment (Miller 2002). This approach is often enhanced by personalised feedback and education regarding the treatment seeker's patterns of cannabis use, becoming motivational enhancement therapy (Miller 1992). Both approaches can be delivered in an individual or group format and include family and friends for social support. Aside from these primary treatments, secondary options include mindfulness‐based meditation and drug counselling. Mindfulness‐based meditation is a new approach that promotes inner reflection and acceptance of experiences and negative affect, thus decreasing the impact of triggers of use by enhancing present‐moment awareness (Praissman 2008). Drug counselling refers to simple fact‐based education regarding drug use and health risks, along with suggestions for minimising harm and brief components from cognitive‐behavioural and motivational approaches. In addition, all of these treatments can be augmented with pharmacotherapy (medications to assist with cannabis withdrawal and reduce cravings) and/or contingency management techniques (financial incentives for abstinence or successful engagement in treatment). Finally, given the high frequency of tobacco use among those presenting for cannabis treatment, their shared triggers of use and the negative impact of tobacco use on cannabis treatment outcomes, it is suggested that use of both substances should be treated simultaneously (Agrawal 2012).
How the intervention might work
Until recently, relatively little research has focused on approaches to treatment for cannabis use disorder. A major factor contributing to lack of clinical research focus on this disorder is that many users believe that cannabis use does not produce a dependence syndrome, and that treatment to assist with quitting is not desired or needed (Gates 2012). However, since the time an initial survey was carried out in the USA (Roffman 1987), research has confirmed that individuals with cannabis‐related problems readily respond to advertisements for treatment, and most do not use other substances (Budney 1999; Copeland 2001b; Stephens 1993a). Original cannabis‐specific programmes in the USA and Australia may have legitimised the need for treatment related to cannabis abuse or dependence, reduced the stigma associated with drug abuse treatment and attracted patients who otherwise would be reluctant to approach counselling (Copeland 2001b; Stephens 1993a).
Although the bulk of substance use treatment literature has focused on alcohol consumption and other illicit drug use, a widening evidence base regarding psychosocial treatment for cannabis use disorder has emerged. Several narrative reviews of cannabis treatment trials from separate author groups have highlighted support for psychosocial intervention in managing cannabis use disorder (Budney 2007; Copeland 2014; McRae 2003; Nordstrom 2010; Winstock 2010). These reviews discuss the importance of addressing co‐morbid mental health concerns involving social support, establishing healthy distractions from cravings and teaching harm reduction techniques when these distractions fail. Approaches that combine cognitive‐behavioural and motivational enhancement techniques share the greatest support in these reviews, but it is noted that the supporting evidence lacks methodological rigour and standardised outcome measures across studies.
Why it is important to do this review
Treatment development and efficacy studies targeting cannabis use disorder began to appear in the scientific literature during the 1990s; almost two decades later, testing of pharmacological preparations was begun to determine their effectiveness in managing cannabis use disorder. Following a recent Cochrane review on pharmacotherapies, no medications have emerged with proven effectiveness for the treatment of cannabis use disorders (Marshall 2014), leaving psychosocial treatments as the mainstay. Although several narrative reviews of existing literature have focused on psychosocial treatment of cannabis use disorder, to our knowledge only five systematic reviews have been published, and each included limited samples. The first described prevention programmes specifically developed for adolescent cannabis use within schools (Tobler 1999). The second recounted all substance use by dependent adults; although cannabis treatments were reviewed separately, this review included only five treatment trials and provided results that are now somewhat outdated (Dutra 2008). The third review focused on adolescent cannabis users and community‐delivered treatments (Bender 2011). The fourth included only individuals who were actively seeking treatment and excluded users who were offered treatment following identification of problematic use (Davis 2014). Finally, the fifth review (Denis 2006) served as the foundation for the current review.. Notably, each of these reviews highlighted only modest support for the the community‐delivered treatments described.
This systematic review was conducted to evaluate the effectiveness of psychosocial interventions that can be delivered in an out‐patient or community setting for adults with cannabis use disorder.
Objectives
To evaluate the efficacy of psychosocial interventions for cannabis use disorder (compared with inactive control and/or alternative treatment) delivered to adults in an out‐patient or community setting.
Methods
Criteria for considering studies for this review
Types of studies
We included all relevant randomised controlled studies examining psychosocial interventions for cannabis dependence or abuse (cannabis use disorder) in comparison with delayed treatment or minimal treatment control, as well as an alternative psychosocial treatment.
Types of participants
We included all participants who received treatment in out‐patient or community settings if they (1) were 18 years of age or older, (2) met diagnostic criteria for cannabis abuse or dependence by clinical assessment (per criteria of the Diagnostic and Statistical Manual of Mental Disorders, 5th Edition, or the 10th Revision of the International Statistical Classification of Diseases and Related Health Problems) or (3) were at least near daily cannabis users or (4) were seeking treatment for their cannabis use. We included all adult participants regardless of gender or nationality. We considered the history of previous treatments, but this was not an eligibility criterion. Exclusion criteria were (1) current dependence on alcohol or any other drug (except nicotine) and (2) near daily use of other substances (excluding nicotine). This review did not differentiate between patients seeking treatment and those screened in healthcare settings and invited to participate; however when possible, we assessed the impact of participant motivation at baseline on treatment outcomes.
Types of interventions
Experimental intervention
One or more psychosocial interventions for the management of cannabis use disorder delivered in a group or individual model in an out‐patient or community setting (excluding mail, phone and computer‐based treatments).
We considered the following psychosocial interventions.
Cognitive‐behavioural therapy (CBT).
Motivational interviewing/motivational enhancement therapy (MET).
Components of cognitive and motivational approaches delivered with focus on the importance of obtaining social support (SS).
Drug counselling and/or education (DC).
Contingency management (CM).
Mindfulness‐based meditation (MM).
Relapse prevention (RP).
Combination of the above.
Control intervention
Control interventions consisted of inactive (including untreated/minimally treated control or delayed treatment control (DTC)) or a second active psychosocial intervention.
Types of outcome measures
Primary outcomes
Self reported use of cannabis (number of days, rate of abstinence, times per day) with or without confirmation by objective means (urinalysis or hair/saliva analyses, as well as collateral reports).
Severity of cannabis use disorder observed as an index measured by a standardised questionnaire (such as the Addiction Severity Index (ASI) (McLellan 1980) or the Severity of Dependence Scale (SDS) (Swift 1998)) or as a count of symptoms of dependence following clinical assessment.
Level of cannabis‐related problems such as medical problems, legal problems, social and family relations, employment and support (typically assessed by questionnaires such as the Marijuana Problem Scale (Stephens 2000) or the Cannabis Problems Questionnaire (Copeland 2005)).
Retention in treatment, including average number of sessions received and/or proportion of participants completing the full number of planned sessions.
Secondary outcomes
Motivation to change cannabis use measured by a standardised questionnaire (such as the Readiness to Change Questionnaire (Heather 1999)).
Frequency of self reported other substance intake (number of days, times per day or other assessment of severity such as the ASI).
Mental health and symptoms of affective disorder measured by a standardised questionnaire (such as the Beck Depression Inventory (Beck 1961)).
With the exception of treatment retention, researchers reported all outcomes quantitatively using scales such as those referenced here.
Search methods for identification of studies
Electronic searches
We developed detailed search strategies to identify studies for inclusion in the review. These were based on the search strategy developed for MEDLINE but were revised appropriately for each database. The search strategy was based on the Cochrane Sensitive Search Strategy for Randomised Controlled Trials (RCTs), as published in Chapter 6.4 of the Cochrane Handbook for Systematic Reviews of Interventions version 5.1.0 (Higgins 2011). We assessed articles of all languages for eligibility.
We searched the following.
Cochrane Central Register of Controlled Trials (CENTRAL; 2015, Issue 6), which includes the Cochrane Drugs and Alcohol Group Register of Trials.
MEDLINE (inclusive from 1966 to June 2015).
EMBASE (inclusive from 1988 to June 2015).
Cumulative Index to Nursing and Allied Health Literature (CINAHL) (inclusive from 1981 to June 2015).
PsycINFO (inclusive from 1967 to June 2015).
For details, see Appendix 1; Appendix 2; Appendix 3; Appendix 4; and Appendix 5.
In addition, we searched for ongoing clinical trials and unpublished studies via Internet searches on the following websites.
ClinicalTrials.gov (www.clinicaltrials.gov).
World Health Organization (WHO) International Clinical Trials Registry Platform (ICTRP) (www.who.int/ictrp/en/).
Searching other resources
We checked the reference lists of all potentially eligible studies obtained as full reports to identify additional studies not retrieved by the electronic search. We obtained full reports of review articles retrieved by the search and checked these for other relevant citations.
Data collection and analysis
Selection of studies
Two review authors (PG and PS) independently screened the titles and abstracts of all publications identified by the search strategy. We obtained all potentially eligible studies as full‐text articles and independently assessed articles for inclusion. In doubtful or controversial cases, review authors discussed all identified discrepancies and reached consensus for all such cases without the need for arbitration.
Data extraction and management
Two review authors (PG and PS) independently extracted data, including participant demographics (gender, age, ethnicity, socioeconomic status, level of education), participant physical and mental health, use of substances, history of cannabis use and experience with cannabis treatment, as well as information pertaining to the intervention (duration, number of sessions, length of sessions, intervention type, use of boosters or contingency management, intervention format, treatment goal, staff training, fidelity checks) and finally information pertaining to included treatment outcomes. When key information relevant to the systematic review was missing, we adhered to the protocol in place and contacted investigators to ask them to provide additional data and clarification. If reports pertained to overlapping participants or periods of assessment, to avoid duplication of information we retained only the largest study or the most final follow‐up assessment.
Assessment of risk of bias in included studies
To limit bias, gain insight into potential comparisons and guide interpretation of findings, two review authors (PG and PS), using the criteria described in the Cochrane Handbook for Systematic Reviews of Interventions version 5.1.0 (Higgins 2011), independently assessed the risk of bias of eligible studies. In the context of a systematic review, the validity of a study refers to the extent to which its design and conduct were likely to prevent systematic errors or bias (Moher 1995). We changed the criteria to include assessment of risk of bias of included studies to conform with recommended methods outlined in the most recent version of the Cochrane Handbook for Systematic Reviews of Interventions and the requirements of RevMan5.3. We assessed new studies and re‐assessed studies already included in the old review by using the criteria and methods indicated in the Cochrane Handbook for Systematic Reviews of Interventions (Higgins 2011).
The recommended approach for assessing risk of bias of studies included in Cochrane reviews is based on evaluation of six specific methodological domains (namely, sequence generation, allocation concealment, blinding, incomplete outcome data, selective outcome reporting and other issues). For each study, we analysed the six domains, described them as reported in the study and offered a final judgement on the likelihood of bias. The first portion of the assessment tool involves describing what was reported to have happened in the study. The second portion involves assigning a judgement related to risk of bias for that entry, in terms of low, high or unclear risk.
To make these judgements, we used the criteria indicated in the Cochrane Handbook for Systematic Reviews of Interventions and as applied to the field of addiction. See Appendix 6 for details. For a detailed description of the criteria used, see the Cochrane Handbook for Systematic Reviews of Interventions version 5.1.0 (Higgins 2011).
We provided details of assessments of risk of bias in the Characteristics of included studies tables.
Measures of treatment effect
For dichotomous data from follow‐up and other studies, we calculated risk ratios (RRs) with 95% confidence intervals (CIs), with the exception of treatment retention, for which we calculated effect sizes (ESs, interpreted as pooled proportions of participants completing treatment) because comparable interventions were lacking; for continuous data from independent samples, we calculated mean differences (MDs) and standardised mean differences (SMDs) when measures of outcome differed across studies, all with 95% confidence intervals and derived by using a random‐effects model.
Unit of analysis issues
If multi‐arm studies were included in the meta‐analyses, and if one arm was considered more than once in the same comparisons (e.g. two different types of experimental treatment compared with the same control group), we combined all relevant experimental groups into a single group and compared it with the control group to avoid double counting of participants included in control groups.
Assessment of heterogeneity
We assessed intervention and methodological heterogeneity by reviewing variation between studies in terms of characteristics of included participants, interventions provided and reported outcomes. We grouped studies for analyses by the nature of the experimental intervention. We assessed statistical heterogeneity by using the Chi2 test and its P value, by visually inspecting forest plots and by considering the I2 statistic. A P value of the Chi2 test lower than 0.10 or an I2 statistic of 50% or greater indicated significant statistical heterogeneity.
Data synthesis
We used ReviewManager 5.3 for all statistical analyses, with the exception of analysis of treatment retention, for which we used STATA v14, as this enabled calculation of a weighted combined effect size for low‐intensity and high‐intensity interventions. For all analyses, we used a random‐effects model.
Subgroup analysis and investigation of heterogeneity
This review aimed to consider the following potential sources of heterogeneity by performing subgroup analyses.
Patterns of cannabis use and history of previous cannabis use (as indicated by duration and level of use, number of days of use, number of uses per day (quantity), modality of use or route of administration, age at initiation of use).
Concurrent non‐cannabis substance use.
Concurrent psychiatric illness and current treatment for that illness.
Nature of treatment delivery (regarding treatment duration, number of sessions and intervention type).
Nature of adjunct treatment or use of booster sessions.
Limitations in data collection and/or reporting across studies that met the inclusion criteria meant that only an investigation of the nature of treatment delivery was possible. Differentiation of low‐intensity and high‐intensity interventions was based on (1) results of studies that included comparisons of less intensive groups (with a maximum of four sessions) and more intensive interventions (with a minimum of six sessions) (Budney 2000; Copeland 2001; MTPRG 2004; Stephens 2000), (2) a single study that included a comparison of treatment duration (Jungerman 2007) showing group differences between a four‐session intervention delivered over four weeks and the same intervention delivered over 12 weeks and (3) a convention established across studies whereby study authors referred to interventions of four or fewer sessions (most commonly one or two sessions) as "brief".
Sensitivity analysis
We did not use methodological quality as a criterion for inclusion of studies in this review. We intended to assess the impact of methodological quality by performing sensitivity analysis. This would have involved considering the overall estimate of effect while including or excluding studies with high risk of bias. Limitations of data reported by studies that met the inclusion criteria meant that sensitivity analysis was not possible. However, we discussed risk of bias when presenting study results.
Results
Description of studies
Results of the search
As shown in the flow diagram (Figure 1), the search strategies yielded 8636 records, which were screened by reading of both titles and abstracts. This screening was followed by reading of the full article text of 151 studies for eligibility assessment.
1.
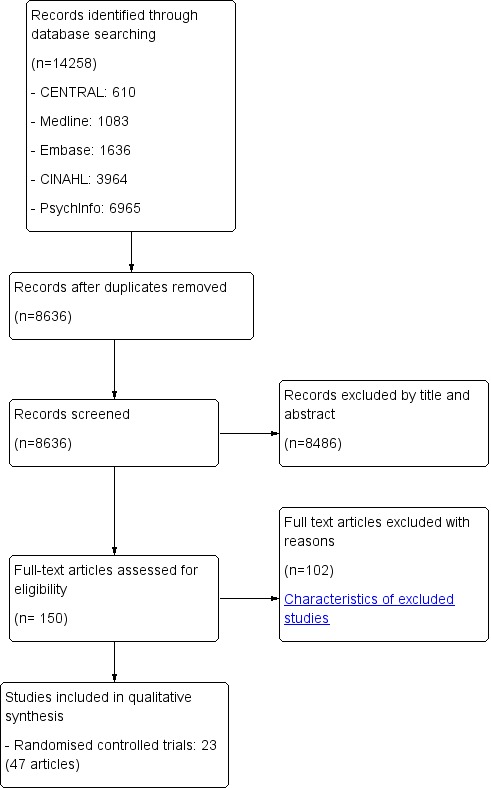
Study flow diagram.
Included studies
A total of 23 eligible randomised controlled trials (48 reports) met the inclusion criteria. These 23 trials involved 4045 participants (see Characteristics of included studies).
Treatment regimen and setting
Fifteen of 23 included studies took place in the United States, two in Germany (Hoch 2012; Hoch 2014), two in Australia (Copeland 2001; Edwards 2006) and one each in Brazil (Jungerman 2007), Canada (Fischer 2012), Switzerland (Bonsack 2011) and Ireland (Madigan 2013). All included studies applied an out‐patient design.
In all, 18 of the 23 included studies detailed therapists’ experience and training. Without exception, therapists reported previous professional counselling experience and were provided varying degrees of specific intervention training.
Across studies, investigators compared seven different therapeutic modalities: cognitive‐behavioural therapy (CBT), motivational intervention (MET), a combination of MET and CBT (MET + CBT), contingency management (CM), social support (SS), mindfulness‐based meditation (MM) and drug education and counselling (DC).
A total of 15 included studies compared CBT versus another therapy (Budney 2000; Budney 2006; Carroll 2006; Carroll 2012; Copeland 2001; Hoch 2012; Hoch 2014; Jungerman 2007; Kadden 2007; Litt 2013; Madigan 2013; Roffman 1988; Stephens 1994; Stephens 2000; and the Marijuana Treatment Project Research Group 2004 or MTPRG 2004). CBT was similar for all included studies but was delivered individually for 11 of them (Budney 2000; Budney 2006; Carroll 2006; Carroll 2012; Copeland 2001; Hoch 2012; Hoch 2014; Jungerman 2007; Kadden 2007; Litt 2013; MTPRG 2004) and in group sessions for the other four (Madigan 2013; Roffman 1988; Stephens 1994; Stephens 2000).
The MET format was similar for the 15 included studies assessing such therapy (Bernstein 2009; Bonsack 2011; Budney 2000; Carroll 2006; Hoch 2012; Hoch 2014; Jungerman 2007; Kadden 2007; Lee 2013; Litt 2013; Madigan 2013; MTPRG 2004; Stein 2011; Stephens 2000; Stephens 2007).
A total of six studies assessed CM, with six studies providing incentives for provision of biological samples that tested negative for cannabis use (referred to as abstinence‐based CM or CM‐abs) (Budney 2000; Budney 2006; Carroll 2006; Carroll 2012; Kadden 2007; Litt 2013) and four studies for adherence to treatment appointments (referred to as adherence‐based CM or CM‐adh) (Budney 2006; Carroll 2006; Carroll 2012; Litt 2013). In addition, such incentives were withheld when samples tested positive, or when appointments were missed. The size of the incentives differed among the six studies that assessed CM, ranging from a lottery system with average winnings between $106 and $140 (Litt 2013) to systems allowing possible earning of up to $250 (Carroll 2012), $385 (Kadden 2007), $570 (Budney 2000) $645 (Budney 2006) and $880 (Carroll 2006).
A single study delivered mindfulness‐based meditation (MM) (de Dios 2012).
Four of the included studies utilised individual drug counselling and education (DC) as a comparison treatment (Carroll 2006; Edwards 2006; Fischer 2012; Stephens 2007).
Two included studies used the social support treatment as a comparison treatment (Roffman 1988; Stephens 1994).
A total of 11 studies assessedonly delayed treatment control (DTC) as a control group (Bernstein 2009; Copeland 2001; de Dios 2012; Hoch 2012; Hoch 2014; Jungerman 2007; Lee 2013; MTPRG 2004; Stein 2011; Stephens 2000; Stephens 2007). Two studies used an active control condition that focused on life issues (such as occupational, social, psychiatric and educational goals), which served as a control for non‐specific factors related to time spent in treatment (referred to as assessed control; Kadden 2007; Litt 2013).
Finally, three studies included a "treatment‐as‐usual" (TAU) control condition, which consisted of psychiatric case management, psychoeducation regarding substance use and medication delivered as needed in psychiatric clinics (intervention participants received TAU in addition to active treatment) (Bonsack 2011; Edwards 2006; Madigan 2013). In each of these three studies, given that participants were in treatment for psychosis, intervention groups received the cannabis treatment under study along with this usual treatment.
Duration of trials
Duration of studies from baseline was one month (Roffman 1988), three months (de Dios 2012), 14 weeks (Budney 2000), four months (Jungerman 2007), six months (Carroll 2006; Edwards 2006; Hoch 2012; Hoch 2014; Lee 2013; Stein 2011), eight months (Copeland 2001), 12 months (Bernstein 2009; Bonsack 2011; Budney 2006; Carroll 2012; Fischer 2012; Kadden 2007; Litt 2013; Madigan 2013; Stephens 1994; Stephens 2007), 15 months (MTPRG 2004)or 16 months (Stephens 2000). We have provided additional details of follow‐up periods in Table 2.
1. Trial follow‐up period.
| Study and group | Follow‐up period |
| Bernstein 2009, (1) Brief MET + CBT, (2) assessed control | (1) and (2) at 3 and 12 months from baseline |
| Bonsack 2011, (1) MET, (2) TAU | (1) and (2) at 3, 6 and 12 months from baseline |
| Budney 2000, (1) MET + CBT + CM‐abs, (2) MET + CBT, (3) MET | (1), (2) and (3) at end of treatment [14 weeks from baseline] |
| Budney 2006, (1) CBT + CM‐abs, (2) CBT + CM‐adh, (3) CM‐abs | (1), (2) and (3) at end of treatment [14 weeks from baseline], then monthly for 12 months post treatment [data provided for 3, 6, 9 and 12 month assessments] |
| Carroll 2006, (1) MET + CBT + CM‐abs + CM‐adh, (2) DC + CM‐abs + CM‐adh, (3) MET + CBT, (4) DC | (1), (2), (3) and (4) at end of treatment [8 weeks from baseline], then at 3 and 6 months post treatment |
| Carroll 2012, (1) CBT, (2) CBT + CM‐adh, (3) CBT + CM‐abs, (4) CM‐abs | (1), (2), (3) and (4) at end of treatment [12 weeks from baseline], then at 3, 6, 9 and 12 months post treatment |
| Copeland 2001, (1) CBT (6‐session), (2) CBT (1‐session), (3) DTC | (1) at an average of 242 days from baseline; (2) at an average of 223.5 days from baseline; (3) at an average of 242.5 days from baseline |
| de Dios 2012, (1) MM, (2) Assessed control | (1) and (2) at end of treatment [2 weeks from baseline], then at 1 and 2 months from baseline |
| Edwards 2006, (1) CBT, (2) TAU | (1) and (2) at end of treatment [3 months from baseline], then at 6 months post treatment |
| Fischer 2012, (1) DC‐oral, (2) DC‐workbook, (3) Health promotion‐oral, (4) Health promotion‐workbook | (1), (2), (3) and (4) at 3 and 12 months post treatment |
| Hoch 2012, (1) MET + CBT, (2) DTC | (1) at end of treatment [8‐12 weeks from baseline], then at 3 and 6 months from baseline; (2) at 8‐12 weeks |
| Hoch 2014, (1) MET + CBT, (2) DTC | (1) at end of treatment [8 weeks], then at 3 and 6 months from baseline; (2) at 8 weeks |
| Jungerman 2007, (1) MET + CBT (3 months), (2) MET + CBT (1 month), (3) DTC | (1) at 1 month post treatment; (2) at 3 months post treatment; (3) at 4 months post baseline |
| Kadden 2007 (1) MET + CBT + CM‐abs, (2) MET + CBT, (3) CM‐abs, (4) TAU | (1), (2), (3) and (4) at end of treatment [2 month follow‐up] and at 5, 8, 11 and 14 months from baseline |
| Lee 2013, (1) MET, (2) Assessed control | (1) and (2) at 3 and 6 months from baseline |
| Litt 2013, (1) MET + CBT + CM‐abs, (2) MET + CBT + CM‐adh, (3) TAU | (1), (2) and (3) at end of treatment [2 months from baseline], then at 3, 6, 9 and 12 months post treatment |
| Madigan 2013, (1) MET + CBT, (2) TAU | (1) and (2) at 3 and 12 months from baseline |
| MTPRG 2004, (1) MET + CBT, (2) MET, (3) Assessed control | (1) and (2) at 4, 9 and 15 months from baseline; (3) at 4 months from baseline |
| Roffman 1988, (1) RP, (2) SS | (1) and (2) at end of treatment [12 weeks], then at 1, 3, 6, 9 and 12 months post treatment [only data from 1 month follow‐up are provided] |
| Stein 2011, (1) MET, (2) Assessed control | (1) and (2) at 1, 3 and 6 months from baseline |
| Stephens 1994, (1) RP, (2) SS | (1) and (2) at 1, 3, 6, 9 and 12 months post treatment |
| Stephens 2000, (1) CBT, (2) MET, (3) Assessed control | (1) at 1 month from baseline [during treatment], at end of treatment [4 months from baseline] then at 3, 9 and 12 months post treatment; (2) at end of treatment [1 month from baseline] then at 3, 6, 12 and 15 months post treatment; (3) at 4 months from baseline |
| Stephens 2007, (1) MET, (2) DC, (3) DTC | (1) and (2) end of treatment [7 weeks from baseline], then at 6 and 12 months from baseline; (3) at 7 weeks from baseline |
CBT: Cognitive‐behavioural therapy
CM‐abs: Contingency management with vouchers presented for negative urine
CM‐adh: Contingency management with vouchers presented for treatment attendance/adherence
DC: Drug counselling
DTC: Delayed treatment control
MET: Motivational enhancement therapy
MM: Mindfulness‐based meditation
RP: Relapse prevention
SS: Social support
TAU: Treatment as usual
Funding sources
Most of the included studies were funded by the National Institute on Drug Abuse (Bernstein 2009; Budney 2000; Budney 2006; Carroll 2006; Carroll 2012; de Dios 2012; Kadden 2007; Lee 2013; Litt 2013; Stein 2011; Stephens 1994; Stephens 2000; Stephens 2007). Remaining studies were funded by various research grants supplied by the Swiss Research National Fund (Bonsack 2011), the Australian Commonwealth Department of Health and Family Services Research into Drug Abuse Grants Program (Copeland 2001), the Victorian Government Department of Human Services (Edwards 2006), Canadian Institutes of Health Research (Fischer 2012), the German Federal Ministry of Education and Research (Hoch 2012; Hoch 2014), the São Paulo Research Foundation (Jungerman 2007), the Health Research Board of Ireland (Madigan 2013) and the Substance Abuse and Mental Health Services Administration (MTPRG 2004). A final article did not specify a funding body (Roffman 1988).
Participants
A clear majority of participants from 13 studies met diagnostic criteria for cannabis use disorder according to the Diagnostic and Statistical Manual of Mental Disorders, Third Edition, Revised (DSM‐III‐R) (Budney 2000; Copeland 2001; Stephens 2000); the Diagnostic and Statistical Manual of Mental Disorders, Fourth Edition (DSM‐IV) (Budney 2006; Carroll 2006; Hoch 2012; Jungerman 2007; Kadden 2007; Litt 2013; Madigan 2013; MTPRG 2004); the Drug and Alcohol Screening Test (DAST; Stephens 1994); and the Severity of Dependence Scale (SDS; Hoch 2014). In addition, Carroll 2012 included participants on the basis of unclear assessment of cannabis use disorder, but participants reported using cannabis on average 12 or more of the past 28 days.
Several studies did not include participants on the basis of assessment of cannabis use disorder but instead used a cutoff based on frequency of cannabis use. This cutoff ranged from twice a month (de Dios 2012) to three to five days a month (Bernstein 2009; Bonsack 2011; Lee 2013), 11 days a month (Fischer 2012), 15 days a month (Stephens 2007) and 50 or more of the past 90 days (Roffman 1988, Stephens 1994). Finally, two studies did not require that participants had used cannabis at an established frequency but included samples reported using cannabis on average at least 26% (Edwards 2006) to 55% of days (Stein 2011). Actual cannabis use at baseline (pre‐treatment) was reported across study groups to occur on average 20.8 days (standard deviation (SD) = 5.6) of the past 30 days (ranging from an average of 7.8 to 28.3 days in the past month).
In nine studies, participants were excluded if they met current abuse or dependence DSM criteria for any other drug (except nicotine). Notably, frequent use of drugs (weekly or more often) other than cannabis or nicotine among most participants was an exclusion criterion for this review.
Averaging across study groups, participants' mean age was 28.2 years (SD = 5.4), and the total number of participants included in this review was 4045.
Types of comparison
Included studies performed very heterogeneous comparisons among different types of interventions. We pooled study results on the basis of comparisons between:
any intervention versus inactive control (10 studies: Bernstein 2009; Copeland 2001; Hoch 2012; Hoch 2014; Jungerman 2007; Lee 2013; MTPRG 2004; Stephens 1994; Stephens 2000; Stephens 2007);
any intervention versus treatment as usual (three studies: Bonsack 2011; Edwards 2006; Madigan 2013); and
intervention versus intervention (nine studies: Budney 2000; Budney 2006; Copeland 2001; Jungerman 2007; MTPRG 2004; Roffman 1988; Stephens 1994; Stephens 2000; Stephens 2007).
Excluded studies
We excluded a total of 102 studies (see Characteristics of excluded studies)on the basis of the following criteria.
Most of the sample did not report that they experienced cannabis use disorder or at least near daily use (15 studies).
Most of the sample reported frequent use of other illicit substances or alcohol, or reported another substance use disorder (15 studies).
Most included participants were 17 years of age or younger (20 studies).
The study did not include a comparison between treatment and control groups (eight studies).
The study provided a review of cannabis treatment trials (one study).
The intervention could not be delivered in an out‐patient setting (seven studies).
The study was narrative only or met no inclusion criteria and was largely irrelevant (35 studies).
Risk of bias in included studies
We included in the Characteristics of included studies details of assessments of risk of bias; for a summary of the results of judged risk of bias for each domain across the included studies, see Figure 2.
2.
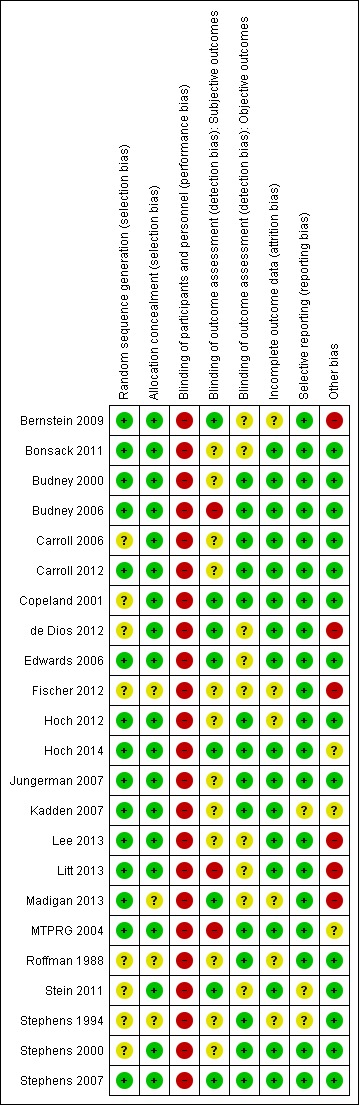
Risk of bias summary: review authors' judgements about each risk of bias item for each included study.
Allocation
Random sequence generation
For this domain, a total of 15 studies had low, eight had unclear and no studies had high risk of selection bias.
Allocation concealment
For this domain, a total of 19 studies had low and four had unclear risk of selection bias. No studies had high risk of selection bias.
Blinding
We assessed blinding for subjective (self report measures) and objective outcomes (collateral reports or urinalysis). Across trials, participants and providers could not possibly be blinded to the allocated intervention and associated outcomes. Therefore, participants from all studies were at high risk of performance bias. This was not the case for the outcome assessor, who could be blinded. With regards to subjective outcomes, a total of eight studies used blinded outcome assessors and therefore were at low risk of performance bias;12 studies did not report whether outcome assessors were blinded and were at unclear risk of performance bias. The remaining three studies reported that outcome assessors were not blinded; these studies were at high risk of performance bias. With regards to objective outcomes, 13 studies included collateral estimates or urinary analysis (which could not be affected by blinding) and therefore were at low risk of performance bias. In contrast, nine studies did not assess objective outcomes, but because correlation between objective and subjective measures of cannabis use is high, it was unclear whether these studies were at risk of performance bias.
Incomplete outcome data
A total of 17 studies had low and six studies had unclear risk of attrition bias. No studies had high risk of attrition bias.
Selective reporting
A total of 20 studies had low and three studies had unclear risk of reporting bias. No studies had high risk of reporting bias.
Other potential sources of bias
Each of the other potential sources of bias was given equal weight with regards to the overall assessment of other potential bias. Indications of other bias included no assessment of non‐cannabis substance use, or use of additional treatments before and during the trial period, or treatment fidelity; rates of intervention completion; participant demographics; pre‐intervention history of cannabis use, or experience with cannabis treatments; significant between‐group differences at baseline in assessed participant demographics or cannabis use‐related variables; and whether selected cannabis‐related measures were reliable and valid.
A total of 14 studies had low and three had unclear risk of other sources of bias; six studies had high risk of other bias.
Effects of interventions
See: Table 1
Meta‐analysis was possible only for each of the primary outcomes at short‐term follow‐up; limitations in data collection and reporting and heterogeneity of included studies meant that results for secondary treatment outcomes could not be pooled (see Table 1 for these results; see Types of outcome measures for details on measures).
Primary outcomes
Reductions in frequency of cannabis use
Intervention versus inactive control
Any intervention
Those receiving any intervention reported fewer days of cannabis use in the prior 30 days at follow‐up compared with those receiving inactive control (mean difference (MD) 5.67, 95% confidence interval (CI) 3.08 to 8.26, six studies, 1144 participants; Analysis 1.1). The included period of follow‐up with the most consistently available data across studies ranged between seven weeks and four months. The quality of evidence for this outcome was considered to be moderate (Table 1).
1.1. Analysis.
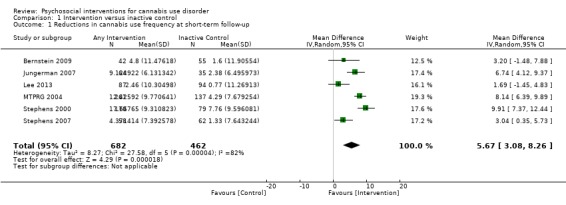
Comparison 1 Intervention versus inactive control, Outcome 1 Reductions in cannabis use frequency at short‐term follow‐up.
Subgroup analysis for intensity of the intervention
Those receiving a high‐intensity intervention (more than four sessions or duration longer than one month) showed the greatest differences compared with those given inactive control (MD 10.02, 95% CI 7.69 to 12.34, three studies, 381 participants; Analysis 1.2), although those receiving an intervention of low intensity (four or fewer sessions or duration less than one month) also used cannabis on fewer days compared with those given control (MD 4.58, 95% CI 2.65 to 6.50, six studies, 763 participants; Analysis 1.2).
1.2. Analysis.
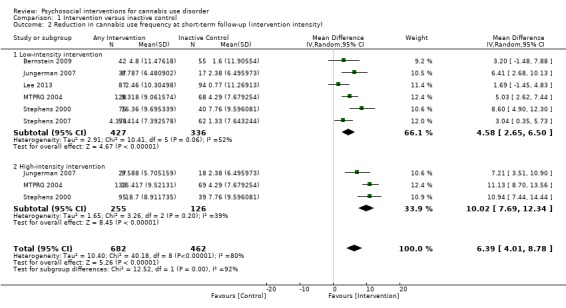
Comparison 1 Intervention versus inactive control, Outcome 2 Reduction in cannabis use frequency at short‐term follow‐up (intervention intensity).
Subgroup analysis for type of intervention
Compared with inactive control, those receiving CBT used cannabis on the fewest days (MD 10.94, 95% CI 7.44 to 14.44, one study, 134 participants; Analysis 1.3), followed by those receiving MET + CBT (MD 7.38, 95% CI 3.18 to 11.57, four studies, 612 participants; Analysis 1.3) and MET (MD 4.45, 95% CI 1.90 to 7.00; Analysis 1.3).
1.3. Analysis.
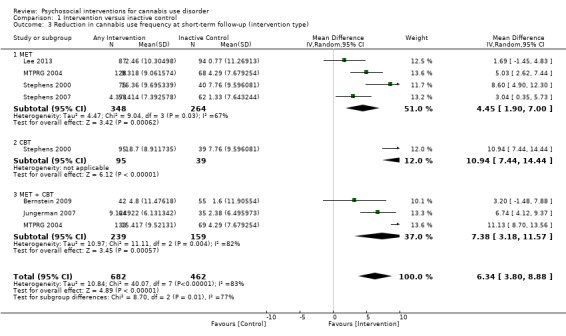
Comparison 1 Intervention versus inactive control, Outcome 3 Reduction in cannabis use frequency at short‐term follow‐up (intervention type).
Studies not included in meta‐analysis
These studies also reported a significant intervention effect on frequency of cannabis use, particularly before six‐month follow‐up. Interventions resulting in greater reductions in cannabis use compared with control included MET (Stein 2011), MET + CBT (Hoch 2012; Hoch 2014), six‐session CBT (Copeland 2001) and MM (although this study included females only and was at high risk of other bias; de Dios 2012). In contrast, three studies failed to show effectiveness over inactive control. The first was a comparison between a single‐session CBT intervention and delayed treatment control with no significant difference in days of cannabis use at eight months (242 days on average) (Copeland 2001). The second consisted of a nine‐session MET + CBT + CM‐adh and a nine‐session MET + CBT + CM‐abs with no between‐group differences across 14 months compared with treatment designed to control for time and attention (although this study was at high risk of detection and other bias; Litt 2013). Finally, a single study found DC to be somewhat effective when delivered in person or by workbook at 12‐month follow‐up but no more effective than a non‐drug health promotion control (this study was at high risk of other bias; Fischer 2012).
Intervention versus treatment as usual
Any intervention
Two trials provided data for pooling, although the included period of follow‐up was limited to end of treatment as the result of inconsistencies in assessment periods. Analysis included a 10‐session DC (Edwards 2006) and a 13‐session MET + CBT delivered in group format (Madigan 2013). Neither intervention showed a significant treatment effect over control (MD 0.13, 95% CI ‐2.00 to 2.27, two studies, 97 participants; Analysis 2.1). An additional study reported no significant treatment effect for six‐session MET over 12 months as compared with treatment as usual control (Bonsack 2011).
2.1. Analysis.
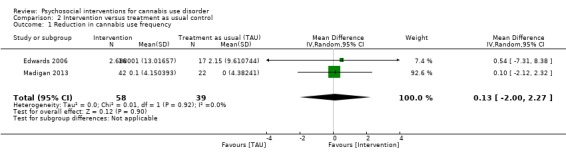
Comparison 2 Intervention versus treatment as usual control, Outcome 1 Reduction in cannabis use frequency.
Intervention versus intervention
Several interventions were compared with alternative active treatments, although data pooling was not always possible, as only a handful of intervention types were compared against alternative treatments in more than one study.
RP versus SS
A total of two studies compared RP‐based and SS‐based interventions (each 10 sessions, delivered in groups of 12 to 15). In the initial study, reductions in frequency of cannabis use were greater at one‐month follow‐up for those receiving RP as compared with those treated with SS (MD 5.55, 95% CI 1.89 to 9.21, one study, 97 participants) (Roffman 1988). Notably, no such significant between‐group differences were noted up to 12‐month follow‐up in a separate study of these interventions (although risk of bias assessments for this study were largely unclear; Stephens 1994).
MET versus alternative treatment
A total of four studies compared MET‐based interventions versus alternative treatments. MET was found to be superior only to a drug‐related health education treatment provided for up to 12 months (MD 3.99, 95% CI 0.89 to 7.08, one study, 112 participants; Analysis 3.1) (Stephens 2007). In contrast, no significant between‐group differences were found between MET (two sessions, delivered to individuals) and CBT (14 sessions, delivered to groups of eight to 12) up to twelve‐month follow‐up (MD ‐0.86, 95% CI ‐3.86 to 2.14, one study, 179 participants; Analysis 3.1) (Stephens 2000). Further, no significant differences were noted between four‐session MET and a more intensive 14‐session MET + CBT intervention at end of treatment (MD ‐2.80, 95% CI ‐9.94 to 4.34, one study, 31 participants; Analysis 3.1)), although MET was inferior to a similar MET + CBT + CM‐abs intervention (MD ‐7.30, 95% CI ‐13.68 to ‐0.92, one study, 30 participants; Analysis 3.1)) (Budney 2000). Similarly, a two‐session MET was inferior to a nine‐session MET + CBT + CM‐abs intervention across nine‐month follow‐up (MD ‐4.96, 95% CI ‐7.18 to ‐2.74, one study, 266 participants; Analysis 3.1)), although this study was at high risk of detection bias (MTPRG 2004).
3.1. Analysis.
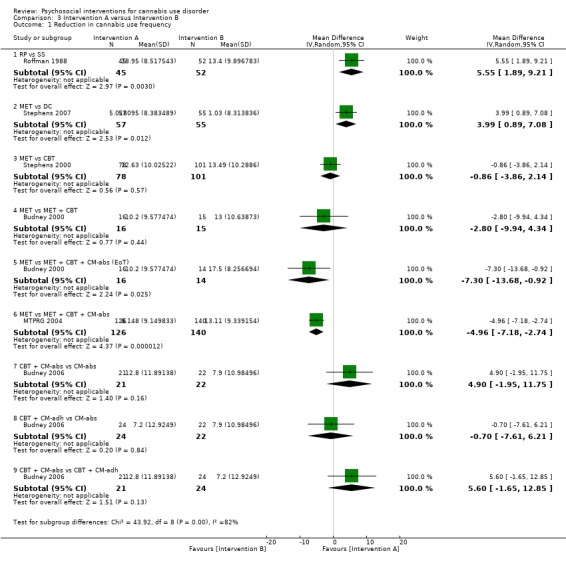
Comparison 3 Intervention A versus Intervention B, Outcome 1 Reduction in cannabis use frequency.
CBT versus alternative treatment
In addition to the mentioned comparison between CBT and MET, CBT‐based interventions were compared with alternative treatments in three studies. Twelve‐session CBT was found to be superior to a similar intervention paired with the addition of CM‐abs or CM‐adh across 12‐month follow‐up post treatment, although no significant differences were noted between CBT and CM‐abs unpaired (Carroll 2012). A separate study found no significant differences at 12 months regarding comparisons between CBT + CM‐abs or CBT + CM‐adh versus CM‐abs delivered unpaired (MD 4.90, 95% CI ‐1.95 to 11.75, one study, 43 participants; MD ‐0.70, 95% CI ‐7.61 to 6.21, one study, 46 participants) or between CBT + CM‐adh and CBT + CM‐abs (MD 5.60, 95% CI ‐1.65 to 12.85, one study, 45 participants) (although this study was at high risk of detection bias; Budney 2006). Finally, no significant difference was reported between a six‐session and a single‐session CBT intervention at eight months (242 days on average) (Copeland 2001).
MET + CBT versus alternative treatment
A total of two additional studies compared MET + CBT‐based interventions versus alternative treatments. No significant group differences were found when eight‐session MET + CBT was compared with DC across six‐month follow‐up, but both were found to be inferior when delivered alone as compared with delivery plus addition of CM‐abs and CM‐adh (study authors reported the effect of adding CM as d = 0.29, 95% CI –0.06 to 0.64) (Carroll 2006). In addition, a study comparing MET + CBT, MET + CBT + CM‐abs, CM‐abs alone and a non‐drug health promotion control found that CM‐abs alone showed effectiveness in rates of continuous abstinence at three‐month follow‐up, and MET + CBT + CM‐abs was superior at 12‐month follow‐up (Kadden 2007). No other between‐group differences were reported for this outcome. A final study compared MET + CBT + CM‐abs and MET + CBT‐adh versus each other and versus an assessment‐only control condition across 12 months (although this study was at high risk of detection and other bias; Litt 2013). Although MET + CBT + CM‐abs was found to be superior to MET + CBT + CM‐adh (each nine sessions) at five‐ to eight‐month follow‐up assessments, neither intervention was superior to the assessment‐only control.
CM versus alternative treatment
Finally, several studies investigated the impact of CM‐abs and CM‐adh as adjunct treatments to MET, CBT and MET + CBT interventions. Most of these studies supported the use of CM‐abs (Budney 2000; Carroll 2006; Kadden 2007) and CM‐adh (Carroll 2006), and one study found contrasting results throughout a 12‐month follow‐up period, as outcomes related to overall reductions in cannabis use frequency favoured CBT alone without the addition of CM‐abs or CM‐adh (Carroll 2012). Two studies compared use of CM‐abs adjunct treatment versus CM‐adh adjunct treatment. Neither study found any significant between‐group differences at 12 months (although both studies were at high risk of detection bias; Budney 2006; Litt 2013).
Summary of reduction in frequency of cannabis use
Most notably, few active intervention comparisons showed significant differences between groups with regards to reductions in frequency of cannabis use from six‐month follow‐up onwards (with longest follow‐up at 16 months from baseline). This included CBT + CM‐abs versus CBT + CM‐adh versus CM‐abs alone (Budney 2006); six‐session CBT versus single‐session CBT (Copeland 2001); DC versus psychosis treatment as usual control (Edwards 2006); MET + CBT versus inactive control (Hoch 2012; Hoch 2014); MET versus inactive control (Lee 2013; Stein 2011); RP versus SS (Stephens 1994); CBT versus MET (Stephens 2000); MET versus drug‐related health education (Stephens 2007) and DC delivered orally or by workbook versus non‐drug health promotion control (although this study was at unclear or high risk across most assessments of bias; Fischer 2012). Studies showed five notable exceptions to this lack of treatment effectiveness in the prior six months. First, a nine‐session MET + CBT + CM‐abs intervention outperformed a MET + CBT + CM‐adh intervention for up to 12 months (all nine sessions; Litt 2013). Second, a nine‐session MET + CBT intervention outperformed a shorter two‐session counterpart for up to 15 months (MTPRG 2004). Third, CBT + CM‐abs showed improved outcomes compared with CM‐abs alone (each 14 sessions) at 12‐month follow‐up (Budney 2006). Fourth, a single‐session MET intervention was superior to a single session of drug‐related health education at 12 months (Stephens 2007). Fifth, a 12‐session CBT intervention showed superior outcomes when delivered unpaired by CM‐abs or CM‐adh over 12 months (Carroll 2012). Finally, MET + CBT + CM‐abs was superior to MET + CBT, DC and CM‐abs interventions at 12 months, although only in terms of continuous abstinence rates, not in terms of past month point‐prevalence estimates (Kadden 2007).
We have provided a further summary of units of measurement and all included study findings regarding the impact of intervention and control on frequency of cannabis use from baseline to follow‐up in Table 3.
2. Summary of treatment outcomes: cannabis use frequency.
| Study and group | Measure | Baseline |
Follow‐up [% with data] |
Significance* |
| Bernstein 2009, (1) Brief MET + CBT, (2) Assessed control | Days used in prior 30 days (mean ± SD) | (1) 19.0 ± 10.9, N = 68, (2) 15.3 ± 10.1, N = 71 | (1) 11.0 ± 10.7, N = 42 [69.1%], (2) 13.2 ± 11.7, N = 55 [77.5%] | (1) vs (2) P value = 0.024 |
| Bonsack 2011, (1) MET, (2) TAU | Days abstinent in prior ‘month’ (median ± range) | (1) 5.0 ± 24, N = 30, (2) 3.0 ± 27, N = 32 | (1) 5.5 ± 28, N = 25 [83.3%], (2) 8.5 ± 28, N = 29 [90.6%] | (1) vs (2) P value > 0.05 |
| Budney 2000, (1) MET + CBT + CM‐abs, (2) MET + CBT, (3) MI | Days used in prior 30 days (least squares mean ± SE) | (1) 24.1 ± 1.8, N = 20, (2) 20.4 ± 1.8, N = 20, (3) 23.2 ± 1.8, N = 20 | (1) 6.6 ± 2.6, N = 14 [70.0%], (2) 7.4 ± 2.3, N = 15 [75.0%], (3) 13.0 ± 2.1, N = 16 [80.0%] | (1) vs (2) P value > 0.05; (1) vs (3) P value > 0.05; (2) vs (3) P value > 0.05 |
| Budney 2006, (1) CBT + CM‐abs, (2) CBT + CM‐adh, (3) CM‐abs | Days used in prior 30 days (mean ± SD) | (1) 25.3 ± 8.0, N = 30, (2) 25.5 ± 7.4, N = 30, (3) 26.0 ± 6.2, N = 30 | (1) 12.5 ± 13.9, N = 21 [70.0%], (2) 18.3 ± 15.7, N = 24 [80.0%], (3) 18.1 ± 13.6, N = 22 [73.3%] | (1) vs (2) P value > 0.05; (1) vs (3) P value > 0.05; (2) vs (3) P value > 0.05 |
| Carroll 2006, (1) MET + CBT + CM‐abs + CM‐adh, (2) DC + CM‐abs + CM‐adh. (3) MET + CBT, (4) DC | Proportion of days used post treatment (mean ± SE) | (1) n/a, N = 33, (2) n/a, N = 34, (3) n/a, N = 36, (4) n/a, N = 33 | (1) 0.64 ± 0.06, N = 27 [81.8%], (2) 0.75 ± 0.1, N = 24 [70.6%], (3) 0.73 ± 0.05, N = 27 [75.0%], (4) 0.71 ± 0.06, N = 30 [90.9%] | (1) vs (2) P value > 0.05; (1) vs (3) P value > 0.05; (1) vs (4) P value = 0.02; (2) vs (3) P value > 0.05; (3) vs (4) P value = 0.02; (2) vs (4) P value > 0.05 |
| Carroll 2012, (1) CBT, (2) CBT + CM‐adh, (3) CBT + CM‐abs, (4) CM‐abs | Days used in prior 28 days (mean ± SD) | (1) 15.6 ± 9.8, N = 36, (2) 17.6 ± 8.6, N = 32, (3) 17.9 ± 9.6, N = 32, (4) 14.1 ± 10.6, N = 27 | (1) Unclear, N = 33 [91.7%], (2) Unclear, N = 25 [78.1%], (3) Unclear, N = 26 [81.3%], (4) Unclear, N = 23 [85.2%] | (1) vs (2) P value = 0.00; (1) vs (3) P value = 0.00; (1) vs (4) P value > 0.05; (2) vs (3) P value > 0.05; (3) vs (4)* P value = 0.00; (2) vs (4) P value = 0.00 |
| Copeland 2001, (1) CBT [6‐session], (2) CBT [1‐session], (3) DTC | Percent of days abstinent post treatment (mean ± SD) | (1) n/a, N = 78, (2) n/a, N = 82, (3) n/a, N = 69 | (1) 35.9 ± 34.8, N = 58 [74.4%], (2) 44.8 ± 37.7, N = 61 [74.4%], (3) 29.7 ± 32.6, N = 52 [75.4%] | (1) vs (2) P value > 0.05; (1) vs (3) P value > 0.05; (2) vs (3) P value > 0.05 |
| de Dios 2012, (1) MM, (2) Assessed control | Days used in prior 30 days (mean ± SD) | (1) 17.0 ± 9.96, N = 22, (2) 18.8 ± 8.1, N = 12 | (1) Unclear, N = 16 [72.7%], (2) Unclear, N = 9 [75.0%] | (1) vs (2) P value = 0.031 across FU |
| Edwards 2006, (1) DC, (2) TAU | % of days used in prior 4 weeks (mean ± SD) | (1) 39.4 ± 38.4, N = 23, (2) 26.0 ± 28.3, N = 24 | (1) 32.4 ± 44.9, N = 16 [69.6%], (2) 19.3 ± 30.4, N = 17 [70.8%] | (1) vs (2) P value > 0.05 |
| Fischer 2012, (1) DC‐oral, (2) DC‐workbook, (3) Health promotion‐oral, (4) Health promotion‐workbook | Days used in prior 30 days (mean, range) | (1) 21.96, 4.75, N = 24, (2) 24.82, 3.0, N = 47, (3) 21.36, 5.5, N = 25, (4) 25.36, 3.41, N = 37 | (1) Unclear, N = Unclear, (2) Unclear, N = Unclear, (3) Unclear, N = Unclear, (4) Unclear, N = Unclear | (1) vs (2) P value > 0.05; (1) vs (3) P value > 0.05; (1) vs (4) P value > 0.05; (2) vs (3) P value > 0.05; (3) vs (4) P value > 0.05; (2) vs (4) P value > 0.05 |
| Hoch 2012, (1) MET + CBT, (2) DTC | Percent reporting abstinence post treatment (%) | (1) n/a, N = 90, (2) n/a, N = 32 | (1) 49, N = 79 [87.8%], (2) 12.5, N = 31 [96.9%] | (1) vs (2) P value < 0.05 |
| Hoch 2014, (1) MET + CBT, (2) DTC | Percent reporting abstinence post treatment (%) | (1) n/a, N = 166, (2) n/a, N = 130 | (1) 53.3, N = 166 [100%], (2) 22, N = 106 [81.5%] | (1) vs (2) P value < 0.05 |
| Jungerman 2007, (1) MET + CBT [3 months], (2) MET + CBT [1 month], (3) DTC | Percent of days used in prior 90 days (mean ± SE) | (1) 88.17 ± 1.95, N = 52, (2) 94.19 ± 1.87, N = 56, (3) 94.06 ± 1.95, N = 52 | (1) 56.21 ± 4.38, N = 27 [51.9%], (2) 64.90 ± 4.27, N = 37 [66.1%], (3) 86.12 ± 4.38, N = 35 [67.3%] | (1) vs (2) P value > 0.05; (1) vs (3) P value = 0.0008; (2) vs (3) P value = 0.0002 |
| Kadden 2007 (1) MET + CBT + CM‐abs, (2) MET + CBT, (3) CM‐abs, (4) Health education | Proportion of days used in prior 90 days (mean ± SD) | (1) 0.11 ± 0.17, N = 63, (2) 0.08 ± 0.13, N = 61, (3) 0.15 ± 0.19, N = 54, (4) 0.08 ± 0.12, N = 62 | (1) 27, N = 51 [81.0%], (2) 19, N = 49 [80.3%], (3) Unclear, N = 48 [88.9%], (4) Unclear, N = 52 [83.9%] | (1) vs (2) P value > 0.05; (1) vs (3) P value > 0.05; (1) vs (4) P value < 0.05; (2) vs (3) P value > 0.05; (3) vs (4) P value > 0.05 [P value < 0.05 at 3 month FU only]; (2) vs (4) P value < 0.05 |
| Lee 2013, (1) MET, (2) Assessed control | Days used in prior 30 days (mean ± SD) | (1) 16.5 ± 8.2, N = 106, (2) 15.6 ± 8.8, N = 106 | (1) 13.2 ± 10.6, N = 89 [84.0%], (2) 11.7 ± 11.1, N = 86 [81.1%] | (1) vs (2) P value > 0.05 |
| Litt 2013, (1) MET + CBT + CM‐abs, (2) MET + CBT + CM‐adh, (3) Assessed control | Days used in prior 90 days (mean ± SD) | (1) 72.5 ± 28.0, N = 73, (2) 71.8 ± 27.8, N = 71, (3) 68.4 ± 31.5, N = 71 | (1) Unclear, N = 60 [82.2%], (2) Unclear, N = 61 [85.9%], (3) Unclear, N = 61 [85.9%] | (1) vs (2) P value < 0.05 [significant at FU months 5‐8 only]; (1) vs (3) P value > 0.05; (2) vs (3) P value > 0.05 |
| Madigan 2013, (1) MET + CBT, (2) TAU | Days used in prior 30 days (mean ± SD) | (1) 10.0 ± 3.6, N = 59, (2) 10.1 ± 3.7, N = 29 | (1) 9.8 ± 3.9, N = 32 [54.2%], (2) 10.1 ± 4.0, N = 19 [65.5%] | (1) vs (2) P value > 0.05 |
| MTPRG 2004, (1) MET + CBT, (2) MET, (3) Assessed control | Percent of days used in prior 90 days (mean ± SD) | (1) 87.56 ± 17.24, N = 156, (2) 86.92 ± 17.15, N = 146, (3) 89.88 ± 14.11, N = 148 | (1) 44.86 ± 40.52, N = 129 [82.7%], (2) 53.65 ± 38.57, N = 120 [82.2%], (3) 75.59 ± 30.69, N = 137 [92.6%] | (1) vs (2) P value < 0.05 [Cohen d = 0.22]; (1) vs (3) P value < 0.05 [Cohen d = 1.14]; (2) vs (3) P value < 0.05 [Cohen d = 0.59] |
| Roffman 1988, (1) RP, (2) SS | Days used in prior ‘month’ (mean ± SD) | (1) 27.13 ± 4.6, N = 54, (2) 26.36 ± 5.79, N = 56 | (1) 8.18 ± 10.48, N = 45 [83.3%], (2) 12.96 ± 11.56, N = 52 [92.9%] | (1) vs (2) P value < 0.05 |
| Stein 2011, (1) MET, (2) Assessed control | Proportion of days used in prior 90 days (mean ± SD) | (1) 0.59 ± 0.34, N = 163, (2) 0.55 ± 0.34, N = 169 | (1) Unclear, N = 126 [77.3%], (2) Unclear, N = 136 [80.5%] | (1) vs (2) P value = 0.01 [significant at 3 month FU only] |
| Stephens 1994, (1) RP, (2) SS | Days used in prior 30 days (mean ± SD) | (1) 27.04 ± 4.66, N = 106, (2) 26.36 ± 5.81, N = 106 | (1) 15.31 ± 12.49, N = 80 [75.5%], (2) 13.79 ± 11.9, N = 87 [82.1%] | (1) vs (2) P value > 0.05 |
| Stephens 2000, (1) MET, (2) CBT, (3) Assessed control | Days used in prior 90 days divided by 3 (mean ± SD) | (1) 24.24 ± 6.29, N = 88, (2) 25.38 ± 6.15, N = 117. (3) 24.85 ± 6.13, N = 86 | (1) 12.99 ± 11.61, N = 80 [90.9%], (2) 12.29 ± 12.34, N = 103 [88.0%], (3) 17.09 ± 10.73, N = 79 [91.9%] | (1) vs (2) P value < 0.02 [significant at EoT only, assessed during treatment for (2)]; (1) vs (3) P value < 0.001; (2) vs (3) P value < 0.001 [significant at EoT only] |
| Stephens 2007, (1) MET, (2) Drug‐related health education, (3) DTC | Days used in prior 90 days converted to average days per week (mean ± SE) | (1) 5.76 ± 0.15, N = 62. (2) 5.79 ± 0.15, N = 62, (3) 6.06 ± 0.15, N = 64 | (1) 4.65 ± 0.28, N = 49 [79.0%], (2) 5.58 ± 0.28, N = 52 [83.9%], (3) 5.75 ± 0.24, N = 62 [96.9%] | (1) vs (2) P value <0.05 [Cohen d = 0.45]; (1) vs (3) P value < 0.05 [significant at 1.75 month FU, Cohen d = 0.47]; (2) vs (3) P value > 0.05 |
* Unless otherwise indicated by *, significant treatment outcomes favour the group with the lower number; exact P values are reported when provided
CBT: Cognitive‐behavioural therapy
CM‐abs: Contingency management with vouchers presented for negative urine
CM‐adh: Contingency management with vouchers presented for treatment attendance/adherence
DC: Drug counselling
DTC: Delayed treatment control
EoT: End of treatment
FU: Follow‐up
MET: Motivational enhancement therapy
MM: Mindfulness‐based meditation
RP: Relapse prevention
SD: Standard deviation
SE: Standard error SS: Social support
TAU: Treatment as usual
As such, the intervention with the best evidence for reducing frequency of cannabis use is likely to be a MET + CBT combination enhanced by abstinence‐based CM when available. In the absence of CM, MET + CBT is likely to remain effective, although improvements may not be as immediately noticeable. Although the optimum number of sessions is not clear, evidence suggests that more intensive interventions of longer than four sessions are likely to be superior to less intensive interventions, at least in the short term. Notably, the quality of evidence for reductions in frequency of cannabis use over the short term was considered moderate according to the GRADE (Grades of Recommendation, Assessment, Development and Evaluation Working Group) assessment of quality, that is, three studies were at high risk of bias, data conversions were required to standardise the period of frequency assessed across studies and follow‐up assessment periods varied between studies.
Point‐prevalence and continuous abstinence
Across the included trials, rates of abstinence following cannabis treatment were measured as the proportion of participants reporting abstinence for the month before assessment (referred to as point‐prevalence abstinence, or PPA) and/or the proportion reporting continuous abstinence from treatment to final follow‐up assessment. Across the eight studies reporting rates of PPA, an average of 37% intervention participants achieved PPA at end of treatment, and this decreased to 24% at three to four months from baseline and to 23% at follow‐up of longer than four months. In contrast, an average of 12% of those in control conditions reported PPA at final follow‐up.
Point‐prevalence abstinence rates
Intervention versus inactive control
Any intervention
Those receiving any intervention were 1.96 times more likely to achieve point‐prevalence abstinence at short‐term follow‐up compared with those given inactive control (risk ratio (RR) 2.55, 95% CI 1.34 to 4.83, six studies, 1166 participants; Analysis 1.4). The included period of follow‐up with the most consistently available data across studies ranged between two months and 237 days. The quality of evidence for this outcome was considered to be low (Table 1).
1.4. Analysis.
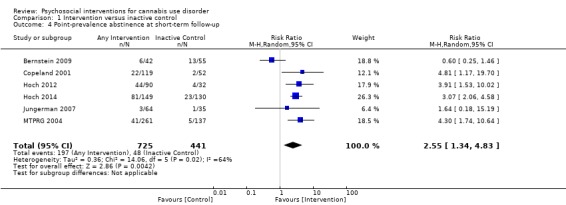
Comparison 1 Intervention versus inactive control, Outcome 4 Point‐prevalence abstinence at short‐term follow‐up.
Subgroup analysis for intensity of the intervention
Those receiving a high‐intensity intervention showed the greatest chance of achieving a difference compared with those given inactive control (RR 3.09, 95% CI 2.23 to 4.29, five studies, 731 participants; Analysis 1.5). In contrast, those receiving an intervention of low intensity were not significantly more likely to report achieving point‐prevalence abstinence compared with those given control (RR 0.92, 95% CI 0.51 to 1.66, four studies, 435 participants; Analysis 1.5).
1.5. Analysis.
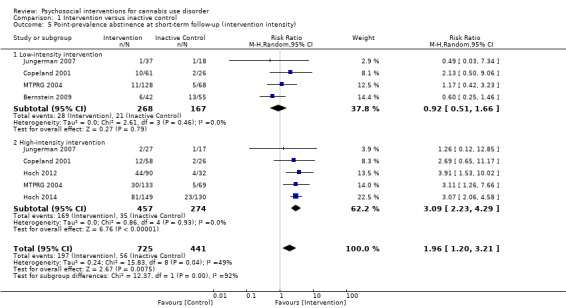
Comparison 1 Intervention versus inactive control, Outcome 5 Point‐prevalence abstinence at short‐term follow‐up (intervention intensity).
Subgroup analysis for type of intervention
Compared with inactive control, those receiving CBT showed the greatest chance of achieving a difference (RR 4.81, 95% CI 1.17 to 19.70, one study, 171 participants; Analysis 1.6), followed by those receiving MET + CBT (RR 2.17, 95% CI 1.10 to 4.32, five studies, 798 participants; Analysis 1.6) and those given MET (RR 1.19, 95% CI 0.43 to 3.28, one study, 197 participants; Analysis 1.6).
1.6. Analysis.
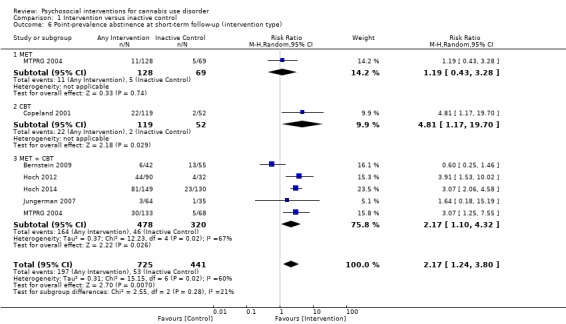
Comparison 1 Intervention versus inactive control, Outcome 6 Point‐prevalence abstinence at short‐term follow‐up (intervention type).
Intervention versus treatment as usual
Only one study provided information on PPA among those receiving intervention or treatment as usual. This study found no significant differences in effects of treatment between a 10‐session DC intervention and control at end of treatment or at six‐month follow‐up (Edwards 2006).
Intervention versus intervention
MET + CBT intervention versus alternative treatment
Two studies found that those receiving MET + CBT were 3.59 times more likely to report PPA compared with those given MET at short‐term follow‐up (RR 3.59, 95% CI 1.80 to 7.20, two studies, 302 participants; Analysis 3.2). In contrast, no between‐group differences were noted among those receiving MET + CBT and those given alternative treatments, including MET + CBT + CM‐abs + CM‐adh, DC or DC + CM‐abs + CM‐adh over six months (Carroll 2006). Further, no significant effect of intervention intensity was reported in a single study comparing low‐intensity versus high‐intensity MET + CBT at four‐month follow‐up (Jungerman 2007).
3.2. Analysis.
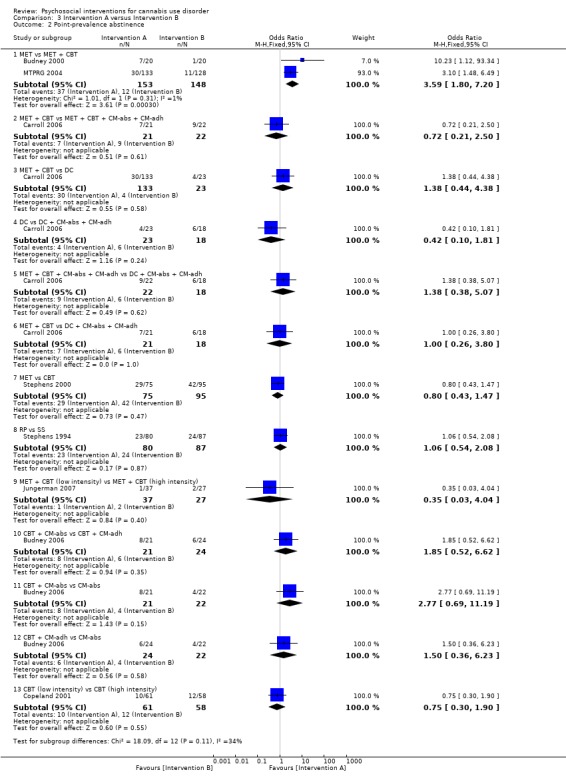
Comparison 3 Intervention A versus Intervention B, Outcome 2 Point‐prevalence abstinence.
CBT versus alternative treatment
An initial study found no between‐group differences in PPA among those receiving CBT or MET treatment (Stephens 2000). Further, no significant effect of intervention intensity was reported in a single study comparing low‐intensity versus high‐intensity CBT at eight‐month (242 days on average) follow‐up (Copeland 2001).
RP versus SS
A single study reported no between‐group differences in PPA among those receiving RP or SS at one month (Roffman 1988).
CBT + CM‐abs versus CBT + CM‐abs versus CM‐abs
One study found no significant between‐group differences in PPA among those receiving CBT + CM‐adh, CBT + CM‐abs or CM‐abs alone across 12 months (Budney 2006).
Continuous abstinence rates
Intervention versus inactive control
Two studies compared continuous abstinence rates among participants receiving intervention and inactive control conditions. The first study reported a significant effect of treatment for those receiving a six‐session CBT intervention (15.1% were abstinent across nine months) or a one‐session CBT intervention (4.9% abstinent), with no inactive control participants achieving continuous abstinence across approximately eight months (Copeland 2001). The second study reported a single MM intervention participant achieving continuous abstinence (2.9%) compared with no inactive control participants achieving continuous abstinence across six months (de Dios 2012).
Intervention versus treatment as usual
No included study compared continuous abstinence rates among those receiving intervention or treatment as usual.
Intervention versus intervention
CBT versus alternative intervention
A total of three studies compared CBT interventions versus alternative interventions. The first study compared a 14‐session CBT versus a two‐session MET intervention in which 22% of both groups reported abstinence across 16 months, with no between‐group differences (Stephens 2000). The second compared two CBT interventions of differing intensity and reported no significant between‐group differences in abstinence over eight months (242 days on average) (15.1% of those attending a six‐session CBT intervention vs 4.9% given one‐session CBT) (Copeland 2001).The final study reported no significant between‐group differences in the proportion reporting positive urine screens across 12 months among those receiving 12‐session CBT (73.1%) or 12‐session CBT + CM‐adh (75.6%) or 12‐session CBT + CM‐abs (75.5%) or 12‐session CM‐abs alone (57.1%) (Carroll 2012).
MET + CBT versus alternative intervention
A total of five studies compared the proportions of participants reporting continuous abstinence from MET + CBT interventions versus those reporting continuous abstinence from alternative interventions; two additional studies reported abstinence rates with no comparator groups. First, no between‐group differences were noted among participants in a four‐session MET + CBT intervention when delivered over one month or over three months, with 90% and 81.8% positive urine over four months (Jungerman 2007). Second, 18% of participants attending nine‐session MET + CBT interventions with and without CM‐abs, and CM‐abs alone, reported abstinence over 12 months with no between‐group differences (Kadden 2007). Third, 43% of participants in a 14‐session MET + CBT + CM‐abs, 31% for a 14‐session MET + CBT and 19% for four‐session MET reported continuous abstinence during treatment (confirmed via urinalysis) with no significant between‐group differences (Budney 2000). Fourth, 43% of participants from a similar 14‐session CBT + CM‐abs intervention, 32% for 14‐session CBT + CM‐adh and 55% for CM‐abs alone had no recorded positive urine screens across six or more weeks, again with no significant differences between groups (Budney 2006). Further, no between‐group differences were noted in a comparison of continuous abstinence rates reported by participants receiving eight sessions of MET + CBT + CM‐abs + CM‐adh, DC + CM‐abs + CM‐adh, MET + CBT and DC alone across six months (50%, 70%, 70%, 70%, respectively) (Carroll 2006). An additional two trials of a 10‐session MET + CBT intervention reported that 41.1% and 34.9% were abstinent across six months, although these trials did not include comparison groups throughout this period (Hoch 2012; Hoch 2014).
Point‐prevalence and continuous abstinence: summary
Very few between‐group differences were noted among comparisons of abstinence rates. Although consistent evidence suggested that any intervention was superior to inactive control, we found little evidence supporting a particular intervention over another. That said, the intervention with the best evidence for promoting abstinence from cannabis use is likely to be CBT or a MET + CBT combination intervention. Little consistent evidence indicated that intervention intensity with CM adjuncts would improve treatment outcomes in this regard. Notably, according to three studies reporting information regarding duration of abstinence achieved by participants, an average of one month was attained before initial relapse (Budney 2000; Carroll 2006; Carroll 2012). The quality of evidence for PPA over the short term was considered to be low according to the GRADE assessment of quality, that is, one study was at high risk of bias (Bernstein 2009) and heterogeneity in methods of assessment and period of abstinence assessed was notable across studies.
Quantity of cannabis used (joints per day)
Intervention versus inactive control
Any intervention
Those receiving any intervention reported fewer joints per day of use at follow‐up compared with those receiving inactive control (standardised mean difference (SMD) 3.55, 95% CI 2.51 to 4.59, eight studies, 1600 participants; Analysis 1.7). The included period of follow‐up with the most consistently available data across studies ranged between seven weeks and approximately eight months. Analysis included MET, CBT and MET + CBT interventions. The quality of evidence for this outcome was considered to be very low (Table 1).
1.7. Analysis.
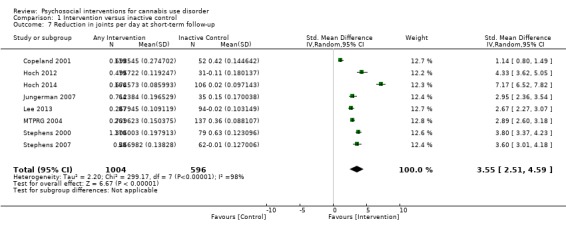
Comparison 1 Intervention versus inactive control, Outcome 7 Reduction in joints per day at short‐term follow‐up.
Subgroup analysis for intensity of the intervention
Those receiving a high‐intensity intervention (more than four sessions or duration longer than one month) showed the greatest difference compared with those given inactive control (SMD 4.74, 95% CI 3.49 to 6.00, six studies, 848 participants; Analysis 1.8), and those receiving an intervention of low intensity (four or fewer sessions or duration less than one month) also used fewer joints per day of use (SMD 2.70, 95% CI 1.69 to 3.70, six studies, 752 participants; Analysis 1.8).
1.8. Analysis.
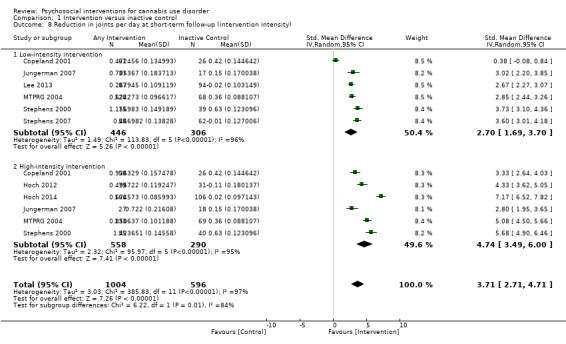
Comparison 1 Intervention versus inactive control, Outcome 8 Reduction in joints per day at short‐term follow‐up (intervention intensity).
Subgroup analysis for type of intervention
Compared with those given inactive control, those receiving MET + CBT used the fewest joints per day of use (SMD 4.91, 95% CI 3.29 to 6.54, four studies, 683 participants; Analysis 1.9), followed by those receiving CBT (SMD 4.60, 95% CI 2.21 to 7.00, two studies, 306 participants; Analysis 1.9) and MET (SMD 3.14, 95% CI 2.66 to 3.61, four studies, 611 participants; Analysis 1.9). Across these studies, no between‐group differences were noted by any study beyond nine‐month follow‐up.
1.9. Analysis.
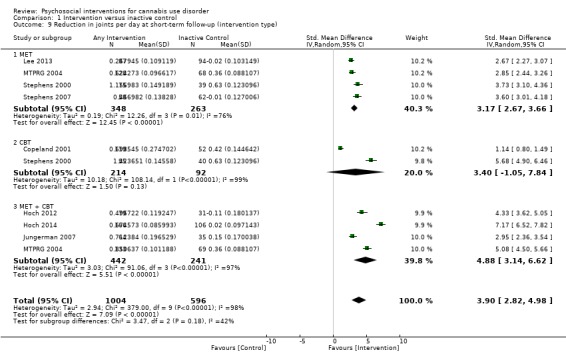
Comparison 1 Intervention versus inactive control, Outcome 9 Reduction in joints per day at short‐term follow‐up (intervention type).
Intervention versus treatment as usual
A single study included a comparison of active intervention versus treatment as usual among patients in a psychiatric clinic (Bonsack 2011). This study found that MET (delivered as needed, with an average of six sessions received) was superior to treatment as usual across six months (study authors' reported Cohen’s d = 0.65, no data provided), although no significant difference was found at 12‐month follow‐up.
Intervention versus intervention
Studies not included in meta‐analysis
One study assessing single‐session DC interventions delivered in person or by workbook with non‐drug health education controls also delivered in person or by workbook included an assessment of the quantity of cannabis smoked per day of use (Fischer 2012). An additional study of MET + CBT versus CM‐abs alone versus MET + CBT + CM‐abs (all nine sessions; Kadden 2007) reported no between‐group differences over 12 months (no data provided).
MET versus alternative intervention
A total of three studies compared MET versus alternative interventions. MET was found to be superior only to DC up to 12 months (SMD 1.81, 95% CI 1.35 to 2.28, one study, 101 participants; Analysis 3.3) (Stephens 2007). In contrast, no significant between‐group differences were found between MET (two sessions, delivered to individuals) and CBT (14 sessions, delivered in groups of eight to 12) up to twelve‐month follow‐up (SMD ‐1.63, 95% CI ‐1.97 to ‐1.29, one study, 183 participants; Analysis 3.3) (Stephens 2000). Further, a four‐session MET was comparable with a two‐session MET and was inferior to a nine‐session MET + CBT intervention across nine‐month follow‐up (SMD 0.22, 95% CI ‐0.02 to 0.46, one study, 266 participants; Analysis 3.3); although this study was at high risk of detection bias (MTPRG 2004).
3.3. Analysis.
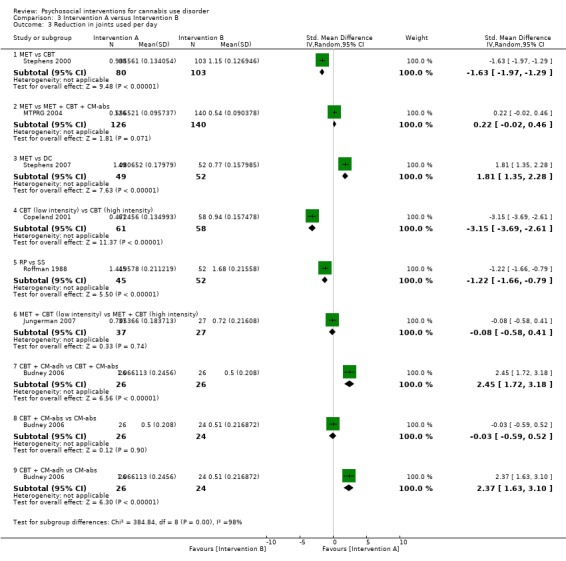
Comparison 3 Intervention A versus Intervention B, Outcome 3 Reduction in joints used per day.
CBT (low intensity) versus CBT (high intensity)
One study assessed the impact of CBT intervention intensity on outcomes of cannabis quantity used. In this study, low‐intensity CBT (single session) was found to be inferior to a high‐intensity six‐session counterpart (SMD ‐3.15, 95% CI ‐3.69 to ‐2.61, one study, 119 participants; Analysis 3.3), although the study authors reported no significant differences with control for baseline consumption (Copeland 2001).
MET + CBT (low intensity) versus MET + CBT (high intensity)
One study assessed the impact of MET + CBT intervention intensity on outcomes of cannabis quantity used. In this study, a low‐intensity four‐session MET + CBT (delivered over one month) was found to be comparable with a high‐intensity four‐session counterpart at four‐month follow‐up (delivered over three months; SMD ‐0.08, 95% CI ‐0.58 to 0.41, one study, 64 participants; Analysis 3.3) (Jungerman 2007).
RP versus SS
A single study compared the quantity of cannabis use as reported by participants receiving a 10‐session RP or SS intervention with no between‐group differences reported over one month (SMD ‐1.22, 95% CI ‐1.66 to ‐0.79, one study, 97 participants; Analysis 3.3).
CBT + CM‐adh versus CBT + CM‐abs versus CM‐abs
A single study compared the quantity of cannabis used as reported by participants receiving a 14‐session CBT + CM‐adh or CBT + CM‐abs intervention or CM‐abs alone (Budney 2006). Although this study was at high risk of detection bias, the CBT + CM‐abs condition was reportedly superior to the CM‐abs condition during treatment only with no between‐group differences across 12‐month follow‐up. In contrast, our analyses of the data related to quantity of cannabis used during treatment found CBT + CM‐adh to be superior to both CM‐abs (SMD 2.37, 95% CI 1.63 to 3.10, one study, 50 participants; Analysis 3.3) and CBT + CM‐abs (SMD 2.45, 95% CI 1.72 to 3.18, one study, 52 participants; Analysis 3.3). Follow‐up data related to post‐treatment outcomes were not provided.
Summary of quantity of cannabis used
Evidence for effect of an intervention on quantity of cannabis used was somewhat limited by few studies investigating this outcome (13 studies) and by lack of consistency in outcome reporting. In summary, although intervention effect over inactive control was common in the short term, no particular intervention was superior post six‐month follow‐up. Notably, little evidence suggests the superiority of a particular intervention type over another. The quality of evidence on reductions in quantity of cannabis used over the short term was considered very low according to the GRADE assessment of quality, that is, one study was at high risk of bias, data conversions were required to obtain a standardised period of assessment, we noted heterogeneity in assessment measures (including 'joints', 'units' and 'hours') and the period of follow‐up varied across studies. We provide in Table 4 a further summary of units of measurement and all included study findings regarding the impact of intervention and control on joints used per day of use from baseline to follow‐up.
3. Summary of treatment outcomes: cannabis use quantity.
| Study and group | Measure | Baseline |
Follow‐up [% with data] |
Significance* |
| Bonsack 2011, (1) MET, (2) TAU | Joints per week (median ± range at baseline, median reduction at follow‐up) | (1) 22.5 ± 89, N = 30, (2) 19.0 ± 95, N = 32 | (1) 10.0, N = 25 [83.3%], (2) 3.5, N = 29 [90.6%] | (1) vs (2) P value > 0.05 [significant at 3 and 6 months only, d = 0.65] |
| Budney 2006, (1) CBT + CM‐abs, (2) CBT + CM‐adh, (3) CM‐abs | Joints per day (mean ± SD) | (1) 4.2 ± 3.0, N = 30, (2) 3.7 ± 2.2, N = 30, (3) 3.8 ± 2.2, N = 30 | (1) Unclear, N = 21 [70.0%], (2) Unclear, N = 24 [80.0%], (3) Unclear, N = 22 [73.3%] | (1) vs (2) P value > 0.05; (1) vs (3) P value > 0.05; (2) vs (3) P value > 0.05 |
| Copeland 2001, (1) CBT [6‐session], (2) CBT [1‐session], (3) DTC | “daily amount used in the last month” (mean ± SD) | (1) 2.1 ± 0.8, N = 78, (2) 2.0 ± 0.8, N = 82, (3) 2.2 ± 0.9, N = 69 | (1) 1.3 ± 0.9, N = 58 [74.4%], (2) 1.5 ± 1.2, N = 61 [74.4%], (3) 1.8 ± 1.0, N = 52 [75.4%] | (1) vs (2) P value > 0.05; (1) vs (3) P value = 0.02; (2) vs (3) P value > 0.05 |
| Fischer 2012, (1) DC [oral], (2) DC [workbook], (3) Health promotion [oral], (4) Health promotion [workbook] | Number of cannabis use episodes per day (mean ± range; reported only as combined group scores) | (1) + (2) 2.3 ± 1.2, N = 71, (3) + (4) 2.0 ± 0.6, N = 62 | (1) + (2) 2.6 ± 2.1, N = unclear, (3) + (4) 2.2 ± 0.9 | (1) vs (2) P value > 0.05; (1) vs (3) P value > 0.05; (1) vs (4) P value > 0.05; (2) vs (3) P value > 0.05; (3) vs (4) P value > 0.05; (2) vs (4) P value > 0.05 |
| Hoch 2012, (1) MET + CBT, (2) DTC | Units in previous 7 days (mean ± SD) | (1) 25.2 ± 39.7, N = 90, (2) 21.3 ± 32.7, N = 32 | (1) 8.1 ± 18.1, N = 79 [87.8%], (2) 24.9 ± 33.4, N = 31 [96.9%] | (1) vs (2) P value < 0.05 |
| Hoch 2014, (1) MET + CBT, (2) DTC | Units in previous 7 days (mean ± SD) | (1) 20.8 ± 26.7, N = 90, (2) 21.3 ± 28.3, N = 32 | (1) 5.2 ± 13.0, N = 79 [87.8%], (2) 20.6 ± 30.0, N = 31 [96.9%] | (1) vs (2) P value < 0.001 [d = ‐0.9] |
| Jungerman 2007, (1) MET + CBT [3 months], (2) MET + CBT [1 month], (3) DTC | Joints per day (mean ± SE) | (1) 2.08 ± 0.29, N = 52, (2) 2.06 ± 0.28, N = 56, (3) 1.84 ± 0.29, N = 52 | (1) 0.77 ± 0.18, N = 27 [51.9%], (2) 0.78 ± 0.17, N = 37 [66.1%], (3) 1.56 ± 0.18, N = 35 [67.3%] | (1) vs (2) P value > 0.05; (1) vs (3) P value = 0.006; (2) vs (3) P value = 0.006 |
| Kadden 2007, (1) MET + CBT + CM‐abs, (2) MET + CBT, (3) CM‐abs, (4) Health education | Joints per day (mean ± SE) | (1) 4.76 ± 3.98, N = 63, (2) 4.67 ± 6.27, N = 61, (3) 3.24 ± 2.65, N = 54, (4) 5.20 ± 5.70, N = 62 | (1) Unclear, N = 51 [81.0%], (2) Unclear, N = 49 [80.3%], (3) Unclear, N = 48 [88.9%], (4) Unclear, N = 52 [83.9%] | (1) vs (2) P value > 0.05; (1) vs (3) P value > 0.05; (1) vs (4) P value > 0.05; (2) vs (3) P value > 0.05; (3) vs (4) P value > 0.05; (2) vs (4) P value > 0.05 |
| Lee 2013, (1) MET, (2) Assessed control | Joints per week (mean ± SD) | (1) 9.35 ± 9.8, N = 106, (2) 8.29 ± 9.5, N = 106 | (1) 7.26 ± 8.4, N = 89 [84.0%], (2) 7.47 ± 10.7, N = 86 [81.1%] | (1) vs (2) P value > 0.05 [P value < 0.05 at 3 month FU only] |
| MTPRG 2004, (1) MET + CBT, (2) MET, (3) Assessed control | Joints per day (mean ± SD) | (1) 2.79 ± 2.35, N = 156, (2) 3.02 ± 2.80, N = 146, (3) 2.77 ± 2.19, N = 148 | (1) Unclear, N = 129 [82.7%], (2) Unclear, N = 120 [82.2%], (3) 2.03 ± 1.94, N = 137 [92.6%] | (1) vs (2) P value > 0.05; (1) vs (3) P value < 0.05 [d = 0.43]; (2) vs (3) P value < 0.05 [d = 0.29] |
| Roffman 1988, (1) RP, (2) SS | Joints per day (mean ± SD) | (1) 2.58 ± 0.94, N = 54, (2) 2.85 ± 0.83, N = 56 | (1) 1.11 ± 1.11, N = 45 [83.3%], (2) 1.29 ± 1.00, N = 52 [92.9%] | (1) vs (2) P value > 0.05 |
| Stephens 2000, (1) MET, (2) CBT, (3) Assessed control | Scale of quantity where 1 = once, 2 = 2‐3 times, 3 = 4‐5 times and 4 = 6+ times per day (mean ± SD) | (1) 2.41 ± 0.85, N = 88, (2) 2.59 ± 0.89, N = 117, (3) 2.61 ± 0.93, N = 86 | (1) 1.41 ± 1.20, N = 80 [90.9%], (2) 1.39 ± 1.15, N = 103 [88.0%], (3) 1.97 ± 1.09, N = 79 [91.9%] | (1) vs (2) P value > 0.05; (1) vs (3) P value < 0.001; (2) vs (3) P value < 0.001 [significant at EoT only] |
| Stephens 2007, (1) MET, (2) Drug‐related health education, (3) DTC | Number of 6‐hour periods per day that were smoked (mean ± SE) | (1) 2.07 ± 0.10, N = 62, (2) 2.00 ± 0.10, N = 62, (3) 2.19 ± 0.09, N = 64 | (1) 4.65 ± 0.28, N = 49 [79.0%], (2) 5.58 ± 0.28, N = 52 [83.9%], (3) 5.75 ± 0.24, N = 62 [96.9%] | (1) vs (2) P value < 0.05 [significant at 1.75 month FU only, d = 0.42]; (1) vs (3) P value < 0.05 [significant at 1.75 month FU only, d = 0.69]; (2) vs (3) P value > 0.05 |
* Unless otherwise indicated by *, significant treatment outcomes favour the group with the lower number; exact P values are reported when provided
CBT: Cognitive‐behavioural therapy
CM‐abs: Contingency management with vouchers presented for negative urine
CM‐adh: Contingency management with vouchers presented for treatment attendance/adherence
DC: Drug counselling
EoT: End of treatment
FU: Follow‐up
MET: Motivational enhancement therapy
RP: Relapse prevention
SD: Standard deviation
SE: Standard error
SS: Social support
TAU: Treatment as usual
Severity of cannabis use disorder
Intervention versus inactive control
Any intervention
Those receiving any intervention reported fewer symptoms of dependence at follow‐up compared with those receiving inactive control (SMD 4.15, 95% CI 1.67 to 6.63, four studies, 889 participants; Analysis 1.10). The included period of follow‐up with the most consistently available data across studies ranged between eight weeks and four months. This analysis included MET and MET + CBT interventions. The quality of evidence for this outcome was considered to be low (Table 1).
1.10. Analysis.
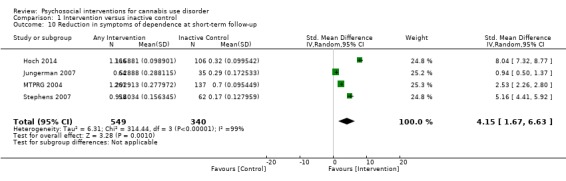
Comparison 1 Intervention versus inactive control, Outcome 10 Reduction in symptoms of dependence at short‐term follow‐up.
Subgroup analysis for intensity of the intervention
Those receiving a high‐intensity intervention (more than four sessions or duration longer than one month) reported the greatest difference compared with those given inactive control (SMD 8.37, 95% CI 2.51 to 14.23, three studies, 519 participants; Analysis 1.11), and those receiving an intervention of low intensity (four or fewer sessions or duration less than one month) also reported fewer symptoms of dependence compared with those given inactive control (SMD 2.83, 95% CI 0.41 to 5.24, three studies, 370 participants; Analysis 1.11).
1.11. Analysis.
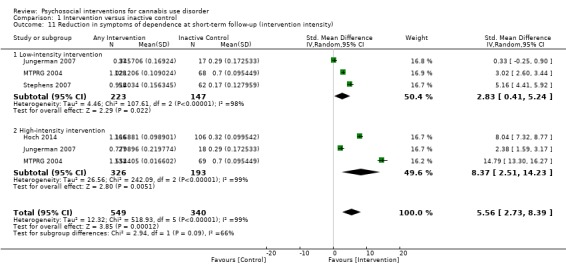
Comparison 1 Intervention versus inactive control, Outcome 11 Reduction in symptoms of dependence at short‐term follow‐up (intervention intensity).
Subgroup analysis for type of intervention
Compared with those given inactive control, those receiving MET + CBT reported the fewest symptoms of dependence (SMD 7.89, 95% CI 0.93 to 14.85, three studies, 573 participants; Analysis 1.12), followed by those receiving MET (SMD 4.07, 95% CI 1.97 to 6.17, two studies, 316 participants; Analysis 1.12).
1.12. Analysis.
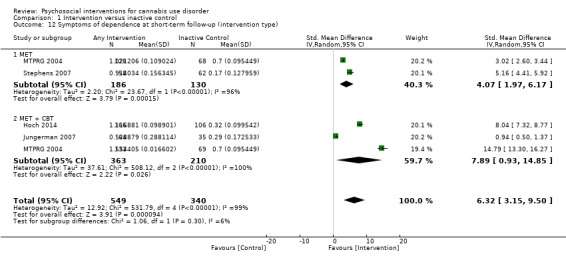
Comparison 1 Intervention versus inactive control, Outcome 12 Symptoms of dependence at short‐term follow‐up (intervention type).
Studies not included in the meta‐analysis
Studies not included in this meta‐analysis also reported a significant intervention effect on symptoms of dependence. These trials included a 10‐session MET + CBT at end of treatment described in two separate studies (Hoch 2012); a single‐session and six‐session CBT at eight‐month (242 days on average) follow‐up (Copeland 2001); and a 14‐session CBT at end of treatment and a two‐session MET at three months from end of treatment (Stephens 2000).
Intervention versus treatment as usual
A single study included a comparison of active intervention (10‐session DC) versus treatment as usual among patients in psychiatric clinics and found no significant differences between groups at six‐month follow‐up, as measured by the Cannabis and Substance Use Assessment Schedule (MD 0.10, 95% CI ‐0.82 to 1.02, one study, 33 participants; Analysis 2.2) (Edwards 2006).
2.2. Analysis.
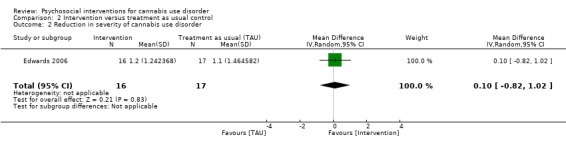
Comparison 2 Intervention versus treatment as usual control, Outcome 2 Reduction in severity of cannabis use disorder.
Intervention versus intervention
MET versus alternative treatment
One study compared a single‐session MET intervention versus single‐session DC (Stephens 2007). In this study, MET was superior across 12 months (SMD 4.32, 95% CI 3.60 to 5.04, one study, 101 participants; Analysis 3.4) (Stephens 2007). In addition, a two‐session MET intervention was found to be comparable with a more intensive 14‐session CBT across 16‐month follow‐up (SMD 0.06, 95% CI ‐0.23 to 0.36, one study, 183 participants; Analysis 3.4) (Stephens 2000). Moreover, no between‐group differences were noted among participants receiving a four‐session MET intervention or a 14‐session MET + CBT intervention at 14 weeks (Budney 2000) (data not provided). In contrast, a two‐session MET intervention was inferior to nine‐session MET + CBT at nine months (SMD ‐1.78, 95% CI ‐2.07 to ‐1.50, one study, 266 participants; Analysis 3.4); although this study was at high risk of detection bias (MTPRG 2004).
3.4. Analysis.
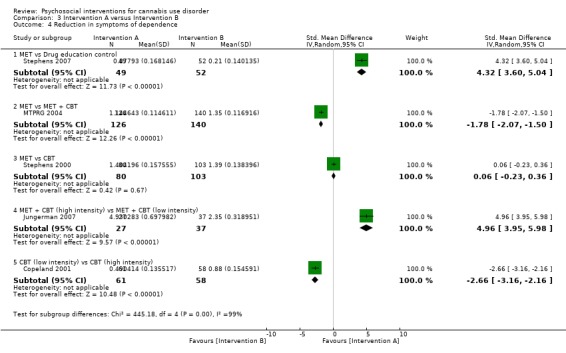
Comparison 3 Intervention A versus Intervention B, Outcome 4 Reduction in symptoms of dependence.
MET + CBT intervention versus alternative treatment
A single study assessed the impact of MET + CBT intervention intensity in relation to treatment outcomes of severity of cannabis dependence. At four‐month follow‐up, a four‐session MET + CBT delivered over three months was superior to the same intervention delivered over one month (SMD 4.96, 95% CI 3.95 to 5.98, one study, 64 participants; Analysis 3.4) (Jungerman 2007).
CBT (low intensity) versus CBT (high intensity)
Similarly, a single‐session CBT intervention was found to be inferior to a more intensive six‐session CBT counterpart at nine months (SMD ‐2.66, 95% CI ‐3.16 to ‐2.16, one study, 119 participants; Analysis 3.4) (Copeland 2001).
CM adjuncts and CM alone versus alternative treatment
A 14‐session MET + CBT + CM‐abs was superior to a 14‐session MET + CBT and a four‐session MET at 14 weeks with regards to the proportion of participants in remission for cannabis dependence, defined as having no DSM–IV dependence symptoms for one or more months (data not provided, reported effect size f = 0.23) (Budney 2000). Notably, a later study compared the same 14‐session MET + CBT + CM‐abs intervention versus a 14‐session CBT + CM‐adh intervention or CM‐abs alone by using the same measure (Budney 2006). Although this study was at high risk of detection bias, no between‐group differences (P value = 0.09) or time effects (P value = 0.16) were noted across 12 months (data not provided). In addition, a single study compared the impact of using CM‐abs and CM‐adh adjuncts together with nine‐session MET + CBT and DC treatments (Carroll 2006). This study reported no between‐group differences among the four treatments (MET + CBT + CM‐abs + CM‐adh, DC + CM‐abs + CM‐adh, MET + CBT and DC), although study authors reported a significant effect when groups were combined, indicating that treatments were superior when combined with CM‐abs and CM‐adh adjuncts (z = –2.23, P value = 0.03, data not provided). A final study assessed MET + CBT versus MET + CBT + CM‐abs versus CM‐abs alone and a non‐drug health promotion control (all nine sessions) (Kadden 2007). In contrast to the other noted studies, no significant between‐group differences were reported across 12 months.
Summary of cannabis dependence severity
Evidence for an intervention effect on cannabis use disorder severity was limited by few studies investigating this outcome (13 studies). In summary, evidence suggests that an intervention including either or both of MET or CBT would likely show effectiveness in reducing the severity of cannabis dependence compared with minimal treatment controls. Those trials that included comparisons between two active interventions most often included MET + CBT treatments and found that better treatment outcomes were associated with the more intensive format and the somewhat consistent finding that including CM would improve outcomes further. The quality of the evidence for reductions in severity of dependence over the short term was considered low according to the GRADE assessment of quality, that is, the number of included studies was limited, one study had high risk of bias and heterogeneity in assessment measures (including numbers of symptoms and scales of symptom severity) was evident.
We have provided in Table 5 a further summary of units of measurement and all included study findings regarding the impact of intervention and control on symptoms of dependence from baseline to follow‐up.
4. Summary of treatment outcomes: dependence severity.
| Study and group | Measure | Baseline |
Follow‐up [% with data] |
Significance* |
| Budney 2000, (1) MET + CBT + CM‐abs, (2) MET + CBT, (3) MI | Addiction Severity Index composite scores (lowest score mean ± SD – highest score mean ± SD) | (1) 0.09 ± 0.01 ‐ 0.33 ± .03, N = 20, (2) 0.08 ± 0.05 ‐ 0.39 ± .02, N = 20, (3) 0.07 ± 0.01 & 0.42 ± .02, N = 20 | (1) 0.01 ± 0.02 ‐ 0.32 ± .04, N = 14 [70.0%], (2) 0.05 ± 0.04 ‐ 0.32 ± .03, N = 15 [75.0%], (3) 0.01 ± 0.05 ‐ 0.32 ± .04, N = 16 [80.0%] | (1) vs (2) and (1) vs (3) data provided in aggregate: P value < 0.05 for the ‘medical’ [f = 0.16] and for the ‘drug’ [f = 0.23] composite scores; (2) vs (3) P value > 0.05 |
| Budney 2006, (1) CBT + CM‐abs, (2) CBT + CM‐adh, (3) CM‐abs | Proportion with no symptoms of dependence in prior ‘month’ (%), Addiction Severity Index composite scores (data not shown) | (1) Unclear, Unclear, N = 30, (2) Unclear, Unclear, N = 30, (3) Unclear, Unclear, N = 30 | (1) 37, Unclear, N = 21 [70.0%], (2) 30, Unclear, N = 24 [80.0%], (3) 27, Unclear, N = 22 [73.3%] | (1) vs (2) P value > 0.05, P value > 0.05; (1) vs (3) P value = 0.05 at 3 month FU only, P value > 0.05; (2) vs (3) P value > 0.05, P value > 0.05 |
| Carroll 2006, (1) MET + CBT + CM‐abs + CM‐adh, (2) DC + CM‐abs, + CM‐adh, (3) MET + CBT, (4) DC | Addiction Severity Index composite scores (data not shown) | (1) Unclear, N = 33, (2) Unclear, N = 34, (3) Unclear, N = 36, (4) Unclear, N = 33 | (1) Unclear, N = 27 [81.8%], (2) Unclear, N = 24 [70.6%], (3) Unclear, N = 27 [75.0%], (4) Unclear, N = 30 [90.9%] | (1) vs (2) P value > 0.05; (1) vs (3) P value > 0.05; (1) vs (4) P value > 0.05; (2) vs (3) P value > 0.05; (3) vs (4) P value = 0.05 for the ‘legal’ composite score across FU; (2) vs (4) P value > 0.05 |
| Copeland 2001, (1) CBT [6‐session], (2) CBT [1‐session], (3) DTC | Severity of Dependence Scale score (mean ± SD) | (1) 9.2 ± 3.2, N = 78, (2) 9.8 ± 2.9, N = 82, (3) 9.3 ± 2.6, N = 69 | (1) 5.8 ± 4.3, N = 58 [74.4%], (2) 7.6 ± 4.4, N = 61 [74.4%], (3) 9.2 ± 3.2, N = 52 [75.4%] | (1) vs (2) P value = 0.04 [t = ‐2.1]; (1) vs (3) P value < 0.0001 [t = ‐4.7]; (2) vs (3) P value = 0.008 [t = ‐2.7] |
| Edwards 2006, (1) DC, (2) TAU | Cannabis and Substance Use Assessment Schedule (mean ± SD) | (1) 2.6 ± 0.9, N = 23, (2) 2.4 ± 1.2, N = 24 | (1) 1.4 ± 1.4, N = 16 [69.6%], (2) 1.3 ± 1.5, N = 17 [70.8%] | (1) vs (2) P value > 0.05 |
| Hoch 2012, (1) MET + CBT, (2) DTC | Addiction Severity Index composite scores (lowest score mean ± SD – highest score mean ± SD) | (1) 9.9 ± 1.4 – 10.1 ± 1.7, N = 90, (2) 9.7 ± 1.8 – 10.1 ± 2.1, N = 32 | (1) 3.0 ± 4.0 – 11.0 ± 9.7, N = 79 [87.8%], (2) 4.1 ± 10.7 – 13.7 ± 13.3, N = 31 [96.9%] | (1) vs (2) P value < 0.05 [for drug, legal, medical, employment and family composite scores] |
| Hoch 2014, (1) MET + CBT, (2) DTC | Severity of Dependence Scale score, number of symptoms of dependence (mean ± SD) | (1) 9.0 ± 3.4, 3.3 ± 1.6, N = 166, (2) 9.1 ± 3.5, 3.1 ± 1.6, N = 130 | (1) 4.7 ± 4.2, 0.9 ± 1.6, N = 166 [100%], (2) 7.0 ± 4.1, 2.4 ± 2.1, N = 106 [81.5%] | (1) vs (2) P value < 0.001 [d = ‐0.6], P value < 0.001 [d = ‐0.9] |
| Jungerman 2007, (1) MET + CBT [3 months], (2) MET + CBT [1 month], (3) DTC | Number of symptoms of dependence, overall Addiction Severity Index score (mean ± SE) | (1) 5.78 ± 0.31, 3.02 ± 0.21, N = 52, (2) 5.59 ± 0.30, 2.87 ± 0.20, N = 56, (3) 5.71 ± 0.31, 3.38 ± 0.21, N = 52 | (1) 4.20 ± 0.33, 2.10 ± 0.21, N = 27 [51.9%], (2) 4.86 ± 0.32, 2.77 ± 0.20, N = 37 [66.1%], (3) 5.10 ± 0.33, 2.81 ± 0.21, N = 35 [67.3%] | (1) vs (2) P value = 0.0349, P value = 0.0121; (1) vs (3) P value = 0.0349, P value > 0.05; (2) vs (3) P value > 0.05, P value > 0.05 |
| Kadden 2007, (1) MET + CBT + CM‐abs, (2) MET + CBT, (3) CM‐abs, (4) Health education | Addiction Severity Index composite scores (lowest score mean ± SD – highest score mean ± SD) | (1) 0.09 ± 0.09 – 0.25 ± 0.19, N = 63. (2) 0.12 ± 0.12 – 0.25 ± 0.07, N = 61, (3) 0.09 ± 0.10 – 0.26 ± 0.05, N = 54, (4) 0.11 ± 0.14 – 0.25 ± 0.21, N = 62 | (1) Unclear, N = 51 [81.0%], (2) Unclear, N = 49 [80.3%], (3) Unclear, N = 48 [88.9%], (4) Unclear, N = 52 [83.9%] | (1) vs (2) P value > 0.05; (1) vs (3) P value > 0.05; (1) vs (4) P value > 0.05; (2) vs (3) P value > 0.05; (3) vs (4) P value > 0.05; (2) vs (4) P value > 0.05 |
| MTPRG 2004, (1) MET + CBT, (2) MET, (3) Assessed control | Number of symptoms of dependence (mean ± SD), Addiction Severity Index composite scores (lowest score mean ± SD – highest score mean ± SD) | (1) 5.62 ± 1.17, 0.11 ± 0.13 – 0.26 ± 0.30, N = 156, (2) 5.70 ± 1.20, 0.12 ± 0.13 – 0.28 ± 0.31, N = 146, (3) 5.56 ± 1.33, 0.11 ± 0.12 – 0.16 ± 0.25, N = 148 | (1) 2.81 ± 2.40, 0.10 ± 0.11 – 0.25 ± 0.32, N = 129 [82.7%], (2) 3.63 ± 2.08, 0.13 ± 0.10 – 0.26 ± 0.32, N = 120 [82.2%], (3) 4.36 ± 1.92, 0.11 ± 0.12 – 0.20 ± 0.17, N = 137 [92.6%] | (1) vs (2) P value < 0.05 [at 9 month FU only, d = 0.31], P value > 0.05; (1) vs (3) P value > 0.05, P value < 0.05 [for ‘employment’ composite only]; (2) vs (3) P value > 0.05, P value < 0.05 [for ‘employment’ composite only] |
| Stephens 2000, (1) MET, (2) CBT, (3) Assessed control | Number of symptoms of dependence (mean ± SD) | (1) Unclear, N = 88, (2) Unclear, N = 117, (3) Unclear, N = 86 [6.74 ± 1.97 for total sample with no significant group differences] | (1) 2.75 ± 3.18, N = 80 [90.9%], (2) 2.83 ± 3.27, N = 103 [88.0%], (3) 4.63 ± 2.59, N = 79 [91.9%] | (1) vs (2) P value > 0.05; (1) vs (3) P value < 0.001; (2) vs (3) P value < 0.001 [significant at EoT only] |
| Stephens 2007, (1) MET, (2) Drug‐related health education, (3) DTC | Number of symptoms of dependence (mean ± SD) | (1) 3.92 ± 1.78, N = 62, (2) 3.26 ± 1.93, N = 62, (3) 3.17 ± 1.93, N = 64 | (1) 2.43 ± .018, N = 49 [79.0%], (2) 2.88 ± 0.18, N = 52 [83.9%], (3) 2.85 ± 0.20, N = 62 [96.9%] | (1) vs (2) P value < 0.05 [d = 0.48, 0.45 and 0.37 across FU]; (1) vs (3) P value < 0.05 [significant at 1.75 month FU, d = 0.58]; (2) vs (3) P value > 0.05 |
* Unless otherwise indicated by *, significant treatment outcomes favour the group with the lower number; exact P values are reported when provided.
CBT: Cognitive‐behavioural therapy
CM‐abs: Contingency management with vouchers presented for negative urine
CM‐adh: Contingency management with vouchers presented for treatment attendance/adherence
DC: Drug counselling
DTC: Delayed treatment control
EoT: End of treatment
FU: Follow‐up
MET: Motivational enhancement therapy
SD: Standard deviation
SE: Standard error
TAU: Treatment as usual
Cannabis‐related problems
Intervention versus inactive control
Any intervention
Those receiving any intervention reported fewer cannabis‐related problems at follow‐up compared with those receiving inactive control (SMD 3.34, 95% CI 1.26 to 5.42, six studies, 2202 participants; Analysis 1.13). The period of follow‐up with the greatest consistency between studies ranged between seven weeks and four months. This analysis included MET, CBT and MET + CBT interventions. We considered the quality of evidence for this outcome to be low (Table 1).
1.13. Analysis.
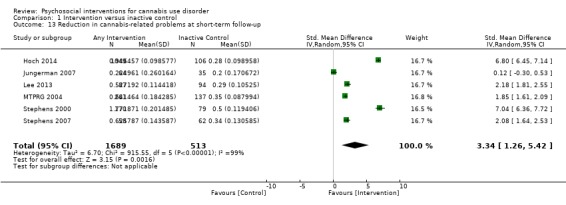
Comparison 1 Intervention versus inactive control, Outcome 13 Reduction in cannabis‐related problems at short‐term follow‐up.
Subgroup analysis for intensity of intervention
Those receiving a high‐intensity intervention (more than four sessions or duration longer than one month) reported the greatest difference compared with inactive control (SMD 5.14, 95% CI 2.57 to 7.70, four studies, 1535 participants; Analysis 1.14); those receiving an intervention of low intensity (four or fewer sessions or duration less than one month) reported fewer problems (SMD 2.50, 95% CI 1.01 to 3.98, five studies, 667 participants; Analysis 1.14).
1.14. Analysis.
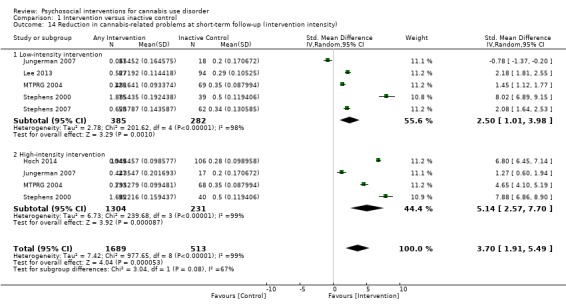
Comparison 1 Intervention versus inactive control, Outcome 14 Reduction in cannabis‐related problems at short‐term follow‐up (intervention intensity).
Subgroup analysis for type of intervention
Compared with those given inactive control, those receiving CBT reported the fewest problems (SMD 7.88, 95% CI 6.86 to 8.90, one study, 135 participants; Analysis 1.15), followed by those given MET + CBT (SMD 3.85, 95% CI ‐0.39 to 8.10, three studies, 1455 participants; Analysis 1.15) and MET (SMD 3.29, 95% CI 1.85 to 4.72, four studies, 612 participants; Analysis 1.15).
1.15. Analysis.
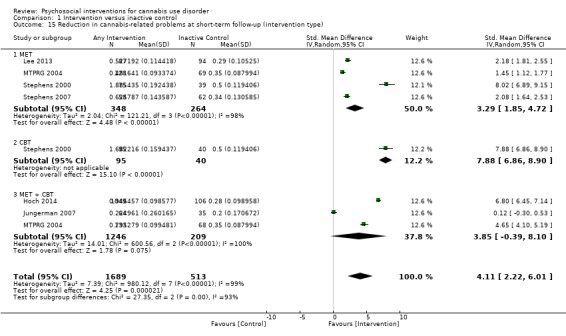
Comparison 1 Intervention versus inactive control, Outcome 15 Reduction in cannabis‐related problems at short‐term follow‐up (intervention type).
Studies not included in this meta‐analysis
No intervention effect over inactive control was found for four‐session MET (although this study consisted of females only, and assessments for risk of bias were largely unclear; Stein 2011); one‐session MET (a significant between‐group difference was noted at three months, but this difference was not significant at six‐month follow‐up) (this study was at high risk of other bias; Lee 2013); nine‐session MET + CBT + CM‐abs and nine‐session MET + CBT + CM‐adh (although this study was at high risk of detection and other bias; Litt 2013). A two‐session MET + CBT group was more likely to “make efforts to cut back or quit” and use community resources compared with inactive control but otherwise was similar in terms of problem behaviours such as driving vehicles while stoned over 12 months (this study was at high risk of other bias; Bernstein 2009). Finally, investigators found that both single‐session and six‐session CBT interventions were superior to inactive control at approximately eight months (242 days on average) (Copeland 2001).
Intervention versus treatment as usual
No included study compared changes in cannabis‐related problems following intervention or treatment as usual.
Intervention versus intervention
RP versus SS
A total of two studies compared RP‐based and SS‐based interventions (each 10 sessions, delivered in groups of 12 to 15). No between‐group differences were reported in the first study over 12 months, with the exception that SS participants were reportedly "able to go to sleep at night more easily" (Roffman 1988). In the second trial of these interventions, although assessments of risk of bias were largely unclear, no between‐group differences were reported across three months (MD ‐0.25, 95% CI ‐0.29 to ‐0.21, one study, 156 participants; Analysis 3.5) (Stephens 1994).
3.5. Analysis.
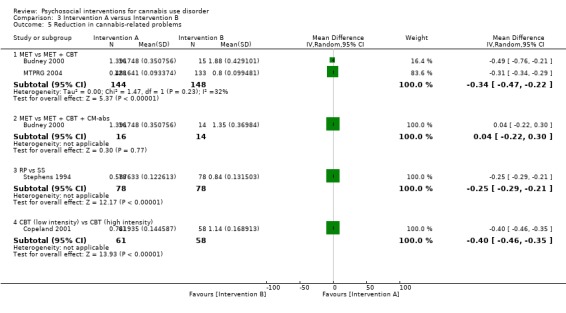
Comparison 3 Intervention A versus Intervention B, Outcome 5 Reduction in cannabis‐related problems.
MET versus alternative treatments
A total of two studies compared MET interventions versus alternative interventions. MET was found to be inferior to MET + CBT (MD ‐0.34, 95% CI ‐0.47 to ‐0.22, two studies, 292 participants; Analysis 3.5). In contrast, a two‐session MET intervention was comparable with MET + CBT + CM‐abs (MD 0.04, 95% CI ‐0.22 to 0.30, one study, 30 participants; Analysis 3.5).
DC versus non‐drug education
In an initial study, single‐session DC delivered orally and in workbook form was reported to be superior to non‐drug health promotion control conditions (also delivered orally or via workbook) with regards to changing inhalation/breath‐holding techniques and driving after cannabis use at three‐month and 12‐month follow‐up (although in this study, data were presented by combining these intervention and control conditions, and assessments for risk of bias were largely unclear; Fischer 2012).
CBT (low intensity) versus CBT (high intensity)
A single‐session CBT intervention was found to be inferior to a six‐session CBT intervention at eight months (MD ‐0.40, 95% CI ‐0.46 to ‐0.35, one study, 119 participants; Analysis 3.5) (Copeland 2001).
CM adjuncts and CM alone versus alternative treatment
A total of two additional studies assessed the impact of CM treatments; each found no treatment effect. First, no between‐group differences were found between 14‐session CBT + CM‐abs, CBT + CM‐adh and CM‐abs interventions across 12 months (data not provided) (although this study was at high risk of detection bias; Budney 2006). Second, no differences were found between MET + CBT + CM‐abs versus CM‐abs alone versus MET + CBT versus a non‐drug health promotion control across 12 months (data not provided) (all nine sessions; Kadden 2007).
Summary of cannabis‐related problems
Evidence of an intervention effect on cannabis‐related problems was somewhat limited by the reduced number of studies investigating this outcome (17 studies). In summary, given the general lack of pattern between intervention types and significant effectiveness in reducing cannabis‐related problems over time, it is difficult for review authors to recommend any treatment without further research. The quality of evidence for reduction in cannabis‐related problems over the short term was considered low according to the GRADE assessment of quality, that is, one study was at high risk of bias, heterogeneity in assessment measures was evident (specifically regarding what was considered a cannabis‐related problem), data conversions were required to obtain a standardised period of assessment and the period of follow‐up varied across studies.
A further summary of units of measurement and of all included study findings regarding the impact of intervention and control on numbers of cannabis‐related problems from baseline to follow‐up is provided in Table 6.
5. Summary of treatment outcomes: cannabis‐related problems.
| Study and group | Measure | Baseline |
Follow‐up [% with data] |
Significance* |
| Bernstein 2009, (1) Brief MET + CBT, (2) Assessed control | Percent reporting risky behaviours following use: fighting, driving, being careful (%) | (1) 50.0, 14.6, 78.1, N = 55, (2) 51.6, 14.8, 69.1, N = 64 | (1) 12.8, 17.0, 73.9, N = 47 [69.1%], (2) 34.6, 24.5, 70.4, N = 55 [77.5%] | (1) vs (2) all P value > 0.05 |
| Budney 2000, (1) MET + CBT + CM‐abs, (2) MET + CBT, (3) MET | Modified Drug Abuse Screening Test “Marijuana Consequences Questionnaire” (mean ± SE) | (1) 7.7 ± 0.62, N = 20, (2) 7.1 ± 0.60, N = 20, (3) 6.7 ± 0.60, N = 20 | (1) 3.7 ± 0.86, N = 14 [70.0%], (2) 1.9 ± 0.78, N = 15 [75.0%], (3) 1.5 ± 1.0, N = 16 [80.0%] | (1) vs (2) P value > 0.05; (1) vs (3) P value > 0.05; (2) vs (3) P value > 0.05 |
| Budney 2006, (1) CBT + CM‐abs, (2) CBT + CM‐adh, (3) CM‐abs | Marijuana Problem Scale (mean ± SD) | (1) 7.8 ± 4.8, N = 30, (2) 7.9 ± 4.0, N = 30, (3) 7.8 ± 4.4, N = 30 | (1) Unclear, N = 21 [70.0%], (2) Unclear, N = 24 [80.0%], (3) Unclear, N = 22 [73.3%] | (1) vs (2) P value > 0.05; (1) vs (3) P value > 0.05; (2) vs (3) P value > 0.05 |
| Copeland 2001, (1) CBT [6‐session], (2) CBT [1‐session], (3) DTC | Cannabis Problems Questionnaire (mean ± SD) | (1) 42.4 ± 17.1, N = 78, (2) 42.2 ± 18.6, N = 82, (3) 45.4 ± 16.3, N = 69 | (1) 23.0 ± 16.8, N = 58 [74.4%], (2) 28.4 ± 18.6, N = 61 [74.4%], (3) 39.1 ± 16.6, N = 52 [75.4%] | (1) vs (2) P value > 0.05; (1) vs (3) P value = 0.004; (2) vs (3) P value < 0.0001 |
| Hoch 2014, (1) MET + CBT, (2) DTC | Cannabis Problems Questionnaire, Cannabis Use Problems Identification Test (mean ± SD) | (1) 6.7 ± 4.2, 41.8 ± 11.7, N = 166, (2) 6.8 ± 4.3, 43.3 ± 11.3, N = 130 | (1) 27.1 ± 14.1, 2.9 ± 3.8, N = 166 [100%], (2) 37.1 ± 14.7, 5.6 ± 4.4, N = 106 [81.5%] | (1) vs (2) P value < 0.001 [d = ‐0.7], P value < 0.001 [d = ‐0.7] |
| Fischer 2012, (1) DC [oral], (2) DC [workbook], (3) Health promotion [oral], (4) Health promotion [workbook] | Proportion reporting driving a car while under the influence of cannabis, and deep inhalation smoking (%) | (1) 80.0, 40.0, N = 24, (2) 76.60, 46.81, N = 47, (3) 76.0, 29.17, N = 25, (4) 83.78, 27.59, N = 37 | (1) Unclear, N = Unclear, (2) Unclear, N = Unclear, (3) Unclear, N = Unclear, (4) Unclear, N = Unclear [data reported by combining groups (1) + (2) and (3) + (4)] | (1) vs (2) P value > 0.05; (1) vs (3) P value > 0.05; (1) vs (4) P value > 0.05; (2) vs (3) P value > 0.05; (3) vs (4) P value > 0.05; (2) vs (4) P value > 0.05 [combining (1) + (2) vs (3) + (4) was P value < 0.05, Q = 13.1, P value < 0.05, Q = 9.3] |
| Jungerman 2007, (1) MET + CBT [3 months], (2) MET + CBT [1 month], (3) DTC | Marijuana Problem Scale (mean ± SE) | (1) 10.21 ± 0.58, N = 52, (2) 9.80 ± 0.56, N = 56, (3) 9.71 ± 0.58, N = 52 | (1) 8.52 ± 0.63, N = 27 [51.9%], (2) 9.54 ± 0.61, N = 37 [66.1%], (3) 8.92 ± 0.64, N = 35 [67.3%] | (1) vs (2) P value > 0.05; (1) vs (3) P value > 0.05; (2) vs (3) P value > 0.05 |
| Kadden 2007 (1) MET + CBT + CM‐abs, (2) MET + CBT, (3) CM‐abs, (4) Health education | Marijuana Problem Scale (mean ± SD) | (1) 13.42 ± 6.84, N = 63, (2) 13.97 ± 7.52, N = 61, (3) 12.62 ± 6.09, N = 54, (4) 15.19 ± 6.74, N = 62 | (1) Unclear, N = 51 [81.0%], (2) Unclear, N = 49 [80.3%], (3) Unclear, N = 48 [88.9%], (4) Unclear, N = 52 [83.9%] | (1) vs (2) P value > 0.05; (1) vs (3) P value > 0.05; (1) vs (4) P value > 0.05; (2) vs (3) P value > 0.05; (3) vs (4) P value > 0.05; (2) vs (4) P value > 0.05 |
| Lee 2013, (1) MET, (2) Assessed control | Adapted Marijuana Problems Index (mean ± SD) | (1) 10.45 ± 4.9, N = 106, (2) 10.38 ± 5.9, N = 106 | (1) 6.54 ± 5.3, N = 89 [84.0%], (2) 6.75 ± 6.5, N = 86 [81.1%] | (1) vs (2) P value < 0.05, [significant at 3 month FU only] |
| Litt 2013, (1) MET + CBT + CM‐abs, (2) MET + CBT + CM‐adh, (3) Assessed control | Marijuana Problem Scale (data presented in an unclear figure) | (1) Unclear, N = 73, (2) Unclear, N = 71, (3) Unclear, N = 71 | (1) Unclear, N = 60 [82.2%], (2) Unclear, N = 61 [85.9%], (3) Unclear, N = 61 [85.9%] | (1) vs (2) P value > 0.05; (1) vs (3) P value > 0.05; (2) vs (3) P value > 0.05 |
| MTPRG 2004, (1) MET + CBT, (2) MET, (3) Assessed control | Marijuana Problem Scale (mean ± SD) | (1) 9.47 ± 3.51, N = 156, (2) 10.18 ± 3.47, N = 146, (3) 9.07 ± 3.53, N = 148 | (1) Unclear, N = 129 [82.7%], (2) Unclear, N = 120 [82.2%], (3) Unclear, N = 137 [92.6%] | (1) vs (2) P value > 0.05, [significant at 4 month FU only, d = 0.41]; (1) vs (3) P value < 0.05 [d = 0.53]; (2) vs (3) P value > 0.05 |
| Roffman 1988, (1) RP, (2) SS | Modified Drug Abuse Screening Test – Marijuana Problem Scale (data provided as total sample only) | (1) Unclear, N = 54, (2) Unclear, N = 56 | (1) Unclear, N = 45 [83.3%], (2) Unclear, N = 52 [92.9%] | (1) vs (2) P value < 0.05 |
| Stein 2011, (1) MET, (2) Assessed control | Marijuana Problem Scale (mean ± SD) | (1) 4.82 ± 4.66, N = 163, (2) 4.99 ± 4.71, N = 169 | (1) Unclear, N = 126 [77.3%], (2) Unclear, N = 136 [80.5%] | (1) vs (2) P value > 0.05 |
| Stephens 1994, (1) RP, (2) SS | Drug Abuse Screening Test (mean ± SD) | (1) 8.88 ± 2.86, N = 106, (2) 6.31 ± 4.28, N = 106 | (1) 3.27 ± 3.41, N = 80 [75.5%], (2) 2.91 ± 3.64, N = 87 [82.1%] | (1) vs (2) P value > 0.05 |
| Stephens 2000, (1) MET, (2) CBT, (3) Assessed control | Marijuana Problem Scale (mean ± SD) | (1) 9.99 ± 2.89, N = 88, (2) 9.86 ± 3.05, N = 117, (3) 9.78 ± 2.96, N = 86 | (1) 12.99 ± 11.61, N = 80 [90.9%], (2) 12.29 ± 12.34, N = 103 [88.0%], (3) 7.89 ± 4.23, N = 79 [91.9%] | (1) vs (2) P value > 0.05; (1) vs (3) P value < 0.001; (2) vs (3) P value < 0.001 [significant at EoT only] |
| Stephens 2007, (1) MET, (2) Drug‐related health education, (3) DTC | Marijuana Problem Scale (mean ± SE) | (1) 6.37 ± 3.71, N = 62, (2) 5.31 ± 3.53, N = 62, (3) 6.31 ± 4.28, N = 64 | (1) 3.95 ± 0.40, N = 49 [79.0%], (2) 5.21 ± 0.40, N = 52 [83.9%], (3) 5.01 ± 0.40, N = 62 [96.9%] | (1) vs (2) P value > 0.05; (1) vs (3) P value > 0.05; (2) vs (3) P value > 0.05 |
* Unless otherwise indicated by *, significant treatment outcomes favour the group with the lower number; exact P values are reported when provided
CBT: Cognitive‐behavioural therapy
CM‐abs: Contingency management with vouchers presented for negative urine
CM‐adh: Contingency Management with vouchers presented for treatment attendance/adherence
DC: Drug counselling
EoT: End of treatment
FU: Follow‐up
MET: Motivational enhancement therapy
RP: Relapse prevention
SD: Standard deviation
SE: Standard error
SS: Social support
TAU: Treatment as usual
Retention in treatment
Heterogeneity across studies in measurement of treatment retention and lack of studies in which participants were randomly allocated to low‐intensity or high‐intensity interventions prevented meta‐analysis. On average, seven out of ten participants completed treatment (ES 0.71, 95% CI 0.63 to 0.78, 11 studies, 1424 participants; Figure 3). This analysis included MET, CBT, CBT + adh, CBT + CM‐abs, MET + CBT, MET + CBT + CM‐abs + CM‐adh, DC, DC + CM‐abs + CM‐adh, MM and CM‐abs interventions. The quality of evidence for this outcome was considered to be high (Table 1).
3.
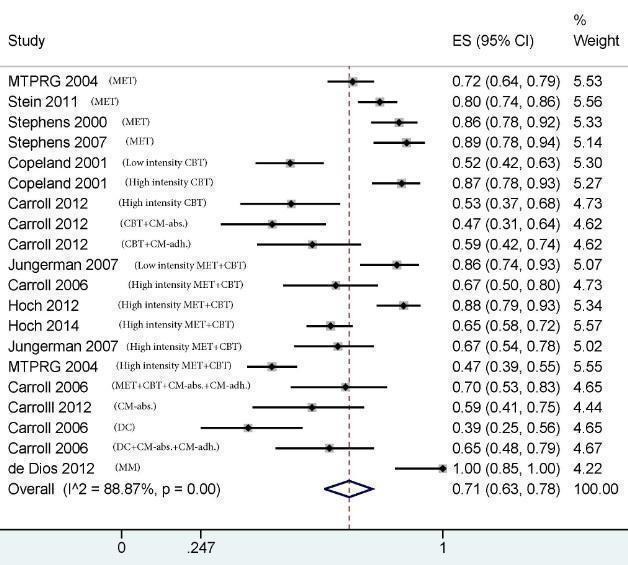
Pooled analysis of retention in treatment.
Most of the studies that investigated whether greater treatment retention was associated with improved treatment outcomes found no such significant relationship (Budney 2000; Budney 2006; Carroll 2006; Carroll 2012; de Dios 2012; Kadden 2007; Litt 2013; Stein 2011), including the only study to investigate the importance of completing homework between sessions, which found no significant impact on treatment outcomes following CBT‐based intervention (Carroll 2012). In contrast, Copeland 2001 reported significantly improved outcomes in terms of dependence and related problems among treatment completers compared with non‐completers for both six‐session and single‐session CBT interventions. Future research is needed to provide clarity and particularly to directly compare outcomes for participants who do not completely adhere to an intensive treatment versus outcomes for participants who complete a comparable number of sessions of less intensive treatment.
The quality of evidence for retention in treatment was considered moderate according to the GRADE assessment of quality. The only notable limitation was small heterogeneity in assessment measures, in that some studies reported treatment completion as the proportion of participants completing a subset of final treatment sessions rather than the full set of sessions. A further summary of measurement of treatment retention across all experimental arms of the included studies is provided in Table 7.
6. Summary of treatment outcomes: treatment retention.
| Study | Intended number of sessions | Intended treatment duration, weeks | Treatment adherence, % | Completed sessions, mean ± SD |
| CBT | ||||
| Copeland 2001 | 1 | n/a | 87.8% attended | n/a |
| Copeland 2001 | 6 | 6 | 91% attended ≥ 1; 50% completed | 4.2 ± 2.2 |
| Carroll 2012 | 12 | 12 | 53.1% completed treatment | 5.9 ± 3.8* |
| Stephens 2000 | 14 | 14 | 50% attended 10 or more sessions including sessions 9 and 10 | 8.42 ± 3.51 |
| CBT + CM‐abs | ||||
| Budney 2006 | 14 | 14 | 87% provided 3 or more urine specimens | 9.6 ± 4.9 |
| Carroll 2012 | 12 | 12 | 47.2% completed treatment | 5.9 ± 3.8* |
| CBT + CM‐adh | ||||
| Budney 2006 | 14 | 14 | 87% provided 3 or more urine specimens | 8.8 ± 5.0 |
| Carroll 2012 | 12 | 12 | 59.4% completed treatment | 5.9 ± 3.8* |
| MET | ||||
| Budney 2000 | 4 | 14 | 45% completed ≥ 1 session and provided ≥ 1 urine specimen during the final 2 weeks of treatment | ‐ |
| Stein 2011 | 2 | 4 | 80.4% completed treatment | 1.7 ± 0.6 |
| MTPRG 2004 | 2 | 6 | 71.9% completed treatment | 1.6 |
| Stephens 2007 | 1 | 7 | 88.7% completed treatment | ‐ |
| MET + CBT | ||||
| MTPRG 2004 | 9 | 12 | 47% completed treatment | 6.5 |
| Bernstein 2009 | 2 | 56 | 100% completed ≥ 1 session | ‐ |
| Jungerman 2007 | 4 | 4 | 85.7% completed treatment | ‐ |
| Jungerman 2007 | 4 | 12 | 67.3% completed treatment | ‐ |
| Kadden 2007 | 9 | 9 | ‐ | 4.9 ± 3.3 |
| Carroll 2006 | 8 | 8 | 66.7% completed treatment | ‐ |
| Hoch 2012 | 10 | 5‐8 | 87.8% completed treatment | 7 |
| Hoch 2014 | 10 | 8‐12 | 65.1% completed treatment | |
| Madigan 2013 | 13 | 18 | 54.2% “declined the intervention” | ‐ |
| Budney 2000 | 14 | 14 | 65% completed ≥ 1 session | |
| MET + CBT + CM‐abs | ||||
| Budney 2000 | 14 | 14 | 55% completed ≥ 1 session | ‐ |
| Litt 2013 | 9 | 9 | ‐ | 5.5 ± 3.8 |
| Kadden 2007 | 9 | 9 | ‐ | 5.6 ± 3.6 |
| MET + CBT + CM‐adh | ||||
| Litt 2013 | 9 | 9 | ‐ | 5.7 ± 3.5 |
| MET + CBT + CM‐abs + CM‐adh | ||||
| Carroll 2006 | 8 | 8 | 69.7% completed treatment | 5.1 ± 2.5 |
| DC | ||||
| Carroll 2006 | 8 | 8 | 39.4% completed treatment | ‐ |
| Edwards 2006 | 10 | 12 | ‐ | 7.6 ± 2.8 |
| Drug‐related health education | ||||
| Stephens 2007 | 1 | 7 | 93.5% completed treatment | ‐ |
| DC + CM‐abs + CM‐adh | ||||
| Carroll 2006 | 8 | 8 | 63.7% completed treatment | ‐ |
| MM | ||||
| de Dios 2012 | 2 | 2 | 72.7% completed treatment | |
| RP | ||||
| Roffman 1988 | 10 | 12 | 87.8% received ≥ 4 sessions | 7.54* |
| Stephens 1994 | 14 | 18 | 69% attended 7 or more sessions* | 7.6 ± 2.5* |
| SS | ||||
| Roffman 1988 | 10 | 12 | 73.2% received ≥ 4 sessions | 7.54* |
| Stephens 1994 | 14 | 18 | 69% attended 7 or more sessions* | 7.6 ± 2.5* |
| CM‐abs | ||||
| Budney 2006 | 12 | 12 | 83% provided 3 or more urine specimens | ‐ |
| Carroll 2012 | 12 | 12 | 59.3% completed treatment | ‐ |
| Kadden 2007 | 9 | 9 | ‐ | 5.5 ± 3.8 |
* These data were reported as a total sample only, although no between‐group differences were noted across interventions
CBT: Cognitive‐behavioural therapy
CM‐abs: Contingency management with vouchers presented for negative urine
CM‐adh: Contingency management with vouchers presented for treatment attendance/adherence
DC: Drug counselling
DTC: Delayed treatment control
MET: Motivational enhancement therapy
MM: Mindfulness meditation
RP: Relapse prevention
SS: Social support
Secondary outcomes
Motivation to quit
Heterogeneity across studies in the measurement of motivation to quit cannabis use prevented meta‐analysis.
Intervention versus inactive control
Three studies included a comparison between active treatment and an inactive control condition, with each reporting no significant intervention effect (Litt 2013; Stein 2011; Stephens 2007).
Intervention versus treatment as usual
Two trials included a comparison between active treatment and treatment as usual among patients in a psychiatric clinic. First, MET when delivered "as needed" over six months (on average six sessions received) was found to be superior at three‐month follow‐up with regards to score on the Contemplation Ladder, but no significant between‐group differences were reported at six‐month or 12‐month follow‐up (Bonsack 2011). Similarly, no significant treatment effect of a 10‐session DC was noted at six‐month follow‐up with regards to the proportion of participants actively attempting to abstain (Edwards 2006).
Intervention versus intervention
Three studies included comparisons between active treatments, each reporting no significant differences between groups, with one exception. Comparisons that revealed no significant between‐group differences included MET + CBT versus MET + CBT + CM‐abs using the Situational Confidence Questionnaire (Budney 2000); MET + CBT + CM‐abs versus MET + CBT + CM‐adh using the Marijuana Self Efficacy Questionnaire (although this study was at high risk of detection and other bias; Litt 2013); and MET versus DC using the proportion of participants contemplating change (Stephens 2007). The sole exception was a 14‐session MET + CBT trial, which was found to be superior in enhancing confidence to quit (as measured by the Situational Confidence Questionnaire) when compared with four‐session MET at end of treatment (MD 25.10, 95% CI 9.79 to 40.41, one study, 31 participants; Analysis 3.7).
3.7. Analysis.
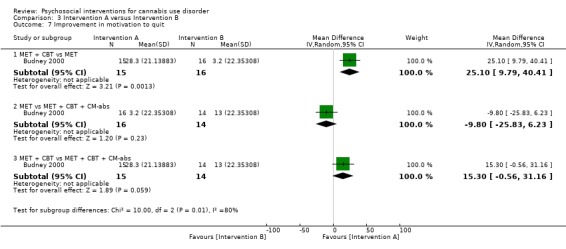
Comparison 3 Intervention A versus Intervention B, Outcome 7 Improvement in motivation to quit.
Summary of motivation to quit
Evidence for an effect of intervention on motivation to quit cannabis use was greatly limited by the few studies investigating this outcome (six studies). Given the lack of any particular intervention effectiveness over time, it is difficult to make treatment recommendations for improving motivation to quit without conducting further research. Notably, although it was not assessed as a treatment outcome, use of coping skills during treatment and self efficacy to quit post treatment were found to be significant predictors of other cannabis‐related treatment outcomes in the MTPRG 2004 trial. Similarly, it was noteworthy that trials that did not include treatment‐seeking participants (who could be assumed to be motivated to quit from baseline) but recruited from non‐cannabis treatment settings reported particularly poor cannabis‐related treatment outcomes, that is, three trials found no significant improvement over control at any follow‐up point (Bernstein 2009; Edwards 2006; Lee 2013); two trials reported limited improvement, which was non‐significant by final follow‐up (Bonsack 2011; Stein 2011); and only one trial found improved treatment outcomes in groups receiving intensive treatments compared with less intensive control treatments (Carroll 2012). Finally, when motivation to abstain from cannabis was assessed as a potential mediator of treatment effect, some evidence suggested that motivation to quit at baseline may be an important indicator of overall treatment success (Litt 2013; Stein 2011), although other studies found no such association (Bonsack 2011; Budney 2000; Edwards 2006; Stephens 2007).
A summary of units of measurement and all included study findings regarding the impact of intervention and control on motivation to quit cannabis use from baseline to final follow‐up is provided in Table 8.
7. Summary of treatment outcomes: motivation to quit.
| Study and group | Measure | Baseline |
Follow‐up [% with data] |
Significance* |
| Bonsack 2011, (1) MET, (2) TAU | The Contemplation Ladder; a scale score from 0‐100 of readiness, importance and confidence to change (median) | (1) 50.0, 50.0, 50.0, N = 30, (2) 50.0, 25.0, 50.0, N = 32 | (1) 56.25, 50.0, 75.0, N = 25 [83.3%], (2) 50.0, 50.0, 60.0, N = 29 [90.6%] | (1) vs (2) P value > 0.05, P value > 0.05, P value = 0.02 on the ‘confidence’ score at 3 month FU only, d = 0.64 |
| Budney 2000, (1) MET + CBT + CM‐abs, (2) MET + CBT, (3) MET | Adapted University of Rhode Island Change Assessment score, Situational Confidence Questionnaire (overall score least squares mean ± SE) | (1) 9.1 ± 0.36, 55.4 ± 3.9, N = 20, (2) 9.6 ± 3.5, 50.7 ± 3.9, N = 20, (3) 9.4 ± 0.34, 55.1 ± 4.3, N = 20 | (1) 8.5 ± 0.56, 68.4 ± 6.4, N = 14 [70.0%], (2) 8.6 ± 0.45, 79.0 ± 5.4, N = 15 [75.0%], (3) 6.6 ± 0.64, 58.3 ± 7.4, N = 16 [80.0%] | (1) vs (2)* P value > 0.05, P value < 0.05 [favours group 2]; (1) vs (3) P value > 0.05, P value > 0.05 (2) vs (3)* P value > 0.05, P value < 0.05 [favours group 2] |
| Edwards 2006, (1) DC, (2) TAU | Readiness to Change Questionnaire‐Cannabis (% in ‘action’ stage) | (1) 25.0, N = 23, (2) 29.5, N = 24 | (1) 27.3, N = 16 [69.6%], (2) 38.6, N = 17 [70.8%] | (1) vs (2) P value > 0.05 |
| Litt 2013, (1) MET + CBT + CM‐abs, (2) MET + CBT + CM‐adh, (3) Assessed control | Marijuana Self‐Efficacy Questionnaire, Coping Strategies Scale, Readiness to Change Questionnaire (data provided in unclear figure) | (1) Unclear, N = 73, (2) Unclear, N = 71, (3) Unclear, N = 71 | (1) Unclear, N = 60 [82.2%], (2) Unclear, N = 61 [85.9%], (3) Unclear, N = 61 [85.9%] | (1) vs (2) all P value > 0.05; (1) vs (3) all P value > 0.05; (2) vs (3) all P value > 0.05 |
| Stein 2011, (1) MET, (2) Assessed control | Percent with a desire to abstain (%) | (1) 56.8, N = 163, (2) 63.5, N = 169 | (1) 77.3, N = 126 [77.3%], (2) 80.5, N = 136 [80.5%] | (1) vs (2) P value > 0.05 |
| Stephens 2007, (1) MET, (2) Drug‐related health education, (3) DTC | Readiness to Change Questionnaire (% in pre‐contemplation or contemplation stage) | (1) 68, N = 62, (2) 87, N = 62, (3) 70, N = 64 | (1) Unclear, N = 49 [79.0%], (2) Unclear, N = 52 [83.9%], (3) Unclear, N = 62 [96.9%] | (1) vs (2) P value > 0.05; (1) vs (3) P value > 0.05; (2) vs (3) P value > 0.05 |
* Unless otherwise indicated, significant treatment outcomes favour the group with the lower number; exact P values are reported when provided
CBT: Cognitive‐behavioural therapy
CM‐abs: Contingency management with vouchers presented for negative urine
CM‐adh: Contingency management with vouchers presented for treatment attendance/adherence
DC: Drug counselling
DTC: Delayed treatment control
EoT: End of treatment
FU: Follow‐up
MET: Motivational enhancement therapy
RP: Relapse prevention
SE: Standard error
TAU: Treatment as usual
Other substance use
Differences in the measures used to assess non‐cannabis substance use and heterogeneity between studies investigating this outcome (12 studies) prevented meta‐analysis. Notably, no trial included more than one‐third of participants reporting heavy substance use at baseline (according to trial inclusion criteria for this review), and most did not recruit participants who reported recent illicit drug use.
Intervention versus inactive control
No active intervention was found to be superior to inactive control by final follow‐up (Hoch 2012; Hoch 2014; Jungerman 2007; Kadden 2007; MTPRG 2004; Stephens 2000; Stephens 2007).
Intervention versus treatment as usual
No included study of intervention versus treatment as usual compared changes to non‐cannabis substance use from baseline to follow‐up.
Intervention versus intervention
MET + CBT + CM‐abs versus alternative intervention
A single trial found that participants receiving a 14‐session MET + CBT + CM‐abs intervention reported greater reductions in alcohol use and other substance use at end of treatment compared with those receiving both four‐session MET (MD 0.80, 95% CI 0.75 to 0.85, one study, 30 participants; Analysis 3.8; and MD 0.11, 95% CI 0.06 to 0.16, one study, 30 participants; Analysis 3.9, respectively) and a 14 session MET + CBT intervention (MD 0.78, 95% CI 0.73 to 0.83, one study, 29 participants; Analysis 3.8; and MD 0.08, 95% CI 0.03 to 0.13, one study, 29 participants; Analysis 3.9, respectively) (Budney 2000). In contrast, no significant between‐group differences in severity of other drug dependence were noted between those receiving a nine‐session MET + CBT + CM‐abs intervention and those given nine sessions of MET + CBT or CM‐abs over 12 months (Kadden 2007).
3.8. Analysis.
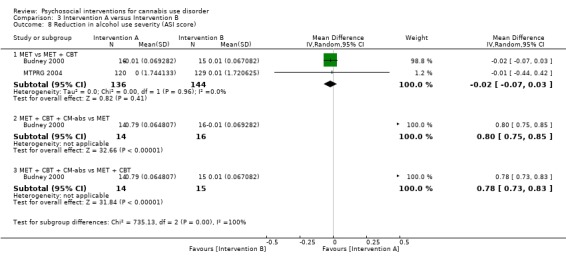
Comparison 3 Intervention A versus Intervention B, Outcome 8 Reduction in alcohol use severity (ASI score).
3.9. Analysis.
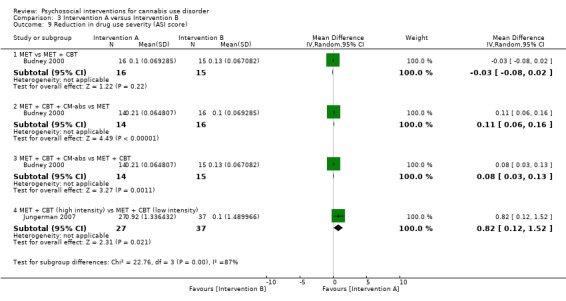
Comparison 3 Intervention A versus Intervention B, Outcome 9 Reduction in drug use severity (ASI score).
MET versus alternative intervention
Two trials compared MET versus MET + CBT interventions and reported no significant between‐group differences at final follow‐up when alcohol and other drug dependence severity or frequency of alcohol use was assessed (Budney 2000; MTPRG 2004). Similarly, no between‐group differences were noted among participants receiving a two‐session MET intervention or 14 sessions of CBT (Stephens 2000) or a single session of MET compared with DC (Stephens 2007).
MET + CBT (low intensity) versus MET + CBT (high intensity)
A single trial assessed the impact of MET + CBT intervention intensity, reporting no effects for frequency of alcohol use, although the more intensive intervention was superior with regards to severity of drug dependence (MD 0.82, 95% CI 0.12 to 1.52, one study, 64 participants; Analysis 3.9).
RP versus SS
No significant between‐group differences were reported between those receiving 10‐session RP or 10‐session SS at one month (Roffman 1988) or over 12 months (although assessments for risk of bias were largely unclear for this study; Stephens 1994).
CBT + CM‐abs versus CBT + CM‐adh versus CM‐abs
A single trial compared 14‐session CBT + CM‐abs versus CBT + CM‐adh versus CM‐abs interventions over 12 months and reported no significant differences in days of use or severity of other drug use dependence (although this study was at high risk of detection bias; Budney 2006).
MET + CBT versus DC versus MET + CBT + AM‐abs + CM‐adh versus DC + CM‐abs + CM‐adh
A single trial compared eight‐session MET + CBT and DC interventions without and with CM‐abs + CM‐adh adjuncts and reported no significant between‐group differences in severity of alcohol and drug dependence over six months (Carroll 2006).
Summary of other substance use
Evidence for an intervention effect on other substance use was somewhat limited by heterogeneity in measures and few studies investigating this outcome (12 studies). In summary, given the lack of any particular intervention effectiveness over time, it is difficult for review authors to make any treatment recommendations for improving mental health without further research.
A summary of units of measurement and all included study findings regarding the impact of intervention and control on non‐cannabis substance use from baseline to follow‐up is provided in Table 9.
8. Summary of treatment outcomes: other drug use.
| Study and group | Measure | Baseline |
Follow‐up [% with data] |
Significance* |
| Budney 2000, (1) MET + CBT + CM‐abs, (2) MET + CBT, (3) MET | Addiction Severity Index ‘alcohol’ and ‘drug use’ composite scores (least squares mean ± SE) | (1) 0.9 ± 0.01, 0.22 ± 0.01, N = 20, (2) 0.12 ± 0.01, 0.20 ± 0.01, N = 20, (3) 0.07 ± 0.01, 0.21 ± 0.01, N = 20 | (1) 0.11 ± 0.02, 0.01 ± 0.02, N = 14 [70.0%], (2) 0.11 ± 0.02, 0.07 ± 0.02, N = 15 [75.0%], (3) 0.08 ± 0.02, 0.11 ± 0.02, N = 16 [80.0%] | (1) vs (2) P value > 0.05, P value < 0.05 [f = 0.23]; (1) vs (3) P value > 0.05, P value < 0.05 [f = 0.23]; (2) vs (3) P value > 0.05, P value > 0.05 |
| Budney 2006, (1) CBT + CM‐abs, (2) CBT + CM‐adh, (3) CM‐abs | Addiction Severity Index ‘alcohol’ and ‘drug use’ composite scores (mean ± SD) | (1) 0.09 ± 0.10, 0.23 ± 0.09, N = 30, (2) 0.10 ± 0.13, 0.25 ± 0.09, N = 30, (3) 0.11 ± 0.11, 0.24 ± 0.08, N = 30 | (1) Unclear, N = 21 [70.0%], (2) Unclear, N = 24 [80.0%], (3) Unclear, N = 22 [73.3%] | (1) vs (2) P value > 0.05; (1) vs (3) P value > 0.05; (2) vs (3) P value > 0.05 |
| Carroll 2006, (1) MET + CBT + CM‐abs + CM‐adh, (2) DC + CM‐abs + CM‐adh, (3) MET + CBT, (4) DC | Addiction Severity Index for alcohol and drug use (data not provided) | (1) Unclear, N = 33, (2) Unclear, N = 34, (3) Unclear, N = 36, (4) Unclear, N = 33 | (1) Unclear, N = 27 [81.8%], (2) Unclear, N = 24 [70.6%], (3) Unclear, N = 27 [75.0%], (4) Unclear, N = 30 [90.9%] | (1) vs (2) P value > 0.05; (1) vs (3) P value > 0.05; (1) vs (4) P value > 0.05; (2) vs (3) P value > 0.05; (3) vs (4) P value > 0.05; (2) vs (4) P value > 0.05 |
| Hoch 2012, (1) MET + CBT, (2) DTC | Addiction Severity Index ‘alcohol’ and ‘drug use’ composite scores (mean ± SD) | (1) 10.0 ± 1.0, 10.0 ± 0.7, N = 90, (2) 9.9 ± 0.8, 10.0 ± 0.7, N = 32 | (1) 11.0 ± 9.7, 3.0 ± 4.0, N = 79 [87.8%], (2) 13.7 ± 13.3, 8.3 ± 3.5, N = 31 [96.9%] | (1) vs (2) P value > 0.05, P value > 0.05 |
| Hoch 2014, (1) MET + CBT, (2) DTC | Litres per consumption day of alcohol (mean ± SD), proportion of daily smokers (%), proportion using any illicit drug (%) | (1) 0.2 ± 0.3, 78.2, 10.6, N = 166, (2) 0.2 ± 0.3, 82.0, 7.1, N = 130 | (1) 0.2 ± 0.4, 78.5, 13.0, N = 166 [100%], (2) 0.2 ± 0.02, 82.1, 8.6, N = 106 [81.5%] | (1) vs (2) P value > 0.05, P value > 0.05, P value > 0.05 |
| Jungerman 2007, (1) MET + CBT [3 months], (2) MET + CBT [1 month], (3) DTC | Percent of days post baseline used alcohol (mean ± SE), Addiction Severity Index drug use composite score (mean ± SE) | (1) 10.03 ± 2.20, 3.02 ± 0.21, N = 52, (2) 11.16 ± 2.12, 2.87 ± 0.20, N = 56, (3) 10.06 ± 2.20, 3.38 ± 0.21, N = 52 | (1) 7.09 ± 2.07, 2.10 ± 0.21 N = 27 [51.9%], (2) 9.13 ± 1.99, 2.77 ± 0.20, N = 37 [66.1%], (3) 9.01 ± 2.07, 2.81 ± 0.21, N = 35 [67.3%] | (1) vs (2) P value > 0.05, P value = 0.0121; (1) vs (3) P value > 0.05, P value > 0.05; (2) vs (3) P value > 0.05, P value > 0.05 |
| Kadden 2007 (1) MET + CBT + CM‐abs, (2) MET + CBT, (3) CM‐abs, (4) Health education | Addiction Severity Index ‘alcohol’ and ‘drug use’ composite scores (mean ± SD) | (1) 0.09 ± 0.10, 0.26 ± 0.05, N = 63, (2) 0.12 ± 0.12, 0.25 ± 0.07, N = 61, (3) 0.11 ± 0.14, 0.23 ± 0.07, N = 54, (4) 0.09 ± 0.09, 0.23 ± 0.07, N = 62 | (1) Unclear, N = 51 [81.0%], (2) Unclear, N = 49 [80.3%], (3) Unclear, N = 48 [88.9%], (4) Unclear, N = 52 [83.9%] | (1) vs (2) P value > 0.05, P value > 0.05; (1) vs (3) P value > 0.05, P value > 0.05; (1) vs (4) P value > 0.05, P value > 0.05; (2) vs (3) P value > 0.05, P value > 0.05; (3) vs (4) P value > 0.05, P value > 0.05; (2) vs (4) P value > 0.05, P value > 0.05 |
| MTPRG 2004, (1) MET + CBT, (2) MET, (3) Assessed control | Days alcohol used in prior 90 days (mean ± SD), Addiction Severity Index for alcohol (mean ± SD) | (1) 48.79 ± 79.10, 0.11 ± 0.13, N = 156, (2) 59.41 ± 84.56, 0.12 ± 0.13, N = 146, (3) 46.57 ± 85.48, 0.11 ± 0.12, N = 148 | (1) 46.12 ± 106.70, 0.10 ± 0.11, N = 129 [82.7%], (2) 45.56 ± 76.62, 0.12 ± 0.13, N = 120 [82.2%], (3) 42.92 ± 62.48, 0.11 ± 0.12, N = 137 [92.6%] | (1) vs (2) P value > 0.05, P value > 0.05; (1) vs (3) P value > 0.05, P value > 0.05; (2) vs (3) P value > 0.05, P value > 0.05 |
| Roffman 1988, (1) RP, (2) SS | Occasions of use in prior week for alcohol and tobacco, proportion reporting any illicit drug use (data provided for total sample only) | (1) Unclear, N = 54, (2) Unclear, N = 56 | (1) Unclear, N = 45 [83.3%], (2) Unclear, N = 52 [92.9%] | (1) vs (2) P value > 0.05 |
| Stephens 1994, (1) RP, (2) SS | Average occasions of use in a typical week for alcohol and illicit drugs in the prior 90 days, number of alcohol‐related and drug‐related problem scores from the Drug Abuse Screening Test (data provided for total sample only) | (1) Unclear, N = 106, (2) Unclear, N = 106 | (1) Unclear, N = 80 [75.5%], (2) Unclear, N = 87 [82.1%] | (1) vs (2) all P value > 0.05 |
| Stephens 2000, (1) MET, (2) CBT, (3) Assessed control | Frequency of alcohol and other drug use in the prior 90 days, number of alcohol and drug‐related problems from unclear 19‐item assessment (mean) | (1) Unclear, N = 88, (2) Unclear, N = 117, (3) Unclear, N = 86 [data reported as total sample only] | (1) 0.48, N = 80 [90.9%], (2) 0.76, N = 103 [88.0%], (3) 5.01, N = 79 [91.9%] [data reported as total sample only, with the exception of other drug use frequency] | (1) vs (2) all P value > 0.05; (1) vs (3) all P value > 0.05, except other drug use frequency P value < 0.05; (2) vs (3) all P value > 0.05, except other drug use frequency P value < 0.05 [significant at EoT only] |
| Stephens 2007, (1) MET, (2) Drug‐related health education, (3) DTC | Days used in prior week for alcohol and illicit drugs and number of alcohol and drug‐related problems from unclear assessment (mean ± SD when provided) | (1) 2.00 ± 2.08, 0.16 ± 0.43, Unclear, N = 62, (2) 1.38 ± 1.63, 0.13 ± 0.23, Unclear, N = 62, (3) 1.90 ± 2.12, 0.11 ± 0.19, Unclear, N = 64 | (1) Unclear, N = 49 [79.0%], (2) Unclear, N = 52 [83.9%], (3) Unclear, N = 62 [96.9%] | (1) vs (2) all P value > 0.05; (1) vs (3) all P value > 0.05; (2) vs (3) all P value > 0.05 |
* Unless otherwise indicated by *, significant treatment outcomes favour the group with the lower number; exact P values are reported when provided
CBT: Cognitive‐behavioural therapy
CM‐abs: Contingency management with vouchers presented for negative urine
CM‐adh: Contingency management with vouchers presented for treatment attendance/adherence
DC: Drug counselling
DTC: Delayed treatment control
EoT: End of treatment
FU: Follow‐up
MET: Motivational enhancement therapy
RP: Relapse prevention
SD: Standard deviation
SE: Standard error
SS: Social support
TAU: Treatment as usual
Mental health
Differences in the measures used to assess non‐cannabis substance use and heterogeneity between studies investigating this outcome (12 studies) prevented meta‐analysis.
Intervention versus inactive control
Five trials compared active treatments versus inactive control; none found a significant treatment effect on several measures of mental health (see Table 10).
9. Summary of treatment outcomes: mental health.
| Study and group | Measure | Baseline |
Follow‐up [% with data] |
Significance* |
| Bonsack 2011, (1) MET, (2) TAU | PANSS‐P, PANSS‐N, GAF, SOFAS, Proportion admitted to hospital during trial period (median ± range) | (1) 17.0 ± 19.0, 18.0 ± 18, 40.0 ± 20.0, 40.0 ± 19.0, n/a, N = 30, (2) 17.0 ± 21.0, 17.5 ± 13, 40.0 ± 40.0, 40.0 ± 40.0, n/a, N = 32 | (1) 16.0 ± 22, 17.0 ± 16.0, 40 ± 24, 40.5 ± 24, 30.0, N = 25 [83.3%], (2) 16.0 ± 20.0, 17.5 ± 17.0, 40.0 ± 40.0, 41.0 ± 30.0, 34.4, N = 29 [90.6%] | (1) vs (2) P value > 0.05, P value > 0.05, P value > 0.05, P value > 0.05, P value > 0.05 |
| Budney 2000, (1) MET + CBT + CM‐abs, (2) MET + CBT, (3) MET | Global Symptom Index of the Brief Symptom Inventory (least squares, mean ± SE) | (1) 68.1 ± 1.8, N = 20, (2) 65.6 ± 1.8, N = 20, (3) 67.9 ± 1.9, N = 20 | (1) 58.9 ± 2.9, N = 14 [70.0%], (2) 55.4 ± 2.3, N = 15 [75.0%], (3) 58.7 ± 3.4, N = 16 [80.0%] | (1) vs (2) P value > 0.05; (1) vs (3) P value > 0.05; (2) vs (3) P value > 0.05 |
| Budney 2006, (1) CBT + CM‐abs, (2) CBT + CM‐adh, (3) CM‐abs | Global Symptom Index of the Brief Symptom Inventory, Beck Depression Inventory (least squares, mean ± SD) | (1) 1.0 ± 0.79, 14.2 ± 11.7, N = 30, (2) 1.1 ± 0.93, 15.6 ± 12.0, N = 30, (3) 1.1 ± 0.79, 15.0 ± 12.1, N = 30 | (1) Unclear, Unclear, N = 21 [70.0%], (2) Unclear, Unclear, N = 24 [80.0%], (3) Unclear, Unclear, N = 22 [73.3%] | (1) vs (2) P value > 0.05; (1) vs (3) P value > 0.05; (2) vs (3) P value > 0.05 |
| Carroll 2006, (1) MET + CBT + CM‐abs, + CM‐adh, (2) DC + CM‐abs + CM‐adh, (3) MET + CBT, (4) DC | Addiction Severity Index composite scores (data not shown) | (1) Unclear, N = 33, (2) Unclear, N = 34, (3) Unclear, N = 36, (4) Unclear, N = 33 | (1) Unclear, N = 27 [81.8%], (2) Unclear, N = 24 [70.6%], (3) Unclear, N = 27 [75.0%], (4) Unclear, N = 30 [90.9%] | (1) vs (2) P value > 0.05; (1) vs (3) P value > 0.05; (1) vs (4) P value > 0.05; (2) vs (3) P value > 0.05; (3) vs (4) P value = 0.05 [for the ‘legal’ score across FU]; (2) vs (4) P value > 0.05 |
| Copeland 2001, (1) CBT [6‐session], (2) CBT [1‐session], (3) DTC | Symptom Checklist‐90 Global Severity Index (mean ± SD) | (1) 0.7 ± 0.3, N = 78, (2) 0.7 ± 0.4, N = 82, (3) 0.7 ± 0.3, N = 69 | (1) 0.6 ± 0.3, N = 58 [74.4%], (2) 0.5 ± 0.4, N = 61 [74.4%], (3) 0.6 ± 0.4, N = 52 [75.4%] | (1) vs (2) P value > 0.05; (1) vs (3) P value > 0.05; (2) vs (3) P value > 0.05 |
| Edwards 2006, (1) DC, (2) TAU | BPRS‐E, BPRS‐PS, SANS, BDI‐SF, SOFAS, KAPQ (mean ± SD) | (1) 49.9 ± 16.3, 10.3 ± 5.4, 28 ± 16, 10.4 ± 6.6, 48.7 ± 17.2, 21.2 ± 3.9, N = 23, (2) 48.8 ±1 7, 10.8 ± 5.2, 24.7 ± 13.6, 8.8 ± 8.1, 49.8 ± 14.8, 20.3 ± 5.4, N = 24 | (1) 45.6 ± 13.5, 9.4 ± 4.6, 23.7 ± 17.2, 7.5 ± 6.3, 51.7 ± 18.3, 22.4 ± 4.0, N = 16 [69.6%], (2) 44.8 ± 15.4, 8.8 ± 4.8, 19.4 ± 13.5, 6.3 ± 7.2, 56.4 ± 15.9, 21.5 ± 4.1, N = 17 [70.8%] | (1) vs (2) all P value > 0.05 |
| Hoch 2012, (1) MET + CBT, (2) DTC | Brief Symptom Inventory, disability days in the prior month using the M‐CIDI (mean ± SD) | (1) 0.9 ± 0.6, 9.4 ± 10.2, N = 90, (2) 0.9 ± 0.5, 6.6 ± 8.7, N = 32 | (1) 0.4 ± 0.4, 3.2 ± 5.9, N = 79 [87.8%], (2) 0.7 ± 0.5, 6.5 ± 9.6, N = 31 [96.9%] | (1) vs (2) P value > 0.05, P value < 0.05 |
| Kadden 2007, (1) MET + CBT + CM‐abs, (2) MET + CBT, (3) CM‐abs, (4) Health education | Psychiatric composite score from the Addiction Severity Index (mean ± SD) | (1) 0.25 ± 0.19, N = 63, (2) 0.24 ± 0.20, N = 61, (3) 0.25 ± 0.21, N = 54, (4) 0.22 ± 0.23, N = 62 | (1) Unclear, N = 51 [81.0%], (2) Unclear, N = 49 [80.3%], (3) Unclear, N = 48 [88.9%], (4) Unclear, N = 52 [83.9%] | (1) vs (2) P value > 0.05; (1) vs (3) P value > 0.05; (1) vs (4) P value > 0.05; (2) vs (3) P value > 0.05; (3) vs (4) P value > 0.05; (2) vs (4) P value > 0.05 |
| Madigan 2013, (1) MET + CBT, (2) TAU | Insight composite of the BIS, SAPS, SANS, CDSS, GAF, WHOQOL (mean ± SD) | (1) 6.8 ± 2.8, 5.4 ± 4.0, 7.7 ± 3.1, 5.1 ± 5.7, 38.3 ± 13.1, 12.5 ± 4.0, N = 59, (2) 6.3 ± 2.7, 5.7 ± 4.8, 7.4 ± 3.0, 5.0 ± 6.4, 38.0 ± 9.0, 13.3 ± 2.8, N = 29 | (1) 7.0 ± 2.9, 4.9 ± 4.0, 4.6 ± 3.0, 4.3 ± 4.4, 37.6 ± 8.34, 12.6 ± 3.4, N = 32 [54.2%], (2) 6.6 ± 1.5, 5.1 ± 4.2, 4.8 ± 3.2, 4.3 ± 4.2, 37.2 ± 11.5, 11.1 ± 2.9, N = 19 [65.5%] | (1) vs (2) all P value > 0.05, except for the WHOQOL at P value = 0.05 |
| MTPRG 2004, (1) MET + CBT, (2) MET, (3) Assessed control | Beck Depression Inventory, STAI‐S (mean ± SD) | (1) 11.39 ± 7.00, 39.87 ± 11.62, N = 156, (2) 13.21 ± 8.60, 41.61 ± 12.19, N = 146, (3) 10.09 ± 7.35, 37.29 ± 11.53, N = 148 | (1) 7.34 ± 8.29, 33.61 ± 11.32, N = 129 [82.7%], (2) 10.16 ± 9.36, 38.85 ± 12.66, N = 120 [82.2%], (3) 7.87 ± 6.78, 35.50 ± 11.21, N = 137 [92.6%] | (1) vs (2) P value > 0.05, P value < 0.05 at 4 month FU only; (1) vs (3) P value > 0.05, P value < 0.05; (2) vs (3) P value > 0.05, P value > 0.05 |
* Unless otherwise indicated, significant treatment outcomes favour the group with the lower number; exact P values are reported when provided
BDI‐SF: Beck Depression Inventory‐Short Form
BIS: Birchwood Insight Scale
BPRS‐E: Brief Psychiatric Rating Scale‐Expanded
BPRS‐PS: Brief Psychiatric Rating Scale‐Positive Symptom subscale
CBT: Cognitive‐behavioural therapy
CDSS: Calgary Depression Scale for Schizophrenia
CM‐abs: Contingency management with vouchers presented for negative urine
CM‐adh: Contingency management with vouchers presented for treatment attendance/adherence
DC: Drug counselling
DTC: Delayed treatment control
EoT: End of treatment
FU: Follow‐up
GAF: Global Assessment of Functioning scale
KAPQ: Knowledge About Psychosis Questionnaire
M‐CIDI: Munich‐Composite International Diagnostic Interview
MET: Motivational enhancement therapy
PANSS: Positive and Negative Syndrome Scale
SANS: Scale for the Assessment of Negative Symptoms
SAPS: Scale for the Assessment of Positive Symptoms
SD: Standard deviation
SE: Standard error
SOFAS: Social and Occupational Functioning Scale
TAU: Treatment as usual
WHOQOL: World Health Organization, Quality of Life assessment
Intervention versus treatment as usual
Three studies compared active interventions versus treatment as usual among patients in psychiatric clinics (Bonsack 2011; Edwards 2006; Madigan 2013). No significant intervention effect was found at final follow‐up.
Intervention versus intervention
Several trials included comparisons between two active treatments; all reported no significant between‐group differences on a variety of measures of mental health by final follow‐up (see Table 10).
Summary of mental health
Evidence of an intervention effect on participant mental health was limited by the small number of studies investigating this outcome (10 studies). In summary, given the lack of effectiveness of any particular intervention over time, it is difficult to make treatment recommendations for improving mental health without further research. A further summary of units of measurement and all included study findings regarding the impact of intervention and control on participant mental health from baseline to follow‐up is provided in Table 10.
Discussion
A total of 23 studies, with a total of 4045 participants, met the inclusion criteria for this review. Several different treatment styles were examined, with the weight of evidence focusing on motivational enhancement therapy (MET) and cognitive‐behavioural therapy (CBT) interventions. Although moderate evidence indicates that significant reductions in cannabis use frequency are likely in the short term (within six months), complete abstinence was not often attained. Moreover, treatment was not consistently effective in reducing cannabis‐related problems or in addressing secondary outcomes such as other substance use and mental health concerns. Available evidence was most supportive of MET + CBT‐based interventions of greater intensity and longer duration (more than four sessions, delivered over more than one month). It is likely that complementing these treatments with contingency management with vouchers presented for negative urine (CM‐abs) will enhance effects on outcomes in the short term, but little evidence suggests that this addition would improve results over the long term (nine months onwards).
Summary of main results
For comparison of any intervention versus inactive control, frequency of cannabis use was most consistently assessed by all included trials. Each trial reported a significant reduction in cannabis use, and moderate evidence indicates that those receiving any intervention reported fewer days of cannabis use compared with those given inactive control through four‐month follow‐up. In contrast, scant evidence indicates that just over one‐third of intervention participants reported point‐prevalence abstinence immediately post treatment, and that this proportion was reduced as the follow‐up period increased to approximately one in four at final follow‐up. Studies typically confirmed these abstinence rates by using bioanalysis (urine and hair samples). For those who achieved abstinence but relapsed later, the period of abstinence was reported to last approximately one month. In addition, scant evidence suggests that participants who received any intervention reported fewer symptoms of cannabis dependence and fewer cannabis‐related problems compared with those given inactive control through four‐month follow‐up. Further, very little evidence suggested a treatment effect on the number of joints used per day of use when those receiving intervention reported fewer joints at up to approximately eight‐month follow‐up compared with those given inactive control. Little evidence was found on the effect of treatment over inactive control post eight‐month follow‐up. Heterogeneity in measurement of secondary outcomes prevented meta‐analysis, but little evidence showed any treatment effect over inactive control conditions on motivation to quit cannabis use, non‐cannabis substance use or mental health concerns. Finally, moderate evidence indicates that participants were likely to complete treatment as intended.
For any intervention versus treatment as usual, three included studies assessed intervention effect versus treatment as usual among patients at out‐patient psychiatric clinics. Investigators found no evidence of between‐group differences across these trials at final follow‐up on any of the primary or secondary treatment outcomes included in this review.
For intervention versus intervention, studies made few direct comparisons between intervention types, but MET + CBT interventions were most consistently effective compared with alternative treatments with regards to reductions in cannabis use frequency and symptoms of dependence. Moreover, meta‐analyses of primary outcomes found that MET + CBT interventions outperformed MET and CBT interventions delivered individually. Notably, two studies found that this type of intervention showed even greater effect on frequency of cannabis use when paired with CM‐abs adjunct treatment (Budney 2000; Carroll 2006). Finally, additional subgrouping showed that intensive interventions (more than four sessions or delivered over longer than one month) had greater treatment effect on each primary outcome compared with less intensive interventions. Little evidence was found to support one intervention over another with regards to all other investigated outcomes over the long term (particularly from nine‐month follow‐up onward).
In summary, despite an obvious need for future treatment comparisons that include greater focus on outcomes beyond frequency of cannabis use, available evidence shows the most consistent support for MET + CBT‐based cannabis interventions with the adjunct of CM‐abs when possible. Although it was not possible to determine an ideal number of sessions or treatment duration, evidence most consistently supported more intense and longer interventions over less intense and shorter counterparts. Given this finding, it is noteworthy that among experimental arms, an average of just six sessions was provided across trials, indicating that included interventions appear to favour brevity over intensity.
Overall completeness and applicability of evidence
This review was limited by a small number of studies on similar treatment types showing great heterogeneity (preventing any meta‐analysis), relatively few studies assessing treatment outcomes beyond six months and, finally, the fact that participants who were not frequent cannabis users were excluded from this review (thus, treatment trials for occasional users were excluded). In summary, review authors believe that this review update was produced through an unbiased process limited only by the adequacy of reporting in included studies. Despite reportedly successful delivery of each treatment in a research setting, the included studies suffered from serious limitations, which reduced the external validity of included treatment types and hampered recommendations of a particular treatment type. The most serious of these limitations are discussed here.
Although the range of included intervention types showed some breadth, MET‐ and CBT‐based interventions were prevalent, and more modern treatment types such as mindfulness techniques or acceptance commitment therapy were largely absent.
Great heterogeneity across studies was evident in assessment procedures chosen and measures used to assess primary (most notably, cannabis‐related problems) and secondary treatment outcomes (most notably, mental health concerns). Among the treatment outcomes noted in this review, only frequency of cannabis use and severity of cannabis use disorder shared relatively common measures across studies and were most impacted by treatment.
Included participants were typically white Caucasian males in their late twenties to early thirties. These features describe the typical cannabis treatment seeker, and the handful of trials that addressed this limitation reported no significant differences in treatment outcomes by gender or age. In contrast, the only study that addressed ethnicity when assessing treatment outcomes found that interventions including contingency management were significantly less effective among black than white participants, and that black participants were significantly less likely to complete all treatment sessions (Carroll 2006). Despite this, two separate trials, which included African American participants as the majority, found significant treatment effects on cannabis use over the long term (Bernstein 2009; Carroll 2012). The applicability of treatments to females, older adults and non‐Caucasian individuals is less clear.
Although the sample size of individual treatment groups was adequate across trials (n = 64.2 on average), and although most participants completed treatment as intended, an important minority of sessions were not completed. Whether reported treatment outcomes reflect those receiving the full complement of treatment or simply most of the treatment remains unclear. Indeed, only one trial found a significant association between treatment completers and improved outcomes compared with non‐completers. Future research is required to delineate the importance of treatment completion as compared with moderate to high attendance.
Only a handful of studies assessed participants' previous experience with cannabis treatment or previous attempts at quitting cannabis. Although it was unclear whether these studies directly investigated the impact of previous quit attempts, no study indicated that such experience had a significant impact on treatment outcomes.
Few included trials were conducted outside the USA, leaving the applicability of treatments to other cultures relatively unclear. On this basis, the external validity of included trials was rated as weak.
No study excluded participants on the basis of their use of tobacco, and only five studies assessed the status of tobacco use at baseline. Information on tobacco use during the trial period was provided by three studies; none found any intervention effect or change in tobacco use across follow‐up (Hoch 2014; Kadden 2007; Roffman 1988). No study provided specific information concerning how tobacco use was addressed during cannabis treatment. This lack of information on tobacco use is a matter of concern as outcomes of cannabis use treatment have been shown elsewhere to be significantly moderated by tobacco use (Agrawal 2012).
Quality of the evidence
As shown in Table 1, the validity of the included trials was very low to moderate. The quality of evidence for the primary outcomes of cannabis use frequency and quantity and cannabis‐related problems was typically impacted by lack of assessment of non‐cannabis substance use or by use of additional treatments before or during the trial period. Across trials, performance and detection bias was a matter of concern, as participant blinding was not possible and researcher blinding was often left unclear or not reported. With the exception of assessment of dependence severity, data conversions were necessary to standardise outcome assessments. Also, with the exception of days of cannabis use, conversion to standardised mean differences was required for each of the primary outcomes because heterogeneity was noted in the measures used.
Notably, the few trials that assessed tobacco smoking found that smoking was prevalent but did not prevent a significant intervention effect on cannabis use frequency. Further, among the few trials that assessed use of additional treatments, the prevalence of accessing additional treatments during the trial period was found to be low. In addition, no trial was at high risk of selection bias because investigators used appropriate randomisation and participant allocation procedures. Similarly, it was common for the included studies to address trial drop‐out by providing appropriate analyses and plans and reporting all pre‐specified treatment outcomes, and no trial had high risk of attrition and reporting bias. Finally, the included trials recruited a large number of participants (total of n = 4045) and provided excellent training and supervision of therapists to ensure treatment fidelity.
Potential biases in the review process
Strengths of this review include use of two independent review authors (who did not have a financial interest in the outcome) in the processes of study selection, data collection and analysis and a strong likelihood that all relevant studies were identified (as per detailed search criteria).
Agreements and disagreements with other studies or reviews
Three relevant previous systematic reviews of cannabis treatments have been conducted, although one focused on prevention programmes specifically targeting adolescent cannabis use within schools as opposed to intervention programs (Tobler 1999). The two remaining reviews examined community‐delivered treatments for adolescent cannabis users (Bender 2011) and psychosocial interventions for individuals who were actively seeking treatment (excluding non‐treatment seekers with problematic use; Davis 2014). Treatments with best evidence for adolescent cannabis users included family members, such as multi‐dimensional family therapy (Bender 2011). In this meta‐analytical review, MET‐based interventions were comparable with family‐oriented interventions, and each had moderate treatment effects that waned after 12‐month follow‐up. Consistent with these results, the current review highlighted support for MET interventions but did not include family‐based interventions. Further, outcomes were seen to wane over time but perhaps earlier at post six‐ to nine‐month follow‐up. In the remaining review, behavioural therapies (including MET, CBT and CM) were found to be more effective over inactive control among adult treatment seekers, but review authors found no significant differences in treatment intensityand noted that only approximately one in two participants achieved abstinence (Davis 2014). Consistent with these results, the weight of evidence in the current review supports MET + CBT‐based interventions, and at treatment end, abstinence rates were comparably low, with an average of just over one in three participants achieving abstinence. In contrast, the current review identified consistency in studies that compared treatments of differing intensity and showed greater support for more intense treatments.
Authors' conclusions
Implications for practice.
Included studies were heterogeneous in many aspects, and important questions regarding the most effective duration, intensity and type of intervention have been raised and partially resolved. The generalisability of findings is unclear, most notably because of the limited number of localities and the homogeneous samples of treatment seekers. The rate of abstinence was low and unstable but was comparable with treatments for other substance use. Psychosocial intervention, when compared with minimal treatment controls, was found to reduce frequency of use and severity of dependence in a fairly durable manner, at least over the short term. Among the included intervention types, an intensive intervention of more than four sessions based on the combination of MET and CBT with abstinence‐based incentives was most consistently supported for treatment of cannabis use disorder.
In addition, studies that assessed the impact of combining CM‐abs treatment with CBT‐based or MET + CBT‐based interventions suggest that this may enhance outcomes during treatment (although these improvements tend to wane during assessments after treatment).
Studies that included MET or CBT treatments consistently recommended use of MET, particularly for individuals with low motivation who are just beginning treatment (MET + CBT interventions typically focus first sessions on MET and move into CBT), and CBT for those more established in treatment with greater motivation to abstain from use. The three studies that included participants with severe psychiatric conditions did not report significant improvement in primary or secondary treatment outcomes at final follow‐up. Thus, cannabis treatment combined with treatment as usual may not be essential, although future research is warranted to confirm this.
Implications for research.
Response rates, particularly regarding abstinence from cannabis and reduction in cannabis‐related problems, leave much room for improvement. Studies comparing different therapeutic modalities raise important questions about optimal duration, intensity and type of treatment. Generalisability of findings is also unknown, as the included studies were conducted at a limited number of localities and with fairly homogeneous samples of treatment seekers. Future studies should address longer‐term outcomes and should assess cannabis use and related problems by using consistent measures while better assessing other substance use (type of substance use, frequency, quantity) and the mental health of participants. To enhance consistency in outcome measurement, we suggest that future studies assess each of the primary outcomes discussed in this review, with cannabis use frequency assessed across at least a one‐month period, quantity assessed by joints per day across one week or longer, severity of dependence assessed via assessment of the number of dependence symptoms and a scale such as the Addiction Severity Index (McLellan 1980) or Severity of Dependence Scale (Swift 1998) and cannabis‐related problems evaluated on a scale such as the Marijuana Problems Scale (Stephens 2000) or the Cannabis Problems Questionnaire (Copeland 2005). Additional analyses of therapy session processes in relation to outcomes may shed some light on important aspects of the interventions. To assist with this, future studies could consider dismantling designs in which hypothesised active components of the interventions are offered individually or in specific combinations and are compared with appropriate attention‐placebo controls. At the time of this review, no proven medications are available for the treatment of cannabis use disorder (Marshall 2014), but this is an emerging field, and future studies should explore whether a desirable synergistic effect is evident between pharmacotherapy and psychotherapy combinations. No included study provided specific information on how concurrent tobacco use should be treated, and this raises an important topic for future research. The question of best treatment for those with concomitant tobacco dependence remains unanswered. With current changes to cannabis legislation throughout the world, particularly in the United States, future research including patients from settings where cannabis is legal will allow comparisons to determine whether any consequences of cannabis use are related more to the illegal status of the drug than to the substance per se. Finally, as no included study that recruited participants from healthcare settings who were not initially seeking cannabis treatment found any significant long‐term effects of treatment, further study is required before treatment recommendations can be made for this group.
What's new
| Date | Event | Description |
|---|---|---|
| 17 January 2020 | Amended | Minor amendment in plain language summary |
History
Protocol first published: Issue 3, 2005 Review first published: Issue 3, 2006
| Date | Event | Description |
|---|---|---|
| 18 April 2017 | Amended | Minor amendment in plain language summary |
| 3 May 2016 | New citation required and conclusions have changed | Complete revision with new review author team |
| 3 May 2016 | New search has been performed | New search has been performed |
| 18 June 2013 | Amended | Review withdrawn from publication |
| 1 September 2009 | New search has been performed | Major update |
| 27 March 2008 | Amended | Converted to new review format |
| 21 April 2006 | New citation required and conclusions have changed | Substantive amendments |
| 29 April 2005 | New search has been performed | Minor update |
Notes
None.
Acknowledgements
None.
Appendices
Appendix 1. CENTRAL search strategy
1. MeSH descriptor: [Substance‐Related Disorders] explode all trees
2. (cannabis* or marijuana or marihuana or hashish):ti,ab
3. #1 and #2
4. MeSH descriptor: [Marijuana Abuse] explode all trees
5. ((cannabis* or marijuana or marihuana or hashish) near/3 (abuse* or addict* or depend* or disorder* or use*)):ti,ab
6. MeSH descriptor: [Marijuana Smoking] this term only
7. #3 or #4 or #5 or #6
8. (psychotherapy):ti,ab,kw
9. (behav* near therap*):ti,ab,kw
10. (motivational near enhancement):ti,ab,kw
11. (motivational near interview*):ti,ab,kw
12. (famil* near therap*):ti,ab,kw
13. (social or sociala or sociale or sociales or sociate or sociallis or socialisation or socialise or socialising or socialist or sociality or socialization or socialize or socialized or socializes or socializing or socializzazione or socially or socialmedicin or socialmedicinsk or socialni or socialsektoren or socialstyrelsen or socialwork):ti,ab,kw
14. (cognitive near therap*):ti,ab,kw
15. psychotherap*:ti,ab,kw
16. intervention:ti,ab,kw
17. treatment:ti,ab,kw
18. psychoso*:ti,ab,kw
19. #8 or #9 or #10 or #11 or #12 or #13 or #14 or #15 or #16 or #17 or #18
20. #7 and #19
Appendix 2. MEDLINE search strategy
1. exp marijuana abuse/
2. (cannabis adj abuse$).ab,ti.
3. 1 or 2
4. exp Cannabis/
5. cannabis.ab,ti.
6. marijuana.ab,ti.
7. hashish.mp.
8. 4 or 5 or 6 or 7
9. exp psychotherapy/
10. psychotherap$.ab,ti.
11. psychoso$.ab,ti.
12. intervention.ab,ti.
13. treatment.ab,ti.
14. (psychodynamic adj2 therap$).ab,ti.
15. exp behaviour therapy/
16. (behaviour adj2 therap$).ab,ti.
17. (behav$ adj2 management).ab,ti.
18. (cognitive$ adj2 therap$).ab,ti.
19. exp Counseling/
20. counsel$.ab,ti.
21. (relaxation adj2 therap$).ab,ti.
22. (guided adj2 imagery).ab,ti.
23. biofeedback.tw.
24. (family adj2 therap$).ab,ti.
25. 9 or 10 or 11 or 12 or 13 or 14 or 15 or 16 or 17 or 18 or 19 or 20 or 21 or 22 or 23 or 24
26. 3 and 8 and 25
Appendix 3. EMBASE search strategy
1.exp drug abuse/ 2.exp cannabis addiction/ 3.(drug or substance$) adj (misuse or abuse$ or addict$ or dependen$).ti,ab 4.1 or 2 or 3 5.exp cannabis/ 6.cannabis$.ti,ab 7.mari?uana.ti,ab 8.5 or 6 or 7 9.exp psychotherapy/ 10.psychotherap$.ti,ab 11.psychodynamic adj2 therap$).ti,ab 12. psychoso$.ti,ab.
13. (behaviour adj2 therap$).ti,ab 14.(behav$ adj2 management).ti,ab 15. (cognitive$ adj2 therap$).ti,ab 16. (cognitiv$ adj2 behavio$).ti,ab 17. motivational interview$.ti,ab.
18. motivational enhance$.ti,ab.
19. exp motivation/ 20. (famil$ adj2 therap$).ti,ab 21. exp social support/ 22. 9 or 10 or 11 or 12 or 13 or 14 or 15 or 16 or 17 or 18 or 19 or 20 or 21 23. 4 and 8 and 22
Appendix 4. CINAHL search strategy
1.exp "substance use disorders"/ 2.(drug or substance$) adj2 (misuse or abuse$ or addict$ or dependen$).ti,ab 3.(cannab$ adj2 abuse$).ti,ab 4.1 or 2 or 3 5. cannabis.ti,ab
6.(marijuana or marihuana).ti,ab
7. exp Cannabis/ 8.5 or 6 or 7 9. exp psychotherapy/ 10.psychotherapy$.ti,ab
11. psychoso$.ti,ab 12.(behav$ adj2 therap$).ti,ab 13.(cognitive adj2 therap$).ti,ab 14. (family therap$).ti,ab 15. exp social networks/ 16. exp support, psychosocial/ 17. exp treatment/
18. exp intervention/
19. 9 or 10 or 11 or 12 or 13 or 14 or 15 or 16 or 17 or 18 20. 4 and 8 and 19
Appendix 5. PsycINFO search strategy
1. cannabis.ti,ab.
2. hashish.ti,ab.
3. marijuana.ti,ab.
4. addic$.ti,ab.
5. 1 or 2 or 3 or 4
6. dependen$.ti,ab.
7. abus$.ti,ab.
8. misuse.ti,ab.
9. 6 or 7 or 8
10. psychotherapy.mp. [mp=title, abstract, heading word, table of contents, key concepts, oringinal title, tests and measures]
11. psychotherapy.de.
12. Adlerian Psychotherapy.de.
13. Analytical Psychotherapy.de.
14. Autogenic Training.de.
15. behaviour Therapy.de.
16. Brief Psychotherapy.de.
17. Client Centered Therapy.de.
18. Cognitive behaviour Therapy.de.
19. Eclectic Psychotherapy.de.
20. Existential Psychotherapy.de.
21. Experiential Psychotherapy.de.
22. Expressive Psychotherapy.de.
23. Gestalt Therapy.de.
24. Group Psychotherapy.de.
25. Guided Imagery.de.
26. Humanistic Psychotherapy.de.
27. Hypnotherapy.de.
28. Individual Psychotherapy.de.
29. Insight Therapy.de.
30. Integrative Psychotherapy.de.
31. Interpersonal Psychotherapy.de.
32. Logotherapy.de.
33. Persuasion Therapy.de.
34. Primal Therapy.de.
35. Psychoanalysis.de.
36. Psychodrama.de.
37. Psychodynamic Psychotherapy.de.
38. Psychotherapeutic Counseling.de.
39. Rational Emotive behaviour Therapy.de.
40. Reality Therapy.de.
41. Relationship Therapy.de.
42. Solution Focused Therapy.de.
43. Supportive Psychotherapy.de.
44. Transactional Analysis.de.
45. Individual Psychotherapy.de.
46. behaviour Modification.de.
47. behaviour Therapy.de.
48. Biofeedback Training.de.
49. Contingency Management.de.
50. Fading Conditioning.de.
51. Intervention.de.
52. Treatment.de.
53. psychoso$.ti,ab.
54. Omission Training.de.
55. Overcorrection.de.
56. Self Management.de.
57. Time Out.de.
58. Cognitive Techniques.de.
59. Cognitive Restructuring.de.
60. Cognitive Therapy.de.
61. Self Instructional Training.de.
62. Outpatient Treatment.mp.
63. Psychotherapeutic Techniques.de.
64. Psychodrama.de.
65. Progressive Relaxation Therapy.de.
66. Sociotherapy.de.
67. Psychosocial Readjustment.de.
68. 10 or 11 or 12 or 13 or 14 or 15 or 16 or 17 or 18 or 19 or 20 or 21 or 22 or 23 or 24 or 25 or 26 or 27 or 28 or 29 or 30 or 31 or 32 or 33 or 34 or 34 or 35 or 36 or 37 or 38 or 39 or 40 or 41 or 42 or 43 or 44 or 45 or 46 or 47 or 48 or 49 or 50 or 51 or 52 or 53 or 54 or 55 or 56 or 57 or 58 or 59 or 60 or 61 or 62 or 63 or 64 or 65 or 66 or 67
70. 5 and 9 and 68
Appendix 6. Criteria for judging risk of bias
| Item | Judgement | Description |
| 1. Random sequence generation (selection bias) | Low risk | Investigators describe a random component in the sequence generation process such as random number table; computer random number generator; coin tossing; shuffling of cards or envelopes; throwing of dice; drawing of lots; minimisation |
| High risk | Investigators describe a non‐random component in the sequence generation process such as odd or even date of birth; date (or day) of admission; hospital or clinic record number; alternation; judgement of the clinician; results of a laboratory test or series of tests; availability of the intervention | |
| Unclear risk | Insufficient information about the sequence generation process to permit judgement of low or high risk | |
| 2. Allocation concealment (selection bias) | Low risk | Investigators enrolling participants could not foresee assignment because one of the following, or an equivalent method, was used to conceal allocation: central allocation (including telephone, web‐based and pharmacy‐controlled, randomisation); sequentially numbered drug containers of identical appearance; sequentially numbered, opaque, sealed envelopes |
| High risk | Investigators enrolling participants could possibly foresee assignments because one of the following methods was used: open random allocation schedule (e.g. a list of random numbers); assignment envelopes without appropriate safeguards (e.g. envelopes were unsealed or nonopaque or were not sequentially numbered); alternation or rotation; date of birth; case record number; any other explicitly unconcealed procedure | |
| Unclear risk | Insufficient information to permit judgement of low or high risk. This is usually the case if the method of concealment is not described or is not described in sufficient detail to allow a definitive judgement | |
| 3. Blinding of participants and providers (performance bias) Objective outcomes |
Low risk | No blinding or incomplete blinding, but review authors judge that the outcome is not likely to be influenced by lack of blinding Blinding of participants and key study personnel ensured, and unlikely that the blinding could have been broken |
| High risk | No blinding or incomplete blinding, and the outcome is likely to be influenced by lack of blinding Blinding of key study participants and personnel attempted, but likely that the blinding could have been broken, and the outcome is likely to be influenced by lack of blinding |
|
| Unclear risk | Insufficient information to permit judgement of low or high risk | |
| 4. Blinding of participants and providers (performance bias) Subjective outcomes |
Low risk | Blinding of participants and providers ensured and unlikely that the blinding could have been broken |
| High risk | No blinding or incomplete blinding, and the outcome is likely to be influenced by lack of blinding Blinding of key study participants and personnel attempted, but likely that the blinding could have been broken, and the outcome is likely to be influenced by lack of blinding |
|
| Unclear risk | Insufficient information to permit judgement of low or high risk | |
| 5. Blinding of outcome assessor (detection bias) Objective outcomes |
Low risk | Study included collateral reports by friends or family, or bioanalysis of urine, to verify subjective participant self report. Review authors judged that this measurement was not likely to be influenced by lack of blinding Blinding of outcome assessment ensured, and unlikely that the blinding could have been broken |
| High risk | Study included collateral reports by friends or family, or bioanalysis of urine, to verify subjective participant self report. Review authors judge that this measurement had no blinding, and the outcome measurement is likely to be influenced by lack of blinding Blinding of outcome assessment, but likely that the blinding could have been broken, and the outcome measurement is likely to be influenced by lack of blinding |
|
| Unclear risk | Study did not include collateral reports by friends or family, or bioanalysis of urine, to verify subjective participant self report, or information was insufficient to permit judgement of low or high risk | |
| 6.Blinding of outcome assessor (detection bias) Subjective outcomes |
Low risk | Blinding of outcome assessment ensured, and unlikely that the blinding could have been broken |
| High risk | No blinding of outcome assessment, and the outcome measurement is likely to be influenced by lack of blinding Blinding of outcome assessment, but likely that the blinding could have been broken, and the outcome measurement is likely to be influenced by lack of blinding |
|
| Unclear risk | Insufficient information to permit judgement of low or high risk | |
| 7. Incomplete outcome data (attrition bias) For all outcomes except retention in treatment or drop‐out |
Low risk | No missing outcome data Reasons for missing outcome data unlikely to be related to true outcome (for survival data, censoring unlikely to be introducing bias) Missing outcome data balanced in numbers across intervention groups, with similar reasons for missing data across groups For dichotomous outcome data, the proportion of missing outcomes compared with observed event risk not enough to have a clinically relevant impact on the intervention effect estimate For continuous outcome data, plausible effect size (differences in means or standardised differences in means) among missing outcomes not enough to have a clinically relevant impact on observed effect size Missing data have been imputed using appropriate methods All randomised participants are reported/analysed in the group to which they were allocated by randomisation, irrespective of non‐compliance and co‐interventions (intention to treat) |
| High risk | Reason for missing outcome data likely to be related to true outcome, with imbalance in numbers or reasons for missing data across intervention groups For dichotomous outcome data, the proportion of missing outcomes compared with observed event risk enough to induce clinically relevant bias in intervention effect estimate For continuous outcome data, plausible effect size (differences in means or standardised differences in means) among missing outcomes enough to induce clinically relevant bias in observed effect size ‘As‐treated’ analysis done with substantial departure of the intervention received from that assigned at randomisation |
|
| Unclear risk | Insufficient information to permit judgement of low or high risk (e.g. number randomised not stated, no reasons for missing data provided; number of drop‐outs not reported for each group) | |
| 8 Selective reporting (reporting bias) | Low risk | Study protocol is available, and all of the study’s pre‐specified (primary and secondary) outcomes of interest in the review have been reported in the pre‐specified way Study protocol is not available, but it is clear that published reports include all expected outcomes, including those that were pre‐specified (convincing text of this nature may be uncommon) |
| High risk | Not all of the study’s pre‐specified primary outcomes have been reported One or more primary outcomes are reported by measurements, analysis methods or subsets of data (e.g. subscales) that were not pre‐specified One or more reported primary outcomes were not pre‐specified (unless clear justification for their reporting is provided, such as an unexpected adverse effect) One or more outcomes of interest in the review are reported incompletely so that they cannot be entered in a meta‐analysis Study report fails to include results for a key outcome that would be expected to have been reported for such a study |
|
| Unclear risk | Insufficient information to permit judgement of low or high risk | |
| 9. Other bias | Low risk | At least 4 of the following: (1) other substance use was assessed before and during the trial period; (2) use of additional treatments was assessed before and during the trial period; (3) treatment fidelity was assessed; (4) most intervention participants completed treatment as intended; (5) participant demographics were assessed; (6) pre‐intervention cannabis use history was assessed; (7) previous experience with cannabis treatments was assessed; (8) no between‐group differences were noted at baseline in assessed participant demographics or cannabis use‐related variables; and (9) chosen measures of cannabis use and related problems were reliable and with good internal consistency |
| High risk | Fewer than 4 of the 9 criteria describing low risk were reported | |
| Unclear risk | Insufficient information to permit judgement of low or high risk (e.g. the article did not report on intervention completion rates or which assessments were made during the trial period) |
Data and analyses
Comparison 1. Intervention versus inactive control.
| Outcome or subgroup title | No. of studies | No. of participants | Statistical method | Effect size |
|---|---|---|---|---|
| 1 Reductions in cannabis use frequency at short‐term follow‐up | 6 | 1144 | Mean Difference (IV, Random, 95% CI) | 5.67 [3.08, 8.26] |
| 2 Reduction in cannabis use frequency at short‐term follow‐up (intervention intensity) | 6 | 1144 | Mean Difference (IV, Random, 95% CI) | 6.39 [4.01, 8.78] |
| 2.1 Low‐intensity intervention | 6 | 763 | Mean Difference (IV, Random, 95% CI) | 4.58 [2.65, 6.50] |
| 2.2 High‐intensity intervention | 3 | 381 | Mean Difference (IV, Random, 95% CI) | 10.02 [7.69, 12.34] |
| 3 Reduction in cannabis use frequency at short‐term follow‐up (intervention type) | 6 | 1144 | Mean Difference (IV, Random, 95% CI) | 6.34 [3.80, 8.88] |
| 3.1 MET | 4 | 612 | Mean Difference (IV, Random, 95% CI) | 4.45 [1.90, 7.00] |
| 3.2 CBT | 1 | 134 | Mean Difference (IV, Random, 95% CI) | 10.94 [7.44, 14.44] |
| 3.3 MET + CBT | 3 | 398 | Mean Difference (IV, Random, 95% CI) | 7.38 [3.18, 11.57] |
| 4 Point‐prevalence abstinence at short‐term follow‐up | 6 | 1166 | Risk Ratio (M‐H, Random, 95% CI) | 2.55 [1.34, 4.83] |
| 5 Point‐prevalence abstinence at short‐term follow‐up (intervention intensity) | 6 | 1166 | Risk Ratio (M‐H, Random, 95% CI) | 1.96 [1.20, 3.21] |
| 5.1 Low‐intensity intervention | 4 | 435 | Risk Ratio (M‐H, Random, 95% CI) | 0.92 [0.51, 1.66] |
| 5.2 High‐intensity intervention | 5 | 731 | Risk Ratio (M‐H, Random, 95% CI) | 3.09 [2.23, 4.29] |
| 6 Point‐prevalence abstinence at short‐term follow‐up (intervention type) | 6 | 1166 | Risk Ratio (M‐H, Random, 95% CI) | 2.17 [1.24, 3.80] |
| 6.1 MET | 1 | 197 | Risk Ratio (M‐H, Random, 95% CI) | 1.19 [0.43, 3.28] |
| 6.2 CBT | 1 | 171 | Risk Ratio (M‐H, Random, 95% CI) | 4.81 [1.17, 19.70] |
| 6.3 MET + CBT | 5 | 798 | Risk Ratio (M‐H, Random, 95% CI) | 2.17 [1.10, 4.32] |
| 7 Reduction in joints per day at short‐term follow‐up | 8 | 1600 | Std. Mean Difference (IV, Random, 95% CI) | 3.55 [2.51, 4.59] |
| 8 Reduction in joints per day at short‐term follow‐up (intervention intensity) | 8 | 1600 | Std. Mean Difference (IV, Random, 95% CI) | 3.71 [2.71, 4.71] |
| 8.1 Low‐intensity intervention | 6 | 752 | Std. Mean Difference (IV, Random, 95% CI) | 2.70 [1.69, 3.70] |
| 8.2 High‐intensity intervention | 6 | 848 | Std. Mean Difference (IV, Random, 95% CI) | 4.74 [3.49, 6.00] |
| 9 Reduction in joints per day at short‐term follow‐up (intervention type) | 8 | 1600 | Std. Mean Difference (IV, Random, 95% CI) | 3.90 [2.82, 4.98] |
| 9.1 MET | 4 | 611 | Std. Mean Difference (IV, Random, 95% CI) | 3.17 [2.67, 3.66] |
| 9.2 CBT | 2 | 306 | Std. Mean Difference (IV, Random, 95% CI) | 3.40 [‐1.05, 7.84] |
| 9.3 MET + CBT | 4 | 683 | Std. Mean Difference (IV, Random, 95% CI) | 4.88 [3.14, 6.62] |
| 10 Reduction in symptoms of dependence at short‐term follow‐up | 4 | 889 | Std. Mean Difference (IV, Random, 95% CI) | 4.15 [1.67, 6.63] |
| 11 Reduction in symptoms of dependence at short‐term follow‐up (intervention intensity) | 4 | 889 | Std. Mean Difference (IV, Random, 95% CI) | 5.56 [2.73, 8.39] |
| 11.1 Low‐intensity intervention | 3 | 370 | Std. Mean Difference (IV, Random, 95% CI) | 2.83 [0.41, 5.24] |
| 11.2 High‐intensity intervention | 3 | 519 | Std. Mean Difference (IV, Random, 95% CI) | 8.37 [2.51, 14.23] |
| 12 Symptoms of dependence at short‐term follow‐up (intervention type) | 4 | 889 | Std. Mean Difference (IV, Random, 95% CI) | 6.32 [3.15, 9.50] |
| 12.1 MET | 2 | 316 | Std. Mean Difference (IV, Random, 95% CI) | 4.07 [1.97, 6.17] |
| 12.2 MET + CBT | 3 | 573 | Std. Mean Difference (IV, Random, 95% CI) | 7.89 [0.93, 14.85] |
| 13 Reduction in cannabis‐related problems at short‐term follow‐up | 6 | 2202 | Std. Mean Difference (IV, Random, 95% CI) | 3.34 [1.26, 5.42] |
| 14 Reduction in cannabis‐related problems at short‐term follow‐up (intervention intensity) | 6 | 2202 | Std. Mean Difference (IV, Random, 95% CI) | 3.70 [1.91, 5.49] |
| 14.1 Low‐intensity intervention | 5 | 667 | Std. Mean Difference (IV, Random, 95% CI) | 2.50 [1.01, 3.98] |
| 14.2 High‐intensity intervention | 4 | 1535 | Std. Mean Difference (IV, Random, 95% CI) | 5.14 [2.57, 7.70] |
| 15 Reduction in cannabis‐related problems at short‐term follow‐up (intervention type) | 6 | 2202 | Std. Mean Difference (IV, Random, 95% CI) | 4.11 [2.22, 6.01] |
| 15.1 MET | 4 | 612 | Std. Mean Difference (IV, Random, 95% CI) | 3.29 [1.85, 4.72] |
| 15.2 CBT | 1 | 135 | Std. Mean Difference (IV, Random, 95% CI) | 7.88 [6.86, 8.90] |
| 15.3 MET + CBT | 3 | 1455 | Std. Mean Difference (IV, Random, 95% CI) | 3.85 [‐0.39, 8.10] |
Comparison 2. Intervention versus treatment as usual control.
| Outcome or subgroup title | No. of studies | No. of participants | Statistical method | Effect size |
|---|---|---|---|---|
| 1 Reduction in cannabis use frequency | 2 | 97 | Mean Difference (IV, Random, 95% CI) | 0.13 [‐2.00, 2.27] |
| 2 Reduction in severity of cannabis use disorder | 1 | 33 | Mean Difference (IV, Random, 95% CI) | 0.10 [‐0.82, 1.02] |
Comparison 3. Intervention A versus Intervention B.
| Outcome or subgroup title | No. of studies | No. of participants | Statistical method | Effect size |
|---|---|---|---|---|
| 1 Reduction in cannabis use frequency | 6 | Mean Difference (IV, Random, 95% CI) | Subtotals only | |
| 1.1 RP vs SS | 1 | 97 | Mean Difference (IV, Random, 95% CI) | 5.55 [1.89, 9.21] |
| 1.2 MET vs DC | 1 | 112 | Mean Difference (IV, Random, 95% CI) | 3.99 [0.89, 7.08] |
| 1.3 MET vs CBT | 1 | 179 | Mean Difference (IV, Random, 95% CI) | ‐0.86 [‐3.86, 2.14] |
| 1.4 MET vs MET + CBT | 1 | 31 | Mean Difference (IV, Random, 95% CI) | ‐2.80 [‐9.94, 4.34] |
| 1.5 MET vs MET + CBT + CM‐abs (EoT) | 1 | 30 | Mean Difference (IV, Random, 95% CI) | ‐7.30 [‐13.68, ‐0.92] |
| 1.6 MET vs MET + CBT + CM‐abs | 1 | 266 | Mean Difference (IV, Random, 95% CI) | ‐4.96 [‐7.18, ‐2.74] |
| 1.7 CBT + CM‐abs vs CM‐abs | 1 | 43 | Mean Difference (IV, Random, 95% CI) | 4.9 [‐1.95, 11.75] |
| 1.8 CBT + CM‐adh vs CM‐abs | 1 | 46 | Mean Difference (IV, Random, 95% CI) | ‐0.70 [‐7.61, 6.21] |
| 1.9 CBT + CM‐abs vs CBT + CM‐adh | 1 | 45 | Mean Difference (IV, Random, 95% CI) | 5.60 [‐1.65, 12.85] |
| 2 Point‐prevalence abstinence | 8 | Odds Ratio (M‐H, Fixed, 95% CI) | Subtotals only | |
| 2.1 MET vs MET + CBT | 2 | 301 | Odds Ratio (M‐H, Fixed, 95% CI) | 3.59 [1.80, 7.20] |
| 2.2 MET + CBT vs MET + CBT + CM‐abs + CM‐adh | 1 | 43 | Odds Ratio (M‐H, Fixed, 95% CI) | 0.72 [0.21, 2.50] |
| 2.3 MET + CBT vs DC | 1 | 156 | Odds Ratio (M‐H, Fixed, 95% CI) | 1.38 [0.44, 4.38] |
| 2.4 DC vs DC + CM‐abs + CM‐adh | 1 | 41 | Odds Ratio (M‐H, Fixed, 95% CI) | 0.42 [0.10, 1.81] |
| 2.5 MET + CBT + CM‐abs + CM‐adh vs DC + CM‐abs + CM‐adh | 1 | 40 | Odds Ratio (M‐H, Fixed, 95% CI) | 1.38 [0.38, 5.07] |
| 2.6 MET + CBT vs DC + CM‐abs + CM‐adh | 1 | 39 | Odds Ratio (M‐H, Fixed, 95% CI) | 1.0 [0.26, 3.80] |
| 2.7 MET vs CBT | 1 | 170 | Odds Ratio (M‐H, Fixed, 95% CI) | 0.80 [0.43, 1.47] |
| 2.8 RP vs SS | 1 | 167 | Odds Ratio (M‐H, Fixed, 95% CI) | 1.06 [0.54, 2.08] |
| 2.9 MET + CBT (low intensity) vs MET + CBT (high intensity) | 1 | 64 | Odds Ratio (M‐H, Fixed, 95% CI) | 0.35 [0.03, 4.04] |
| 2.10 CBT + CM‐abs vs CBT + CM‐adh | 1 | 45 | Odds Ratio (M‐H, Fixed, 95% CI) | 1.85 [0.52, 6.62] |
| 2.11 CBT + CM‐abs vs CM‐abs | 1 | 43 | Odds Ratio (M‐H, Fixed, 95% CI) | 2.77 [0.69, 11.19] |
| 2.12 CBT + CM‐adh vs CM‐abs | 1 | 46 | Odds Ratio (M‐H, Fixed, 95% CI) | 1.5 [0.36, 6.23] |
| 2.13 CBT (low intensity) vs CBT (high intensity) | 1 | 119 | Odds Ratio (M‐H, Fixed, 95% CI) | 0.75 [0.30, 1.90] |
| 3 Reduction in joints used per day | 7 | Std. Mean Difference (IV, Random, 95% CI) | Subtotals only | |
| 3.1 MET vs CBT | 1 | 183 | Std. Mean Difference (IV, Random, 95% CI) | ‐1.63 [‐1.97, ‐1.29] |
| 3.2 MET vs MET + CBT + CM‐abs | 1 | 266 | Std. Mean Difference (IV, Random, 95% CI) | 0.22 [‐0.02, 0.46] |
| 3.3 MET vs DC | 1 | 101 | Std. Mean Difference (IV, Random, 95% CI) | 1.81 [1.35, 2.28] |
| 3.4 CBT (low intensity) vs CBT (high intensity) | 1 | 119 | Std. Mean Difference (IV, Random, 95% CI) | ‐3.15 [‐3.69, ‐2.61] |
| 3.5 RP vs SS | 1 | 97 | Std. Mean Difference (IV, Random, 95% CI) | ‐1.22 [‐1.66, ‐0.79] |
| 3.6 MET + CBT (low intensity) vs MET + CBT (high intensity) | 1 | 64 | Std. Mean Difference (IV, Random, 95% CI) | ‐0.08 [‐0.58, 0.41] |
| 3.7 CBT + CM‐adh vs CBT + CM‐abs | 1 | 52 | Std. Mean Difference (IV, Random, 95% CI) | 2.45 [1.72, 3.18] |
| 3.8 CBT + CM‐abs vs CM‐abs | 1 | 50 | Std. Mean Difference (IV, Random, 95% CI) | ‐0.03 [‐0.59, 0.52] |
| 3.9 CBT + CM‐adh vs CM‐abs | 1 | 50 | Std. Mean Difference (IV, Random, 95% CI) | 2.37 [1.63, 3.10] |
| 4 Reduction in symptoms of dependence | 5 | Std. Mean Difference (IV, Random, 95% CI) | Subtotals only | |
| 4.1 MET vs Drug education control | 1 | 101 | Std. Mean Difference (IV, Random, 95% CI) | 4.32 [3.60, 5.04] |
| 4.2 MET vs MET + CBT | 1 | 266 | Std. Mean Difference (IV, Random, 95% CI) | ‐1.78 [‐2.07, ‐1.50] |
| 4.3 MET vs CBT | 1 | 183 | Std. Mean Difference (IV, Random, 95% CI) | 0.06 [‐0.23, 0.36] |
| 4.4 MET + CBT (high intensity) vs MET + CBT (low intensity) | 1 | 64 | Std. Mean Difference (IV, Random, 95% CI) | 4.96 [3.95, 5.98] |
| 4.5 CBT (low intensity) vs CBT (high intensity) | 1 | 119 | Std. Mean Difference (IV, Random, 95% CI) | ‐2.66 [‐3.16, ‐2.16] |
| 5 Reduction in cannabis‐related problems | 4 | Mean Difference (IV, Random, 95% CI) | Subtotals only | |
| 5.1 MET vs MET + CBT | 2 | 292 | Mean Difference (IV, Random, 95% CI) | ‐0.34 [‐0.47, ‐0.22] |
| 5.2 MET vs MET + CBT + CM‐abs | 1 | 30 | Mean Difference (IV, Random, 95% CI) | 0.04 [‐0.22, 0.30] |
| 5.3 RP vs SS | 1 | 156 | Mean Difference (IV, Random, 95% CI) | ‐0.25 [‐0.29, ‐0.21] |
| 5.4 CBT (low intensity) vs CBT (high intensity) | 1 | 119 | Mean Difference (IV, Random, 95% CI) | ‐0.40 [‐0.46, ‐0.35] |
| 6 Treatment completion | 5 | Risk Ratio (M‐H, Random, 95% CI) | Subtotals only | |
| 6.1 MET vs MET + CBT (high intensity) | 1 | 302 | Risk Ratio (M‐H, Random, 95% CI) | 1.54 [1.26, 1.87] |
| 6.2 MET + CBT (low intensity) vs MET + CBT (high intensity) | 1 | 108 | Risk Ratio (M‐H, Random, 95% CI) | 1.27 [1.02, 1.58] |
| 6.3 CBT (low intensity) vs CBT (high intensity) | 1 | 160 | Risk Ratio (M‐H, Random, 95% CI) | 1.76 [1.39, 2.22] |
| 6.4 MET + CBT vs MET + CBT + CM‐abs + CM‐adh | 1 | 69 | Risk Ratio (M‐H, Random, 95% CI) | 0.96 [0.69, 1.32] |
| 6.5 DC vs DC + CM‐adh + CM‐abs | 1 | 67 | Risk Ratio (M‐H, Random, 95% CI) | 0.61 [0.37, 0.99] |
| 6.6 MET + CBT vs DC | 1 | 69 | Risk Ratio (M‐H, Random, 95% CI) | 1.69 [1.04, 2.74] |
| 6.7 MET + CBT vs DC + CM‐adh + CM‐abs | 1 | 70 | Risk Ratio (M‐H, Random, 95% CI) | 1.03 [0.73, 1.45] |
| 6.8 MET + CBT + CM‐abs + CM‐adh vs DC | 1 | 66 | Risk Ratio (M‐H, Random, 95% CI) | 1.77 [1.10, 2.86] |
| 6.9 MET + CBT + CM‐adh + CM‐abs vs DC + CM‐adh + CM‐abs | 1 | 67 | Risk Ratio (M‐H, Random, 95% CI) | 1.08 [0.77, 1.51] |
| 6.10 CBT vs CBT + CM‐abs | 1 | 68 | Risk Ratio (M‐H, Random, 95% CI) | 1.13 [0.70, 1.82] |
| 6.11 CBT vs CBT + CM‐adh | 1 | 68 | Risk Ratio (M‐H, Random, 95% CI) | 0.89 [0.58, 1.35] |
| 6.12 CBT + CM‐abs vs CBT + CM‐adh | 1 | 64 | Risk Ratio (M‐H, Random, 95% CI) | 0.79 [0.49, 1.26] |
| 6.13 CBT vs CM‐abs | 1 | 63 | Risk Ratio (M‐H, Random, 95% CI) | 0.89 [0.57, 1.38] |
| 6.14 CBT + CM‐abs vs CM‐abs | 1 | 59 | Risk Ratio (M‐H, Random, 95% CI) | 0.79 [0.49, 1.28] |
| 6.15 CBT + CM‐adh vs CM‐abs | 1 | 59 | Risk Ratio (M‐H, Random, 95% CI) | 1.00 [0.66, 1.53] |
| 7 Improvement in motivation to quit | 1 | Mean Difference (IV, Random, 95% CI) | Subtotals only | |
| 7.1 MET + CBT vs MET | 1 | 31 | Mean Difference (IV, Random, 95% CI) | 25.1 [9.79, 40.41] |
| 7.2 MET vs MET + CBT + CM‐abs | 1 | 30 | Mean Difference (IV, Random, 95% CI) | ‐9.8 [‐25.83, 6.23] |
| 7.3 MET + CBT vs MET + CBT + CM‐abs | 1 | 29 | Mean Difference (IV, Random, 95% CI) | 15.3 [‐0.56, 31.16] |
| 8 Reduction in alcohol use severity (ASI score) | 2 | Mean Difference (IV, Random, 95% CI) | Subtotals only | |
| 8.1 MET vs MET + CBT | 2 | 280 | Mean Difference (IV, Random, 95% CI) | ‐0.02 [‐0.07, 0.03] |
| 8.2 MET + CBT + CM‐abs vs MET | 1 | 30 | Mean Difference (IV, Random, 95% CI) | 0.8 [0.75, 0.85] |
| 8.3 MET + CBT + CM‐abs vs MET + CBT | 1 | 29 | Mean Difference (IV, Random, 95% CI) | 0.78 [0.73, 0.83] |
| 9 Reduction in drug use severity (ASI score) | 2 | Mean Difference (IV, Random, 95% CI) | Subtotals only | |
| 9.1 MET vs MET + CBT | 1 | 31 | Mean Difference (IV, Random, 95% CI) | ‐0.03 [‐0.08, 0.02] |
| 9.2 MET + CBT + CM‐abs vs MET | 1 | 30 | Mean Difference (IV, Random, 95% CI) | 0.11 [0.06, 0.16] |
| 9.3 MET + CBT + CM‐abs vs MET + CBT | 1 | 29 | Mean Difference (IV, Random, 95% CI) | 0.08 [0.03, 0.13] |
| 9.4 MET + CBT (high intensity) vs MET + CBT (low intensity) | 1 | 64 | Mean Difference (IV, Random, 95% CI) | 0.82 [0.12, 1.52] |
| 10 Reduction in frequency of alcohol use | 2 | Mean Difference (IV, Random, 95% CI) | Subtotals only | |
| 10.1 MET vs MET + CBT | 1 | 249 | Mean Difference (IV, Random, 95% CI) | 11.18 [‐13.43, 35.79] |
| 10.2 MET + CBT (high intensity) vs MET + CBT (low intensity) | 1 | 64 | Mean Difference (IV, Random, 95% CI) | 0.82 [‐5.58, 7.21] |
3.6. Analysis.
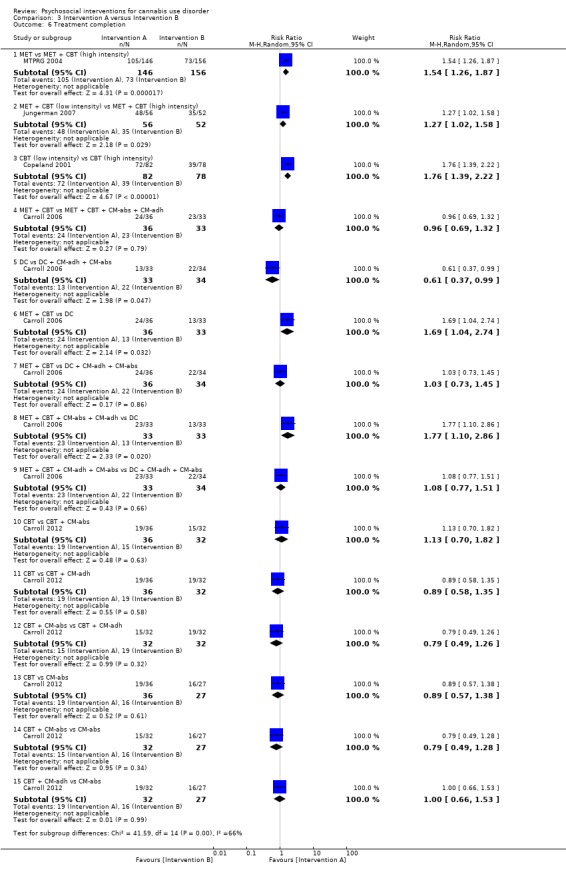
Comparison 3 Intervention A versus Intervention B, Outcome 6 Treatment completion.
3.10. Analysis.
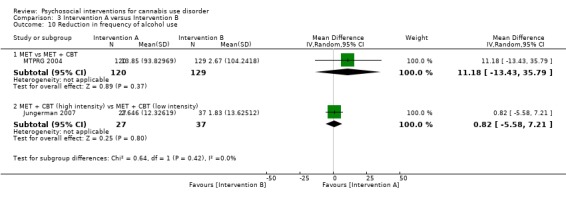
Comparison 3 Intervention A versus Intervention B, Outcome 10 Reduction in frequency of alcohol use.
Characteristics of studies
Characteristics of included studies [ordered by study ID]
Bernstein 2009.
| Methods | Randomised controlled trial Single site: paediatric emergency department | |
| Participants | 210 hospital patients who were screened for "behaviour temporally associated with [cannabis] use" were randomised Approximately 25% to 32% of the sample was reported to meet the diagnosis for post‐traumatic stress disorder, and 8% to 15% reported depression Most participants were female (63.2% and 67.6% in Groups 1 and 2, unclear proportion in Group 3) and African American (93.8% and 77.5% in Groups 1 and 2, unclear proportion in Group 3) and were in their late teens or early twenties (70.6% in Group 1 were 18 to 21 years old, 70.4% in Group 2, unclear proportion in Group 3). Education and employment were not reported Cannabis use was reported to occur approximately every second day (19.0 and 15.3 days per month on average for Groups 1 and 2, not reported for Group 3) at baseline, although additional details on use were not provided Previous cannabis treatments and motivation to quit were not assessed. Other illicit substance use was not reported and was not among the exclusion criteria. Tobacco and alcohol use was not reported, although risky alcohol use was an exclusion criterion |
|
| Interventions | Group 1: 2‐session MET with 1 telephone call booster session over 56 weeks (actual treatment completion rates were not reported; n = 68) Group 2: 2‐session assessment‐only control over 56 weeks (actual treatment completion rates were not reported; n = 71) Group 3: DTC (n = 71) Sessions lasted 20 to 30 minutes. The cannabis‐related goal of treatment was not clear. Participants were reimbursed up to $80 for their participation. Therapists received extensive training, although intervention fidelity checking was not reported |
|
| Outcomes | Frequency of cannabis use during the preceding 30 days; point‐prevalence abstinence rates; proportion reporting attempts to reduce use; index of cannabis‐related problems such as driving while under the influence of cannabis | |
| Notes | Follow‐up was provided at 3 and 12 months after interventions, and comparisons included Group 3 only up to 12 months Follow‐up rates at final assessment:
Study was funded by the National Institute on Drug Abuse. Study authors reported no declarations of interest |
|
| Risk of bias | ||
| Bias | Authors' judgement | Support for judgement |
| Random sequence generation (selection bias) | Low risk | Computer‐generated random assignment in blocks of 100 stratified by age group (14 to 17 years and 18 to 21 years) |
| Allocation concealment (selection bias) | Low risk | A double opaque envelope system was utilised, with the first envelope opened after enrolment |
| Blinding of participants and personnel (performance bias) All outcomes | High risk | Participant and personnel blinding was not possible because of the type of intervention provided |
| Blinding of outcome assessment (detection bias) Subjective outcomes | Low risk | Outcome assessors were blinded to participant grouping |
| Blinding of outcome assessment (detection bias) Objective outcomes | Unclear risk | No collateral/biological verification of self report was collected |
| Incomplete outcome data (attrition bias) All outcomes | Unclear risk | Follow‐up rates were low but comparable between groups |
| Selective reporting (reporting bias) | Low risk | Pre‐specified outcomes were reported, and trial protocol is shown |
| Other bias | High risk | Substance use other than cannabis use was not assessed and was not included in the exclusion criteria. Relatively little demographic information was collected, and no history of substance use was collected. Confounding variables may have been introduced during the trial period, as intervention groups received 2 sessions over 56 weeks, each only 30 minutes in duration. Measures of outcome variables were not validated. No other bias was found |
Bonsack 2011.
| Methods | Randomised controlled trial. Single site: patients at a university‐based psychiatric facility | |
| Participants | 62 psychiatric patients in treatment for psychosis were screened by review of medical records to identify those using more than 2 joints per week in the past month; these individuals were then randomised Most participants were male (86.7% and 87.5% in Groups 1 and 2, respectively) and were in their late twenties (average, 25.0 and 25.5 years). Most obtained no post secondary school qualifications and were receiving state aid benefits. Ethnicity was not reported. All participants were fluent in French Cannabis use was reported to occur near daily (82.1% and 89.3% of days), and smoking on approximately 20 occasions during the week before baseline (22.5 and 19.0 occasions). All participants reported use to be at least mildly "problematic", and most met criteria for cannabis use disorder (86.7%, 78.1%) Participants first began to use cannabis at an average age of 15 years and used regularly since the age of 17 years. Previous experience with cannabis treatment was not assessed, although half the sample reported a motivation to reduce use. Participants reported no other illicit substance use in the previous month, although 86.7% and 71.9% reported that they drank alcohol. Tobacco use was not reported |
|
| Interventions | Group 1: 4 to 6 MET sessions over 24 weeks with the option of 3 group sessions (on average 6.4 sessions were completed; n = 30) in addition to psychosis treatment as usual. Sessions lasted 45 to 60 minutes Group 2: usual treatment for psychosis as needed over 24 weeks (n = 32) Intervention goal was to reduce cannabis use. Participant reimbursement was not described. Details of therapist training and supervision were not provided |
|
| Outcomes | Days of cannabis use "binges"; frequency of abstinence;, number of joints per week; readiness‐to‐change questionnaire; Positive and Negative Syndrome Scale mental health assessment, Global Assessment of Functioning scale | |
| Notes | Follow‐up was provided at 3, 6 and 12 months Follow‐up rates at final assessment:
Study was funded by the Swiss Research National Fund. Study authors reported no declarations of interest |
|
| Risk of bias | ||
| Bias | Authors' judgement | Support for judgement |
| Random sequence generation (selection bias) | Low risk | "Randomization was performed by blocks of eight based on a computer‐generated allocation placed in closed envelopes" |
| Allocation concealment (selection bias) | Low risk | "Envelopes were generated and kept by a member of the admin staff of the project" |
| Blinding of participants and personnel (performance bias) All outcomes | High risk | Participant and personnel blinding was not possible because of the type of intervention provided |
| Blinding of outcome assessment (detection bias) Subjective outcomes | Unclear risk | "The assessments were conducted by an independent member of the research team who was not the participant’s therapist"; however it was unclear whether these assessors were blinded |
| Blinding of outcome assessment (detection bias) Objective outcomes | Unclear risk | No collateral/biological verification of self report was collected |
| Incomplete outcome data (attrition bias) All outcomes | Low risk | Differences in missing data were not described, but final follow‐up rates were high (Group 1: n = 25, 83.3%; Group 2: n = 29, 90.6%) |
| Selective reporting (reporting bias) | Low risk | Chosen measures of cannabis use were not validated, but all pre‐specified outcomes were reported and the protocol is shown |
| Other bias | Low risk | Chosen subjective measure of cannabis use was not validated. No other bias was found |
Budney 2000.
| Methods | Randomised controlled trial Therapists were the same for all 3 treatment groups, all based in an out‐patient clinic for cannabis dependence | |
| Participants | 60 cannabis users responding to advertisement for treatment for marijuana dependence were randomised Most participants were male (80%, 90% and 80% in Groups 1, 2 and 3, respectively) and were in their early thirties (average 32.6, 33.1 and 32.0 years). All participants were white Caucasian, and most were employed (70%, 60%, 65%), with on average 13 years of education (13.2, 13.3, 13.4) Cannabis use was reported to occur near daily (average 24.1, 20.4 and 23.2 days in the past 30 days), and smoking on approximately 4 occasions during the day (3.8, 3.7, 3.8). Participants reported on average 7 problems related to cannabis use (7.7, 7.1, 6.7) and 6 symptoms of cannabis use disorder (6.8, 6.1, 6.4). Participants reported on average 15 years of regular cannabis use (14.3, 15.9, 15.5), and a minority had experienced previous cannabis treatment (35%, 20%, 25%) Many participants were current tobacco smokers (65%, 40%, 45%) and consumed alcohol approximately weekly (on 4.0, 7.0 and 2.7 days in the previous month). Other illicit substance use frequency was not reported, although dependence was an exclusion criterion |
|
| Interventions | Group 1: 14‐session MET + CBT over 14 weeks with up to $570 CM for continuous abstinence (55% completed ≥ 1 session and provided 1 urine sample during the past 2 weeks of treatment; n = 20) Group 2: 14‐session MET + CBT over 14 weeks (65% completed ≥ 1 session and provided 1 urine sample during the past 2 weeks of treatment; n = 20) Group 3: 4‐session MET over 14 weeks (45% completed ≥ 1 session and provided 1 urine sample during the past 2 weeks of treatment; n = 20) Sessions lasted 60 to 90 minutes. Intervention goal was to abstain from cannabis use. Participant reimbursement was not described. Therapist training included manual review and practice role‐plays. Intervention fidelity was checked through weekly case reviews and supervision |
|
| Outcomes | Frequency of cannabis using days; proportion of continuous abstinence; urinalysis; index of cannabis problems; proportion reporting motivation to quit; psychosocial functioning using ASI composite scores, URICA, SCQ, BSI, BDI. Other substance use reported only on ASI | |
| Notes | Follow‐up was provided at 14 weeks (end of treatment) through an intent‐to‐treat approach (ITT) Follow‐up rates at final assessment:
Analysis of co‐variance (treatment group = co‐variate, weeks of cannabis abstinence = dependent variable) was used to test therapist effects (none were found) Study was funded by the National Institute on Drug Abuse. Study authors reported no declarations of interest |
|
| Risk of bias | ||
| Bias | Authors' judgement | Support for judgement |
| Random sequence generation (selection bias) | Low risk | "Minimum likelihood allocation was used to randomly assign the 60 participants sequentially to one of the three groups while balancing across groups on baseline characteristics" (such as gender and legal status) |
| Allocation concealment (selection bias) | Low risk | Participants were centrally allocated, although some time had passed between assessment and allocation |
| Blinding of participants and personnel (performance bias) All outcomes | High risk | Participant and personnel blinding was not possible because of the type of intervention provided |
| Blinding of outcome assessment (detection bias) Subjective outcomes | Unclear risk | Blinding of outcome assessors was not described |
| Blinding of outcome assessment (detection bias) Objective outcomes | Low risk | Urine was collected to establish continuous abstinence during the trial |
| Incomplete outcome data (attrition bias) All outcomes | Low risk | Follow‐up rates were low to moderate, and no group differences were reported |
| Selective reporting (reporting bias) | Low risk | Pre‐specified outcomes were reported, and protocol is shown |
| Other bias | Low risk | Treatment completion rates were low. Use of additional treatments during the trial was not assessed, but this seems unlikely given the intensity of treatment. Pre‐treatment differences were found with regards to aspects of dependence and whether participants were married. It was unclear whether these differences would impact outcomes, and the statistical plan did not appear to address differences. No other bias was found |
Budney 2006.
| Methods | Randomised controlled trial. Treatment delivered at an out‐patient clinic for cannabis dependence | |
| Participants | 90 cannabis users responding to an advertisement for marijuana dependence treatment were randomised Most participants were male (80%, 70% and 80% in Groups 1, 2 and 3, respectively) and were in their early thirties (average 30.9, 33.9 and 34.6 years). Most were white Caucasian (90%, 97%, 100%) and employed (67%, 53%, 53%), with on average 13 years of education (13.1, 13.1, 12.3). Cannabis use was reported to occur near daily (average 25.3, 25.5 and 26.0 days in the past 30 days), smoking on approximately 4 occasions during the day (4.2, 3.7, 3.8). Participants reported on average 8 problems related to cannabis use (7.8, 7.9, 7.8) and 6 symptoms of cannabis use disorder (4.9, 4.7, 5.0). Participants reported on average more than 10 years of regular cannabis use (11.3, 14.7, 15.3), and a minority had experienced previous cannabis treatment (37%, 37%, 57%). Approximately half of participants were current tobacco smokers (65%, 40%, 45%). Other substance use was measured by ASI component scores (all < 0.5), and dependence was an exclusion criterion |
|
| Interventions | Group 1: 14‐session CBT over 14 weeks + up to $664.44 CM for continuous abstinence (participants completed on average 9.6 sessions; n = 20) Group 2: 14‐session CBT over 14 weeks + up to $140 CM for treatment adherence (participants completed on average 8.8 sessions; n = 20) Group 3: $664.44 CM for continuous abstinence over 14 weeks (participants stayed in treatment on average 9.5 weeks; n = 20) Sessions lasted 50 minutes. Intervention goal was to abstain from cannabis use. Participants were reimbursed up to $200. Therapist training included manual review and practice role‐plays. Intervention fidelity was not reported |
|
| Outcomes | Frequency of cannabis using days (urinalysis + self reports); proportion reporting continuous abstinence; proportion with no symptoms of dependence for ≥ 1 month; number of cannabis related problems; psychosocial functioning: ASI composite scores, MPS, BDI, BSI; other substance use reported using ASI | |
| Notes | Follow‐up was provided at end of treatment, then at 3, 6, 9 and 12 months through an intent‐to‐treat approach (ITT) Therapist effects were investigated and were found to be non‐significant Follow‐up rates at final assessment:
Study was funded by the National Institute on Drug Abuse. Study authors reported no declarations of interest |
|
| Risk of bias | ||
| Bias | Authors' judgement | Support for judgement |
| Random sequence generation (selection bias) | Low risk | "Minimum likelihood allocation (Aickin, 1982) was used", balancing on legal involvement and gender |
| Allocation concealment (selection bias) | Low risk | Participants were centrally allocated, although some time had passed between assessment and allocation |
| Blinding of participants and personnel (performance bias) All outcomes | High risk | Participant and personnel blinding was not possible because of the type of intervention provided |
| Blinding of outcome assessment (detection bias) Subjective outcomes | High risk | "Research assistants who were not blinded to group conducted" data collection |
| Blinding of outcome assessment (detection bias) Objective outcomes | Low risk | Urine collected to establish point‐prevalence abstinence |
| Incomplete outcome data (attrition bias) All outcomes | Low risk | Follow‐up rates were a little low and group differences were not reported, but an ITT approach was used |
| Selective reporting (reporting bias) | Low risk | With the minor exception of data from cannabis problems and joints per day and ASI scores not reported in follow‐up, pre‐specified outcomes were reported and protocol is shown |
| Other bias | Low risk | Treatments accessed during the trial period were not assessed, but this seems unlikely given the intensity of treatment No other bias was found |
Carroll 2006.
| Methods | Randomised controlled trial. Treatment referrals to a substance abuse treatment unit | |
| Participants | 136 individuals were referred from the office of adult probation to a substance abuse treatment unit and were randomised Most participants were male (88%, 94%, 94% and 82% in Groups 1, 2, 3 and 4, respectively) and were in their early twenties (average 21.0, 21.5, 21.1 and 21.2 years), and most were African American (52%, 77%, 53%, 58%). Participants were typically employed (54%, 53%, 33%, 54%) and had completed at least high school (51%, 53%, 56%, 48%). Diagnosis of anxiety, depressive or personality disorder was common (81%, 86%, 75%, 69%) Participants began to use cannabis at an average age of 14 years (14.4, 14.4, 14.9, 14.7) and used cannabis every second day (average 13.8, 13.7, 12.4 and 12.5 days per 28 days) Participants consumed alcohol only a few days per month (average 1.9, 1.7, 4.1, 3.3 days). Use of tobacco and other illicit substances was not reported, although participants were excluded if they reported a "physical dependence on alcohol or opioids" |
|
| Interventions | Group 1: 8‐session MET/CBT over 8 weeks + up to $340 CM for treatment adherence + up to $540 for continuous abstinence (69.7% of participants completed treatment as intended; n = 33) Group 2: 8‐session DC and option for self help groups over 8 weeks + up to $340 CM for treatment adherence + up to $540 for continuous abstinence (63.7% of participants completed treatment as intended; n = 34) Group 3: 8‐session MET/CBT over 8 weeks (66.7% completed treatment as intended; n = 36) Group 4: 8‐session DC and option for self help groups over 8 weeks (39.4% completed treatment as intended; n = 33) Groups 1 and 4 shared the goal of cannabis abstinence, and Groups 2 and 3 shared the goal of cannabis reduction. Participant reimbursement for follow‐up assessments was not reported. Staff went through intensive training including demonstration of competence. Intervention fidelity was ensured through supervision and videotaping sessions and use of the Yale Adherence and Competence Scale |
|
| Outcomes | Proportion of smoking days; duration of longest abstinence in days (self report and urinalysis); proportion with clinical improvement (defined as completing treatment and submitting ≥ 1 negative urine); other substance use reported on ASI | |
| Notes | Follow‐up was provided at end of treatment, then at 3 and 6 months Follow‐up rates at final assessment:
Intention‐to‐treat analysis approach was used Study was funded by the National Institute on Drug Abuse. Study authors reported no declarations of interest |
|
| Risk of bias | ||
| Bias | Authors' judgement | Support for judgement |
| Random sequence generation (selection bias) | Unclear risk | Randomisation process not explained |
| Allocation concealment (selection bias) | Low risk | Centrally located; otherwise does not refer to concealment procedures |
| Blinding of participants and personnel (performance bias) All outcomes | High risk | Participant and personnel blinding was not possible because of the type of intervention provided |
| Blinding of outcome assessment (detection bias) Subjective outcomes | Unclear risk | Blinding of assessors was not described, although staff were highly trained |
| Blinding of outcome assessment (detection bias) Objective outcomes | Low risk | Urine collected during the trial to establish length of abstinence |
| Incomplete outcome data (attrition bias) All outcomes | Low risk | Follow‐up rates were moderate, and no group differences were reported. ITT was used |
| Selective reporting (reporting bias) | Low risk | With the minor exception that ASI scores were not reported, all pre‐specified outcomes were reported |
| Other bias | Low risk | Compliance with CM was a little low. Outside treatments accessed during the trial period were not assessed, but this seems unlikely given the intensity of treatment. No other bias was found |
Carroll 2012.
| Methods | Randomised controlled trial. Treatment referrals to a substance abuse treatment unit | |
| Participants | 127 individuals were referred from the office of adult probation to a substance abuse treatment unit and were randomised Most participants were male (83.3%, 84.4%, 90.6% and 77.8% in Groups 1, 2, 3 and 4, respectively) and were in their mid‐twenties (average 24.3, 25.4, 26.2 and 27.6 years), and most were African American (66.7%, 62.5%, 59.4%, 66.7%). Participants were typically employed (58.3%, 65.6%, 68.7%, 40.7%) and had completed at least high school (63.9%, 65.6%, 59.4%, 59.3%). Diagnosis of anxiety, depressive or personality disorder was common (44.5%, 33.1%, 62.6%, 37.0%) Participants had been using cannabis regularly for approximately 10 years on average (9.5, 9.9, 10.6, 12.6) and were using cannabis every second day (average 15.6, 17.6, 17.9 and 14.1 per 28 days). Previous experience with cannabis treatment was not reported Participants consumed alcohol only a few days per month (average 1.9, 1.7, 4.1, 3.3 days), smoked tobacco approximately every second day (average 18.7, 16.9, 16.9, 19.3 in the past 28 days) and consumed alcohol once per month (average 2.3, 1.5, 2.7 and 1.8 days). Other illicit substance use was assessed with the ASI, and minimal use was reported |
|
| Interventions | Group 1: 12‐session CBT over 12 weeks (n = 36) Group 2: 12‐session CBT + up to $250 CM for treatment adherence (n = 32) Group 3: 12‐session CBT over 12 weeks + up to $250 CM for continuous abstinence (n = 32) Group 4: CM of up to $250 for continuous abstinence over 12 weeks (n = 27) Sessions lasted 50 minutes with the exception of Group 4, which lasted 5 minutes. All interventions shared the goal of cannabis abstinence. On average 5.9 (3.8) sessions were completed across groups. No reimbursement for participation was reported. Staff went through intensive training including demonstration of competence. Intervention fidelity was ensured through supervision, videotaped sessions and use of the Yale Adherence and Competence Scale |
|
| Outcomes | Proportion of smoking days; number of consecutive days of abstinence (self report and urinalysis) | |
| Notes | Follow‐up was provided at end of treatment and monthly for 12 months Follow‐up rates at final assessment:
Study was funded by the National Institute on Drug Abuse. Study authors reported no declarations of interest |
|
| Risk of bias | ||
| Bias | Authors' judgement | Support for judgement |
| Random sequence generation (selection bias) | Low risk | "Urn randomization program" was specified, although variables used to balance groups were not specified |
| Allocation concealment (selection bias) | Low risk | Participants were centrally allocated, but allocation processes did involve other agencies through referral; this was not thought to contribute to risk |
| Blinding of participants and personnel (performance bias) All outcomes | High risk | Participant and personnel blinding was not possible because of the type of intervention provided |
| Blinding of outcome assessment (detection bias) Subjective outcomes | Unclear risk | Assessor blinding was not reported |
| Blinding of outcome assessment (detection bias) Objective outcomes | Low risk | Urine was collected during the trial to establish length of abstinence |
| Incomplete outcome data (attrition bias) All outcomes | Low risk | Follow‐up rates were high, and no between‐group differences were found |
| Selective reporting (reporting bias) | Low risk | Pre‐specified outcomes were reported and protocol is shown |
| Other bias | Low risk | Non‐cannabis substance use was not assessed beyond baseline, but baseline use was low. Outside treatments accessed during the trial period were not assessed, although this seems unlikely given the intensity of treatment. Baseline differences in antisocial personality disorder were found between groups, and it was unclear whether this was addressed in the data analysis plan. No other bias was found |
Copeland 2001.
| Methods | Randomised controlled trial Treatment delivered in a university research unit | |
| Participants | 229 responders to an advertisement for cannabis treatment were randomised Most members of the sample were male (69.4% of total sample) and were in their early thirties (average 32.3 years) Most members of the total sample were daily cannabis users who used 2 joints per day on average (2.1, 2.0 and 2.2 in Groups 1, 2 and 3, respectively) Cannabis‐related problems were high (scores of 42.4, 42.2 and 45.4 on the CPQ), and participants reported an average score ≥ 9 on the SDS (9.2, 9.8, 9.3). A minority of the total sample had experienced previous cannabis treatment (28.8%) Other substance use was not reported, although participants were excluded if they reported more than weekly use of any drug other than nicotine and alcohol, a score > 14 on the AUDIT or any previous alcohol‐related social problems |
|
| Interventions | Group 1: 6‐session CBT over 6 weeks (50% of participants completed treatment as intended, 4.2 sessions were completed on average; n = 78). Sessions lasted 60 minutes. Group 2: single‐session CBT (87.8% of participants received the session; n = 82). This session lasted 90 minutes Group 3: DTC (n = 69) Interventions shared a cannabis‐abstinence goal. Participants were reimbursed with lottery entry to win a $1000 voucher for participation. Therapist training was not well described, but therapists did receive "regular clinical supervision". Treatment fidelity was ensured by audiotaping all sessions and assigning an independent rating of a random schedule of 1 in 10 sessions |
|
| Outcomes | Proportion of smoking days; proportion abstinent in the past month; proportion reporting continuous abstinence; number of joints used per day; score on SDS, score on CPQ; mental health on Global Severity Index from SCL‐90‐R | |
| Notes | Follow‐up was provided at an average of 242 days for Group 1, 223 days for Group 2 and 242 days for Group 3. Follow‐up rates at final assessment were not reported by group, but 74.2% of the total sample was assessed Analysis tested for differences by therapist and found no significant effect. An ITT analysis approach was used Study was funded by the Australian Commonwealth Department of Health and Family Services Research into Drug Abuse Grants Program. Study authors reported no declarations of interest |
|
| Risk of bias | ||
| Bias | Authors' judgement | Support for judgement |
| Random sequence generation (selection bias) | Unclear risk | Randomisation process not explained |
| Allocation concealment (selection bias) | Low risk | Participants were centrally allocated; otherwise, concealment procedures were not reported |
| Blinding of participants and personnel (performance bias) All outcomes | High risk | Participant and personnel blinding was not possible because of the type of intervention provided |
| Blinding of outcome assessment (detection bias) Subjective outcomes | Low risk | An "independent researcher 'blind' to the subject’s treatment" completed assessments |
| Blinding of outcome assessment (detection bias) Objective outcomes | Low risk | Urine collected to establish the validity of self report |
| Incomplete outcome data (attrition bias) All outcomes | Low risk | "For each outcome, additional analyses controlling for the effect of potential confounders on the relationship between treatment condition and outcome were conducted where appropriate." ITT was used |
| Selective reporting (reporting bias) | Low risk | Pre‐specified outcomes were reported and protocol is shown |
| Other bias | Low risk | Although participants were excluded if they reported more than weekly drug use, substance use otherwise was not assessed during the trial. No recent treatment or additional treatment was permitted during the trial period; otherwise, it was not assessed. Very few demographics were collected at baseline, although they were reported in a secondary analysis (Copeland 2001b). No other bias was found |
de Dios 2012.
| Methods | Randomised controlled trial. Treatment was delivered at the Warren Alpert Medical School of Brown University | |
| Participants | 34 responders to an advertisement offering a way to reduce cannabis use and learn ways to relax were randomised All participants were female and were in their early twenties (average age 22.7 and 23.5 years in Groups 1 and 2, respectively). Just over half of participants were white Caucasian (58.3%, 50%) and employed (54.6%, 50.0%) Participants reported using cannabis approximately every second day (average 17.0 and 18.8 days in the past 30 days). Other substance use was not reported, although participants were excluded if they reported any use of cocaine, heroin, methamphetamine or other drugs in the past month, or more than seven drinks per week in the past month |
|
| Interventions | Group 1: 2‐session mindfulness‐based meditation over 2 weeks (73% of participants attended both sessions) Group 2: DTC Sessions lasted 45 minutes. Treatment goal was not specifically stated, although the focus was on replacing cannabis use with relaxation techniques. Participants were reimbursed for participation, although the monetary figure was not reported. Therapist training was intensive and treatment fidelity was ensured by supervision, session recording and review |
|
| Outcomes | Baseline change in cannabis use frequency; proportion reporting point‐prevalence and/or continuous abstinence | |
| Notes | Follow‐up was provided at 1, 2 and 3 months Follow‐up rates at final assessment:
Study was funded by the National Institute on Drug Abuse. Study authors reported no declarations of interest |
|
| Risk of bias | ||
| Bias | Authors' judgement | Support for judgement |
| Random sequence generation (selection bias) | Unclear risk | Randomisation process was unclear. Participants were randomised by a "2:1 ratio" ..."to optimize the interventionist's experience in delivering the intervention and to ensure adequate numbers of MI‐MM participants after accounting for the potential for dropout" |
| Allocation concealment (selection bias) | Low risk | Participants were centrally allocated; otherwise, concealment procedures were not reported |
| Blinding of participants and personnel (performance bias) All outcomes | High risk | Participant and personnel blinding was not possible because of the type of intervention provided |
| Blinding of outcome assessment (detection bias) Subjective outcomes | Low risk | "Research assistants performing the assessments were blinded to the assigned condition" |
| Blinding of outcome assessment (detection bias) Objective outcomes | Unclear risk | No urinalysis was used to verify self report |
| Incomplete outcome data (attrition bias) All outcomes | Low risk | Follow‐up rates were low, but no differences between groups were noted |
| Selective reporting (reporting bias) | Low risk | Aside from mental health measures used only at baseline, all pre‐specified cannabis use measures were reported in results |
| Other bias | High risk | Cannabis‐related measures collected were minimal and were not validated. The trial included a small sample, although the analysis plan addressed this. Other substance use was not measured during the trial, nor was previous or current drug treatment experience |
Edwards 2006.
| Methods | Randomised controlled trial. Intervention delivered at the Early Psychosis Prevention and Intervention Centre (EPPIC) | |
| Participants | 47 patients of a mental health service who continued to use cannabis at 10 weeks of treatment were randomised Most participants were male (65.2% and 79.2% in Groups 1 and 2, respectively). Participants were 20.9 years of age on average. A minority of participants reported education beyond secondary (14.9%), and most were diagnosed with schizophrenia (63.6%, 79.2%) Participants reported using cannabis more than weekly (average 39.4% and 26.0% of days), and approximately half were diagnosed with cannabis use disorder (54.5%, 43.5%). Experience with cannabis treatment was not reported A minority of the sample reported alcohol use disorder (2.2%). Other substance use was not assessed |
|
| Interventions | Group 1: 10‐session DC over 3 months with 1 booster CBT session at 3 months (average 7.6 sessions attended; n = 23) Group 2: 10‐session usual psychosis treatment over 3 months (average 8.4 sessions attended; n = 24) Sessions lasted 20 to 60 minutes. Intervention goals were not specifically mentioned, although a goal of cannabis reduction was likely. Participant reimbursement for participation was not reported. Therapists were described to have been trained previously and were experienced in drug treatments. Intervention fidelity was ensured through weekly supervision |
|
| Outcomes | Proportion of smoking days; baseline change in frequency of use; point‐prevalence abstinence rates; index on severity of cannabis use (all measured from the Cannabis and Substance Use Assessment Schedule); proportion in the "action" stage of change; mental health assessed with BPRS, SANS, BDI‐SF, SOFAS, KAPQ; attendance at out‐patient treatments | |
| Notes | Follow‐up at end of treatment, then at 6 months Follow‐up rates at final assessment:
Study was funded by the Victorian Government Department of Human Services. Study authors reported no declarations of interest |
|
| Risk of bias | ||
| Bias | Authors' judgement | Support for judgement |
| Random sequence generation (selection bias) | Low risk | "Randomization codes were computer generated and placed in sealed envelopes, managed by a non‐clinical member of the research team" |
| Allocation concealment (selection bias) | Low risk | Allocation used "sealed envelopes… requesting participants and clinicians not to disclose treatment conditions to raters" |
| Blinding of participants and personnel (performance bias) All outcomes | High risk | Participant and personnel blinding was not possible because of the type of intervention provided |
| Blinding of outcome assessment (detection bias) Subjective outcomes | Low risk | "Attempts to maintain rater blindness included use of separate rooms and administrative procedures for project staff, limiting information recorded in clinical notes, and requesting participants and clinicians not to disclose treatment conditions to raters" |
| Blinding of outcome assessment (detection bias) Objective outcomes | Unclear risk | No urinalysis or collateral report was used to verify self report |
| Incomplete outcome data (attrition bias) All outcomes | Low risk | No difference in follow‐up attrition rates on key variables were found. Follow‐up rates were high |
| Selective reporting (reporting bias) | Low risk | Pre‐specified outcomes were reported and protocol is shown |
| Other bias | Low risk | Other drug use and treatment were not assessed (with the exception of alcohol use at baseline). No other bias was found |
Fischer 2012.
| Methods | Randomised controlled trial. Intervention delivered at a university‐based research facility | |
| Participants | 134 university students responding to an advertisement for cannabis use research Most participants were male (67.5% from Groups 1 and 2 combined, 68.8% from Groups 3 and 4 combined) and were in their early twenties (average 20.1 years in Groups 1 and 2, average 20.6 years in Groups 3 and 4). Most participants were white Caucasian (74% of total sample at 3‐month follow‐up) Participants reported using cannabis for approximately 5 years (average 5.5 years in Groups 1 and 2, 5.6 years in Groups 3 and 4) and were current daily users (using on 22.0, 24.8, 21.4 and 25.4 of the past 30 days in Groups 1, 2, 3 and 4, respectively), smoking approximately 2 joints per day (2.3 in Groups 1 and 2, 2.0 in Groups 3 and 4). Experience with cannabis treatment was not reported Other non‐cannabis substance use was not reported |
|
| Interventions | Group 1: single DC session (n = 25) Group 2: 8‐page work booklet on cannabis facts (n = 47) Group 3: single non‐drug health promotion session (n = 25) Group 4: 8‐page work booklet on non‐drug health promotion (n = 37) Sessions lasted 15 to 20 minutes. Treatment goal was unclear. Participants were reimbursed up to $85 for participation. Therapist training was unclear. Intervention fidelity was checked only by asking for participant feedback (which was positive) |
|
| Outcomes | Frequency of cannabis using days, joints per using day, proportion of users with "deep inhalation" | |
| Notes | Follow‐up was provided at 3 and 12 months Follow‐up rates at final assessment were unclear, but for Groups 1 and 2 combined, n = 40, 55.6%; and for Groups 3 and 4 combined, n = 32, 51.6% Study was funded by the Canadian Institutes of Health Research. Study authors reported no declarations of interest |
|
| Risk of bias | ||
| Bias | Authors' judgement | Support for judgement |
| Random sequence generation (selection bias) | Unclear risk | Randomisation process was not described |
| Allocation concealment (selection bias) | Unclear risk | Allocation concealment was not described |
| Blinding of participants and personnel (performance bias) All outcomes | High risk | Participant and personnel blinding was not possible because of the type of intervention provided |
| Blinding of outcome assessment (detection bias) Subjective outcomes | Unclear risk | Blinding procedures were not described |
| Blinding of outcome assessment (detection bias) Objective outcomes | Unclear risk | No urinalysis was used to verify self report |
| Incomplete outcome data (attrition bias) All outcomes | Unclear risk | No difference in follow‐up rates were noted between groups, but the quantity of missing data was reported only in aggregate |
| Selective reporting (reporting bias) | Low risk | Pre‐specified outcomes were reported and protocol is shown |
| Other bias | High risk | External use of treatments (past or present) nor non‐cannabis substance use was not assessed. Further information on participant mental and physical health was warranted given the intervention focus but was not provided |
Hoch 2012.
| Methods | Randomised controlled trial. Intervention was delivered at an out‐patient addiction centre | |
| Participants | 122 patients from an out‐patient addiction centre who were diagnosed with cannabis use disorder and were motivated to reduce their use were randomised Most participants were male (77.8% and 81.3% in Groups 1 and 2, respectively) and were in their early twenties (average 24.4 and 22.1 years of age). Most had completed high school (92.2%, 81.2%). Co‐morbid mental health disorders were common (78.9%, 90.6%). Lifetime use of alcohol and other substance use disorders were common (37.7%, 38.5%) |
|
| Interventions | Group 1: 10‐session CBT/MET over 5 weeks (n = 90). Sessions lasted 90 minutes Group 2: DTC (n = 32) The intervention aimed to encourage abstinence through twice‐weekly 90‐minute sessions. Participant reimbursement for participation was not reported. Study therapists were clinical psychologists who had received training in behaviour therapy. All study therapists attended a 1‐week training session. Intervention fidelity was ensured through fortnightly supervision and review of videotaped sessions |
|
| Outcomes | Proportion reporting continuous abstinence (self‐report and urinalysis); number of joints per week; cannabis problems on the CUPIT, CPQ and ASI; dependence on the SDS; proportion reporting daily tobacco smoking; proportion reporting any illicit substance use; proportion of participants meeting diagnosis for mental health disorders | |
| Notes | Follow‐up was provided at treatment end and at 3 and 6 months Follow‐up rates at final assessment:
Study was funded by the German Federal Ministry of Education and Research. Study authors reported no connection with the alcohol or tobacco industry, but study author Dr. Wittchen is or was a member of advisory boards of Essex Pharma, Sanofi, Pfizer, Organon, Servier and Novartis and received research grant support and travel reimbursements from these companies |
|
| Risk of bias | ||
| Bias | Authors' judgement | Support for judgement |
| Random sequence generation (selection bias) | Low risk | "Randomization of patients was implemented using Randlist program" |
| Allocation concealment (selection bias) | Low risk | "The lists with the consecutive number of included patient and corresponding treatment condition were administered by an independent, external clinical research associate (CRA)" |
| Blinding of participants and personnel (performance bias) All outcomes | High risk | Participant and personnel blinding was not possible because of the type of intervention |
| Blinding of outcome assessment (detection bias) Subjective outcomes | Unclear risk | "Baseline, post‐ and follow‐up assessments and urine tests were conducted by interviewers (trained research staff), whereas assessments before and after each therapy session were conducted by study therapists" No further information was provided regarding blinding of these interviewers, but they were well trained |
| Blinding of outcome assessment (detection bias) Objective outcomes | Low risk | Urine was collected to verify self report, but individual results were not reported clearly, that is, the article reported that all self report was "confirmed by negative urine test" |
| Incomplete outcome data (attrition bias) All outcomes | Unclear risk | Final follow‐up rates were discrepant:
Use of ITT was not well reported and was unclear |
| Selective reporting (reporting bias) | Low risk | Pre‐specified outcomes were reported and protocol is shown |
| Other bias | Low risk | At baseline, members of Group 2 were younger and had significantly fewer years since first use and years since first disorder as compared with Group 1. Unclear whether analysis plan addressed this. No other bias was found |
Hoch 2014.
| Methods | Randomised controlled trial. Intervention was delivered at 11 out‐patient addiction centres | |
| Participants | 385 patients from 11 out‐patient addiction centres who reported using cannabis more than weekly and were motivated to reduce use were approached and randomised Most participants were male (87.9% and 85.4% in Groups 1 and 2, respectively) and were in their late twenties (average 26.5 and 26.1 years of age). Most had completed high school (83.6%, 95%) Participants began to use cannabis regularly in their late teens (average 19.1 and 18.4 years of age), and most had made previous quit attempts (85.9%, 83.9%). The total sample reported using cannabis on average 18.8 days in the past 28 days, and used approximately 20 joints over 1 week (20.8, 21.3). Participants reported more than 6 problems on the CPQ (average 6.7 and 6.8) and an average SDS score of approximately 9 (9.0, 9.1) Most reported daily tobacco use (78.2%, 82%), although a minority reported any illicit substance use (10.6%, 7.1%). Alcohol use was not assessed |
|
| Interventions | Group 1: 10‐session MET/CBT over 8 to 12 weeks (52.2% of participants completed treatment as intended; n = 149). Sessions lasted 90 minutes Group 2: DTC (n = 130) Intervention aimed to encourage abstinence through twice‐weekly 90‐minute sessions. Participant reimbursement for participation was not reported. Therapist training was intensive, and intervention fidelity was ensured through supervision and videotaped sessions |
|
| Outcomes | Proportion reporting continuous abstinence (self report and urinalysis); number of joints per week; cannabis problems on CUPIT and CPQ; dependence on SDS; proportion reporting daily tobacco smoking; proportion reporting any illicit substance use | |
| Notes | Follow‐up was provided at end of treatment, then at 3 and 6 months Rates of follow‐up at final assessment:
Study was funded by the German Federal Ministry of Education and Research. Study authors reported no connection with the alcohol or tobacco industry, but author Dr. Wittchen is or was a member of advisory boards of Essex Pharma, Sanofi, Pfizer, Organon, Servier and Novartis and received research grant support and travel reimbursements from these companies |
|
| Risk of bias | ||
| Bias | Authors' judgement | Support for judgement |
| Random sequence generation (selection bias) | Low risk | Randomisation was performed through "a stratified random block design controlling for clinical centers". Study authors described using "the program Randlist to generate the randomization list" |
| Allocation concealment (selection bias) | Low risk | "Randomization was conducted by the research staff in Dresden. Allocation codes were protected against identification using sealed randomization envelopes...At the moment therapists included a patient to the study they were blind to his or her study condition" |
| Blinding of participants and personnel (performance bias) All outcomes | High risk | Participant and personnel blinding was not possible because of the type of intervention provided |
| Blinding of outcome assessment (detection bias) Subjective outcomes | Low risk | "[Therapists] were not blind to the treatment they delivered because that would have been impossible" Assessment staff blinding was described: "The statistician knew the block size but was blind to the patients’ randomization codes and names" |
| Blinding of outcome assessment (detection bias) Objective outcomes | Low risk | Urine was collected during the trial to show point‐prevalent abstinence |
| Incomplete outcome data (attrition bias) All outcomes | Low risk | Follow‐up rates were extremely low and differences in attrition rates were noted between groups, but study authors used an ITT approach to address this |
| Selective reporting (reporting bias) | Low risk | Pre‐specified outcomes were reported and protocol is shown |
| Other bias | Unclear risk | Access to external substance use treatments during the trial period was not assessed at follow‐up, but this would be unlikely given the treatment intensity. Treatment completion rates were low, and it was not clear how this was addressed by the analysis plan. DTC had significantly more self reported symptoms of dependence in the previous 4 weeks at baseline; it remains unclear how this was handled in the analysis |
Jungerman 2007.
| Methods | Randomised controlled trial. Intervention delivered at a university‐based substance use treatment clinic | |
| Participants | 160 responders to an unspecified advertisement who reported using cannabis ≥ 3 days per week were randomised Most participants were male (82.1%, 75.0%, and 82.7% in Groups 1, 2 and 3, respectively) and were in their early thirties (average 31.7, 32.2, 33.1 years of age). Most participants were white Caucasian (91.1%, 84.6%, 92.3%) and were employed (92.9%, 82.7%, 84.3%). Participants reported on average approximately 15 years of education (15.4, 15.0, 16.6) Participants reported on average 15 years of regular cannabis use (15.3, 15.9, 16.9), and most were daily users (using on 94.2%, 88.2% and 94.1% of the past 90 days) who used approximately 2 joints on average per day (2.1, 2.1, 1.8). Participants reported approximately 10 problems on the MPS (9.8, 10.2, 9.7) and on average ≥ 5 symptoms of dependence (5.6, 5.8, 5.7) Participants reported low levels of alcohol consumption (average 11.1%, 10.0% and 10.1% of days). Non‐cannabis illicit substance use was rare (all < 5% of days). Tobacco use was not reported |
|
| Interventions | Group 1: 4‐session MET/CBT over 1 month (85.7% completed the intervention as intended; n = 56) Group 2: 4‐session MET/CBT over 3 months (67.3% completed the intervention as intended; n = 52) Group 3: DTC (n = 52) Sessions lasted 90 minutes. Intervention goals primarily involved cannabis abstinence but were flexible to focus on reduction. Participants were reimbursed for participation with a "travel and meal allowance". Staff intervention training followed manual protocol and weekly supervision, and a purpose‐built empathy scale ensured treatment fidelity |
|
| Outcomes | Proportion of smoking days; change in number of smoking days from baseline; proportion reporting point‐prevalent abstinence (self report and urinalysis); joints per day; number of dependence symptoms; cannabis‐related problems on the MPS; functioning (ASI composite scores); other substance use (ASI); proportion of days with alcohol consumption and other substance use | |
| Notes | Intention‐to‐treat analysis was used Therapists effects were assessed and were found to be non‐significant Follow‐up was provided at 4 months post randomisation Follow‐up rates at this final assessment:
Study was funded by the São Paulo Research Foundation. Study authors reported no declarations of interest |
|
| Risk of bias | ||
| Bias | Authors' judgement | Support for judgement |
| Random sequence generation (selection bias) | Low risk | Participants were randomly assigned to 1 of 3 groups by a random permuted block technique |
| Allocation concealment (selection bias) | Low risk | "The randomization was done by a neutral person, not involved in any phase of the clinical work...All patients were informed about the result of the randomization over the phone, by the coordinator of the study" |
| Blinding of participants and personnel (performance bias) All outcomes | High risk | Participant and personnel blinding was not possible because of the type of intervention provided |
| Blinding of outcome assessment (detection bias) Subjective outcomes | Unclear risk | "The baseline and follow‐up measures were conducted by trained interviewers." Other information regarding blinding of these interviewers was not reported |
| Blinding of outcome assessment (detection bias) Objective outcomes | Low risk | Urine was collected during the trial to validate self reports and to show abstinence rates |
| Incomplete outcome data (attrition bias) All outcomes | Low risk | Follow‐up rates were very low, and Group 3 reported lower attrition rates than Groups 1 and 2. Drop‐outs were significantly more likely to be younger. ITT was used to address these concerns |
| Selective reporting (reporting bias) | Low risk | Pre‐specified outcomes were reported and protocol is shown |
| Other bias | Low risk | The possibility of using additional treatment was not assessed during the trial (although it was shown at baseline). Intervention completion rates were low, and this was not clearly addressed in the analysis plan. At baseline, the proportion of cannabis smoking days was lower in Group 2 as compared with Groups 1 and 3, although the analysis plan did address this concern. No other bias was found |
Kadden 2007.
| Methods | Randomised controlled trial. Intervention delivered at a university‐based treatment centre | |
| Participants | 240 responders to an advertisement for cannabis treatment who met criteria for cannabis use disorder were randomised Most participants were male (69%, 72%, 80% and 64% in Groups 1 to 4, respectively) and were in their early thirties (average 31.9, 34.1, 33.4 and 31.8 years of age). Most participants were white Caucasian (57%, 56%, 72%, 59%), were employed (68%, 82%, 70%, 73%) and had received approximately 13 years of education (average 12.9, 12.9, 13.1, and 12.9 years) Participants used cannabis approximately daily (on 92%, 92%, 85% and 89% of days), used 3 to 5 joints per day (average 5.2, 4.7, 3.2, and 4.8) and reported on average 14 problems on the MPS (15.2, 14.0, 12.6, 13.4). Participant history of cannabis use or cannabis treatments was not assessed Use of alcohol and other illicit drugs was minimal, as measured on the ASI. Half the total sample consisted of current tobacco smokers |
|
| Interventions | Group 1: 9‐session non‐drug health promotion over 9 weeks (n = 62) Group 2: 9‐session MET/CBT over 9 weeks (n = 61) Group 3: 9‐session CM of up to $385 for continuous abstinence over 9 weeks (n = 54) Group 4: 9‐session MET/CBT + CM of up to $385 for continuous abstinence over 9 weeks (n = 63) Sessions lasted 60 minutes, with the exception of Group 3, which lasted 15 minutes. On average 5.2 sessions were completed across groups. Each cannabis intervention focused on achieving abstinence. Participants were reimbursed up to $105 for participation. Therapist training was intensive, and intervention fidelity was ensured by bi‐weekly supervision and session videotape review |
|
| Outcomes | Proportion of days abstinent; joints smoked per day; proportion reporting continuous abstinence (self report and urinalysis); cannabis‐related problems (MPS); dependence severity (ASI composite scores); proportion of tobacco smokers | |
| Notes | Follow‐up was provided every month for 12 months Rates of follow‐up at final assessment:
Study was funded by the National Institute on Drug Abuse. Study authors reported no declarations of interest |
|
| Risk of bias | ||
| Bias | Authors' judgement | Support for judgement |
| Random sequence generation (selection bias) | Low risk | "a computerized urn randomization process… that balanced the four treatment groups on gender, age, education level, ethnicity, employment status, and number of marijuana problems" |
| Allocation concealment (selection bias) | Low risk | Allocation was centrally located; otherwise, study authors did not refer to concealment procedures |
| Blinding of participants and personnel (performance bias) All outcomes | High risk | Participant and personnel blinding was not possible because of the type of intervention provided |
| Blinding of outcome assessment (detection bias) Subjective outcomes | Unclear risk | "Research assistants conducted the intake and follow‐up assessments"; other information regarding blinding of these assistants was not reported |
| Blinding of outcome assessment (detection bias) Objective outcomes | Low risk | Urine was collected during CM treatment to verify abstinence |
| Incomplete outcome data (attrition bias) All outcomes | Low risk | No differences in final follow‐up rates were reported between groups; these rates were high (Group 1: n = 52, 83.9%; Group 2: n = 49, 80.3%; Group 3: n = 48, 88.9%; Group 4: n = 51, 81.0%) |
| Selective reporting (reporting bias) | Unclear risk | Very unclear reporting of pre‐specified outcomes. In addition, ASI was used only at baseline |
| Other bias | Unclear risk | Other drug use was reported at baseline only (ASI score only), but participants were excluded on the basis of diagnosis of substance use disorder. Cannabis use history and use of additional treatments were not reported, given length of follow‐up compared with length of treatment; this may have introduced risk. No other bias was found |
Lee 2013.
| Methods | Randomised controlled trial. Intervention delivery format was unclear; it appeared that intervention was delivered on 2 college campuses, although differences by campus were not reported | |
| Participants | 212 college students responding to a survey were screened for more than weekly cannabis use and were randomised Just over half of participants were male (54.7% of total sample), and on average, participants were 20.0 years old. Most of the total sample was white Caucasian (74.8%). No other demographic information was provided Participants reported that they used cannabis every second day on average (on 16.5 and 15.6 days in the previous 30 days for Group 1 and 2, respectively) and smoked approximately 8 to 9 joints (average 9.4, 8.3). History of cannabis use and previous experience with cannabis treatment were not reported. Participants reported approximately 10 cannabis‐related problems on average (10.5, 10.4) Non‐cannabis substance use was not assessed |
|
| Interventions | Group 1: single 60‐minute session MET (n = 106) Group 2: DTC (n = 106) Intervention goal was for reduction in or abstinence from cannabis use. Participants were reimbursed up to $105. Therapist training was intensive, and intervention fidelity was ensured through supervision and use of the MITI |
|
| Outcomes | Frequency of cannabis using days; joints per day; number of cannabis‐related problems (using the RMPI) | |
| Notes | Participants who were assigned to Group 1 and completed the session had more cannabis‐related problems at baseline compared with those who did not complete the session Follow‐up was provided at end of treatment, then at 3 and 6 months Rates of follow‐up at final assessment:
Study was funded by the National Institute on Drug Abuse. Study authors reported no declarations of interest |
|
| Risk of bias | ||
| Bias | Authors' judgement | Support for judgement |
| Random sequence generation (selection bias) | Low risk | "An algorithm was programmed to utilize a blocked randomized design of two groups based on baseline responses" |
| Allocation concealment (selection bias) | Low risk | Participants were separately allocated "via US mail and email to participate in a brief online screening questionnaire" |
| Blinding of participants and personnel (performance bias) All outcomes | High risk | Participant and personnel blinding was not possible because of the type of intervention provided |
| Blinding of outcome assessment (detection bias) Subjective outcomes | Unclear risk | Blinding of outcome assessors was not reported |
| Blinding of outcome assessment (detection bias) Objective outcomes | Unclear risk | No urinalysis was used to verify self report |
| Incomplete outcome data (attrition bias) All outcomes | Low risk | Final follow‐up rates were moderate to high, no differences in attrition were noted between groups (Group 1: n = 89, 84.0%; Group 2: n = 86, 81.1%) |
| Selective reporting (reporting bias) | Low risk | Pre‐specified outcomes were reported and protocol is shown |
| Other bias | High risk | Non‐cannabis substance use and use of external drug treatments during the trial period were not assessed. No information was provided on history of previous cannabis use nor experience of treatment. No other bias was found |
Litt 2013.
| Methods | Randomised controlled trial. Intervention delivery format was unclear | |
| Participants | 215 responders to an advertisement for cannabis treatment who met criteria for cannabis use disorder were randomised Most participants were male (73.0%, 70.0% and 62% in Groups 1 to 3, respectively) and were in their early thirties (average 32.3, 32.1 and 33.6 years of age). Most participants were white Caucasian (72.9%, 68.5%, 62.9%), were employed (76.1%, 74.0%, 74.6%) and had received on average 13 years of education (13.1, 12.9, 13.4). Participants were near daily users (average 72.5, 71.8 and 68.4 days in the past 90 days), smoking approximately 2 joints per day (2.0, 1.8, 1.6). Participants had little previous experience of cannabis treatment (the total sample had shared a total average of 0.3 treatments). History of cannabis use was not reported Use of tobacco, alcohol and other illicit substances was not reported |
|
| Interventions | Group 1: 9‐session MET/CBT + CM for treatment adherence over 9 weeks (lottery system was used to reward homework completion for total possible winning on a single draw of $100) (average 5.7 sessions completed; n = 71) Group 2: 9‐session MET/CBT + CM for continuous abstinence over 9 weeks (lottery system was used to reward negative urine for total possible winning on a single draw of $100) (average 5.5 sessions completed; n = 73) Group 3: 9‐session "case management" over 9 weeks (average 6.0 sessions completed; n = 71) Sessions lasted 60 minutes. Intervention goals focused on cannabis abstinence. Participants were reimbursed up to $190 for participation. Therapist training was manual based, and intervention fidelity was ensured through supervision and use of a purpose‐built fidelity scale |
|
| Outcomes | Proportion of smoking days; proportion reporting continuous abstinence (self report and urinalysis); number of cannabis‐related problems (MPS); readiness‐to‐change | |
| Notes | Follow‐up was provided every 90 days for 12 months from end of treatment Rates of follow‐up at final assessment:
Study was funded by the National Institute on Drug Abuse. Study authors reported no declarations of interest |
|
| Risk of bias | ||
| Bias | Authors' judgement | Support for judgement |
| Random sequence generation (selection bias) | Low risk | Randomisation was performed "by a research assistant using an urn randomization procedure...that balanced the three treatment conditions for gender, age, ethnicity, employment status, and number of marijuana problems" |
| Allocation concealment (selection bias) | Low risk | Allocation was centrally located; study authors did not otherwise refer to concealment procedures |
| Blinding of participants and personnel (performance bias) All outcomes | High risk | Participant and personnel blinding was not possible because of the type of intervention provided |
| Blinding of outcome assessment (detection bias) Subjective outcomes | High risk | As the study authors state: "Given the procedures used in each treatment, neither participants, therapists, nor research assistants could be blinded as to experimental condition" |
| Blinding of outcome assessment (detection bias) Objective outcomes | Unclear risk | Urinalysis was conducted during treatment, but results were not reported |
| Incomplete outcome data (attrition bias) All outcomes | Low risk | Follow‐up rates were moderate, and no between‐group differences were noted |
| Selective reporting (reporting bias) | Low risk | Pre‐specified outcomes were reported and protocol is shown |
| Other bias | High risk | Most results were reported in unclear figures. Non‐cannabis substance use was not reported, although participants who met criteria for substance use disorder were excluded. Use of additional treatment was not assessed at any point. CM components of the interventions were not well adhered to. Previous cannabis use was not measured, although most participants were dependent and daily users. No other bias was found |
Madigan 2013.
| Methods | Randomised controlled trial. Intervention delivered at 3 psychosis treatment clinics | |
| Participants | 88 responders to an advertisement for cannabis and psychosis treatment who met criteria for cannabis use disorder were randomised Most participants were male (78% and 79% in Groups 1 and 2, respectively) and were in their late twenties (average 27.6 and 28.2 years in Groups 1 and 2, respectively). Only approximately one‐third of participants were employed, although more than half had tertiary education Participants in Groups 1 and 2 had used cannabis for 9.6 and 7.5 years on average, and were using on 10 days per month. Approximately one‐fifth of the sample had experienced substance use treatment more than a year before the trial All participants met criteria for psychosis. Non‐cannabis use was not reported |
|
| Interventions | Group 1: 13‐session MET/CBT treatment over 18 weeks provided in groups of unclear size (n = 59; 27 received the intervention) Group 2: treatment as usual for psychosis (n = 29) An experienced psychiatrist provided treatment, although information on intervention training and treatment fidelity was not provided |
|
| Outcomes | Cannabis use frequency (ASI); mental health with regards to psychosis symptoms (CDSS, BIS, SAPS, SANS) and quality of life (GAF, WHOQOL); acceptance of the intervention (DAI) | |
| Notes | Follow‐up was provided at 3 and 12 months Rates of follow‐up at final assessment:
Study was funded by the Health Research Board of Ireland. Study authors reported no declarations of interest |
|
| Risk of bias | ||
| Bias | Authors' judgement | Support for judgement |
| Random sequence generation (selection bias) | Low risk | Quote: "block randomized, computerized method, patients were allocated to one of two treatment arms: GPI with a probability of 2/3 or TAU with a probability of 1/3" |
| Allocation concealment (selection bias) | Unclear risk | Participants were able to contact those who had already completed treatment to try to gather information on allocation procedures; allocation was done by an independent researcher, but participants were allocated in group format |
| Blinding of participants and personnel (performance bias) All outcomes | High risk | Participant and personnel blinding was not possible because of the type of intervention provided |
| Blinding of outcome assessment (detection bias) Subjective outcomes | Low risk | Allocation was "withheld from the rater, who remained blind to allocation until the final assessments were completed" |
| Blinding of outcome assessment (detection bias) Objective outcomes | Unclear risk | No urinalysis was used to verify self report |
| Incomplete outcome data (attrition bias) All outcomes | Unclear risk | Many intervention participants were allocated and did not receive the intervention but were included in the analysis. A moderate difference in follow‐up rates was noted between groups, which was not specifically addressed, although an unclear ITT analysis plan was used |
| Selective reporting (reporting bias) | Low risk | Pre‐specified outcomes were reported and protocol is shown |
| Other bias | High risk | Non‐cannabis substance use and use of external drug treatments during the trial period were not assessed; no information was provided on previous cannabis use history, treatment fidelity, treatment completion rates; various aspects of demographics were not collected. No other bias was found |
MTPRG 2004.
| Methods | Randomised controlled trial. Intervention delivered at 3 community out‐patient drug treatment sites | |
| Participants | 450 responders to an advertisement for cannabis treatment or treatment referral who met criteria for cannabis use disorder were randomised Most participants were male (63.7%, 70.5% and 70.9% in Groups 1 to 3, respectively) and were in their mid‐thirties (average 35.4, 36.3 and 36.1 years of age). Most participants were white Caucasian (65.1%, 66.7%, 76.4%) and employed (82.2%, 83.4%, 83.8%), with approximately 14 years of education on average (14.0, 14.2, 14.4 years) Participants were near daily users (using on 86.9%, 87.6% and 89.9% of days in the past 90 days) and smoked approximately 3 joints per day on average (3.0, 2.8, 2.8). Participants reported an average of approximately 9 problems related to cannabis use on the MPS (10.2, 9.5, 9.1) and reported approximately 6 symptoms of cannabis dependence (5.7, 5.6, 5.6). History of cannabis use and experience with cannabis use treatments were not reported Participants were regular but unproblematic drinkers (consuming alcohol on an average of 59.4, 48.8 and 46.6 days in the past 90 days). Other substance use was not reported, although participants who met criteria for a substance use disorder were excluded |
|
| Interventions | Group 1: 2‐session CBT/MET + minimal case management over 6 weeks (71.9% of participants completed treatment as intended; average 1.6 sessions attended; participants had the option of including a significant other in treatment, and 15% did so; average 6.5 sessions attended; n = 146) Group 2: 9‐session MET/CBT + case management of up to $ over 12 weeks (47% of participants completed treatment as intended; participants had the option of including a significant other in treatment and 29% did so; n = 156) Group 3: DTC (n = 148) Intervention goal focused on abstinence. Participants were reimbursed up to $125. Therapist training was intensive, and intervention fidelity was ensured by supervision and review of videotaped sessions |
|
| Outcomes | Proportion of smoking days; proportion reporting point‐prevalence abstinence; joints per day; number of symptoms of dependence and abuse (SCID); dependence severity using ASI component scores; cannabis‐related problems (MPS); proportion reporting clinical improvement; mental health index (BDI, STAI‐S); alcohol using days | |
| Notes | Follow‐up was provided at 4, 9 and 15 months Rates of follow‐up at final assessment:
Differences between treatment sites were assessed and were found to be non‐significant. Study was funded by the Substance Abuse and Mental Health Services Administration. Study authors reported no declarations of interest |
|
| Risk of bias | ||
| Bias | Authors' judgement | Support for judgement |
| Random sequence generation (selection bias) | Low risk | "Urn randomization program to balance key variables (i.e., age, gender, ethnicity, employment status, education, and marijuana problem severity, as measured by the MPS" |
| Allocation concealment (selection bias) | Low risk | Allocation was conducted centrally at each separate site; further information on how allocation was concealed was not provided |
| Blinding of participants and personnel (performance bias) All outcomes | High risk | Participant and personnel blinding was not possible because of the type of intervention provided |
| Blinding of outcome assessment (detection bias) Subjective outcomes | High risk | "Research assistants were not blinded to the participant’s experimental condition" |
| Blinding of outcome assessment (detection bias) Objective outcomes | Low risk | Collateral verification was collected to verify self report |
| Incomplete outcome data (attrition bias) All outcomes | Low risk | No differences in follow‐up rates were found; these rates were moderate to high (Group 1: n = 120, 82.2%; Group 2: n = 129, 82.7%; Group 3: n = 137, 92.6%) |
| Selective reporting (reporting bias) | Low risk | Pre‐specified outcomes were reported and protocol is shown |
| Other bias | Unclear risk | Study authors did not assess other drug use, although it was unclear whether this would introduce bias, as dependence was used as an exclusion criterion (tobacco dependence was not part of this). Study authors did not assess previous history of cannabis use or treatment. Only half the sample from Group 2 completed treatment as intended. No other bias was found |
Roffman 1988.
| Methods | Randomised controlled trial. Intervention delivered in a university‐based research unit | |
| Participants | 110 responders to an advertisement for cannabis treatment who reported using cannabis on ≥ 50 of the past 90 days were randomised Participant gender grouping was not reported. Participants were 32.5 years old on average, and most individuals in the total sample were white Caucasian (93%) and employed (85%); a minority had a college degree (42%) Participants were daily cannabis smokers (average 27.1 and 26.4 days over the past 28 days in Groups 1 and 2, respectively) who used on average approximately 3 joints per day (2.6, 2.9). Participants reported first using cannabis regularly at an average age of 20.0 years. Most had made a previous attempt to quit (92%), and 75% indicated that they had a current desire to quit at baseline. On average 11.1 cannabis‐related problems were reported on the DAST Less than half the total sample reported that they smoked tobacco over the previous 90 days (43%) or used another substance (22%); most reported that they had consumed alcohol (63%) |
|
| Interventions | Group 1: 10‐session CBT (in groups of 12 to 15) over 12 weeks (n = 54) Group 2: 10‐session SS (in groups of 12 to 15) over 12 weeks (n = 56) Participants attended on average 7.5 sessions across groups Sessions lasted 120 minutes. Interventions focused on cannabis abstinence. Participants were reimbursed a deposit of $50 for participation. Therapist training was not reported, and intervention fidelity was assessed by a satisfaction questionnaire completed by participants and therapists |
|
| Outcomes | Frequency of cannabis using days; proportion reporting point‐prevalence abstinence (self report and collateral estimates); joints per day; cannabis‐related problems (DAST); days of alcohol and tobacco consumption; proportion using other substances; proportion accessing other substance use treatment | |
| Notes | Follow‐up was provided at 1, 3, 6 and 12 months, although results are presented only for 1‐month follow‐up Rates of follow‐up at 1 month:
Study funding was not reported. Study authors reported no declarations of interest |
|
| Risk of bias | ||
| Bias | Authors' judgement | Support for judgement |
| Random sequence generation (selection bias) | Unclear risk | Randomisation procedure was not explained, but study authors claim that it was effective, as they noted no differences between groups in key variables at baseline |
| Allocation concealment (selection bias) | Unclear risk | Allocation was done in a group orientation; assessment meetings and treatment were also provided in groups |
| Blinding of participants and personnel (performance bias) All outcomes | High risk | Participant and personnel blinding was not possible because of the type of intervention provided |
| Blinding of outcome assessment (detection bias) Subjective outcomes | Unclear risk | Blinding of assessors was not described |
| Blinding of outcome assessment (detection bias) Objective outcomes | Low risk | Urine was collected to verify self report |
| Incomplete outcome data (attrition bias) All outcomes | Unclear risk | Follow‐up rates were high, and possible differences between groups were not specified (Group 1: n = 120, 83.3%; Group 2: n = 129, 92.6%). Data were often reported in the aggregate, presumably because of lack of differences between groups, although this was not clearly specified throughout |
| Selective reporting (reporting bias) | Low risk | Pre‐specified outcomes were reported and protocol is shown |
| Other bias | Low risk | Very high quality with no problems in the other sources of bias investigated |
Stein 2011.
| Methods | Randomised controlled trial. Intervention delivered at a hospital‐based research facility | |
| Participants | 332 female responders to a health survey who reported using cannabis more than 2 days in the past 3 months were randomised All participants were female and were typically in their early twenties (average 20.5 and 21.0 years of age in Groups 1 and 2, respectively). Most participants were white Caucasian (72.4%, 63.3%) with at least some post secondary education (68.1%, 71.6%) Participants reported that they used cannabis regularly approximately 4 years on average (3.8, 4.1) and had used cannabis every second day over the past 90 days (59% and 55% of days). Participants reported on average approximately 5 cannabis‐related problems on the MPS (4.8, 5.0). Just over one‐third were cannabis dependent (39.5%, 39.6%), and more than half had a desire to quit use (56.8%, 63.5%). Previous experience with cannabis treatment was not reported Non‐cannabis substance use was not reported, although participants were excluded if they met criteria for a substance use disorder |
|
| Interventions | Group 1: 2‐session MET over 4 weeks (80.4% completed treatment as intended; average 1.7 sessions completed; n = 163). Sessions lasted 45 minutes Group 2: DTC (n = 169) The intervention goal was unclear, although 49% expressed a desire to "change" their cannabis use. Participants were reimbursed up to $140 for participation. Therapist training was based on the MITI, and intervention fidelity was checked by the MITI and bi‐weekly supervision |
|
| Outcomes | Change in cannabis use frequency from baseline; cannabis‐related problems (MPS); proportion reporting a motivation to quit use | |
| Notes | Follow‐up was provided at 1, 3 and 6 months Rates of follow‐up at final assessment:
Study was funded by the National Institute on Drug Abuse. Study authors reported no declarations of interest |
|
| Risk of bias | ||
| Bias | Authors' judgement | Support for judgement |
| Random sequence generation (selection bias) | Unclear risk | Randomisation process was not described |
| Allocation concealment (selection bias) | Low risk | Participants were centrally allocated, and allocation was done by phone |
| Blinding of participants and personnel (performance bias) All outcomes | High risk | Participant and personnel blinding was not possible because of the type of intervention provided |
| Blinding of outcome assessment (detection bias) Subjective outcomes | Low risk | "Research staff performing the assessments [were] blinded" |
| Blinding of outcome assessment (detection bias) Objective outcomes | Unclear risk | No urinalysis was used to verify self report |
| Incomplete outcome data (attrition bias) All outcomes | Low risk | Follow‐up rates were moderate, but no differences in attrition were noted between groups (Group 1: n = 126, 77.3%; Group 2: n = 136, 80.5%) |
| Selective reporting (reporting bias) | Unclear risk | Results were reported only as odds ratios and were a little unclear. In addition, cannabis frequency and quantity information was not reported. Protocol is shown |
| Other bias | Low risk | Other substance use was not measured, although it was unclear whether this would introduce bias, as dependence was used as an exclusion criterion. Previous treatment experience and the possibility of accessing treatment during the trial were not assessed and may have introduced risk given the intervention was not intensive. No other bias was found |
Stephens 1994.
| Methods | Randomised controlled trial. Intervention delivered in a university‐based research unit | |
| Participants | 212 responders to an advertisement for cannabis treatment who reported using cannabis on ≥ 50 of the past 90 days were randomised Most participants were male (75.9% of the total sample) with an average age of 31.9 years. Most were white Caucasian (95%) and employed (85%). A minority had completed some college education (40%) Participants reported first using cannabis regularly at an average age of 19.9 years and had used cannabis for an average of 15.4 years. At baseline, participants reported that they used cannabis almost daily (average 80.7 of the past 90 days) and smoked on average 2.7 joints. Participants reported previously accessing treatment on an average total of 7.0 occasions Participants reported consuming alcohol on average 2.3 days per week, and illicit drugs on 0.3 days. Participants reported an average score of 8.9 on the DAST |
|
| Interventions | Group 1: 10‐session CBT over 12 weeks with 2 booster sessions at 3 and 6 months (delivered in groups of 12 to 15; n = 106) Group 2: 10‐session SS over 12 weeks with 2 booster sessions at 3 and 6 months (delivered in groups of 12 to 15; n = 106) Sessions lasted 120 minutes. Interventions focused on achieving abstinence. 69% of the total sample completed ≥ 7 sessions, and on average 7.6 sessions were completed. Participants were reimbursed a $50 deposit for participation. Details of therapist training were unclear, although each had previous professional experience. Intervention fidelity was assessed by a participant satisfaction survey, and each session was audiotaped and rated |
|
| Outcomes | Cannabis using days (self report + urinalysis); point‐prevalence abstinence; alcohol using days; other substance using days; drug‐related problems (DAST); use of external drug treatments; clinical improvement | |
| Notes | Follow‐up was provided at 1, 3, 6, 9 and 12 months Rates of follow‐up at final assessment:
Study was funded by the National Institute on Drug Abuse. Study authors reported no declarations of interest |
|
| Risk of bias | ||
| Bias | Authors' judgement | Support for judgement |
| Random sequence generation (selection bias) | Unclear risk | Participants were blocked on sex and were randomly assigned to 1 of 2 treatment conditions, but the randomisation process was not reported |
| Allocation concealment (selection bias) | Unclear risk | Allocation concealment was not described |
| Blinding of participants and personnel (performance bias) All outcomes | High risk | Participant and personnel blinding was not possible because o the type of intervention provided |
| Blinding of outcome assessment (detection bias) Subjective outcomes | Unclear risk | "Therapists were unaware of the specific content of the alternative treatment and hypotheses of the study", but it was unclear whether therapists were also outcome assessors |
| Blinding of outcome assessment (detection bias) Objective outcomes | Low risk | Participant family/friends gave collateral reports to verify participant self report |
| Incomplete outcome data (attrition bias) All outcomes | Unclear risk | "A significant interaction of follow‐up completion and treatment condition indicated that RP subjects who completed all follow‐ups used marijuana fewer times per day than did SSP subjects who completed all follow‐ups. This pattern was reversed for subjects who did not complete all follow‐ups and suggested differential attrition from the follow‐up sample as a function of treatment condition. Therefore, differential effects of treatment were tested using multivariate analyses of covariance (MANCOVAs) with pretreatment level of typical daily use as the covariate. Sex of subject was included as a between‐subjects variable to test for differential response to treatments" |
| Selective reporting (reporting bias) | Unclear risk | Pre‐specified outcomes were reported and protocol is shown |
| Other bias | Low risk | Therapist training was not mentioned but therapists were rated highly by participants and attendance was good. "Subjects included in the outcome analyses were significantly more likely to be female (27%) and married (48%) and to have completed a college degree (43%). They also reported fewer years of marijuana use and a lower DAST score". No such differences at baseline were noted. No other bias was found |
Stephens 2000.
| Methods | Randomised controlled trial. Intervention delivered in a university‐based research unit | |
| Participants | 291 responders to an advertisement for cannabis treatment who reported using cannabis on ≥ 50 of the past 90 days were randomised Most participants were male (77% of the total sample) with an average age of 34.0 years. Most were white Caucasian (95%) and employed (76%). Participants reported on average 14.0 years of education Participants reported first using cannabis regularly at an average age of 19.6 years and had used cannabis for an average of 17.4 years. At baseline, participants reported using cannabis almost daily (average 74.6 of the past 90 days) and smoked on average 2.5 joints per day. Participants reported on average 9.9 problems on the Stephens Problem Scale and on average 6.7 symptoms of cannabis dependence. Participants reported accessing treatment on an average total of 3.9 previous occasions Participants reported consuming alcohol on an average of 18.1 days in the past 90 days, and using illicit drugs on 1.7 days |
|
| Interventions | Group 1: 14‐session CBT group treatment over 18 weeks (delivered in groups of 8 to 12; 50% of participants attended ≥ 10 sessions; 39% had a loved one who attended sessions; an average of 8.4 sessions were attended; n = 117). Sessions lasted 120 minutes Group 2: 2‐session MET over 4 weeks (delivered with the option of attending with a loved one, and 86% did so; on average 1.9 sessions were attended; n = 88). Sessions lasted 90 minutes Group 3: DTC (n = 86) Interventions focused on achieving abstinence. Participants were reimbursed a $60 deposit for participation. Therapist training was manual based with role‐plays. Intervention fidelity was assessed by a participant satisfaction survey |
|
| Outcomes | Cannabis using days; point‐prevalence abstinence rates; continuous abstinence rates (self report and urinalysis); joints per day; proportion attending external drug treatments; number of dependence symptoms; number of cannabis‐related problems; alcohol using days; illicit drug using days | |
| Notes | Follow‐up was provided at 1, 4, 7, 13 and 16 months Rates of follow‐up at final assessment:
Study was funded by the National Institute on Drug Abuse. Study authors reported no declarations of interest |
|
| Risk of bias | ||
| Bias | Authors' judgement | Support for judgement |
| Random sequence generation (selection bias) | Unclear risk | "Sequential eligible participants were accumulated into pools of between 20 and 30 participants and then randomly assigned to the three conditions after blocking on gender" ‐ this randomisation process was not reported |
| Allocation concealment (selection bias) | Low risk | Participants were allocated during a centrally located orientation session |
| Blinding of participants and personnel (performance bias) All outcomes | High risk | Participant and personnel blinding was not possible because of the type of intervention provided |
| Blinding of outcome assessment (detection bias) Subjective outcomes | Unclear risk | Blindness of researchers was not described. Study authors used self report questionnaires to assess primary outcomes; these were mailed to an unknown number of participants and collaterals |
| Blinding of outcome assessment (detection bias) Objective outcomes | Low risk | Urine was collected during the trial to verify self report |
| Incomplete outcome data (attrition bias) All outcomes | Low risk | Follow‐up rates were moderate, but no differences were noted between groups in rates of attrition or in key variables at baseline (Group 1: n = 103, 88.0%; Group 2: n = 80, 90.9%; Group 3: n = 79, 91.9%) |
| Selective reporting (reporting bias) | Low risk | Pre‐specified outcomes were reported and protocol is shown |
| Other bias | Low risk | Use of alcohol and other substances was measured only at baseline, although heavy use was among the exclusion criteria. No other sources of bias were found |
Stephens 2007.
| Methods | Randomised controlled trial. Intervention was delivered in a university‐based research unit | |
| Participants | 188 responders to an advertisement for a "cannabis check‐up" who reported using cannabis on ≥ 15 of the past 30 days Most participants were male (77.4%, 69.4% and 76.6% in Groups 1 to 3, respectively) and were in their early thirties (average 31.5, 32.5, and 31.5 years of age) Most participants were white Caucasian (87.1%, 87.1%, 87.5%) and employed (80.3%, 62.3%, 31.0%) Participants reported first using cannabis regularly at an average age of 18 years (18.9, 17.7, 18.6). At baseline, participants reported using cannabis almost daily (average 74.8, 74.8 and 76.8 of the past 90 days) and smoked on average 3 joints (3.3, 3.1, 3.3). Participants reported on average 6 problems (6.4, 5.3, 6.3) on the Stephens Problem Scale and on average 3 symptoms of cannabis dependence (3.9, 3.3, 3.2). Most participants reported that they were in pre‐contemplation or contemplation stages of quitting use (68%, 87%, 70%) Participants consumed approximately 2 alcoholic drinks per day (2.2, 2.0, 2.5) and used less than 1 illicit drug day per week (0.2, 0.1, 0.1) |
|
| Interventions | Group 1: 1 session of MET (88.7% of participants attended the session; n = 62) Group 2: 1 session of drug‐related health education (93.5% of participants attended the session; n = 62) Group 3: DTC (n = 64) Sessions lasted 120 minutes. No specific cannabis‐related goal was reported, and reduction or abstinence was encouraged. Participants were reimbursed up to $150 for participation. Therapist training was intensive, and intervention fidelity was ensured through supervision and review of recorded sessions by independent assessors |
|
| Outcomes | Days of cannabis use (self reported and urinalysis); joints per day; periods during which cannabis was smoked in the day; number of symptoms of dependence; number of cannabis‐related problems (Stephens Problem Scale); number of alcohol‐related problems; other substance using days; proportion using external drug treatments | |
| Notes | Follow‐up at 7 weeks, then at 6 and 12 months Rates of follow‐up at final assessment:
Analysis included motivation to quit as a mediator of outcomes, although this was not found to impact on treatment effects Study was funded by the National Institute on Drug Abuse. Study authors reported no declarations of interest |
|
| Risk of bias | ||
| Bias | Authors' judgement | Support for judgement |
| Random sequence generation (selection bias) | Low risk | "Assigned using an urn randomization program… to balance key variables (i.e. sex; ethnicity; white versus non‐white; stage of change: precontemplation/contemplation versus preparation)" |
| Allocation concealment (selection bias) | Low risk | Participants were centrally allocated, although the process was unclear |
| Blinding of participants and personnel (performance bias) All outcomes | High risk | Participant and personnel blinding was not possible because of the type of intervention provided |
| Blinding of outcome assessment (detection bias) Subjective outcomes | Low risk | "The research staff was trained carefully and monitored routinely in the standardized administration of all measures but was aware of assigned condition" |
| Blinding of outcome assessment (detection bias) Objective outcomes | Low risk | Urine was collected during the trial period to verify self report |
| Incomplete outcome data (attrition bias) All outcomes | Low risk | "Rates of attrition from follow‐ups were low and did not differ significantly by condition" Rates at final assessment:
|
| Selective reporting (reporting bias) | Low risk | Pre‐specified outcomes were reported and protocol is shown |
| Other bias | Low risk | Previous cannabis treatments were not assessed (although treatments during the trial period were assessed and concurrent treatment was excluded). The proportion reporting a motivation to change was significantly different between groups at baseline but was included as a co‐variate in analysis. At follow‐up, participants in Group 2 who did not attend follow‐up at 6 and 12 months reported fewer marijuana‐related problems at baseline than those who did attend. Participants in Group 3 who did not attend 7‐week follow‐up reported more baseline marijuana dependence symptoms compared with those who did attend, and participants in Group 1 who did not attend the 12‐month follow‐up reported fewer baseline marijuana dependence symptoms than those who did attend. "Therefore, the baseline measures of marijuana ‐ problems and dependence symptoms ‐ were also included as covariates in all analyses, and multiple approaches to handling missing data were used to assess the robustness of findings". No other bias was found |
ASI: Addiction Severity Index
AUDIT: Alcohol Use Disorders Identification Test BDI: Beck Depression Inventory
BDI‐SF: Beck Depression Inventory, Short Form BIS: Birchwood Insight Scale
BPRS: Brief Psychiatric Rating Scale
BSI: Brief Symptom Inventory CBT: Cognitive‐behavioural therapy
CDSS: Calgary Depression Scale for Schizophrenia CM: Contingency management
CPQ: Cannabis Problems Questionnaire
CUPIT: Cannabis Use Problems Identification Test
DAI: Drug Attitude Inventory
DAST: Drug Abuse Screening Test
DC: Drug counselling DSM‐III‐R: Diagnostical and Statistical Manual of Mental Disorders (3rd edition Revised) DSM‐IV: Diagnostical and Statistical Manual of Mental Disorders (4th edition)
DTC: Delayed treatment control
GAF: Global Assessment of Functioning Scale ITT: Intention to Treat
KAPQ: Knowledge About Psychosis Questionnaire MET: Motivational enhancement therapy
MPS: Marijuana Problem Scale
RMPI: Rutger’s Marijuana Problem Index
SANS: Scale for the Assessment of Negative Symptoms
SAPS: Scale for the Assessment of Positive Symptoms
SCID: Structured Clinical Interview for Diagnostic and Statistical Manual of Mental Disorders SCL‐90‐R: Symptom Check List 90 Revised SCQ: Social Communication Questionnaire
SDS: Severity of Dependence Scale
SOFAS: Social and Occupational Functioning Assessment Scale
SPS: Stephens Problem Scale URICA: University of Rhode Island Change Assessment Scale
WHOQOL: World Health Organization Quality of Life assessment
Characteristics of excluded studies [ordered by study ID]
| Study | Reason for exclusion |
|---|---|
| Amaro 2014 | Most of the sample reported using other illicit substances or alcohol near daily or reported another substance use disorder |
| Andersen 1986 | Most of the sample did not report experiencing cannabis use disorder or at least near daily use |
| Babor 2002 | Most included participants were 17 years of age or younger. Also, the study was narrative only or did not meet any inclusion criteria and was largely irrelevant |
| Baker 2002 | Most of the sample did not report experiencing cannabis use disorder or at least near daily use |
| Barrowclough 2006 | Published as an abstract only with no full text available and thus was mostly narrative and largely irrelevant |
| Battjes 2004 | Most included participants were 17 years of age or younger. Also, the study was narrative only or did not meet any inclusion criteria and was largely irrelevant |
| Bellack 2006 | Most of the sample did not report experiencing cannabis use disorder or at least near daily use |
| Blevins 2014 | Study did not include a comparison between treatment and control groups |
| Bowen 2006 | Most of the sample did not report experiencing cannabis use disorder or at least near daily use |
| Bucci 2010 | Most of the sample did not report experiencing cannabis use disorder or at least near daily use |
| Buchan 2002 | Most included participants were 17 years of age or younger, and the study did not include a comparison between treatment and control groups |
| Buchowski 2011 | Study did not include a comparison between treatment and control groups |
| Burleson 2005 | Most included participants were 17 years of age or younger |
| Chang 2014 | Most of the sample reported using other illicit substances or alcohol near daily or reported another substance use disorder |
| Chariot 2014 | Most of the sample reported using other illicit substances or alcohol near daily or reported another substance use disorder |
| Christoff 2014 | Intervention could not be delivered in an out‐patient setting |
| Comely 2006 | Published as an abstract only with no full text available and thus was mostly narrative and largely irrelevant |
| Copeland 2007 | Study was narrative only and explored treatment outcomes of individuals in legal settings who were co‐erced or voluntarily accessed various treatments |
| Copeland 2008 | Published as an abstract only with no full text available and thus was mostly narrative and largely irrelevant |
| Croquette‐Krokar 2004 | Published as an abstract only with no full text available and thus was mostly narrative and largely irrelevant |
| Dau 2011 | Most of the sample did not report experiencing cannabis use disorder or at least near daily use |
| de Gee 2014 | Most included participants were 17 years of age or younger |
| Elliott 2014 | Intervention could not be delivered in an out‐patient setting. |
| Faulkner 2009 | Secondary analysis of audio recordings from a separate motivational interviewing study |
| Fohlmann 2008 | Published as an abstract only with no full text available and thus was mostly narrative and largely irrelevant |
| Fohlmann 2010 | Published as an abstract only with no full text available and thus was mostly narrative and largely irrelevant |
| Gantner 2006 | Preliminary results of an intervention with most included participants 17 years of age or younger |
| Gantner 2010 | Chiefly descriptive of participant experiences related to an intervention designed for cannabis using adolescents (17 years of age or younger) |
| Gmel 2013 | Most of the sample did not report experiencing cannabis use disorder or at least near daily use |
| Godley 2010 | Most included participants were 17 years of age or younger |
| Godley 2014 | Most included participants were 17 years of age or younger |
| Gonzalez‐Menendez 2014 | Most of the sample reported using other illicit substances or alcohol near daily or reported another substance use disorder |
| Gray 2005 | Most included participants were 17 years of age or younger, and the study did not include a comparison between treatment and control groups |
| Grow 2014 | Most of the sample reported using other illicit substances or alcohol near daily or reported another substance use disorder |
| Haller 2009 | Most of the sample did not report experiencing cannabis use disorder or at least near daily use |
| Hathaway 2009 | Study did not include a comparison between treatment and control groups |
| Hendricks 2013 | Most participants were 17 years of age or younger |
| Hendriks 2011 | Most included participants were 17 years of age or younger |
| Hides 2011 | Most of the sample reported using other illicit substances or alcohol near daily or reported another substance use disorder |
| Hides 2013 | Most of the sample reported using other illicit substances or alcohol near daily or reported another substance use disorder |
| Hill 2013 | Study did not include a comparison between treatment and control groups |
| Hjorthoj 2008 | Study was narrative only and detailed the protocol of the CapOpus cannabis treatment trial (Fohlmann 2008) |
| Hjorthoj 2008b | Study presented preliminary results only |
| Hjorthoj 2012 | Published as an abstract only with no full text available and thus was mostly narrative and largely irrelevant |
| Hjorthoj 2013 | Most of the sample reported using other illicit substances or alcohol near daily or reported another substance use disorder |
| Huesler 2006 | Published as an abstract only with no full text available and thus was mostly narrative and largely irrelevant |
| Hunter 2012 | Most included participants were 17 years of age or younger |
| Jouanne 2010 | Study was narrative only and detailed the protocol of an intervention designed for adolescent participants (17 years of age or younger) |
| Killeen 2012 | Study did not include a comparison between treatment and control groups |
| Koutras 2008 | Published as an abstract only with no full text available and thus was mostly narrative and largely irrelevant |
| Kraanen 2013 | Most of the sample did not report experiencing cannabis use disorder or at least near daily use |
| Lanza 2014 | Most of the sample reported using other illicit substances or alcohol near daily or reported another substance use disorder |
| Laporte 2014 | Study described the protocol for the CANABIC treatment trial |
| Lee 2014a | Intervention could not be delivered in an out‐patient setting |
| Lee 2014b | Intervention could not be delivered in an out‐patient setting |
| Liddle 2002 | Published as an abstract only with no full text available and thus was mostly narrative and largely irrelevant |
| Litt 2012 | Study was narrative only and evaluated a measure of coping in treatment for cannabis dependence |
| Lozano 2006 | Study did not include a comparison between treatment and control groups |
| Martin 2008 | Most included participants were 17 years of age or younger |
| McCambridge 2004 | Most included participants were 17 years of age or younger |
| McCambridge 2005 | Most participants were not 18 years of age or older, and most of the sample did not report experiencing cannabis use disorder or at least near daily use |
| McGarvey 2014 | Most included participants were 17 years of age or younger |
| McHugo 1999 | Most of the sample reported using other illicit substances or alcohol near daily or reported another substance use disorder |
| Metrik 2010 | Published as an abstract only with no full text available and thus was mostly narrative and largely irrelevant |
| Morakinyo 1983 | Study did not include a comparison between treatment and control groups |
| Morrens 2011 | Study was narrative and described separate substance use treatment for patients with schizophrenia |
| Murphy 2012 | Most of the sample did not report experiencing cannabis use disorder or at least near daily use |
| Nagel 2009 | Most of the sample did not report experiencing cannabis use disorder or at least near daily use |
| Nordentoft 2009 | Published as an abstract only with no full text available and thus was mostly narrative and largely irrelevant |
| O'Farrell 2010 | Most of the sample did not report experiencing cannabis use disorder or at least near daily use |
| Palfai 2014 | Intervention could not be delivered in an out‐patient setting |
| Phan 2009 | Article was descriptive only and focused on how motivational interviewing can assist in treating adolescents with addictive behaviour |
| Phan 2009b | Protocol and description of the INCANT intervention for substance using adolescents (17 years of age or younger) |
| Phan 2010 | Study was narrative only and detailed the protocol of the INCANT intervention designed for adolescent participants (17 years of age or younger) |
| Roy‐Byrne 2014 | Most of the sample reported using other illicit substances or alcohol near daily or reported another substance use disorder |
| SAMHSA 2000 | Study was narrative only or did not meet any inclusion criteria and was largely irrelevant |
| Santisteban 2003 | Most included participants were 17 years of age or younger |
| Schaub 2014 | Most included participants were 17 years of age or younger |
| Schnoll 1986 | Study was a review article on cannabis treatments |
| Schwartz 2014 | Intervention could not be delivered in an out‐patient setting |
| Seneviratne 2007 | Article is chiefly narrative and describes the processes of motivational interviewing |
| Shrier 2014 | Intervention could not be delivered in an out‐patient setting |
| Sigmon 2000 | Most of the sample reported using other illicit substances or alcohol near daily or reported another substance use disorder |
| Sigmon 2006 | Participants had serious mental illness, and most of the sample reported using other illicit substances or alcohol near daily or reported another substance use disorder |
| Simundson 2012 | Published as an abstract only with no full text available and thus was mostly narrative and largely irrelevant |
| Sinha 2003 | Most of the sample reported using other illicit substances or alcohol near daily or reported another substance use disorder |
| Smeerdijk 2009 | Published as an abstract only with no full text available and thus was mostly narrative and largely irrelevant |
| Smith 1988 | Study did not include a comparison between treatment and control groups |
| Stanger 2009 | Most included participants were 17 years of age or younger |
| Stanger 2012 | Most included participants were 17 years of age or younger |
| Steinberg 2002 | Study w(as primarily narrative and included a discussion of the included trial (MTPRG 2004) |
| Strang 2004 | Study investigated the predictive effect of practitioner ratings and other intervention characteristics on cessation of cannabis smoking. Excluded on the grounds that it was largely irrelevant, as no suitable outcome data were provided |
| Swift 2001 | Published as an abstract only with no full text available and thus was mostly narrative and largely irrelevant |
| Walker 2006 | Most included participants were 17 years of age or younger |
| Walker 2011 | Most included participants were 17 years of age or younger |
| Werder 2012 | Published as an abstract only with no full text available and thus was mostly narrative and largely irrelevant |
| Wesley 2009 | Most of the sample reported using other illicit substances or alcohol near daily or reported another substance use disorder |
| Weymann 2011 | Study investigated the impact of therapist variables on treatment outcomes related to an intervention, with most included participants 17 years of age or younger |
| White 2006 | Most of the sample did not report experiencing cannabis use disorder or at least near daily use |
| Winters 2014 | Most included participants were 17 years of age or younger |
| Wittchen 2010 | Published as an abstract only with no full text available and thus was mostly narrative and largely irrelevant |
| Woolard 2013 | Most of the sample did not report experiencing cannabis use disorder or at least near daily use |
Differences between protocol and review
None.
Contributions of authors
Two review authors independently screened the titles and abstracts of all publications obtained by the search strategy (Peter Gates and Pamela Sabioni). We obtained all potentially eligible studies as full‐text articles, and two review authors independently assessed them for inclusion. In doubtful or controversial cases, review authors discussed all identified discrepancies and reached consensus on all items. Jan Copeland, Linda Gowing and Bernard Le Foll offered guidance regarding inclusion/exclusion criteria and provided comments on and changes to draft manuscripts.
Sources of support
Internal sources
No sources of support supplied
External sources
EDAP Project (Evidence for Drugs and Alcohol Policy) sponsored by the European Community ‐ Directorate Public Health (Grant Agreement SPC.2002454), UK.
-
National Institutes of Health/ National Institute on Drug Abuse (NIDA), USA.
Research reported in this publication was partly supported by the National Institute On Drug Abuse of the National Institutes of Health under Award Number R21DA031906 awarded to BLF. The content is solely the responsibility of the authors and does not necessarily represent the official views of the National Institutes of Health
Declarations of interest
Dr Bernard Le Foll and Prof Jan Copeland have received donations of nabiximols and Sativex from GW Pharma.
Edited (no change to conclusions)
References
References to studies included in this review
Bernstein 2009 {published data only}
- Bernstein E, Edwards E, Dorfman D, Heeren T, Bliss C, Bernstein J. Screening and brief intervention to reduce marijuana use among youth and young adults in a paediatric emergency department. Academic Emergency Medicine 2009;16(11):1174‐85. [DOI] [PMC free article] [PubMed] [Google Scholar]
Bonsack 2011 {published data only}
- Bonsack C, Gibellini Manetti S, Favrod J, Montagrin Y, Besson J, Bovet P, et al. Motivational intervention to reduce cannabis use in young people with psychosis: a randomized controlled trial. Psychotherapy and Psychosomatics 2011;80(5):287‐97. [DOI] [PubMed] [Google Scholar]
- Bonsack C, Montagrin Y, Favrod J, Gibellini S, Conus P. Motivational interviewing for cannabis users with psychotic disorders. Encephale 2007;33(5):819‐26. [DOI] [PubMed] [Google Scholar]
- Bonsack C, Montagrin Y, Gibellini S, Favrod J, Besson J, Conus P. Practice of a motivational intervention for cannabis users with psychosis. Schweizer Archiv fur Neurologie und Psychiatrie 2008;159(6):378‐85. [Google Scholar]
Budney 2000 {published data only}
- Budney AJ, Higgins ST, Radonovich KJ, Novy PL. Adding voucher‐based incentives to coping skills and motivational enhancement improves outcomes during treatment for marijuana dependence. Journal of Consulting and Clinical Psychology 2000;68(6):1051‐61. [DOI] [PubMed] [Google Scholar]
- Moore BA, Budney AJ. Abstinence at intake for marijuana dependence treatment predicts response. Drug and Alcohol Dependence 2002;67(3):249‐57. [DOI] [PubMed] [Google Scholar]
Budney 2006 {published data only}
- Budney AJ, Moore BA, Rocha HL, Higgins ST. Clinical trial of abstinence‐based vouchers and cognitive‐behavioral therapy for cannabis dependence. Journal of Consulting and Clinical Psychology 2006;74(2):307‐16. [DOI] [PubMed] [Google Scholar]
Carroll 2006 {published data only}
- Carroll KM, Easton CJ, Nich C, Hunkele KA, Neavins TM, Sinha R, et al. The use of contingency management and motivational/skills‐building therapy to treat young adults with marijuana dependence. Journal of Consulting and Clinical Psychology 2006;74(5):955‐66. [DOI] [PMC free article] [PubMed] [Google Scholar]
- Easton CJ, Oberleitner LM, Scott MC, Crowley MJ, Babuscio TA, Carroll KM. Differences in treatment outcome among marijuana‐dependent young adults with and without antisocial personality disorder. American Journal of Drug and Alcohol Abuse 2012;38(4):305‐13. [DOI] [PMC free article] [PubMed] [Google Scholar]
- Montgomery L, Petry NM, Carroll KM. Moderating effects of race in clinical trial participation and outcomes among marijuana‐dependent young adults. Drug and Alcohol Dependence 2012;126(3):333‐9. [DOI] [PMC free article] [PubMed] [Google Scholar]
- Olmstead TA, Sindelar JL, Easton CJ, Carroll KM. The cost‐effectiveness of four treatments for marijuana dependence. Addiction 2007;102(9):1443‐53. [DOI] [PMC free article] [PubMed] [Google Scholar]
Carroll 2012 {published data only}
- Carroll KM, Nich C, Lapaglia DM, Peters EN, Easton CJ, Petry NM. Combining cognitive behavioral therapy and contingency management to enhance their effects in treating cannabis dependence: less can be more, more or less. Addiction 2012;107(9):1650‐9. [DOI] [PMC free article] [PubMed] [Google Scholar]
- Kober H, DeVito EE, DeLeone CM, Carroll KM, Potenza MN. Cannabis abstinence during treatment and one‐year follow‐up: relationship to neural activity in men. Neuropsychopharmacology 2014;39(10):2288‐98. [DOI] [PMC free article] [PubMed] [Google Scholar]
- Peters EN, Nich C, Carroll KM. Primary outcomes in two randomized controlled trials of treatments for cannabis use disorders. Drug and Alcohol Dependence 2011;118:408‐16. [DOI] [PMC free article] [PubMed] [Google Scholar]
- Peters EN, Petry NM, Lapaglia DM, Reynolds B, Carroll KM. Delay discounting in adults receiving treatment for marijuana dependence. Experimental and Clinical Psychopharmacology 2013;21(1):46‐54. [DOI] [PMC free article] [PubMed] [Google Scholar]
Copeland 2001 {published data only}
- Copeland J, Swift W, Rees V. Clinical profile of participants in a brief cognitive‐behavioral interventions for cannabis use disorder. Journal of Substance Abuse Treatment 2001;20(1):45‐52. [DOI] [PubMed] [Google Scholar]
- Copeland J, Swift W, Roffman R, Stephens R. A randomised controlled trial of brief cognitive‐behavioral interventions for cannabis use disorder. Journal of Substance Abuse Treatment 2001;21(2):55‐64. [DOI] [PubMed] [Google Scholar]
de Dios 2012 {published data only}
- Dios MA, Herman DS, Britton WB, Hagerty CE, Anderson BJ, Stein MD. Motivational and mindfulness intervention for young adult female marijuana users. Journal of Substance Abuse Treatment 2012;42(1):56‐64. [DOI] [PMC free article] [PubMed] [Google Scholar]
Edwards 2006 {published data only}
- Edwards J, Elkins K, Hinton M, Harrigan SM, Donovan K, Athanasopoulos O, et al. Randomized controlled trial of a cannabis‐focused intervention for young people with first‐episode psychosis. Acta Psychiatrica Scandinavica 2006;114(2):109‐17. [DOI] [PubMed] [Google Scholar]
Fischer 2012 {published data only}
- Fischer B, Dawe M, McGuire F, Shuper PA, Capler R, Bilsker D, et al. Feasibility and impact of brief interventions for frequent cannabis users in Canada. Journal of Substance Abuse Treatment 2013;44(1):132‐8. [Google Scholar]
- Fischer B, Jones W, Shuper P, Rehm J. 12‐Month follow‐up of an exploratory 'brief intervention' for high‐frequency cannabis users among Canadian university students. Substance Abuse Treatment Prevention and Policy 2012;7:15. [DOI] [PMC free article] [PubMed] [Google Scholar]
Hoch 2012 {published data only}
- Hoch E, Buhringer G, Henker J, Rohrbacher H, Noack R, Pixa A, et al. Design of the CANDIS*‐study for the treatment of cannabis use disorders: an example of translational research. Sucht 2011;57(3):183‐92. [Google Scholar]
- Hoch E, Noack R, Henker J, Pixa A, Hofler M, Behrendt S, et al. Efficacy of a targeted cognitive‐behavioral treatment program for cannabis use disorders (CANDIS). European Neuropsychopharmacology 2012;22(4):267‐80. [DOI] [PubMed] [Google Scholar]
Hoch 2014 {published data only}
- Hoch E, Bühringer G, Pixa A, Dittmer K, Henker J, Seifert A, et al. CANDIS treatment program for cannabis use disorders: findings from a randomized multi‐site translational trial. Drug and Alcohol Dependence 2014;134:185‐93. [DOI] [PubMed] [Google Scholar]
Jungerman 2007 {published data only}
- Jungerman FS, Andreoni S, Laranjeira R. Short term impact of same intensity but different duration interventions for cannabis users. Drug and Alcohol Dependence 2007;90:120‐7. [DOI] [PubMed] [Google Scholar]
Kadden 2007 {published data only}
- Kadden RM, Litt MD, Kabela‐Cormier E, Petry NM. Abstinence rates following behavioral treatments for marijuana dependence. Addictive Behaviors 2007;32:1220‐36. [DOI] [PMC free article] [PubMed] [Google Scholar]
Lee 2013 {published data only}
- Lee CM, Kilmer JR, Neighbors C, Atkins DC, Zheng C, Walker DD, et al. Indicated prevention for college student marijuana use: a randomized controlled trial. Journal of Consulting and Clinical Psychology 2013;81(4):702‐9. [DOI] [PMC free article] [PubMed] [Google Scholar]
Litt 2013 {published data only}
- Litt MD, Kadden RM, Petry NM. Behavioral treatment for marijuana dependence: randomized trial of contingency management and self‐efficacy enhancement. Addictive Behaviors 2013;38(3):1764‐75. [DOI] [PMC free article] [PubMed] [Google Scholar]
Madigan 2013 {published data only}
- Madigan K, Lawlor E, Brennan D, Turner N, Kinsella A, O'Connor J, et al. A multi‐centre, randomised controlled trial of a group psychological intervention for psychosis with comorbid cannabis dependence over the early course of illness. Schizophrenia Research 2013;143(1):138‐42. [DOI] [PubMed] [Google Scholar]
MTPRG 2004 {published data only}
- Banes KE, Stephens RS, Blevins CE, Walker DD, Roffman RA. Changing motives for use: outcomes from a cognitive‐behavioral intervention for marijuana‐dependent adults. Drug and Alcohol Dependence 2014;139:41‐6. [DOI] [PMC free article] [PubMed] [Google Scholar]
- Buckner JD, Carroll KM. Effect of anxiety on treatment presentation and outcome: results from the Marijuana Treatment Project. Psychiatry Research 2010;178(3):493‐500. [DOI] [PMC free article] [PubMed] [Google Scholar]
- Gibbons CJ, Nich C, Steinberg K, Roffman RA, Corvino J, Babor TF, et al. Treatment process, alliance and outcome in brief versus extended treatments for marijuana dependence. Addiction 2010;105(10):1799‐808. [DOI] [PMC free article] [PubMed] [Google Scholar]
- Litt MD, Kadden RM, Kabela‐Cormier E, Petry NM. Coping skills training and contingency management treatments for marijuana dependence: exploring mechanisms of behavior change. Addiction 2008;103(4):638‐48. [DOI] [PMC free article] [PubMed] [Google Scholar]
- Litt MD, Kadden RM, Stephens RS. Coping and self‐efficacy in marijuana treatment: results from the marijuana treatment project. Journal of Consulting and Clinical Psychology 2005;73(6):1015‐25. [DOI] [PubMed] [Google Scholar]
- Peters EN, Nich C, Carroll KM. Primary outcomes in two randomized controlled trials of treatments for cannabis use disorders. Drug and Alcohol Dependence 2011;118:408‐16. [DOI] [PMC free article] [PubMed] [Google Scholar]
- Stephens RS, Babor TF, Kadden R, Miller M, Marijuana Treatment Project Research Group. The Marijuana Treatment Project: rationale, design and participant characteristics. Addiction 2002;97(Suppl 1):109‐24. [DOI] [PubMed] [Google Scholar]
- The Marijuana Treatment Project Research Group. Brief treatments for cannabis dependence: findings from a randomized multisite trial. Journal of Consulting and Clinical Psychology 2004;72(3):455‐66. [DOI] [PubMed] [Google Scholar]
- Vendetti J, McRee B, Miller M, Christiansen K, Herrell J, Marijuana Treatment Project Research Group. Correlates of pre‐treatment drop‐out among persons with marijuana dependence. Addiction 2002;97(Suppl 1):125‐34. [DOI] [PubMed] [Google Scholar]
Roffman 1988 {published data only}
- Roffman RA, Stephens RS, Simpson EE, Whitaker DL. Treatment of marijuana dependence: preliminary results. Journal of Psychoactive Drugs 1988;20(1):129‐37. [DOI] [PubMed] [Google Scholar]
Stein 2011 {published data only}
- Stein MD, Hagerty CE, Herman DS, Phipps MG, Anderson BJ. A brief marijuana intervention for non‐treatment‐seeking young adult women. Journal of Substance Abuse Treatment 2011;40(2):189‐98. [DOI] [PMC free article] [PubMed] [Google Scholar]
Stephens 1994 {published data only}
- Roffman RA, Klepsch R, Wertz JS, Simpson EE, Stephens RS. Predictors of attrition from an outpatient marijuana‐dependence counseling program. Addictive Behaviors 1993;18(5):553‐66. [DOI] [PubMed] [Google Scholar]
- Stephens RE, Wertz JS, Roffman RA. Predictors of marijuana treatment outcomes: the role of self‐efficacy. Journal of Substance Abuse 1993;5(4):341‐53. [DOI] [PubMed] [Google Scholar]
- Stephens RS, Roffman RA, Simpson EE. Treating adult marijuana dependence: a test of the relapse prevention model. Journal of Consulting and Clinical Psychology 1994;62(1):92‐9. [DOI] [PubMed] [Google Scholar]
- Stephens RS, Wertz JS, Roffman RA. Self‐efficacy and marijuana cessation: a construct validity analysis. Journal of Consulting and Clinical Psychology 1995;63(6):1022‐31. [DOI] [PubMed] [Google Scholar]
Stephens 2000 {published data only}
- DeMarce JM, Stephens RS, Roffman RA. Psychological distress and marijuana use before and after treatment: testing cognitive‐behavioral matching hypotheses. Addictive Behaviors 2005;30(5):1055‐9. [DOI] [PubMed] [Google Scholar]
- Stephens RS, Roffman RA, Curtin L. Comparison of extended versus brief treatments for marijuana use. Journal of Consulting and Clinical Psychology 2000;68(5):898‐908. [PubMed] [Google Scholar]
Stephens 2007 {published data only}
- Stephens RS, Roffman RA, Fearer SA, Williams C, Burke RS. The Marijuana Check‐up: promoting change in ambivalent marijuana users. Addiction 2007;102(6):947‐57. [DOI] [PubMed] [Google Scholar]
References to studies excluded from this review
Amaro 2014 {published data only}
- Amaro H, Spear S, Vallejo Z, Conron K, Black DS. Feasibility, acceptability, and preliminary outcomes of a mindfulness‐based relapse prevention intervention for culturally‐diverse, low‐income women in substance use disorder treatment. Substance Use and Misuse 2014;49(5):547‐59. [DOI] [PubMed] [Google Scholar]
Andersen 1986 {published data only}
- Andersen MD. Personalized nursing: an effective intervention model for use with drug‐dependent women in an emergency room. International Journal of Addiction 1986;21(1):105‐22. [DOI] [PubMed] [Google Scholar]
Babor 2002 {published data only}
- Babor TF, Webb C, Burleson JA, Kaminer Y. Subtypes for classifying adolescents with marijuana use disorders: construct validity and clinical implications. Addiction 2002;97(Suppl 1):58‐69. [DOI] [PubMed] [Google Scholar]
Baker 2002 {published data only}
- Baker A, Lewin T, Reichler H, Clancy R, Carr V, Garrett R, et al. Evaluation of a motivational interview for substance use within psychiatric in‐patient services. Addiction 2002;97(10):1329‐37. [DOI] [PubMed] [Google Scholar]
Barrowclough 2006 {published data only}
- Barrowclough C. Psychological intervention for cannabis misuse in psychosis. Schizophrenia Research 2006;86:S26‐7. [Google Scholar]
Battjes 2004 {published data only}
- Battjes RJ, Gordon SM, O'Grady KE, Kinlock TW, Katz EC, Sears EA. Evaluation of a group‐based substance abuse treatment program for adolescents. Journal of Substance Abuse Treatment 2004;27:123‐34. [DOI] [PubMed] [Google Scholar]
Bellack 2006 {published data only}
- Bellack AS, Bennett ME, Gearon JS, Brown CH, Yang YA. A randomized clinical trial of a new behavioral treatment for drug abuse in people with severe and persistent mental illness. Archives of General Psychiatry 2006;63(4):426‐32. [DOI] [PubMed] [Google Scholar]
Blevins 2014 {published data only}
- Blevins CE, Stephens RS, Walker DD, Roffman RA. Situational determinants of use and treatment outcomes in marijuana dependent adults. Addictive Behaviors 2014;39(3):546‐52. [DOI] [PMC free article] [PubMed] [Google Scholar]
Bowen 2006 {published data only}
- Bowen S, Witkiewitz K, Dillworth TM, Blume AW, Chawla N, Simpson TL, et al. Mindfulness meditation and substance use in an incarcerated population. Psychology of Addictive Behaviors 2006;20(3):343‐7. [DOI] [PubMed] [Google Scholar]
Bucci 2010 {published data only}
- Bucci S, Baker A, Halpin SA, Hides L, Lewin TJ, Carr VJ, et al. Intervention for cannabis use in young people at ultra high risk for psychosis and in early psychosis. Mental Health and Substance Use: Dual Diagnosis 2010;3(1):66‐73. [Google Scholar]
Buchan 2002 {published data only}
- Buchan BJ, Dennis M, Tims FM, Diamond GS. Cannabis use: consistency and validity of self‐report, on‐site urine testing and laboratory testing. Addiction 2002;97(Suppl 1):98‐108. [DOI] [PubMed] [Google Scholar]
Buchowski 2011 {published data only}
- Buchowski MS, Meade NN, Charboneau E, Park S, Dietrich MS, Cowan RL, et al. Aerobic exercise training reduces cannabis craving and use in non‐treatment seeking cannabis‐dependent adults. PLoS ONE 2011;6(3):e17465. [DOI] [PMC free article] [PubMed] [Google Scholar]
Burleson 2005 {published data only}
- Burleson JA, Kaminer Y. Self‐efficacy as a predictor of treatment outcome in adolescent substance use disorders. Addictive Behaviors 2005;30(9):1751‐64. [DOI] [PubMed] [Google Scholar]
Chang 2014 {published data only}
- Chang B‐H, Sommers E. Acupuncture and relaxation response for craving and anxiety reduction among military veterans in recovery from substance use disorder. The American Journal on Addictions 2014;23(2):129‐36. [DOI] [PubMed] [Google Scholar]
Chariot 2014 {published data only}
- Chariot P, Lepresle A, Lefevre T, Boraud C, Barthes A, Tedlaouti M. Alcohol and substance screening and brief intervention for detainees kept in police custody. A feasibility study. Drug and Alcohol Dependence 2014;134:235‐41. [DOI] [PubMed] [Google Scholar]
Christoff 2014 {published data only}
- Christoff ADO, Boerngen‐Lacerda R. Reducing substance involvement in college students: a three‐arm parallel‐group randomized controlled trial of a computer‐based intervention. Addictive Behaviors 2015;45:164‐71. [DOI] [PubMed] [Google Scholar]
Comely 2006 {published data only}
- Comely C. Assessment and treatment of cannabis abuse and dependence ‐ a practitioner's perspective. Australian Journal of Psychology 2006;58:125. [Google Scholar]
Copeland 2007 {published data only}
- Copeland J, Maxwell JC. Cannabis treatment outcomes among legally coerced and non‐coerced adults. BMC Public Health 2007;7:111. [DOI] [PMC free article] [PubMed] [Google Scholar]
Copeland 2008 {published data only}
- Copeland J. Brief personalised motivational interviewing reduces frequency of marijuana use in regular users ambivalent to change. Evidence Based Mental Health 2008;11(1):22. [DOI] [PubMed] [Google Scholar]
Croquette‐Krokar 2004 {published data only}
- Croquette‐Krokar M, Cascone P, Liengme N, Chinet L. Cannabis abuse in adolescents. A comparison of clients attending two specific psychotherapeutic units using a common assessment instrument. European Psychiatry 2004;19:160S. [Google Scholar]
Dau 2011 {published data only}
- Dau W, Schmidt A, Schmidt AF, Krug T, Lapple SE, Banger M. Five minutes a day: compass ‐ a short psychotherapeutic intervention for young cannabis/party drug inpatients. Sucht 2011;57(3):203‐14. [Google Scholar]
de Gee 2014 {published data only}
- Gee EA, Verdurmen JE, Bransen E, Jonge JM, Schippers GM. A randomized controlled trial of a brief motivational enhancement for non‐treatment‐seeking adolescent cannabis users. Journal of Substance Abuse Treatment 2014;47(3):181‐8. [DOI] [PubMed] [Google Scholar]
Elliott 2014 {published data only}
- Elliott JC, Carey KB, Vanable PA. A preliminary evaluation of a web‐based intervention for college marijuana use. Psychology of Addictive Behaviors 2014;28(1):288‐93. [DOI] [PubMed] [Google Scholar]
Faulkner 2009 {published data only}
- Faulkner N, McCambridge J, Slym RL, Rollnick S. It ain't what you do, it's the way that you do it: a qualitative study of advice for young cannabis users. Drug and Alcohol Review 2009;28(2):129‐34. [DOI] [PubMed] [Google Scholar]
Fohlmann 2008 {published data only}
- Fohlmann A, Hjorthoj C, Nordentoft M, Madsen MTR, Larsen AM. The CapOpus treatment model ‐ a specialized 6‐month treatment program for young outpatients with cannabis abuse and psychosis. Early Intervention in Psychiatry 2008;2:A121. [Google Scholar]
Fohlmann 2010 {published data only}
- Fohlmann AH, Hjorthoej C, Larsen A, Nordentoft M. CapOpus. Randomized clinical trial: specialized addiction treatment (MI & CBT) versus treatment as usual for young patients with cannabis abuse and psychosis. Early Intervention in Psychiatry 2010;4:160. [Google Scholar]
Gantner 2006 {published data only}
- Gantner A. Multidimensional family therapy for adolescent clients with cannabis use disorders ‐ Results and experience from the INCANT pilot study. Praxis der Kinderpsychologie und Kinderpsychiatrie 2006;55(7):520‐32. [PubMed] [Google Scholar]
Gantner 2010 {published data only}
- Gantner A, Spohr B. Multidimensional family therapy in practice: clinical experiences with adolescent cannabis abusers and their families. Sucht 2010;56(1):71‐6. [Google Scholar]
Gmel 2013 {published data only}
- Gmel G, Gaume J, Bertholet N, Flückiger J, Daeppen JB. Effectiveness of a brief integrative multiple substance use intervention among young men with and without booster session. Journal of Substance Abuse Treatment 2013;44(2):231‐40. [DOI] [PubMed] [Google Scholar]
Godley 2010 {published data only}
- Godley SH, Garner BR, Passetti LL, Funk RR, Dennis ML, Godley MD. Adolescent outpatient treatment and continuing care: main findings from a randomized clinical trial. Drug and Alcohol Dependence 2010;110:44‐54. [DOI] [PMC free article] [PubMed] [Google Scholar]
Godley 2014 {published data only}
- Godley MD, Godley SH, Dennis ML, Funk RR, Passetti LL, Petry NM. A randomized trial of assertive continuing care and contingency management for adolescents with substance use disorders. Journal of Consulting and Clinical Psychology 2014;82(1):40‐51. [DOI] [PMC free article] [PubMed] [Google Scholar]
Gonzalez‐Menendez 2014 {published data only}
- Gonzalez‐Menendez A, Fernandez P, Rodriguez F, Villagra P. Long‐term outcomes of acceptance and commitment therapy in drug‐dependent female inmates: a randomized controlled trial. International Journal of Clinical and Health Psychology 2014;14(1):18‐27. [Google Scholar]
Gray 2005 {published data only}
- Gray E, McCambridge J, Strang J. The effectiveness of motivational interviewing delivered by youth workers in reducing drinking, cigarette and cannabis smoking among young people: quasi‐experimental pilot study. Alcohol and Alcoholism 2005;40(6):535‐9. [DOI] [PubMed] [Google Scholar]
Grow 2014 {published data only}
- Grow JC. Effects of a pretreatment brief motivational intervention on treatment engagement in CBT‐based and mindfulness‐based relapse prevention. Dissertation Abstracts International: Section B: The Sciences and Engineering 2014; Vol. 72, issue 2‐B(E).
Haller 2009 {published data only}
- Haller DM, Meynard A, Lefebvre D, Tylee A, Narring F, Broers B. Brief intervention addressing excessive cannabis use in young people consulting their GP: a pilot study. British Journal of General Practice 2009;59(560):166‐72. [DOI] [PMC free article] [PubMed] [Google Scholar]
Hathaway 2009 {published data only}
- Hathaway AD, Callaghan RC, Macdonald S, Erickson PG. Cannabis dependence as a primary drug use‐related problem: the case for harm reduction‐oriented treatment options. Substance Use and Misuse 2009;44(7):990‐1008. [DOI] [PubMed] [Google Scholar]
Hendricks 2013 {published data only}
- Hendriks VM, Schee E, Blanken P. Multidimensional family therapy and cognitive behavioral therapy in adolescents with a cannabis use disorder: a randomised controlled study. Tijdschrift voor Psychiatrie 2013;55(10):747‐59. [PubMed] [Google Scholar]
Hendriks 2011 {published data only}
- Hendriks V, Schee E, Blanken P. Treatment of adolescents with a cannabis use disorder: main findings of a randomized controlled trial comparing multidimensional family therapy and cognitive behavioral therapy in The Netherlands. Drug and Alcohol Dependence 2011;119:64‐71. [DOI] [PubMed] [Google Scholar]
Hides 2011 {published data only}
- Hides LM, Elkins KS, Scaffidi A, Cotton SM, Carroll S, Lubman DI. Does the addition of integrated cognitive behaviour therapy and motivational interviewing improve the outcomes of standard care for young people with comorbid depression and substance misuse?. Medical Journal of Australia 2011;195(S3):S31‐7. [DOI] [PubMed] [Google Scholar]
Hides 2013 {published data only}
- Hides L, Carroll S, Scott R, Cotton S, Baker A, Lubman DI. Quik fix: a randomized controlled trial of an enhanced brief motivational interviewing intervention for alcohol/cannabis and psychological distress in young people. Psychotherapy and Psychosomatics 2013;82(2):122‐4. [DOI] [PubMed] [Google Scholar]
Hill 2013 {published data only}
- Hill KP, Toto LH, Lukas SE, Weiss RD, Trksak GH, Rodolico JM, et al. Cognitive behavioral therapy and the nicotine transdermal patch for dual nicotine and cannabis dependence: a pilot study. American Journal on Addictions 2013;22(3):233‐8. [DOI] [PMC free article] [PubMed] [Google Scholar]
Hjorthoj 2008 {published data only}
- Hjorthoj C, Fohlmann A, Larsen AM, Madsen MT, Vesterager L, Gluud C, et al. Design paper: the CapOpus trial: a randomized, parallel‐group, observer‐blinded clinical trial of specialized addiction treatment versus treatment as usual for young patients with cannabis abuse and psychosis. Trials 2008;9:42. [DOI] [PMC free article] [PubMed] [Google Scholar]
Hjorthoj 2008b {published data only}
- Hjorthoj C, Nordentoft M, Fohlmann A, Madsen MTR, Larsen AM. Preliminary results of the CapOpus trial comparing specialized treatment with treatment as usual for cannabis misuse in people with comorbid psychosis and cannabis misuse. Early Intervention in Psychiatry 2008;2:A122. [Google Scholar]
Hjorthoj 2012 {published data only}
- Hjorthoj C, Fohlmann A, Mette Larsen A, Gluud C, Arendt M, Nordentoft M. CapOpus ‐ intervention study for cannabis use disorder in psychosis. Early Intervention in Psychiatry 2012;6:28. [Google Scholar]
Hjorthoj 2013 {published data only}
- Hjorthoj CR, Orlovska S, Fohlmann A, Nordentoft M. Psychiatric treatment following participation in the CapOpus randomized trial for patients with comorbid cannabis use disorder and psychosis. Schizophrenia Research 2013;151:191‐6. [DOI] [PubMed] [Google Scholar]
Huesler 2006 {published data only}
- Huesler G, Minder W. A binational (Switzerland, Germany) intervention program for cannabis abusers. Psychology and Health 2006;21:68. [Google Scholar]
Hunter 2012 {published data only}
- Hunter SB, Ramchand R, Griffin BA, Suttorp MJ, McCaffrey D, Mona A. The effectiveness of community‐based delivery of an evidence‐based treatment for adolescent substance use. Journal of Substance Abuse Treatment 2012;43(2):211‐20. [DOI] [PMC free article] [PubMed] [Google Scholar]
Jouanne 2010 {published data only}
- Jouanne C, Phan O, Corcos M. Treatment efficacy comparison study with cannabis users or dependents adolescents: MultiDimensional Family Therapy (MDFT) versus Treatment As Usual Explicite (TAUE). Annales Medico‐Psychologiques 2010;168(7):487‐94. [Google Scholar]
Killeen 2012 {published data only}
- Killeen TK, McRae‐Clark AL, Waldrop AE, Upadhyaya H, Brady KT. Contingency management in community programs treating adolescent substance abuse: a feasibility study. Journal of Child and Adolescent Psychiatric Nursing 2012;25(1):33‐41. [DOI] [PMC free article] [PubMed] [Google Scholar]
Koutras 2008 {published data only}
- Koutras V, Iliopoulou L, Fidi E, Thomos S, Koinninou K, Gonta S, et al. Cannabis abuse treatment: a challenging aspect of an outpatient individual drug abuse therapeutic program. European Psychiatry 2008;23:S310. [Google Scholar]
Kraanen 2013 {published data only}
- Kraanen FL, Vedel E, Scholing A, Emmelkamp PMG. The comparative effectiveness of Integrated treatment for Substance abuse and Partner violence (I‐StoP) and substance abuse treatment alone: a randomized controlled trial. BMC Psychiatry 2013;13:189. [DOI] [PMC free article] [PubMed] [Google Scholar]
Lanza 2014 {published data only}
- Lanza PV, Garcia PF, Lamelas FR, Gonzalez‐Menendez A. Acceptance and commitment therapy versus cognitive behavioral therapy in the treatment of substance use disorder with incarcerated women. Journal of Clinical Psychology 2014;70(7):644‐57. [DOI] [PubMed] [Google Scholar]
Laporte 2014 {published data only}
- Laporte C, Vaillant‐Roussel H, Pereira B, Blanc O, Tanguy G, Frappé P, et al. CANABIC: CANnabis and Adolescents: effect of a Brief Intervention on their Consumption ‐ study protocol for a randomized controlled trial. Trials 2014;15:40. [DOI] [PMC free article] [PubMed] [Google Scholar]
Lee 2014a {published data only}
- Lee DC, Budney AJ, Brunette MF, Hughes JR, Etter JF, Stanger C. Treatment models for targeting tobacco use during treatment for cannabis use disorder: case series. Addictive Behaviors 2014;39(8):1224‐30. [DOI] [PMC free article] [PubMed] [Google Scholar]
Lee 2014b {published data only}
- Lee D, Schroeder JR, Karschner EL, Goodwin RS, Hirvonen J, Gorelick DA, et al. Cannabis withdrawal in chronic, frequent cannabis smokers during sustained abstinence within a closed residential environment. American Journal on Addictions 2014;23(3):234‐42. [DOI] [PMC free article] [PubMed] [Google Scholar]
Liddle 2002 {published data only}
- Liddle H, Dakof G. A randomized controlled trial of intensive outpatient, family‐based therapy vs. residential drug treatment for co‐morbid adolescent substance abusers. Drug and Alcohol Dependence 2002;66:S1. [Google Scholar]
Litt 2012 {published data only}
- Litt MD, Kadden RM, Tennen H. The nature of coping in treatment for marijuana dependence: latent structure and validation of the Coping Strategies Scale. Psychology of Addictive Behaviors 26;4:791‐800. [DOI] [PMC free article] [PubMed] [Google Scholar]
Lozano 2006 {published data only}
- Lozano BE, Stephens RS, Roffman RA. Abstinence and moderate use goals in the treatment of marijuana dependence. Addiction 2006;101(11):1589‐97. [DOI] [PubMed] [Google Scholar]
Martin 2008 {published data only}
- Martin G, Copeland J. The adolescent cannabis check‐up: randomized trial of a brief intervention for young cannabis users. Journal of Substance Abuse Treatment 2008;34(4):407‐14. [DOI] [PubMed] [Google Scholar]
McCambridge 2004 {published data only}
- McCambridge J, Strang J. The efficacy of single‐session motivational interviewing in reducing drug consumption and perceptions of drug‐related risk and harm among young people: results from a multi‐site cluster randomized trial. Addiction 2004;99(1):39‐52. [DOI] [PubMed] [Google Scholar]
McCambridge 2005 {published data only}
- McCambridge J, Strang J. Deterioration over time in effect of motivational interviewing in reducing drug consumption and related risk among young people. Addiction 2005;100(4):470‐8. [DOI] [PubMed] [Google Scholar]
McGarvey 2014 {published data only}
- McGarvey EL, Leon‐Verdin M, Bloomfield K, Wood S, Winters E, Smith J. Effectiveness of A‐CRA/ACC in treating adolescents with cannabis‐use disorders. Community Mental Health Journal 2014;50(2):150‐7. [DOI] [PubMed] [Google Scholar]
McHugo 1999 {published data only}
- McHugo GJ, Drake RE, Teague GB, Xie H. Fidelity to assertive community treatment and client outcomes in the New Hampshire dual disorders study. Psychiatric Services 1999;50(6):818‐24. [DOI] [PubMed] [Google Scholar]
Metrik 2010 {published data only}
- Metrik J. Balanced‐placebo design successfully adapted for use with marijuana. DATA: The Brown University Digest of Addiction Theory and Application 2010;29(1):8. [Google Scholar]
Morakinyo 1983 {published data only}
- Morakinyo O. Aversion therapy of cannabis dependence in Nigeria. Drug and Alcohol Dependence 1983;12(3):287‐93. [DOI] [PubMed] [Google Scholar]
Morrens 2011 {published data only}
- Morrens M, Dewilde B, Sabbe B, Dom G, Cuyper R, Moggi F. Treatment outcomes of an integrated residential programme for patients with schizophrenia and substance use disorder. European Addiction Research 2011;17(3):154‐63. [DOI] [PubMed] [Google Scholar]
Murphy 2012 {published data only}
- Murphy DA, Chen XG, Naar‐King S, Parsons JT, Adolescent Trials Network. Alcohol and marijuana use outcomes in the healthy choices motivational interviewing intervention for HIV‐positive youth. AIDS Patient Care and STDS 2012;26(2):95‐100. [DOI] [PMC free article] [PubMed] [Google Scholar]
Nagel 2009 {published data only}
- Nagel T, Robinson G, Condon J, Trauer T. Approach to treatment of mental illness and substance dependence in remote indigenous communities: results of a mixed methods study. The Australian Journal of Rural Health 2009;17(4):174‐82. [DOI] [PubMed] [Google Scholar]
Nordentoft 2009 {published data only}
- Nordentoft M, Hjorthoj C, Fohlmann A. Capopus trial: an observer‐blinded RCT of specialized addiction treatment versus standard treatment for young patients with cannabis abuse and psychosis. European Psychiatry 2009;24:S1178. [DOI] [PMC free article] [PubMed] [Google Scholar]
O'Farrell 2010 {published data only}
- O'Farrell TJ, Murphy M, Alter J, Fals‐Stewart W. Behavioral family counseling for substance abuse: a treatment development pilot study. Addictive Behaviors 2010;35(1):1‐6. [DOI] [PMC free article] [PubMed] [Google Scholar]
Palfai 2014 {published data only}
- Palfai TP, Saitz R, Winter M, Brown TA, Kypri, K, Goodness TM, et al. Web‐based screening and brief intervention for student marijuana use in a university health center: pilot study to examine the implementation of eCHECKUP TO GO in different contexts. Addictive Behaviors 39;9:1346‐52. [DOI] [PMC free article] [PubMed] [Google Scholar]
Phan 2009 {published data only}
- Phan O, Lascaux M. Motivational interviews with cannabis dependant adolescents. Annales Medico‐Psychologiques 2009;167(7):523‐8. [Google Scholar]
Phan 2009b {published data only}
- Phan O, Bonnaire C, Bastard N, Jouanne C. INCANT project. Psychotropes 2009;14(3‐4):137‐56. [Google Scholar]
Phan 2010 {published data only}
- Phan O, Jouanne C, Monge S. A random clinical trial concerning the psychotherapy of adolescents addicted to cannabis. Annales Medico‐Psychologiques 2010;168(2):145‐51. [Google Scholar]
Roy‐Byrne 2014 {published data only}
- Roy‐Byrne P, Bumgardner K, Krupski A, Dunn C, Ries R, Donovan D, et al. Brief intervention for problem drug use in safety‐net primary care settings: a randomized clinical trial. Journal of the American Medical Association 2014;312(5):492‐501. [DOI] [PMC free article] [PubMed] [Google Scholar]
SAMHSA 2000 {published data only}
- Substance Abuse and Mental Health Services Administration. SAMHSA announces advances in the treatment of adolescent marijuana users. Psychiatric Services 2000;51(11):1464. [PubMed] [Google Scholar]
Santisteban 2003 {published data only}
- Santisteban DA, Coatsworth JD, Perez‐Vidal A, Kurtines WM, Schwartz SJ, LaPerriere A, et al. Efficacy of brief strategic family therapy in modifying Hispanic adolescent behavior problems and substance use. Journal of Family Psychology 2003;17(1):121‐33. [DOI] [PMC free article] [PubMed] [Google Scholar]
Schaub 2014 {published data only}
- Schaub MP, Henderson CE, Pelc I, Tossmann P, Phan O, Hendriks V, Rowe C, Rigter H. Multidimensional family therapy decreases the rate of externalising behavioural disorder symptoms in cannabis abusing adolescents: outcomes of the INCANT trial. BMC Psychiatry 2014;14:26. [DOI] [PMC free article] [PubMed] [Google Scholar]
Schnoll 1986 {published data only}
- Schnoll SH, Daghestani AN. Treatment of marijuana abuse. Psychiatric Annals 1986;16(4):249‐54. [Google Scholar]
Schwartz 2014 {published data only}
- Schwartz RP, Gryczynski J, Mitchell SG, Gonzales A, Moseley A, Peterson TR, et al. Computerized versus in‐person brief intervention for drug misuse: a randomized clinical trial. Addiction 2014;109(7):1091‐8. [DOI] [PMC free article] [PubMed] [Google Scholar]
Seneviratne 2007 {published data only}
- Seneviratne A, Fortini C, Gaume J, Daeppen JB. A brief motivational intervention targeting multi‐risk behaviours among young people. Revue Medicale Suisse 2007;3(118):1691‐4. [PubMed] [Google Scholar]
Shrier 2014 {published data only}
- Shrier LA, Rhoads A, Burke P, Walls C, Blood EA. Real‐time, contextual intervention using mobile technology to reduce marijuana use among youth: a pilot study. Addictive Behaviors 2014;39(1):173‐80. [DOI] [PubMed] [Google Scholar]
Sigmon 2000 {published data only}
- Sigmon SC, Steingard S, Badger GJ, Anthony SL, Higgins ST. Contingent reinforcement of marijuana abstinence among individuals with serious mental illness: a feasibility study. Experimental and Clinical Psychopharmacology 2000;8(4):509‐17. [DOI] [PubMed] [Google Scholar]
Sigmon 2006 {published data only}
- Sigmon SC, Higgins ST. Voucher‐based contingent reinforcement of marijuana abstinence among individuals with serious mental illness. Journal of Substance Abuse Treatment 2006;30(4):291‐5. [DOI] [PubMed] [Google Scholar]
Simundson 2012 {published data only}
- Simundson MD. The effectiveness of a substance abuse treatment group for at risk college students. Dissertation Abstracts International: Section B: The Sciences and Engineering 2012;73(4b):2537. [Google Scholar]
Sinha 2003 {published data only}
- Sinha R, Easton C, Renee‐Aubin L, Carroll KM. Engaging young probation‐referred marijuana‐abusing individuals in treatment: a pilot trial. American Journal of Addiction 2003;12(4):314‐23. [PubMed] [Google Scholar]
Smeerdijk 2009 {published data only}
- Smeerdijk M, Keet R, Haan L, Schippers G, Linszen D. Family motivation intervention in early onset psychosis and cannabis abuse: a randomized clinical trial. Schizophrenia Bulletin 2009;35:371. [Google Scholar]
Smith 1988 {published data only}
- Smith JW, Schmeling G, Knowles PL. A marijuana smoking cessation clinical trial utilizing THC‐free marijuana, aversion therapy, and self‐management counselling. Journal of Substance Abuse Treatment 1988;5(2):89‐98. [DOI] [PubMed] [Google Scholar]
Stanger 2009 {published data only}
- Stanger C, Budney AJ, Kamon JL, Thostensen J. A randomized trial of contingency management for adolescent marijuana abuse and dependence. Drug and Alcohol Dependence 2009;105(3):240‐7. [DOI] [PMC free article] [PubMed] [Google Scholar]
Stanger 2012 {published data only}
- Stanger C, Ryan SR, Fu H, Landes RD, Jones BA, Bickel WK, et al. Delay discounting predicts adolescent substance abuse treatment outcome. Experimental and Clinical Psychopharmacology 2012;20(3):205‐12. [DOI] [PMC free article] [PubMed] [Google Scholar]
Steinberg 2002 {published data only}
- Steinberg KL, Roffman RA, Carroll KM, Kabela E, Kadden R, Miller M, et al. Tailoring cannabis dependence treatment for a diverse population. Addiction 2002;97(Suppl 1):135‐42. [DOI] [PubMed] [Google Scholar]
Strang 2004 {published data only}
- Strang J, McCambridge J. Can the practitioner correctly predict outcome in motivational interviewing?. Journal of Substance Abuse Treatment 2004;27(1):83‐8. [DOI] [PubMed] [Google Scholar]
Swift 2001 {published data only}
- Swift W, Copeland J, Howard J, Roffman RA, Stephens RS, Berghuis J. Adolescent cannabis check‐up and intervention trial. Drug and Alcohol Dependence 2001;63(S1):156. [Google Scholar]
Walker 2006 {published data only}
- Walker DD, Roffman RA, Stephens RS, Wakana K, Berghuis J, Kim W. Motivational enhancement therapy for adolescent marijuana users: a preliminary randomized controlled trial. Journal of Consulting and Clinical Psychology 2006;74(3):628‐32. [DOI] [PMC free article] [PubMed] [Google Scholar]
Walker 2011 {published data only}
- Walker DD, Stephens R, Roffman R, Demarce J, Lozano B, Towe S, et al. Randomized controlled trial of motivational enhancement therapy with nontreatment‐seeking adolescent cannabis users: a further test of the teen marijuana check‐up. Psychology of Addictive Behaviors 2011;25(3):474‐84. [DOI] [PMC free article] [PubMed] [Google Scholar]
Werder 2012 {published data only}
- Werder K. Addressing marijuana use as an early intervention in youth with serious mental illness. Early Intervention in Psychiatry 2012;6:97. [Google Scholar]
Wesley 2009 {published data only}
- Wesley MC, Minatrea NB, Watson JC. Animal‐assisted therapy in the treatment of substance dependence. Anthrozoos 2009;22(2):137‐48. [Google Scholar]
Weymann 2011 {published data only}
- Weymann N, Baldus C, Miranda A, More K, Reis O, Thomasius R. Trainer effects in a group training for young cannabis consumers ‐ results of the multisite trial "CAN stop". Sucht 2011;57(3):193‐202. [Google Scholar]
White 2006 {published data only}
- White HR, Morgan TJ, Pugh LA, Celinska K, Labouvie EW, Pandina RJ. Evaluating two brief substance‐use interventions for mandated college students. Journal of Studies on Alcohol 2006;67(2):309‐17. [DOI] [PubMed] [Google Scholar]
Winters 2014 {published data only}
- Winters KC, Lee S, Botzet A, Fahnhorst T, Nicholson A. One‐year outcomes and mediators of a brief intervention for drug abusing adolescents. Psychology of Addictive Behaviors 2014;28(2):464‐74. [DOI] [PMC free article] [PubMed] [Google Scholar]
Wittchen 2010 {published data only}
- Wittchen H. Targeted cognitive‐behavioral treatment for cannabis use disorders (CANDIS): efficacy, long term stability, and efficiency. European Neuropsychopharmacology 2010;20:s206. [DOI] [PubMed] [Google Scholar]
Woolard 2013 {published data only}
- Woolard R, Baird J, Longabaugh R, Nirenberg T, Lee CS, Mello MJ, et al. Project reduce: reducing alcohol and marijuana misuse: effects of a brief intervention in the emergency department. Addictive Behaviors 2013;38(3):1732‐9. [DOI] [PMC free article] [PubMed] [Google Scholar]
Additional references
Agrawal 2012
- Agrawal A, Budney AJ, Lynskey MT. The co‐occurring use and misuse of cannabis and tobacco: a review. Addiction 2012;107(7):1221‐33. [DOI] [PMC free article] [PubMed] [Google Scholar]
AIHW 2014a
- Australian Institute of Health and Welfare (AIHW). National Drug Strategy Household Survey detailed report 2013. Drug Statistics Series No. 28. Cat. No. PHE 183. Canberra: AIHW 2014.
AIHW 2015
- AIHW. Alcohol and other drug treatment services in Australia 2013‐14. Drug Treatment Series No. 25. Cat. No. HSE 158. Canberra: AIHW 2015.
Anthony, 2006
- Anthony JC. The epidemiology of cannabis dependence. Cannabis Dependence: Its Nature, Consequences and Treatment. Cambridge: Cambridge University Press, 2006:58‐105. [Google Scholar]
Badiani 2015
- Badiani A, Boden JM, Pirro S, Fergusson DM, Horwood LJ, Harold GT. Tobacco smoking and cannabis use in a longitudinal birth cohort: evidence of reciprocal causal relationships. Drug and Alcohol Dependence 2015;150:69‐76. [DOI] [PubMed] [Google Scholar]
Beck 1961
- Beck AT, Ward CH, Mendelson M, Mock J, Erbaugh J. An inventory for measuring depression. Archives of General Psychiatry 1961;4:561‐71. [DOI] [PubMed] [Google Scholar]
Beck 1993
- Beck AT, Wright FD, Newman CF, Liese BS. Cognitive Therapy of Substance Abuse. New York: Guilford Press, 1993. [PubMed] [Google Scholar]
Bender 2011
- Bender K, Tripodi S, Sarteschi C, Vaughn M. A meta‐analysis of interventions to reduce adolescent cannabis use. Research on Social Work Practice 2011;21:153‐64. [Google Scholar]
Budney 1999
- Budney AJ, Novy PL, Hughes JR. Marijuana withdrawal among adults seeking treatment for marijuana dependence. Addiction 1999;94(9):1311‐22. [DOI] [PubMed] [Google Scholar]
Budney 2007
- Budney AJ, Roffman R, Stephens RS, Walker D. Marijuana dependence and its treatment. Addiction Science and Clinical Practice 2007;4(1):4‐16. [DOI] [PMC free article] [PubMed] [Google Scholar]
Copeland 2001b
- Copeland J, Swift W, Rees V. Clinical profile of participants in a brief intervention program for cannabis use disorder. Journal of Substance Abuse Treatment 2001;20(1):45‐52. [DOI] [PubMed] [Google Scholar]
Copeland 2005
- Copeland J, Gilmour S, Gates P, Swift W. The Cannabis Problems Questionnaire: factor structure, reliability, and validity. Drug and Alcohol Dependence 2005;80(3):313‐9. [DOI] [PubMed] [Google Scholar]
Copeland 2014
- Copeland J, Clement N, Swift W. Cannabis use, harms and the management of cannabis use disorder. Neuropsychiatry 2014;4(1):55‐63. [Google Scholar]
Davis 2014
- Davis ML, Powers MB, Handelsman P, Medina JL, Zvolensky M, Smits JAJ. Behavioral therapies for treatment‐seeking cannabis users: a meta‐analysis of randomized controlled trials. Evaluation and the Health Professions 2015;38(1):94‐114. [DOI] [PMC free article] [PubMed] [Google Scholar]
DSM‐V 2013
- American Psychiatric Association. Diagnostic and Statistical Manual. 5th ed. Arlington: American Psychiatric Association, 2013.
Dutra 2008
- Dutra L, Stathopoulou G, Basden SL, Leyro TM, Powers MB, Otto MW. A meta‐analytic review of psychosocial interventions for substance use disorders. American Journal of Psychiatry 2008;165:179‐87. [DOI] [PubMed] [Google Scholar]
EMCDDA 2014a
- European Monitoring Centre for Drugs and Drug Addiction. European Drug Report 2014: Trends and Developments. European Drug Report 2014: Trends and Developments. Lisbon: EMCDDA, 2014. [Google Scholar]
EMCDDA 2014b
- European Monitoring Centre for Drugs and Drug Addiction. 2012 Annual Report on the State of the Drug Problem in Europe. Lisbon: EMCDDA, 2012. [Google Scholar]
Gates 2012
- Gates P, Copeland J, Swift W, Martin G. Barriers and facilitators to cannabis treatment. Drug and Alcohol Review 2012;31(3):311‐9. [DOI] [PubMed] [Google Scholar]
Goldstein 2015
- Goldstein RB, Chou SP, Smith SM, Jung J, Zhang H, Saha TD, et al. Nosologic comparisons of DSM‐IV and DSM‐5 alcohol and drug use disorders: results from the National Epidemiologic Survey on Alcohol and Related Conditions–III. Journal of Studies on Alcohol and Drugs 2015;76(3):378‐88. [DOI] [PMC free article] [PubMed] [Google Scholar]
Haberstick 2014
- Haberstick BC, Young SE, Zeiger JS, Lessem JM, Hewitt JK, Hopfer CJ. Prevalence and correlates of alcohol and cannabis use disorders in the United States: results from the National Longitudinal Study of Adolescent Health. Drug and Alcohol Dependence 2014;136(1):158‐61. [DOI] [PMC free article] [PubMed] [Google Scholar]
Heather 1999
- Heather N, Luce A, Peck D, Dunbar B, James I. Development of a treatment version of the Readiness to Change Questionnaire. Addiction Research and Theory 1999;7(1):63‐83. [Google Scholar]
Higgins 2011
- Higgins JPT, Green S (editors). Cochrane Handbook for Systematic Reviews of Interventions. Version 5.1.0 [updated March 2011]. The Cochrane Collaboration, 2011. www.cochrane‐handbook.org, 2011. [Google Scholar]
Hindocha 2015
- Hindocha C, Shaban NDC, Freeman TP, Das RK, Gale G, Schafer G, et al. Associations between cigarette smoking and cannabis dependence: a longitudinal study of young cannabis users in the United Kingdom. Drug and Alcohol Dependence 2015;148:165‐71. [DOI] [PMC free article] [PubMed] [Google Scholar]
Lev‐Ran 2013
- Lev‐Ran S, Strat Y, Imitiaz S, Rehm J, Foll B. Gender differences in prevalence of substance use disorders among individuals with lifetime exposure to substances: results from a large representative sample. American Journal on Addictions 2013;22(1):7‐13. [DOI] [PubMed] [Google Scholar]
Marshall 2014
- Marshall K, Gowing L, Ali R, Foll B. Pharmacotherapies for cannabis dependence. Cochrane Database of Systematic Reviews 2014, Issue 12. [DOI: 10.1002/14651858.CD008940.pub2] [DOI] [PMC free article] [PubMed] [Google Scholar]
McLellan 1980
- McLellan A, Luborsky L, Woody GE, O'Brien CP. An improved diagnostic evaluation instrument for substance abuse patients. The Addiction Severity Index. The Journal of Nervous and Mental Disease 1980;168(1):26‐33. [DOI] [PubMed] [Google Scholar]
McRae 2003
- McRae AL, Budney AJ, Brady KT. Treatment of marijuana dependence: a review of the literature. Journal of Substance Abuse Treatment 2003;24(4):369‐76. [DOI] [PubMed] [Google Scholar]
Mewton 2013
- Mewton L, Slade T, Teesson M. An evaluation of the proposed DSM‐5 cannabis use disorder criteria using Australian national survey data. Journal of Studies on Alcohol and Drugs 2013;74:614‐21. [DOI] [PubMed] [Google Scholar]
Miller 1992
- Miller WR, Zweben A, DiClement CC, Rychtarik RG. Motivational Enhancement Therapy Manual. NIAAA Project MATCH Monograph Series. Publication No. (ADM) 92‐1894. Rockville, MD: National Institute on Alcohol Abuse and Alcoholism, 1992. [Google Scholar]
Miller 2002
- Miller WR, Rollnick S. Motivational Interviewing: Preparing People to Change Addictive Behavior. New York: Guilford Press, 2002. [Google Scholar]
Moher 1995
- Moher D, Olkin I. Meta‐analysis of randomised controlled trials. A concern for standards. JAMA 1995;274(24):1962‐4. [PubMed] [Google Scholar]
Nordstrom 2010
- Nordstrom BR, Levin FR. Treatment of cannabis use disorders: a review of the literature. The American Journal on Addictions 2010;16(5):331‐42. [DOI] [PubMed] [Google Scholar]
Praissman 2008
- Praissman S. Mindfulness‐based stress reduction: a literature review and clinician's guide. Journal of the American Academy of Nurse Practitioners 2008;20:212‐6. [DOI] [PubMed] [Google Scholar]
Roffman 1987
- Roffman RA, Barnhart R. Assessing need for marijuana dependence treatment through an anonymous telephone interview. The International Journal of the Addictions 1987;22(7):639‐51. [DOI] [PubMed] [Google Scholar]
SAMHSA 2002
- Substance Abuse and Mental Health Services Administration. Marijuana treatment admission increase: 1993‐1999. The Dasis Report. Rockville, MD: Office of Applied Statistics, 2002. [Google Scholar]
SAMHSA 2003
- Substance Abuse and Mental Health Services Administration. Adult marijuana admissions by race and ethnicity: 2000. The Dasis Report. Rockville, MD: Office of Applied Statistics, 2003. [Google Scholar]
SAMHSA 2013
- Substance Abuse and Mental Health Services Administration. The TEDS Report: Marijuana Admissions Aged 18 to 30: Early vs. Adult Initiation. Rockville, MD: SAMHSA, 2013. [PubMed] [Google Scholar]
SAMHSA 2014
- Substance Abuse and Mental Health Services Administration. Results from the 2013 National Survey on Drug Use and Health: Summary of National Findings. NSDUH Series H‐48, HHS Publication No. (SMA) 14‐4863. Rockville, MD: SAMHSA, 2014. [Google Scholar]
Stephens 1993a
- Stephens RS, Roffman RA, Simpson EE. Adult marijuana users seeking treatment. Journal of Consulting and Clinical Psychology 1993;61(6):1100‐4. [DOI] [PubMed] [Google Scholar]
Swift 1998
- Swift W, Copeland J, Hall W. Choosing a diagnostic cut‐off for cannabis dependence. Addiction 1998;93(11):1681‐92. [DOI] [PubMed] [Google Scholar]
Teesson 2012
- Teesson M, Slade T, Swift W, Mills K, Memedovic S, Mewton L, et al. Prevalence, correlates and comorbidity of DSM‐IV cannabis use and cannabis use disorders in Australia. Australian and New Zealand Journal of Psychiatry 2012;46(12):1182‐92. [DOI] [PubMed] [Google Scholar]
Tobler 1999
- Tobler NS, Lessard T, Marshall D, Ochshorn P, Roona M. Effectiveness of school‐based drug prevention programs for marijuana use. School Psychology International 1999;20(1):105‐37. [Google Scholar]
van der Pol, 2013
- Pol P, Liebregts N, Graaf R, Korf DJ, Brink W, Laar M. Predicting the transition from frequent cannabis use to cannabis dependence: a three‐year prospective study. Drug and Alcohol Dependence 2013;133:352‐9. [DOI] [PubMed] [Google Scholar]
WHO 1992
- World Health Organization. The ICD‐10 Classification of Mental and Behavioural Disorders: Clinical Descriptions and Diagnostic Guidelines. Geneva, Switzerland: WHO, 1992. [Google Scholar]
Winstock 2010
- Winstock AR, Ford C, Witton J. Assessment and management of cannabis use disorders in primary care. British Medical Journal 2010;340:c1571. [DOI] [PubMed] [Google Scholar]
References to other published versions of this review
Denis 2006
- Denis C, Lavie E, Fatseas M, Auriacombe M. Psychotherapeutic interventions for cannabis abuse and/or dependence in outpatient settings. Cochrane Database of Systematic Reviews 2006, Issue 3, CD005336. [DOI: 10.1002/14651858.CD005336.pub2] [DOI] [PubMed] [Google Scholar]