

Abstract
The objective of this study was to evaluate the modulatory effects of Lactobacillus reuteri ZJ617 and ZJ615, which have high and low adhesive abilities, respectively, and Lactobacillus rhamnosus GG (LGG) on immune responses and metabolism in mice stimulated with lipopolysaccharide (LPS). Six C57BL/6 mice per group were orally inoculated with ZJ617, ZJ615 or LGG for one week (1 × 10⁸ CFU/mouse) and i.p. injected with LPS (10 mg/kg) for 24 h. Compared with the LPS stimulation group, ZJ615, ZJ617 and LGG significantly decreased TNF-α levels in the sera of mice stimulated by LPS. ZJ615 and LGG significantly down-regulated mRNA levels of cytokines and Toll-like receptors, and suppressed activation of MAPK and NF-κB signaling, while ZJ617 up-regulated anti-inflammatory cytokine IL-10 mRNA levels in the ilea of mice stimulated by LPS. Correlation analysis confirmed that adhesive ability is relative with the immunomodulation in the ilea of mice. There were 24, 7 and 10 metabolites and 10, 9 and 8 major metabolic pathways with significant differences (VIP > 1, P < 0.05) between the LPS and ZJ617 + LPS groups, the LPS and ZJ615 + LPS groups, and the ZJ617 + LPS and ZJ615 + LPS groups, respectively. The results indicated that both ZJ617 and ZJ615 could modulate the intestinal immune responses and metabolism in LPS-stimulated mice.
Lactobacilli are probiotics in the gastrointestinal tract that help maintain gut homeostasis1. Several reports have shown that the probiotic Lactobacillus coryniformis could reduce pro-inflammatory status in mice2. Lactobacillus rhamnosus OLL2838 had modulatory effects on a mouse model of intestinal immunopathology3. Probiotic Lactobacillus reuteri ameliorated elevated inflammatory responses in the colon of infected mice and inhibited dysbiosis4.
Intestinal Lactobacillus reuteri are beneficial microbes that play an important probiotic role in maintaining gut health5. A previous study demonstrated that Lactobacillus reuteri promotes anti-inflammatory activities in mice with typhlocolitis6. Lactobacillus reuteri ATCC PTA 6475 decreased TNF-α mRNA level to attenuate intestinal inflammation in mice7.
Adhesive ability is important for bacterial function in the intestines of the host. Two high adhesive strains of Lactobacillus had anti-inflammatory effects on Salmonella-infected intestinal epithelial cells (IEC)8. Lactobacillus rhamnosus GG (LGG) is a probiotic that has well-documented adhesive properties and beneficial effects on IECs stimulated with endotoxin, via modulating cytokine mRNA expressions9,10. In our previous study, two Lactobacillus reuteri strains were isolated from piglets and identified as ZJ617, with high adhesive ability, and ZJ615 with low adhesive ability, with adhesion indexes of 12.35 ± 0.09 and 1.21 ± 0.14 CFU/cell, respectively, determined by the adherence assays of lactobacillus to an in vitro cultured Caco-2 cell monolayer. That is to say, ZJ617 adhesion to Caco-2 cells was an order of magnitude higher than ZJ61511. Therefore, the immunomodulatory effects of strains with different adhesive abilities were examined in this study.
Metabolomics can be used in gastrointestinal (GI) tract research to better understand the changes in metabolites in intestinal diseases, such as inflammatory bowel disease, and predict and identify novel biomarkers for the treatment of intestinal diseases12. Among the technologies used in metabolomics, gas chromatography/time-of-flight mass spectrometry (GC-TOF-MS) has been widely applied because of its high sensitivity13. Previous studies mainly focused on the effects of diet on metabolic activity in animals13,14, and the effect of colonic microbiota on gut health and immunity15,16. The overall metabolic phenotypes (metabotypes) reflect myriad functions encoded in host genomes and gut microbiomes. The particular intestinal microbial configurations can promote or prevent inflammatory immune responses that drive metabolic dysfunction17. The gut microbiota is pivotal for homeostasis in the intestine, and chronic activation of the innate and adaptive immune system is linked to immunosenescence. Correlations have previously been found between specific components of the microbiota and pro-inflammatory cytokine levels18. However, metabolomic studies on host intestines modulation by lactobacilli are limited.
The aims of this study were to investigate the probiotic effects of ZJ617 and ZJ615, which have different adhesive abilities, in an inflammatory mouse model in vivo, with LGG as a reference strain, to elucidate the mechanisms of lactobacilli as probiotics in the mammalian intestine. We also aimed to elucidate the metabolic mechanisms via investigating the metabolic profiles in the intestinal contents of Lactobacilli-treated mice.
Results
TNF-α levels and biochemical measurements in the sera of LAB pre-treated mice after LPS challenge
To evaluate the probiotic effect of ZJ617 and ZJ615 on mice after LPS stimulation, the level of TNF-α and biochemical measurements (SOD and MDA) in serum were assessed. Compared with the LPS groups, LGG, ZJ617 and ZJ615 could significantly decreased TNF-α levels in the sera of mice stimulated by LPS (Fig. 1). Additionally, LGG, ZJ617 and ZJ615 restored SOD levels (Fig. 2a) and significantly decreased MDA levels in sera of mice stimulated by LPS (P < 0.05, Fig. 2b).
Figure 1. The production of TNF-α in mouse sera.
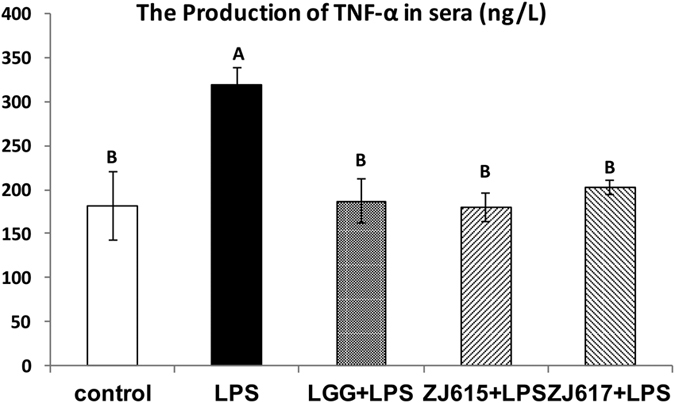
Mice were orally inoculated with lactobacilli for one week and then i.p. injected with LPS for 24 h. Sera were collected from all mice immediately after euthanasia and TNF-α levels in the sera were detected by ELISA. The values are expressed as the mean ± SD (n = 6). The means for TNF-α without a common letter differ significantly (P < 0.05).
Figure 2. Biochemical measurements of SOD and MDA in mouse sera.

Mice were orally inoculated with lactobacilli for one week and then i.p. injected with LPS for 24 h. Sera were collected from all mice immediately after euthanasia. SOD (a) and MDA (b) in sera were detected by ELISA. The values are expressed as the mean ± SD (n = 6). The means for each biochemical index without a common letter differ significantly (P < 0.05).
The relative expression of cytokines and TLRs in the ilea of LAB pre-treated mice after LPS challenge
To investigate the probiotic effect of ZJ617 and ZJ615 on the ileum of mice stimulated by LPS, the relative mRNA level of cytokines (IL-6, IL-10, IL-12 and TNF-α) and TLRs (TLR2, TLR4 and TLR9) in ilea were measured. Compared with the LPS groups, LGG and ZJ615 significantly decreased, while ZJ617 significantly increased, IL-10, IL-12 and TNF-α mRNA in the ilea of mice stimulated by LPS (Fig. 3a). TLR2, TLR4 and TLR9 mRNA levels were significantly decreased by LGG and ZJ615 and were significantly increased by ZJ617 in the ilea of mice stimulated by LPS compared with LPS group (Fig. 3b, P < 0.05).
Figure 3.

The relative expression of cytokines (a) and TLRs (b) in the ilea of mice pre-treated with LAB and challenged with LPS. Mice were orally inoculated with lactobacilli for one week and then stimulated with LPS via i.p injection. Ileal tissues from six mice in each group were collected after euthanasia and examined by qRT-PCR. The values are expressed as the mean ± SD (n = 6). The means for each cytokine or TLR without a common letter differ significantly (P < 0.05).
The expression of cell signaling molecules in the ilea of LAB pre-treated mice stimulated by LPS
To explore the mechanism of immunomodulation of ZJ617 and ZJ615 on the ilea of mice stimulated by LPS, the activation of cell signaling pathways (p38MAPK, ERK1/2 and NF-κB) in the ilea was assessed. LGG and ZJ615 significantly decreased phosphorylation of ERK1/2 in the ilea of mice stimulated by LPS, while ZJ617 had no significant effects on ERK1/2 signaling compared with the LPS groups (Fig. 4a). LGG, ZJ617 and ZJ615 significantly decreased phosphorylation levels of p38 MAPK in the ilea of mice stimulated by LPS (Fig. 4b). LGG and ZJ615 restored I-κBα to normal levels, while ZJ617 had no significant effects on I-κBα (P > 0.05, Fig. 4c).
Figure 4. The expression of cell signaling molecules in the ilea of mice pre-treated with LAB and challenged with LPS.

Mice were orally inoculated with lactobacilli for one week and then stimulated with LPS via i.p injection. Ileal tissues from six mice in each group were collected after euthanasia and examined by western blot. Phosphorylation of ERK1/2 and p38 MAPK and expression of I-κBα were detected and represented as a ratio of p-ERK/ERK (a), p-p38 MAPK/p38 MAPK (b) and I-κBα/GAPDH (c). The gray scale values are expressed as the mean ± SD (n = 6). The means for each signaling factor without a common letter differ significantly (P < 0.05).
The expression of cell signaling molecules in the ilea of LAB pre-treated mice stimulated by LPS verified by IHC
To confirm the immunomodulatory effects of ZJ617 and ZJ615, the level of cell signaling molecules (phospho-p38, p38, phospho-ERK1/2, ERK1/2 and I-κBα) in the ilea was verified by IHC. All IHC samples were analyzed using Image Pro-Plus (Cambridge, UK). Consistent with the results of western-blot analysis, LGG and ZJ615 significantly decreased the phosphorylation levels of ERK1/2 in the ilea of mice stimulated by LPS, while ZJ617 had no significant effects on ERK1/2 signaling compared with the LPS only group (Fig. 5a). Additionally, LGG, ZJ617 and ZJ615 significantly decreased phosphorylation of p38 MAPK (Fig. 5b). While LGG and ZJ615 increased I-κBα levels to normal in the ilea (P < 0.05), ZJ617 had no significant effects on NF-κB signaling (P > 0.05, Fig. 5c).
Figure 5. The expression of cell signaling molecules in the ilea of mice pre-treated with LAB and challenged with LPS.

Mice were orally inoculated with lactobacilli for one week and then stimulated with LPS via i.p injection. Ileal tissues from six mice in each group were collected after euthanasia and examined by IHC. Phosphorylation of ERK1/2 and p38 MAPK and expression of I-κBα were detected and represented as p-p38 (a), p38 (b), p-ERK (c), ERK (d) and I-κBα (e). The ratio of positive-stained cells/all cells is expressed as the mean ± SD (n = 6). The means for each signaling factor without a common letter differ significantly (P < 0.05).
Correlation of bacterial adhesion and immunomodulation among lactobacillus strains
The adhesive ability of three lactobacillus strains to the ileum mucosa was determined with mice (Fig. S1B). The number of ZJ617 adhering to the ileal mucosa was significantly higher than others. To study the correlation between the adhesive ability and immunomodulation of these lactobacillus strains, we performed Spearman’s correlation analysis (Fig. 6). Bacterial adhesion was positively correlated with pro-inflammatory cytokine TNF-α, and inflammatory related signalling p38MAPK and ERK1/2, while negatively correlated with NF-κB negative regulator I-κBα. In addition, bacterial adhesion was positively correlate with TLR2. There findings indicated that adhesive ability was responsible for the ileal immune responses toward LPS stimulation.
Figure 6. Spearman’s correlation analysis of bacterial adhesion and immune responses related factors.

The red represents a significant positive correlation (P < 0.05), the blue represents a significant negative correlation (P < 0.05), and the white shows that the correlation was not significant (P > 0.05).
Metabolite profiling of the intestinal contents of mice
Small molecular weight metabolites were extracted from the intestinal contents of ZJ617- or ZJ615-treated mice stimulated by LPS, or the corresponding mice stimulated with LPS alone. Based on the LECO/Fiehn Metabolomics Library, a total of 883 metabolite peaks were determined (Fig. S3). The PCA analysis of the GC-TOF-MS metabolic profiles of the three groups showed clusters with no significant differences among the LPS, ZJ617 + LPS and ZJ615 + LPS groups in a 3D-PCA score plot (Fig. S4). To obtain a higher level of group separation and a better understanding of the variables responsible for classification, partial least squares discriminant analysis (PLS-DA) and orthogonal projections to latent structures discriminant analysis (OPLS-DA) were applied (Fig. 7). Clear separation and discrimination were found among the LPS, ZJ617 + LPS and ZJ615 + LPS groups, suggesting that the OPLS-DA model can be used to identify the differences among three groups (Fig. 7d–f). All significantly different metabolites (VIP > 1, P < 0.05) were identified, followed by a statistical comparison of the peak values among the LPS-stimulated group, the ZJ617 + LPS group and the ZJ615 + LPS group. In the intestinal contents of the LPS-stimulated mice, the levels of 24 metabolites were significantly changed compared to those of the mice in the ZJ617 + LPS group (Table 1). In the intestinal contents of the LPS-stimulated mice the levels of 8 metabolites were significantly changed compared to those of mice in the ZJ615 + LPS group (Table 2). In the intestinal contents of the mice in the ZJ617 + LPS group, the levels of 10 metabolites were significantly changed compared to those of mice in the ZJ615 + LPS group (Table 3).
Figure 7.

PLS-DA (a–c) and OPLS-DA (d–f) score map derived from the GC/MS metabolite profiles of intestinal contents. Black represents contents from the LPS group, yellow represents contents from the ZJ617 + LPS group, and green represents contents from the ZJ615 + LPS group (n = 6).
Table 1. List of significantly changed metabolites in the LPS group and the ZJ617 + LPS group.
| Metabolite Name | Similarity | R.T.a | Mass | VIPb | P valuec | FCd |
|---|---|---|---|---|---|---|
| Glucose | 947 | 17.6 | 160 | 2.07537 | 0.01882 | 0.000000005 |
| Phosphate | 857 | 10.2295 | 299 | 1.6685 | 0.04329 | 0.622410586 |
| Dihydroxyacetone | 789 | 10.0093 | 73 | 1.74531 | 0.049958 | 10.905710000 |
| Linoleic acid methyl ester | 701 | 19.5305 | 136 | 1.85993 | 0.039649 | 0.000000007 |
| Mannitol | 686 | 18.0156 | 217 | 2.05745 | 0.020158 | 0.000000212 |
| Cellobiotol | 640 | 25.0222 | 204 | 1.79564 | 0.047739 | 0.024980229 |
| N-alpha-Acetyl-L-ornithine | 626 | 18.5482 | 174 | 1.68145 | 0.041292 | 5.255360417 |
| L-Allothreonine | 566 | 10.5319 | 146 | 2.13237 | 0.014876 | 0.011969541 |
| Adenosine | 538 | 24.0068 | 236 | 1.80949 | 0.03999 | 4.385818670 |
| 3-Hydroxypalmitic acid | 483 | 20.5048 | 97 | 2.58686 | 2.97E-05 | 0.199293761 |
| Malonic acid | 344 | 12.2685 | 327 | 1.78901 | 0.02715 | 0.566624153 |
| DL-Anabasine | 330 | 11.9323 | 242 | 1.96328 | 0.012173 | 0.158024143 |
| N-Acetyl-D-galactosamine | 327 | 19.2005 | 221 | 2.11035 | 0.005269 | 0.112974527 |
| 2-Methylglutaric Acid | 318 | 12.1692 | 86 | 1.83937 | 0.021907 | 0.409576937 |
| Gluconic acid | 293 | 18.6894 | 293 | 2.47033 | 0.000201 | 0.086936749 |
| Atrazine-2-hydroxy | 291 | 17.2002 | 140 | 1.6619 | 0.044334 | 0.307408421 |
| 5-Dihydrocortisone | 279 | 28.5782 | 221 | 1.77299 | 0.044077 | 0.103250509 |
| 3-Methylamino-1,2-propanediol | 273 | 11.6638 | 84 | 1.68952 | 0.04008 | 0.244076542 |
| Acetol | 269 | 13.2167 | 57 | 1.89974 | 0.016642 | 7.203885285 |
| Maleic acid | 246 | 10.6076 | 341 | 1.86114 | 0.019886 | 0.478113079 |
| 2-hydroxypyridine | 232 | 6.83189 | 136 | 1.83894 | 0.021948 | 0.468394215 |
| D-Arabitol | 194 | 15.7746 | 36 | 1.97175 | 0.027488 | 0.000000013 |
| 5,6-dihydrouracil | 147 | 13.204 | 265 | 2.13435 | 0.004513 | 0.115115987 |
| Isomaltose | 134 | 25.6871 | 533 | 2.30141 | 0.006788 | 0.000001592 |
aR.T. represented retention time.
bVIP = variable importance projection, metabolite (VIP > 1) was listed in table.
cP values were calculated according to Student’s T-test.
dFC represented as the fold change of the peak intensity for the LPS group against the ZJ617 + LPS group (n = 6).
Table 2. List of significantly changed metabolites in the LPS group and the ZJ615 + LPS group.
| Metabolite Name | Similarity | R.T.a | Mass | VIPb | P valuec | FCd |
|---|---|---|---|---|---|---|
| Valine | 929 | 9.44723 | 144 | 1.57663 | 0.037152 | 0.290305 |
| Arachidonic acid | 854 | 21.9473 | 91 | 1.98539 | 0.043569 | 0.24063 |
| Phenylalanine | 774 | 13.9178 | 120 | 1.24562 | 0.048931 | 0.276223 |
| 2,3-Dihydroxypyridine | 750 | 10.8217 | 240 | 1.55255 | 0.048411 | 0.377064 |
| Digitoxose | 391 | 14.5243 | 73 | 1.72961 | 0.022967 | 7.440897 |
| 2-Methylglutaric Acid | 318 | 12.1692 | 86 | 1.6088 | 0.020425 | 0.293636 |
| Thymidine | 118 | 10.2904 | 341 | 1.56786 | 0.023045 | 0.393048 |
aR.T. represented retention time.
bVIP = variable importance projection, metabolite (VIP > 1) was listed in table.
cP values were calculated according to Student’s T-test.
dFC represented as the fold change of the peak intensity for the ZJ617 + LPS group against the ZJ615 + LPS group (n = 6).
Table 3. List of significantly changed metabolites in the ZJ617 + LPS group and the ZJ615 + LPS group.
| Metabolite Name | Similarity | R.T.a | Mass | VIPb | P valuec | FCd |
|---|---|---|---|---|---|---|
| Glucose | 947 | 17.6 | 160 | 2.24825 | 0.029406 | 6.01968 |
| Xylitol | 653 | 15.6597 | 217 | 2.05975 | 0.019828 | 7.77052 |
| Galactose | 577 | 17.7864 | 110 | 1.132 | 0.003196 | 0.39415 |
| Sarcosine | 529 | 8.38449 | 116 | 1.78932 | 0.024567 | 36.60145 |
| DL-Anabasine | 330 | 11.9323 | 242 | 2.07843 | 0.013412 | 6.10723 |
| Gluconic acid | 293 | 18.6894 | 293 | 2.23567 | 0.000876 | 5.61108 |
| 2-ketobutyric acid | 233 | 7.81917 | 157 | 1.58586 | 0.022761 | 3.83510 |
| Cortisone | 165 | 25.5915 | 69 | 1.72329 | 0.049621 | 0.55608 |
| 5,6-dihydrouracil | 147 | 13.204 | 265 | 2.56683 | 0.005456 | 442163.48470 |
| Isomaltose | 134 | 25.6871 | 533 | 2.0911 | 0.00799 | 7.45914 |
aR.T. represented retention time.
bVIP = variable importance projection, metabolite (VIP > 1) was listed in table.
cP values were calculated according to Student’s T-test.
dFC represented as the fold change of the peak intensity for the ZJ617 + LPS group against the ZJ615 + LPS group (n = 6).
Changes in the levels of metabolites and metabolic pathways in mice
The fold change (FC) value was used to assess the quantity among the LPS, ZJ617 + LPS and ZJ615 + LPS groups. Compared with the LPS group, the ZJ617 + LPS group had 20 metabolites with higher concentrations out of 24 significantly different metabolites in the intestinal contents (Table 1). The higher concentration metabolites in the ZJ617 + LPS group included 4 carbohydrate metabolites, glucose (FC = 5 × 10⁻⁹), D-gluconic acid (FC = 0.0869), D-arabitol (FC = 1.3 × 10⁻⁸) and isomaltose (FC = 1.592 × 10⁻⁶), 4 lipid metabolites, mannitol (FC = 2.12 × 10⁻⁷), 2-methylglutaric acid (FC = 0.410), 5-dihydrocortisone (FC = 0.103), maleic acid (FC = 0.478), and others. Compared with the LPS group, the ZJ615 + LPS group had 6 metabolites with higher concentrations out of 7 significantly different metabolites in the intestinal contents (Table 2). The higher concentration metabolites in the ZJ615 + LPS group included 2 amino acid metabolites, valine (FC = 0.290) and phenylalanine (FC = 0.276), 2 lipid metabolites, arachidonic acid (FC = 0.241) and 2-methylglutaric acid (FC = 0.294), and other organic compounds. Compared with the ZJ615 + LPS group, the ZJ617 + LPS group had 8 metabolites with higher concentrations out of 10 significantly different metabolites in the intestinal contents (Table 3), which included 4 carbohydrate metabolites, such as glucose (FC = 6.020), xylitol (FC = 7.771), D-gluconic acid (FC = 5.611) and isomaltose (FC = 7.459), and other organic compounds. The KEGG pathway analysis of significantly different metabolites among the three groups identified 10 metabolic pathways, such as biosynthesis of antibiotics and galactose metabolism, which were the major differentially expressed metabolic pathways between the LPS and ZJ617 + LPS groups (Table 4). Similarly, 9 metabolic pathways, including protein digestion and absorption and biosynthesis of amino acids, were the key different metabolic pathways between the LPS and ZJ615 + LPS groups (Table 5). Eight main metabolic pathways, including carbohydrate digestion and absorption and galactose metabolism, were identified as different between the ZJ617 + LPS and ZJ615 + LPS groups (Table 6).
Table 4. Metabolic pathways identified from significantly changed metabolites in the LPS group and the ZJ617 + LPS group.
|
Metabolic pathways |
||||||||||
|---|---|---|---|---|---|---|---|---|---|---|
| Biosynthesis of antibiotics | ABC transporters | Mineral absorption | Carbon metabolism | beta-Alanine metabolism | Galactose metabolism | Pentose phosphate pathway | Starch and sucrose metabolism | Parkinson’s disease | Pyrimidine metabolism | |
| LPS-ZJ617 + LPS | D-Glucose (FCa = 5 × 10⁻⁹) | Phosphate (FC = 0.622) | Phosphate (FC = 0.622) | Dihydroxyacetone (FC = 10.906) | Maleic acid (FC = 0.478) | D-Glucose (FC = 5 × 10⁻⁹) | D-Glucose (FC = 5 × 10⁻⁹) | D-Glucose (FC = 5 × 10⁻⁹) | Phosphate (FC = 0.622) | Maleic acid (FC = 0.478) |
| D-Gluconic acid (FC = 0.087) | D-Glucose (FC = 5 × 10⁻⁹) | D-Glucose (FC = 5 × 10⁻⁹) | D-Gluconic acid (FC = 0.087) | 5,6-Dihydrouracil (FC = 0.115) | N-Acetyl-D-galactosamine (FC = 0.113) | D-Gluconic acid (FC = 0.087) | Isomaltose (FC = 1.59 × 10⁻⁶) | Adenosine (FC = 4.386) | 5,6-Dihydrouracil (FC = 0.115) | |
| N-Acetylornithine (FC = 5.255) | Mannitol (FC = 2.12 × 10⁻⁷) | |||||||||
aFC represented as the fold change of the peak intensity for the LPS group against the ZJ617 + LPS group (n = 6).
Table 5. Metabolic pathways identified from significantly changed metabolites in the LPS group and the ZJ615 + LPS group.
|
Metabolic pathways |
|||||||||
|---|---|---|---|---|---|---|---|---|---|
| Biosynthesis of antibiotics | ABC transporters | Mineral absorption | Central carbon metabolism in cancer | Biosynthesis of amino acids | 2-Oxocarboxylic acid metabolism | Cyanoamino acid metabolism | Aminoacyl-tRNA biosynthesis | Protein digestion and absorption | |
| LPS-ZJ615+LPS | L-Phenylalanine (FCa = 0.276) | L-Phenylalanine (FC = 0.276) | L-Phenylalanine (FC = 0.276) | L-Phenylalanine (FC = 0.276) | L-Phenylalanine (FC = 0.276) | L-Phenylalanine (FC = 0.276) | L-Phenylalanine (FC = 0.276) | L-Phenylalanine (FC = 0.276) | L-Phenylalanine (FC = 0.276) |
| L-Valine (FC = 0.290) | L-Valine (FC = 0.290) | L-Valine (FC = 0.290) | L-Valine (FC = 0.290) | L-Valine (FC = 0.290) | L-Valine (FC = 0.290) | L-Valine (FC = 0.290) | L-Valine (FC = 0.290) | L-Valine (FC = 0.290) | |
aFC represented as the fold change of the peak intensity for the LPS group against the ZJ615 + LPS group (n = 6).
Table 6. Metabolic pathways identified from significantly changed metabolites in the ZJ617 + LPS group and the ZJ615 + LPS group.
|
Metabolic pathways |
||||||||
|---|---|---|---|---|---|---|---|---|
| Biosynthesis of antibiotics | ABC transporters | Mineral absorption | Carbohydrate digestion and absorption | Glycine, serine and threonine metabolism | Galactose metabolism | Pentose phosphate pathway | Starch and sucrose metabolism | |
| ZJ617+LPS-ZJ615 + LPS | D-Glucose (FCa = 6.020) | D-Glucose (FC = 6.020) | D-Glucose (FC = 6.020) | D-Glucose (FC = 6.020) | 2-Ketobutyric acid (FC = 3.835) | D-Glucose (FC = 6.020) | D-Glucose (FC = 6.020) | D-Glucose (FC = 6.020) |
| 2-Ketobutyric acid (FC = 3.835) | Xylitol (FC = 7.771) | D-Galactose (FC = 0.394) | D-Galactose (FC = 0.394) | Sarcosine (FC = 36.601) | D-Galactose (FC = 0.394) | D-Gluconic acid (FC = 5.611) | Isomaltose (FC = 7.459) | |
| D-Gluconic acid (FC = 5.611) | ||||||||
aFC represented as the fold change of the peak intensity for the ZJ617 + LPS group against the ZJ615 + LPS group (n = 6).
Discussion
We established an inflammatory C57BL/6 mouse model in vivo with LGG, a known probiotic, as a reference strain to investigate the probiotic effects of ZJ617, with high adhesive ability, and ZJ615, with low adhesive ability, which were previously isolated from piglets11.
Lactobacillus plantarum CECT 7315/7316 could attenuate inflammation in LPS-induced mice19. Lactobacillus reuteri CRL1101 down-regulated the level of cytokines (IL-1β, IL-6 and TNF-α) in the sera of mice stimulated by LPS20. Consistent with these reports, in this study, both ZJ617 and ZJ615 significantly down-regulated TNF-α in the sera of mice stimulated by LPS, indicating that ZJ617 and ZJ615 had protective effects on mice challenged with an endotoxin.
We found that pretreatment with ZJ617, ZJ615 or LGG significantly increased anti-oxidant SOD activity and decreased MDA levels in the serum of LPS-challenged mice (Fig. 2). Consistent with these results, pretreatment with Lactobacillus casei Zhang also up-regulated SOD activity and down-regulated MDA levels in serum of mice stimulated by LPS21. Lactobacillus plantarum NDC 75017 showed protective effects against LPS stimulation, which restored the level of SOD and MDA to normal22. Our findings indicate that ZJ617 and ZJ615 had anti-inflammatory and anti-oxidative effects on mice challenged by LPS.
A previous report23 showed that oral administration of Lactobacillus casei CRL431 could decrease mRNA levels of TLR2, TLR4 and TLR9 in the intestine of mice challenged with Salmonella and also significantly decreased the mRNA levels of inflammatory cytokines (TNF-α and IFN-γ) and anti-inflammatory cytokine IL-10. Consistent with the above report, oral administration of ZJ615 or LGG significantly decreased mRNA levels of TLRs (TLR2, TLR4 and TLR9), inflammatory cytokines (IL-6, IL-12 and TNF-α) and anti-inflammatory cytokine IL-10 in the ilea of mice after LPS challenge compared with the no lactobacillus LPS group (Fig. 3). These findings suggest that ZJ615 and LGG may exert a probiotic effect on the intestine of mice via down-regulating mRNA levels of TLRs (TLR2, TLR4 and TLR9) and cytokines to attenuate intestinal inflammation.
The effects of high-adhesive ZJ617 on the ilea were different from the effects of ZJ615 and LGG. Oral administration of ZJ617 increased mRNA levels of TLRs and triggered higher anti-inflammatory cytokine IL-10 mRNA expression in the ileum of mice compared with the LPS only group. The results suggest that ZJ617 could interact with intestine directly and more efficiently. Consistent with our findings, several studies reported that Lactobacillus reuteri protected the intestine from external stimuli by maintaining a certain amount in the intestinal tract, thus triggering intestinal cytokines and chemokines to maintain homeostasis24. Lactobacillus reuteri significantly increased anti-inflammatory IL-10 production in mice with typhlocolitis6.
NF-κB signaling and MAPK signaling are important pathways involved in the modulation of host inflammation triggered by stimuli25,26. Lactobacillus brevis G-101 could attenuate intestinal inflammation by inhibiting NF-κB and MAPK activation27. Consistent with the above reports, ZJ615 and LGG could suppressed phosphorylation of p38 MAPK, ERK1/2 and activation of NF-κB signaling induced by LPS, indicating that ZJ615 and LGG could exert a probiotic effect on the ilea via regulating the NF-κB and MAPK pathways. Interestingly, ZJ617 also suppressed MAPK activation but had no effect on NF-κB activation. These results deserve further study.
In the present study, correlation analysis revealed that the adhesive ability of three lactobacillus strains was responsible for the ileal immune responses toward LPS stimulation in mice. Previous study reported that TLR2 as an inflammatory mediator in GI tract could activate MAPK and NF-κB signaling to respond to environmental stimuli23. Here, we hypothesized that, compared with high adhesive ability strain ZJ617, low adhesive ability strain ZJ615 and LGG might suppressed TLR2 expression on the ileal mucosa to attenuate inflammation induced by LPS injection, which was verified in the present study and was consistent with the results in our previous in vitro study9.
Metabolomic analyses, in which thousands of small molecular weight metabolites can be analyzed in different types of samples, offer a promising approach to evaluate functional status in the interaction between microbiota and the host intestines16. GC-TOF-MS is a widely used approach in metabolomics for its high resolution and sensitivity13,28. Metabolomic studies evaluating the effects of Lactobacilli on the intestines of the host are limited. To our knowledge, this is the first study to use a metabolomic approach to investigate the functional mechanisms of the interaction between Lactobacilli and the metabolism of the host. The aim was to identify metabolites that were significantly altered in the intestinal contents, thus providing a better understanding of the metabolic pathways involved in this interaction.
In this metabolomic study of intestinal contents, the OPLS-DA model could be used to identify all significantly different metabolites (VIP > 1, P < 0.05) among the three groups (Fig. 7d–f). By peak value comparison among the LPS, ZJ617 + LPS and ZJ615 + LPS groups, we found 24, 7 and 10 metabolites were significantly changed between the LPS and ZJ617 + LPS group, the LPS and ZJ615 + LPS group, or the ZJ617 + LPS and ZJ615 + LPS group, respectively. A previous study showed that higher counts of intestinal Lactobacillus species are associated with higher glucose content, and specific fermentative groups and species of lactobacilli appear at different glucose levels29. In this study, glucose (FC = 5 × 10⁻⁹), D-gluconic acid (FC = 0.0869) and N-acetyl-D-galactosamine (FC = 0.113) were significantly higher in the ZJ617 + LPS group than the LPS group (Table 1). Glucose (FC = 6.020) and gluconic acid (FC = 5.611) were significantly higher in the ZJ617 + LPS group than the ZJ615 + LPS group (Table 2). Glucose and its derivatives showed no significant differences between the ZJ615 + LPS group and the LPS group. Galactose (FC = 0.394) was significantly higher in the ZJ615 + LPS group cpmpared to the ZJ617 + LPS group (Table 3). These findings suggest that ZJ617 increases glucose contents in the intestinal lumen, while ZJ615 enhances galactose contents in the intestinal. Fermentation of lactose by lactobacilli in the intestinal lumen was accompanied by the release of free galactose30.
Interestingly, our findings showed that the essential amino acids L-phenylalanine (FC = 0.276) and L-valine (FC = 0.290) were altered in the ZJ615 + LPS group compared to the LPS group (Table 2), which indicates that ZJ615 could regulate amino acid utilization in the intestines of the host. Consistent with our findings, previous research demonstrated that Lactobacillus GG is associated with a reduction in endotoxemia and dysbiosis, indicating that changes in metabolite are related to amino acid metabolism in the host10. The metabolic pathway analysis based on the KEGG database showed that metabolic pathways such as biosynthesis of antibiotics and mineral absorption were involved in the LPS, ZJ617 + LPS and ZJ615 + LPS groups (Table 4, 5, 6, , ). For biosynthesis of antibiotics, Lactobacillus reuteri DSM 17938 was reported to have potential antimicrobial effects against the major gastric and enteric bacterial pathogens and rotavirus by modulating metabolic pathways31. A previous study showed that Lactobacillus helveticus could affect intestinal mineral absorption32, which is consistent with our findings. Combined with the metabolic pathway analysis, we found that glucose and its derivatives may be potential biomarkers, which require further research.
In conclusion, two Lactobacillus reuteri strains with different adhesive abilities exerted immunoregulatory effects on the intestines of LPS-challenged mice by regulating TLR2, TLR4 and TLR9 and modulating the activation of NF-κB and MAPK signaling, thus regulating cytokine levels in the intestine to alleviate inflammation. Adhesive ability of lactobacillus strains is one of factors responsible for the ileal immune responses toward environmental stimuli. The metabolomic analysis of intestinal contents using GC-TOF-MS indicated that several metabolites were significantly changed among the LPS, ZJ617 + LPS and ZJ615 + LPS groups, including glucose and its derivatives, galactose, amino acids such as phenylalanine and valine, and also metabolic pathways, such as the biosynthesis of antibiotics, ABC transporters and mineral absorption, among others. The results from the present study provide insight into the mechanism of interaction between lactobacilli and the host, indicating that both high-adhesive ZJ617 and low-adhesive ZJ615 had modulatory effects on the intestinal immune response and metabolism in LPS-stimulated mice.
Methods
Mice and reagents
C57BL/6 mice (20 ± 2 g, 6–8 weeks old) were purchased from the Model Animal Research Center of Nanjing University (Nanjing, China). Animal care was performed according to protocols approved by the Animal Care and Use Committee in Zhejiang A & F University. LPS and streptomycin were purchased from Sigma-Aldrich (St.Louis, MO, USA). Antibodies specific to phospho-p38 MAPK, p38 MAPK, phospho-ERK1/2, ERK1/2, I-κBα and glyceraldehyde-3-phosphate dehydrogenase (GAPDH) were obtained from Cell Signaling Technology (Danvers, MA, USA). HRP (horseradish peroxidase)-conjugated secondary antibodies were obtained from Jackson ImmunoResearch (West Grove, PA, USA).
Experimental treatment and sample collection
ZJ617 (high adhesive ability) and ZJ615 (low adhesive ability) were previously isolated from piglets11. LGG was a gift from Prof. Jinru Chen at the University of Georgia. In this study, bacteria were anaerobically grown at 37 °C in de Man, Rogosa, and Sharp broth (MRS broth) (Hope Bio, Qingdao, Shandong, China) for 18 h and then stored at −80 °C. Mice were kept at a constant temperature of 26 ± 2 °C with 12 h light–dark cycles and provided with free access to water and a standard diet. The mice were randomly assigned to five groups (n = 6): two of them, designed as the control and LPS groups, received PBS. The other three treatments were named LGG + LPS, ZJ617 + LPS and ZJ615 + LPS, and mice in these group were orally inoculated with, respectively LGG, ZJ617 or ZJ615 suspended in sterile PBS at a concentration of 1 × 10⁸ CFU/ml daily for one week. The number of lactobacilli in the discharged feces (n = 6) and adhering to the ileal mucosa after 24 h LPS injection (n = 8) was evaluated (Fig. S1). Inflammation was induced in mice with an intraperitoneal (i.p.) injection of 10 mg/kg LPS, with an exception for the control group mice which received an i.p. injection of sterile PBS instead. LPS did not cause mortality in the next 24 h determined in a pilot study (Fig. S2). Blood samples were collected by cardiac puncture 24 h after the LPS challenge. The blood was allowed to clot at 4 °C for 2 h and centrifuged at 3000 g for 10 min at 4°C to obtain serum samples that were stored at −80 °C. Intestinal contents and ileal tissues were collected at 24 h after the LPS challenge and stored at −80 °C until use.
Serum cytokine and biochemical analysis
Inflammatory cytokine TNF-α and biochemical measurements (superoxide dismutase, SOD; malondialdehyde, MDA) in serum samples were evaluated by a mouse TNF-α ELISA kit (Nanjing Jiancheng Bioengineering Institution, Nanjing, China) according to the manufacturer’s instruction.
RNA extraction and real-time quantitative PCR
Total RNA from ileal tissue was extracted using TRIzol (Invitrogen, CARLSBAD, CA, USA) in liquid nitrogen according to the manufacturer’s instruction. Reverse transcription was carried out using a reverse transcription kit (TaKaRa Bio, Shiga, Japan), and cDNA was stored at −20 °C until use. Quantitative real-time PCR (qRT-PCR) was performed using SYBR® Premix Ex Taq (TaKaRa Bio), according to the manufacturer’s instructions. The reaction was conducted using the Mx3000PTM system (Agilent, Palo Alto, CA, USA) that was programmed for denaturation at 95°C for 30 s, followed by 40 cycles of 95°C for 5 s and 60°C for 30 s. The sequences of the PCR primers33 were as follows: β-actin (5′-TGGAATCCTGTGGCATCCATGAAAC-3′, 5′-TAAAACGCAGCTCAGTAACAGTCCG-3′); IL-6 (5′-ACCACGGCCTTCCCTACTT-3′, 5′-CACAACTCTTTTCTCATTTCCAC-3′); IL-10 (5′-CCCTTTGC TATGGTGTCCTT-3′, 5′-TGGTTTCTCTTCCCAAGACC-3′); IL-12 (5′-GGAAGCACGGCAGCAGAAT-3′, 5′-GGCGGGTCTGGTTTGATG-3′); TNF-α (5′-TGGGAGTAGACAAGGTACAACCC-3′, 5′-CATCTT CTCAAAATTCGAGTGACAA-3′); TLR2 (5′-AAGATGTCGTTCAAGGAGGTGCG-3′, 5′-ATCCTCT GAGATTTGACGCTTTG-3′); TLR4 (5′-GGTGTGAAATTGAGACAATTGAAAAC-3′, 5′-GTTTC CTGTCAGTACCAAGGTTGA-3′); TLR9 (5′-ATCTCCCAACATGGTTCTCCG-3′, 5′-GATACGGTTGGA GATCAAGGAG-3′).
Data were analyzed using the Mx3000PTM system software. The relative quantification of gene expression with β-actin as an internal standard was determined by the cycle threshold (Ct) method as follows: ∆∆Ct = [Ct(target gene) – Ct(housekeeping gene)] treatment – [Ct(target gene) – Ct(housekeeping gene)] control. The final data were derived from the formula 2−∆∆Ct.
Western blot
Ileal tissues were lysed using lysis buffer (Sigma-Aldrich) in liquid nitrogen according to the manufacturer’s instructions. The concentration of protein in samples was determined by Bradford’s method34. Total protein samples separated with SDS-PAGE, transferred to PVDF membranes, blocked and incubated with primary antibody at 4°C overnight. After incubation with the HRP-conjugated secondary antibody, the blot was developed with ECL (Millipore, Merck KGaA, Darmstadt, Germany). The optical density of the bands was measured using ImageJ software (National Institutes of Health, Bethesda, MD, USA).
Immunohistochemistry
Ileal tissues were fixed in formalin, embedded in paraffin, and cut into 4 μm sections according to previous methods35. Deparaffinized and rehydrated sections were blocked with 10% normal goat serum for 1 h. Sections were incubated with primary antibodies overnight at 4 °C and then with HRP-conjugated secondary antibody for 1 h. The diaminobenzidine-HRP detection system was used, and sections were then counterstained with hematoxylin, dehydrated and cover-slipped. Positive IHC staining36 was determined with a microscope (ECLIPSE Ti, Nikon Corp., Tokyo, Japan).
Preparation of intestinal contents for GC-TOF-MS
Twenty mg ileal contents from each mouse was extracted with 0.4 mL methanol-chloroform (Vmethanol : Vchloroform = 3 : 1) with the addition of 30 μL L-2-chlorophenylalanine (1 mg/ml stock in ddH2O) as an internal standard. The sample was homogenized in a ball mill for 3 min at 65 Hz and then centrifuged at 12,000 rpm for 15 min at 4 °C. Supernatants were transferred to a GC-TOF-MS glass vial, and 20 μl of each sample was added to one glass vial as a mixed sample for quality control. After metabolite extracts were dried in a vacuum concentrator without heating for 1.5 h, 60 μl microliter methoxymethyl amine salt (dissolved in pyridine, 20 mg/mL) was added into the dried metabolite extracts for 20 min at 80 °C. After the addition of 80 μL BSTFA (containing 1% TCMS, v/v), each extract sample was incubated at 70 °C for 1 h and then subjected to analysis via GC-TOF-MS.
GC-TOF-MS analysis
Based on a previous study28, GC-TOF-MS analysis was performed with an Agilent 7890 gas chromatograph system linked to a Pegasus HT time-of-flight mass spectrometer (LECO, St. Joseph, MI, USA). The system employed a DB-5 column with 5% diphenyl and 95% dimethyl polysiloxane (J&W Scientific, Folsom, CA, USA). The GC column temperature was programmed to rise from 50 to 330 °C at a rate of 10 °C/min. One microliter of sample was injected in splitless mode. The energy was −70 eV in electron impact mode. Data were acquired in full-scan mode with an m/z range of 30–600 at a 20 spectra/sec velocity.
Metabolomics data analysis
Chroma TOF 4.3X software from the LECO Corporation and the LECO-Fiehn Rtx5 database were used for raw peaks extraction, baseline filtering and calibration of the baseline, peak alignment, deconvolution analysis, peak identification and integration of the peak area based on the previous study37. The SIMCA-P 13.0 software package (Umetrics, Umea, Sweden) was used for principal component analysis (PCA), partial least squares discriminant analysis (PLS-DA) and orthogonal projections to latent structures-discriminant analysis (OPLS-DA). After unit variance (UV) scaling in the data process, PCA was applied to show the origin data set. The PLS-DA model validated by 200 permutation tests was used to obtain a higher level of data separation. Furthermore, OPLS-DA was performed to obtain maximal covariance among the data. To refine the analysis, the first principal component of variable importance projection (VIP) was obtained. The VIP values exceeding 1.0 were first selected as changed metabolites, then assessed by Student’s T test (T-test), P > 0.05, and variables were discarded between two comparison groups. The fold change (FC) of metabolites was obtained by comparing mean peak values between two groups. Obtained metabolites were validated by searching in the Kyoto Encyclopedia of Genes and Genomes (KEGG), and each metabolite was cross-linked with pathways in the KEGG.
Statistics
The data from qRT-PCR, western-blots and IHC are expressed as the mean ± standard deviation (SD) of the replicates. The statistical significance was evaluated using one-way analysis of variance (ANOVA, general linear model), followed by Duncan’s multiple range test using the SAS program (SAS Institute, INC, USA). Differences are considered significant if P < 0.05. Spearman’s correlation analysis was conducted in the Graphpad Prism 5.0 software (GRAPHPAD Software, San Diego, CA, USA).
Additional Information
How to cite this article: Gao, K. et al. Doses Lactobacillus reuteri depend on adhesive ability to modulate the intestinal immune response and metabolism in mice challenged with lipopolysaccharide. Sci. Rep. 6, 28332; doi: 10.1038/srep28332 (2016).
Supplementary Material
Acknowledgments
This research was supported by grants from the National Natural Science Foundation of China (No. 31172221 and No. 30901043), the Natural Science Foundation of Zhejiang Province (No. Y14C170018) and the China Spark Program (2015GA700001). The authors gratefully thank Mr. Jianfeng Wang (Biotree Biotech Co., Ltd., Shanghai, China) for assistance with the metabolomics data analysis.
Footnotes
Author Contributions K.G. and H.W. designed the study, analyzed data, and wrote the manuscript. K.G., L.L., X.D. and W.Z. conducted the experiments. C.W. and J.L. contributed to the data analysis and the manuscript writing and editing.
References
- Dylag K., Hubalewska-Mazgaj M., Surmiak M., Szmyd J. & Brzozowski T. Probiotics in the mechanism of protection against gut inflammation and therapy of gastrointestinal disorders. Curr Pharm Des 20, 1149–1155 (2014). [DOI] [PubMed] [Google Scholar]
- Toral M. et al. The probiotic Lactobacillus coryniformis CECT5711 reduces the vascular pro-oxidant and pro-inflammatory status in obese mice. Clin Sci (Lond) 127, 33–45 (2014). [DOI] [PubMed] [Google Scholar]
- Ogita T. et al. Modulatory activity of Lactobacillus rhamnosus OLL2838 in a mouse model of intestinal immunopathology. Immunobiology 220, 701–710 (2015). [DOI] [PubMed] [Google Scholar]
- Galley J. et al. Probiotic lactobacillus ameliorates heightened colonic inflammatory responses in infected stressor-exposed C57BL/6 mice and inhibits dysbiosis (MPF1P. 771). J Immunol 192, 66.10–66.10 (2014). [Google Scholar]
- Hemarajata P. & Versalovic J. Intestinal lactobacillus reuteri: partners and beneficial microbes In Old Herborn University Seminar Monograph 25: Bacterial species as partners and pathogens (eds Peter J. H. et al. ) Ch. 3, 31–43 (Old Herborn University, 2012). [Google Scholar]
- Whary M. T. et al. Lactobacillus reuteri promotes Helicobacter hepaticus-associated typhlocolitis in gnotobiotic B6.129P2-IL-10(tm1Cgn) (IL-10(−/−)) mice. Immunology 133, 165–178 (2011). [DOI] [PMC free article] [PubMed] [Google Scholar]
- McCabe L. R., Irwin R., Schaefer L. & Britton R. A. Probiotic use decreases intestinal inflammation and increases bone density in healthy male but not female mice. J Cell Physiol 228, 1793–1798 (2013). [DOI] [PMC free article] [PubMed] [Google Scholar]
- Sun Z. et al. In vitro evaluation of Lactobacillus crispatus K313 and K243: high-adhesion activity and anti-inflammatory effect on Salmonella braenderup infected intestinal epithelial cell. Vet Microbiol 159, 212–220 (2012). [DOI] [PubMed] [Google Scholar]
- Gao K. et al. Immunomodulation and signaling mechanism of Lactobacillus rhamnosus GG and its components on porcine intestinal epithelial cells stimulated by lipopolysaccharide. J Microbiol Immunol Infect , 10.1016/j.jmii.2015.05.002 (2015). [DOI] [PubMed] [Google Scholar]
- Bajaj J. S. et al. Randomised clinical trial: Lactobacillus GG modulates gut microbiome, metabolome and endotoxemia in patients with cirrhosis. Aliment Pharmacol Ther 39, 1113–1125 (2014). [DOI] [PMC free article] [PubMed] [Google Scholar]
- Zhang W. et al. Adhesive ability means inhibition activities for lactobacillus against pathogens and S-layer protein plays an important role in adhesion. Anaerobe 22, 97–103 (2013). [DOI] [PubMed] [Google Scholar]
- Jump R. L. et al. Metabolomics analysis identifies intestinal microbiota-derived biomarkers of colonization resistance in clindamycin-treated mice. PLos One 9, e101267 (2014). [DOI] [PMC free article] [PubMed] [Google Scholar]
- Spagou K. et al. A GC-MS metabolic profiling study of plasma samples from mice on low- and high-fat diets. J Chromatogr B Analyt Technol Biomed Life Sci 879, 1467–1475 (2011). [DOI] [PubMed] [Google Scholar]
- Patterson E. et al. Impact of dietary fatty acids on metabolic activity and host intestinal microbiota composition in C57BL/6J mice. Br J Nutr , 111, 1–13 (2014). [DOI] [PubMed] [Google Scholar]
- Jacobs D. M., Gaudier E., van Duynhoven J. & Vaughan E. E. Non-digestible food ingredients, colonic microbiota and the impact on gut health and immunity: a role for metabolomics. Curr Drug Metab 10, 41–54 (2009). [DOI] [PubMed] [Google Scholar]
- Marcobal A. et al. A metabolomic view of how the human gut microbiota impacts the host metabolome using humanized and gnotobiotic mice. ISME J 7, 1933–1943 (2013). [DOI] [PMC free article] [PubMed] [Google Scholar]
- Kau A. L., Ahern P. P., Griffin N. W., Goodman A. L. & Gordon J. I. Human nutrition, the gut microbiome and the immune system. Nature 474, 327–336 (2011). [DOI] [PMC free article] [PubMed] [Google Scholar]
- Claesson M. J. et al. Gut microbiota composition correlates with diet and health in the elderly. Nature 488, 178–184 (2012). [DOI] [PubMed] [Google Scholar]
- Vilahur G. et al. Lactobacillus plantarum CECT 7315/7316 intake modulates the acute and chronic innate inflammatory response. Eur J Nutr 40, 1–11 (2014). [DOI] [PubMed] [Google Scholar]
- Juarez G. E., Villena J., Salva S., de Valdez G. F. & Rodriguez A. V. Lactobacillus reuteri CRL1101 beneficially modulate lipopolysaccharide-mediated inflammatory response in a mouse model of endotoxic shock. J Funct Foods 5, 1761–1773 (2013). [Google Scholar]
- Wang Y. et al. Protective effects of probiotic Lactobacillus casei Zhang against endotoxin- and d-galactosamine-induced liver injury in rats via anti-oxidative and anti-inflammatory capacities. Int ImmunoPharmacol 15, 30–37 (2013). [DOI] [PubMed] [Google Scholar]
- Peng X. & Jiang Y. Protective effects of Lactobacillus plantarum NDC 75017 against lipopolysaccharide-induced liver injury in mice. Inflammation 37, 1599–1607 (2014). [DOI] [PubMed] [Google Scholar]
- Castillo N. A., Perdigon G. & de Moreno de Leblanc A. Oral administration of a probiotic Lactobacillus modulates cytokine production and TLR expression improving the immune response against Salmonella enterica serovar Typhimurium infection in mice. BMC Microbiol 11, 177 (2011). [DOI] [PMC free article] [PubMed] [Google Scholar]
- Walter J., Britton R. A. & Roos S. Host-microbial symbiosis in the vertebrate gastrointestinal tract and the Lactobacillus reuteri paradigm. Proc Natl Acad Sci USA 108 Suppl 1, 4645–4652 (2011). [DOI] [PMC free article] [PubMed] [Google Scholar]
- Wullaert A., Bonnet M. C. & Pasparakis M. NF-kappaB in the regulation of epithelial homeostasis and inflammation. Cell Res 21, 146–158 (2011). [DOI] [PMC free article] [PubMed] [Google Scholar]
- Segawa S. et al. Probiotic-derived polyphosphate enhances the epithelial barrier function and maintains intestinal homeostasis through integrin-p38 MAPK pathway. PLos One 6, e23278 (2011). [DOI] [PMC free article] [PubMed] [Google Scholar]
- Jang S. E. et al. Lactobacillus brevis G-101 ameliorates colitis in mice by inhibiting NF-kappaB, MAPK and AKT pathways and by polarizing M1 macrophages to M2-like macrophages. J APPl Microbiol 115, 888–896 (2013). [DOI] [PubMed] [Google Scholar]
- Sun H. Z. et al. Metabolomics of four biofluids from dairy cows: potential biomarkers for milk production and quality. J Proteome Res 14, 1287–1298 (2015). [DOI] [PubMed] [Google Scholar]
- Stsepetova J. et al. Diversity and metabolic impact of intestinal Lactobacillus species in healthy adults and the elderly. Br J Nutr 105, 1235–1244 (2011). [DOI] [PubMed] [Google Scholar]
- Daly K. et al. Dietary supplementation with lactose or artificial sweetener enhances swine gut Lactobacillus population abundance. Br J Nutr 111 Suppl 1, S30–S35 (2014). [DOI] [PubMed] [Google Scholar]
- Lievin-Le Moal V. & Servin A. L. Anti-infective activities of lactobacillus strains in the human intestinal microbiota: from probiotics to gastrointestinal anti-infectious biotherapeutic agents. Clin Microbiol Rev 27, 167–199 (2014). [DOI] [PMC free article] [PubMed] [Google Scholar]
- Scholz-Ahrens K. E. et al. Prebiotics, probiotics, and synbiotics affect mineral absorption, bone mineral content, and bone structure. J Nutr 137, 838S–846S (2007). [DOI] [PubMed] [Google Scholar]
- Tu C. T. et al. Curcumin attenuates Concanavalin A-induced liver injury in mice by inhibition of Toll-like receptor (TLR) 2, TLR4 and TLR9 expression. Int ImmunoPharmacol 12, 151–157 (2012). [DOI] [PubMed] [Google Scholar]
- Kruger N. J. The Bradford method for protein quantitation. Methods Mol Biol 32, 9–15 (1994). [DOI] [PubMed] [Google Scholar]
- Yang X. et al. A neonatal gnotobiotic pig model of human enterovirus 71 infection and associated immune responses. Emerging Microbes & Infections 3, e35 (2014). [DOI] [PMC free article] [PubMed] [Google Scholar]
- van Diest P. J. et al. A scoring system for immunohistochemical staining: consensus report of the task force for basic research of the EORTC-GCCG. European Organization for Research and Treatment of Cancer-Gynaecological Cancer Cooperative Group. J Clin Pathol 50, 801–804 (1997). [DOI] [PMC free article] [PubMed] [Google Scholar]
- Kind T. et al. FiehnLib: mass spectral and retention index libraries for metabolomics based on quadrupole and time-of-flight gas chromatography/mass spectrometry. Anal Chem 81, 10038–10048 (2009). [DOI] [PMC free article] [PubMed] [Google Scholar]
Associated Data
This section collects any data citations, data availability statements, or supplementary materials included in this article.