Abstract
Background
Single Cell Network Profiling (SCNP) is a multiparametric flow cytometry-based assay that quantifiably and simultaneously measures changes in intracellular signaling proteins in response to in vitro extracellular modulators at the single cell level. Myelodysplastic syndrome (MDS) is a heterogeneous clonal disorder of hematopoietic stem cells that occurs in elderly subjects and is characterized by dysplasia and ineffective hematopoiesis. The functional responsiveness of MDS bone marrow (BM) hematopoietic cells, including functionally distinct myeloid and erythroid precursor subsets, to hematopoietic growth factors (HGF) and the relationship of modulated signaling to disease characteristics is poorly understood.
Methods
SCNP was used first to examine the effects of age on erythropoietin (EPO) and granulocyte colony stimulating factor (GCSF)-induced signaling in myeloid, nucleated red blood cells (nRBC), and CD34 expressing cell subsets in healthy BM (n=15). SCNP was then used to map functional signaling profiles in low risk (LR) MDS (n=7) for comparison to signaling in samples from healthy donors and to probe signaling associations within clinically defined subgroups.
Results
In healthy BM samples, signaling responses to HGF were quite homogeneous (i.e. tightly regulated) with age-dependent effects observed in response to EPO but not to GCSF. Despite the relatively small number of samples assayed in the study, LR MDS could be classified into distinct subgroups based on both cell subset frequency and signaling profiles.
Conclusion
As a correlate of underlying genetic abnormalities, signal transduction analyses may provide a functional and potentially clinically relevant classification of MDS. Further evaluation in a larger cohort is warranted.
Keywords: Signaling, EPO, GCSF, SCNP, MDS, Age-related bone marrow cell signaling
Background
The incidence of myelodysplastic syndrome (MDS) increases with age, with 86% of patients presenting at age 60 years or greater (1). On the other side, physiologic age-dependent functional alterations are known to occur within the hematopoietic system in both erythroid and myeloid hematopoietic compartments.
For instance, hemoglobin levels in healthy individuals have been shown to decline and the incidence of anemia to increase with age (2,3). This anemia appears to be due to decreased marrow responsiveness to stimulation rather than to decreased growth factor levels, since the production of erythropoietin (EPO) is equivalent in both younger and elderly healthy persons (>75 years old) (4). However, the administration of recombinant EPO to anemic patients undergoing chemotherapy treatment for cancer was found to be equally effective in both younger and elderly patients (5) and, when subjects were examined longitudinally, EPO levels were found to rise with age (2).
Likewise, in the myeloid series there is a decrease in mean colony formation in response to granulocyte colony stimulating factor (GCSF) in bone marrow (BM) from older (age 70–80 years) compared to younger (age 20–30 years) individuals (6). However, following GCSF administration the in-vivo peak absolute neutrophil count (ANC) was the same in younger (20–30 year old) and older (70–80 year old) volunteers, suggesting that the response to signal as measured by peripheral blood (PB) ANC was independent of age (6).
It is not known whether these age-related differences in the myeloid and erythroid cell subsets are clinically significant in the absence of hematopoietic stress. Consequently, the role of signaling alterations as a cause of age related differences in hematopoiesis has not been confirmed, mostly due to lack of appropriate technology platforms.
Single cell network profiling (SCNP) is a multiparameter flow cytometry platform that analyzes protein expression and activity under baseline and modulated conditions at the single cell level but without the need for cell separation, thus providing a systems biology view of the capacity and connectivity of intra- and inter-cellular signaling networks in complex tissues (such as BM). When applied to pathways shown to be involved in disease pathology, this method has many potential applications including the creation of a biology-based disease characterization informative of disease outcomes and treatment(7–9).
MDS are heterogeneous disorders of hematopoietic precursors that occur mainly in elderly patients with a median age of 76 years (1). The disease course may be indolent or aggressive with approximately one-third of adult MDS patients progressing to acute myeloid leukemia (AML), which is associated with poor prognosis. The classification of MDS has evolved with time from a morphology based classification (The French-American-British (FAB) which subdivided MDS into five disease entities - refractory anemia[RA], RA ringed-sideroblasts[RARS], RA excess blasts[RAEB], RAEB- in transformation [RAEB-t] and chronic myelomonocytic leukemia [CMML] - based on BM morphology and presence or absence of BM blasts or peripheral monocytosis) to a newer World Health Organization (WHO) morphologic classification based on the combination of a refined morphologic classification with cytogenetics. More recently, multiparametric flow cytometry has been used to follow the expression patterns of both surface and cytoplasmic differentiation antigens and many believe this technology will be used for improved classification and ultimately therapeutic selection in MDS(10). More recently, multiparametric flow cytometry has been used to follow the expression patterns of both surface and cytoplasmic differentiation antigens, and many believe this technology will be used for improved classification and ultimately therapeutic selection in MDS(10). In addition, within each MDS subset, patients are assessed for risk of AML transformation and for estimated survival without therapeutic interventions using the International Prognostic Scoring System (IPSS) which uses BM blast percentage, karyotype and the number of cytopenias to calculate a composite score used to assign a patient to one of four risk categories. Patients in the low and intermediate-1 (INT-1) risk category, herein referred to as low risk MDS (LR MDS), have higher overall survival and lower leukemic transformation rates when compared to patients in the intermediate-2 (INT-2) and high risk categories (11).
LR MDS is characterized by cytopenias, despite the fact that the marrow is usually hypercellular, with inefficient hematopoiesis resulting from known defects in signaling and increased rates of apoptosis (12,13). In the majority of cases, anemia is an early and prominent finding despite the presence of normal to elevated levels of serum EPO and EPO receptor (14,15). When BM mononuclear cells (BMMC) from patients with LR MDS are cultured in the presence of EPO, erythroid colony formation is reduced compared to healthy samples (15,16). Furthermore, phosphorylation (p) of STAT5 measured in nuclear extracts by electrophoretic mobility shift assay is absent or greatly reduced in patients with LR MDS in response to stimulation with EPO (17). However, no statistically significant difference was observed in GCSF-mediated phosphorylation of STAT5 in vitro between CD34+ BMMC from patients with MDS and healthy controls. In the clinic EPO administration in the presence and absence of GCSF administration has been shown to be an effective therapy for a subset of patients with LR MDS (18,19). In vitro response to EPO stimulation in CD71+ CD45− cells was found to correlate with the clinical response to EPO in vivo (20,21). This heterogeneous response to growth factors indicates a need for further investigation (20).
In this report, we use SCNP to examine the effects of donor age on EPO and GCSF induced signaling in cryopreserved healthy BMMC. We then examine the feasibility of applying SCNP to simultaneously measure EPO response in nucleated red blood cell (nRBC) subsets and GCSF response in myeloid and CD34+ BMMC to further understand the heterogeneity in LR MDS and to compare these induced signaling profiles to age-matched healthy BMMC subsets.
Materials and Methods
Patient Samples
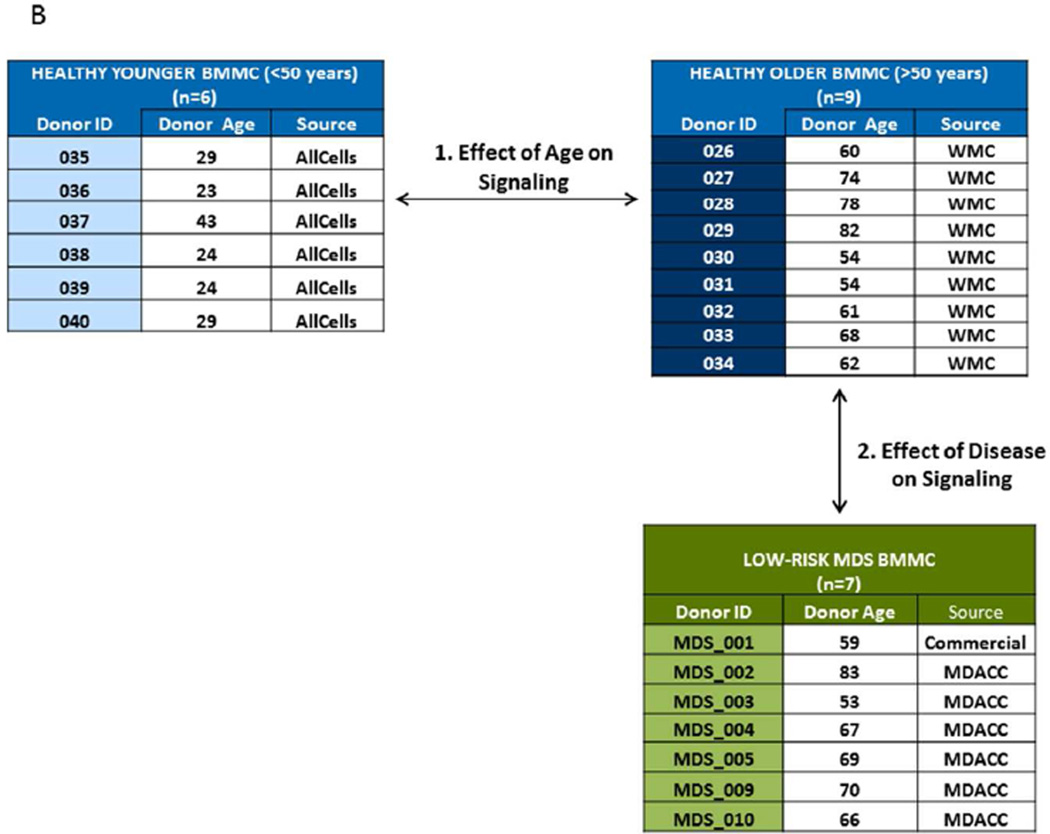
Two sets of BMMC samples obtained from healthy donors were analyzed. One healthy sample set was composed of 9 cryopreserved BMMC obtained from “elderly” patients aged 54 to 82 years undergoing planned orthopedic procedures at Williamson Medical Center in Tennessee. The second (“younger”) healthy sample set consisted of 6 cryopreserved BMMC obtained from donors aged 23 to 43 years, purchased from a commercial source (AllCells).
Eleven MDS samples were acquired from untreated patients with a diagnosis of LR MDS (defined as low and INT-1 IPSS) at MD Anderson Cancer Center (MDACC) between May 1999 and September 2008. Study inclusion was based on cell availability at MDACC sample bank. One additional LR MDS sample was purchased from a commercial source (Conversant). In accordance with the Declaration of Helsinki, all patients consented to the collection and use of their samples for institutional review board (IRB)-approved research purposes. Clinical data were de-identified in compliance with Health Insurance Portability and Accountability Act regulations. Sample inclusion required a diagnosis of LR MDS with sample collection prior to the initiation of treatment and pre-defined standards of post thaw cell viability and signaling (>50% “healthy cells”, as defined below in SCNP assays and Statistics and based on previous experience)(9).
5 samples out of the 12 collected samples failed screening by having either low viability (<50%) upon thaw (3 samples) or poor intrinsic signaling potential demonstrated by no response to EPO or GCSF treatment (2 samples). Characteristics of screening failures were not different from eligible samples (Table 1) and are listed in Supplemental Table S1.
Table 1.
| LOW-RISK MDS BMMC (n=7) | ||||||||
|---|---|---|---|---|---|---|---|---|
| Donor ID | IPSS | FAB | WHO | Cyto | WBC (K/uL) |
Hgb (g/dL) |
Plt (K/uL) |
BM Blast |
| MDS_001 | INT-1 | RAEB | RAEB | 11p- | 4.1 | 7.8 | 17 | N/A* |
| MDS_002 | INT-1 | RAEB | RAEB-1 | dip | 34 | 9.1 | 21 | 5% |
| MDS_003 | INT-1 | RAEB | RAEB-1 | dip | 14.5 | 8.9 | 62 | 7% |
| MDS_004 | INT-1 | RAEB | RAEB-1 | dip | 2.2 | 9.4 | 31 | 6% |
| MDS_005 | INT-1 | RAEB | RAEB-1 | +8 | 40.8 | 12.8 | 92 | 10% |
| MDS_009 | INT-1 | RARS | RARS | +8 | 7.3 | 7.8 | 408 | 2% |
| MDS_010 | Low | RARS | RARS | dip | 4.8 | 9.9 | 256 | 3% |
SCNP Assays
SCNP assays were performed as described previously (22,23). Pre-defined standards of post-thaw cell viability and signaling included the presence at the zero-hour unmodulated condition of >50% healthy cells (defined as Amine Aqua and cleaved PARP negative), and signaling response to at least one modulator in the gated populations. Cryopreserved samples were thawed at 37 °C, washed in RPMI 60% fetal bovine serum (FBS), and purified through ficoll density centrifugation. Mononuclear cells were washed in RPMI 1% FBS and counted before staining with Live/Dead Fixable Aqua Dead Cell Stain (Invitrogen) to distinguish nonviable cells. For Aqua staining, cells were stained in 0.2% PBS/Aqua solution at 37 °C for 15 minutes (Aqua reconstituted stock was made by adding 50µl DMSO to 1 vial of lyophilized Aqua. 1µl of Aqua in DMSO resonsititued stock was used per 106 cells). Cells were then counted again, washed and resuspended in RPMI 10% FBS, aliquoted to 150,000 cells per condition, and rested at 37 °C for 2 hours. For signaling assays, cells were incubated with modulators (Supplemental Table S2) at 37°C for 15 minutes, fixed with 1.6% paraformaldehyde (final concentration) for 10 minutes at 37°C, pelleted and permeabilized with 100% ice-cold methanol and stored at −80°C. Subsequently, cells were washed with fluorescence-activated cell sorting buffer (PBS/0.5% bovine serum albumin/0.05% NaN3), pelleted, and stained with cocktails of fluorochrome-conjugated antibodies (Supplemental Table S3). These cocktails included antibodies against cell surface markers for myeloid cells (CD45), stem cells (CD34) and nRBC subsets (CD71 and CD235a), and antibodies against intracellular signaling molecules (i.e. EPO stimulated p-STAT5; GCSF stimulated p-STAT1, p-STAT3, p-STAT5, p-Akt, p-Erk1/2 or p-S6).
Flow Cytometry Data Acquisition and Analysis
Flow cytometry data were acquired on a LSRII flow cytometer using FACSDiva software (BD Biosciences) and analyzed with FlowJo (TreeStar Software) or Winlist (Verity House Software). Antibody staining panels and compensation matrices are shown in Supplemental Table S4. Details of instrument compensation settings including Aqua compensation are provided in Supplemental table S4.
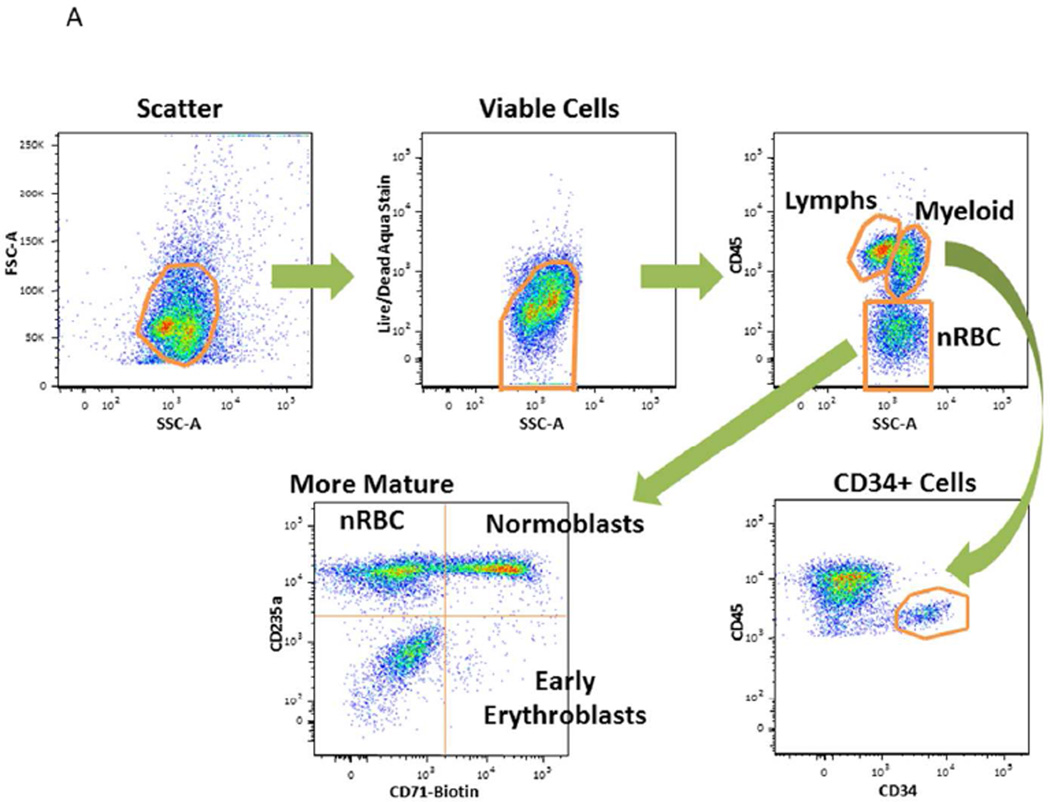
Myeloid cells were identified by side scatter (SSC) versus CD45 characteristics of myeloid blasts and monocytoid cells. Stem cells were identified as cells that express CD45MiCD34+. The nRBC were identified as cells that express SSC versus CD45Lo characteristics. Additional lineage markers were used for further identification of nRBC sub-populations (e.g., CD71+CD235a−: early erythroblasts; CD71+CD235a+: normoblasts; CD71−CD235a+: more mature nRBC) as shown in Fig. 1A (17).
Figure 1. Study Overview.
A. Gating Schema Flow cytometry plots and sequential gating scheme. The first panel is a flow cytometry dot plot indicating how non-cellular debris were included using a FSC and SSC gate. Cells were gated in the second panel using Boolean logic to identify live cells by light scatter that excluded the amine aqua viability dye. The third panel is a flow cytometry dot plot indicating CD45 positive cells; myeloid cells were identified as cells that express the SSC versus CD45 characteristics of myeloid blasts and monocytoid cells; stem cells were identified as cells that express CD45MiCD34+ and nucleated red blood cells (nRBC) were identified as cells that express the SSC versus CD45Lo characteristics. Additional lineage markers such as CD71 and CD235a were used for further identification of nRBC sub-populations as indicated.
B. Study Schema and Sample Characteristics The two-step study involved the comparison of GCSF and EPO -mediated signaling in BMMC samples obtained from “older” versus “younger” donors followed by the identification of dysfunctional signaling by comparison of BMMC from low risk MDS to BMMC from age-matched healthy control. Sample characteristics for healthy BMMC and for MDS samples are listed.
A minimum of 100 viable cells for nRBC and a minimum of 200 viable cells for each of the other gated populations were required for analysis.
Flow Cytometry Data Analysis-Metrics
Median fluorescence intensity (MFI) was computed from the fluorescence intensity levels of the cells. Equivalent Number of Reference Fluorophores (ERF)(24–26) is a transformed value of the MFI values. ERF was computed using a calibration line determined by fitting observations of a standardized set of 8-peak rainbow beads for all fluorescent channels (Spherotech Libertyville, IL; Cat. No. RFP-30-5A) to standard values assigned by the manufacturer. ERF was used to standardize, qualify and monitor the instrument during setup, and to calibrate the raw fluorescence intensity readouts on a plate-by-plate basis and to control for instrument variability. ERF values were then used to compute a variety of metrics to measure the biology of functional signaling proteins (Supplemental Fig. S1). To measure basal levels of signaling in the resting, unmodulated state, the “Basal” metric was used: log2(ERFUnmodulated /ERFAutofluoresence). With modulation, the “Fold” metric defined as log2(ERFModulated /ERFUnmodulated) was used to identify the inducibility of a protein. The “Total” metric defined as log2(ERFModulated / ERFAutofluorescence) was developed to assess the magnitude of total activated protein. Uu is the Mann-Whitney U statistic comparing the ERF values of the modulated and unmodulated wells that has been scaled to the unit interval (0,1) for a given donor and specimen type (e.g., BMMC) and was used to demonstrate the number of cells showing signaling. Percent Positive (“PercentPos”) was used to quantify the frequency of cells positive for a surface marker relative to a control antibody.
Statistical Analysis
In order to minimize the effect of pre-analytic variables on assay read-outs, methods and specifications have been developed to assess sample “health” for inclusion in the SCNP assays (27). Specifically, for each sample cell health was assessed by measuring the cells that were alive (i.e. Amina Aqua negative) and non-apoptotic (i.e. cleaved PARP negative) as a fraction of the total number of intact cells at the time-zero unmodulated condition: % Healthy cells = [Amine Aqua− Cleaved PARP− Cells/ Scatter Gated Cells] × 100%. A pre-specified cut off (>50% “healthy cells”, as previously defined (9)) was used to consider a sample evaluable) was used to consider a sample evaluable.
Given the hypothesis-generating nature of this study no sample size calculations were made and results are therefore descriptive in nature, with p values provided only for information since no correction for multi-testing was done. Data graphs, R2 and P values were computed by Tableau (Tableau Software) to assess association between age as a continuous variable and induced signaling (e.g., EPO modulated p-STAT5 activity in nRBC) or frequency of cell subsets (i.e., myeloid cells, stem cells or nRBC sub-populations) in each healthy donor.
Heat maps were generated to visually inspect the range of induced signaling and cell populations of interest (i.e., EPO or GCSF modulated JAK/STAT pathway activity in myeloid cells, stem cells or nRBC sub-populations) across all donors. Data graphs were constructed by Tableau (Tableau Software) to display association between clinical diagnosis (e.g., RAEB-1, RARS) and signaling responsiveness or frequency of cell subsets in each donor.
Results
Patient and Sample Characteristics
Modulated SCNP was evaluated in two sets of healthy and one set of LR MDS BM samples. Sample characteristics and study schema are shown in Table 1 and in Fig. 1B.
The age of healthy donors ranged from 24–43 years for the “younger” group and from 54–82 years for the “older” group. LR MDS samples were obtained from patients with RARS or RAEB with IPSS low or INT-1 and an age range of 53–83 years, comparable to the age range of the older healthy donor group. Of note patient 2, patient 3 and patient 5 had elevated white blood cell count (WBC) at diagnosis while patient 1 and patient 4 had low/normal WBC. The majority of patients had anemia and thrombocytopenia.
Effect of Donor Age on Bone Marrow Signaling Function
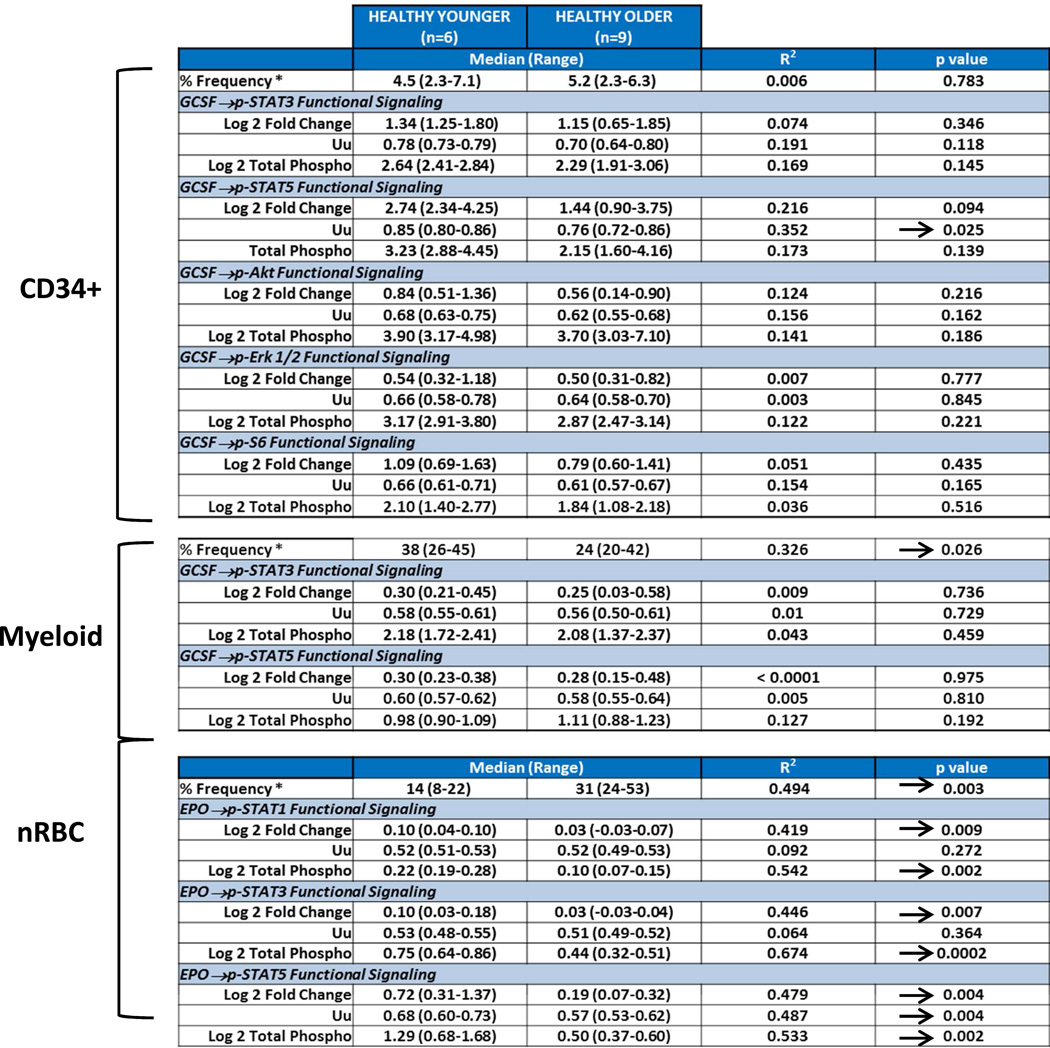
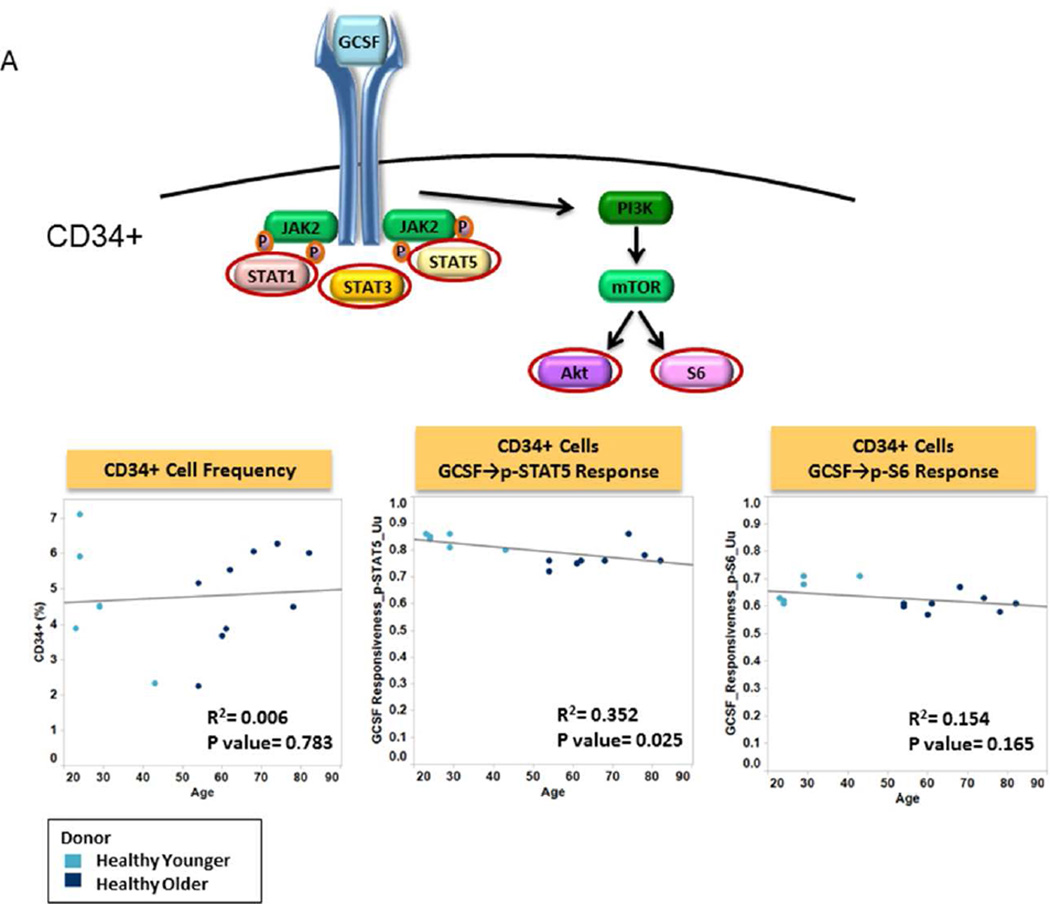
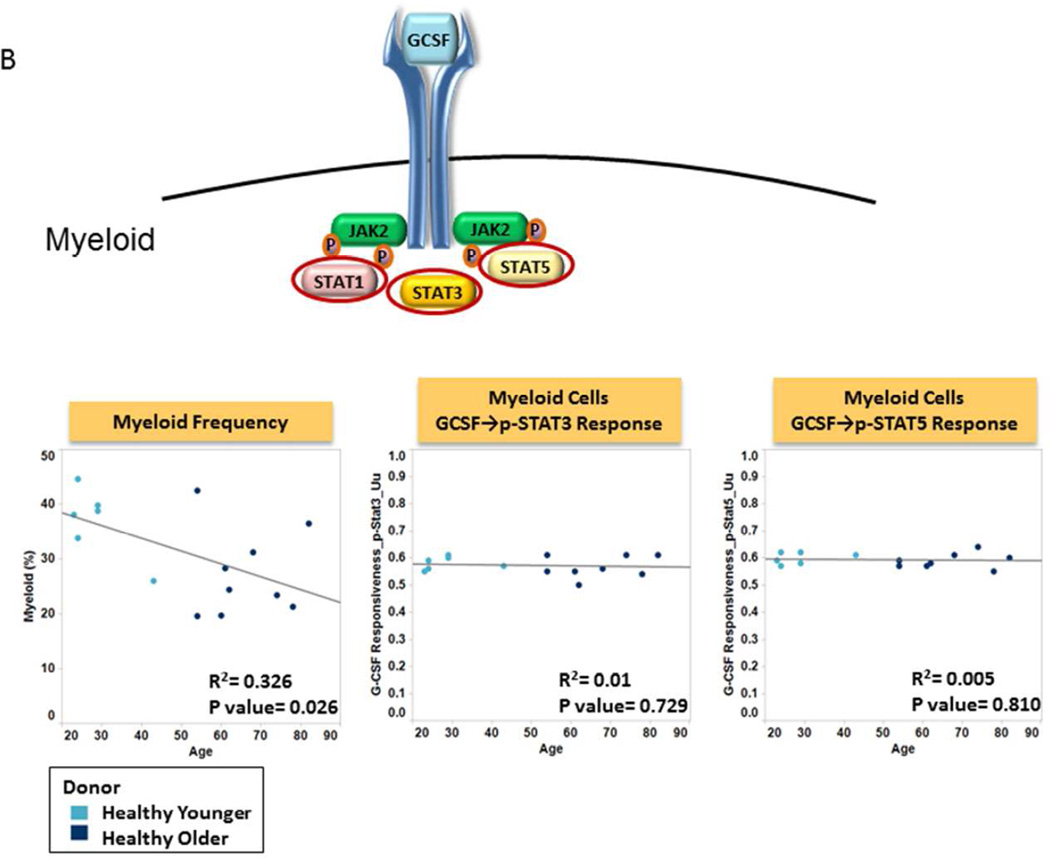
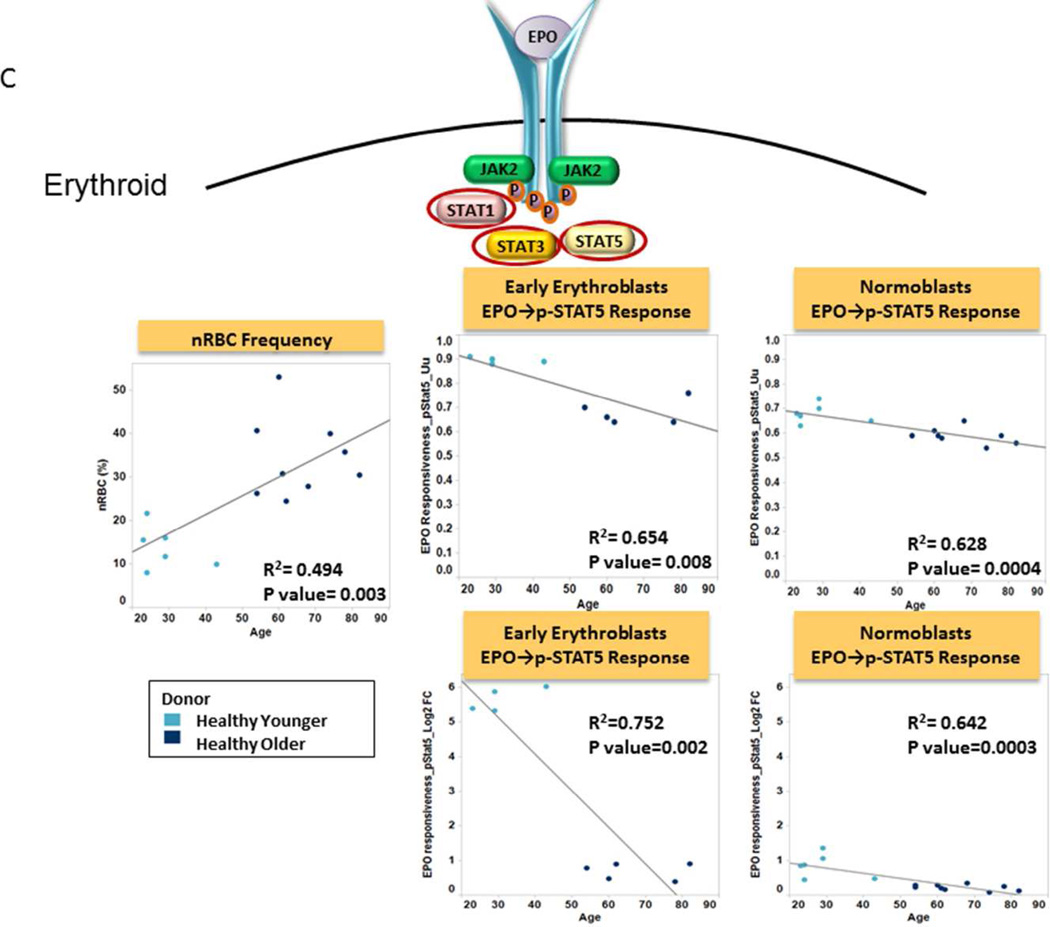
We first evaluated the effects of donor age on the frequency and signaling function of CD34 expressing cells (CD34+), myeloid cells and nRBC cells from healthy donor BM. The frequency of CD34+ cells was found to be independent of donor age (R2=0.006; p=0.783) (Table 2, Fig. 2A). CD34+ cell signaling ability was tested by examining GCSF induced phosphorylation of the STAT and PI3K pathways in both younger and older patient samples. Examination of signaling nodes using all 3 metrics described in Material and Methods (Uu, Fold change, and Total phospho) revealed no significant correlations between age and induced p-STAT3, p-Akt, p-Erk1/2 or p-S6 levels between older and younger populations. However, a weak negative correlation with age for GCSF induced p-STAT5 was noted when the Uu metric was applied (R2=0.352, p=0.025) (Table 2, Fig. 2A). A decreased frequency of myeloid and increased frequency of nRBC populations were observed in the older subject group compared to the younger counterparts (R2=0.326, p=0.026; and R2=0.494, p=0.003 respectively). However, there were no significant correlations between age and GCSF induced p-STAT3 or p-STAT5 levels (using any of the 3 metrics), indicating no difference in GCSF mediated myeloid signaling between older and younger normal bone marrow sources (Table 2, Fig. 2B). Conversely, a striking correlation between older age and decreased p-STAT5, and to a lesser extent p-STAT1 and p-STAT3 levels was observed in response to EPO in nRBC (Table 2). This correlation also held true when early erythroblasts and normoblasts, the subpopulations of nRBC in bone marrow that are known to be EPO responsive, were examined (Fig. 2C).
Table 2.
Figure 2. Effect of Donor Age on Bone Marrow sample Signaling Function.
A. Frequency and Function of CD34+ Cells Plots of age versus CD34+% (left panel), GCSF induced STAT signaling (middle) and GCSF induced PI3K pathway (right) in CD34+ cells from older patients (dark blue circles) and from younger patients (light blue circles) using the Uu metric are shown with R-squared (coefficient of determination) and p value. A cartoon of GCSF signaling identifies the phosphoproteins studied circled.
B. Frequency and Function of Myeloid Cells Plots of age versus Myeloid cell% (left panel), GCSF induced STAT signaling (middle, right) in myeloid cells from older patients (dark blue circles) and from younger patients (light blue circles) using the Uu metric. R-squared (coefficient of determination) and p value are shown. A cartoon of GCSF signaling identifies the phosphoproteins studied circled.
C. Frequency and Function of Erythroid Cells Plots of age versus nRBC% (left panel), EPO induced STAT signaling in early erythroblasts (middle) and normoblasts (right) from older patients (dark blue circles) and from younger patients (light blue circles) using the Uu metric (above) and Fold change metric (below). R-squared (coefficient of determination) and p value are shown.. A cartoon of EPO signaling identifies the phosphoproteins studied circled.
Based on these findings age-matched control BMMC samples (obtained from subjects >50 years of age) were used for evaluating signaling in LR MDS samples.
Low Risk MDS BMMC samples Versus Age-Matched Healthy BMMC samples
Block at different level in Erythroid Differentiation observed in RAEB and RARS MDS
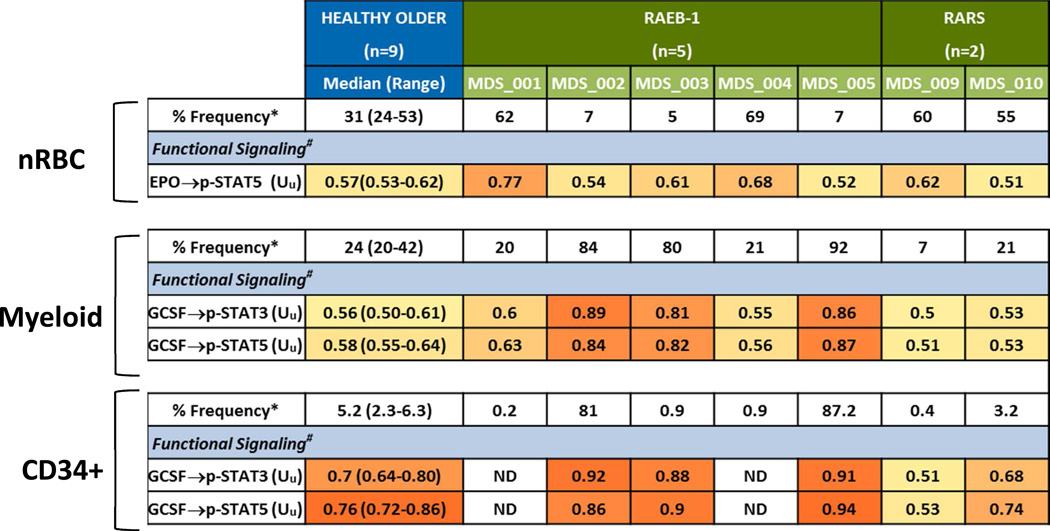
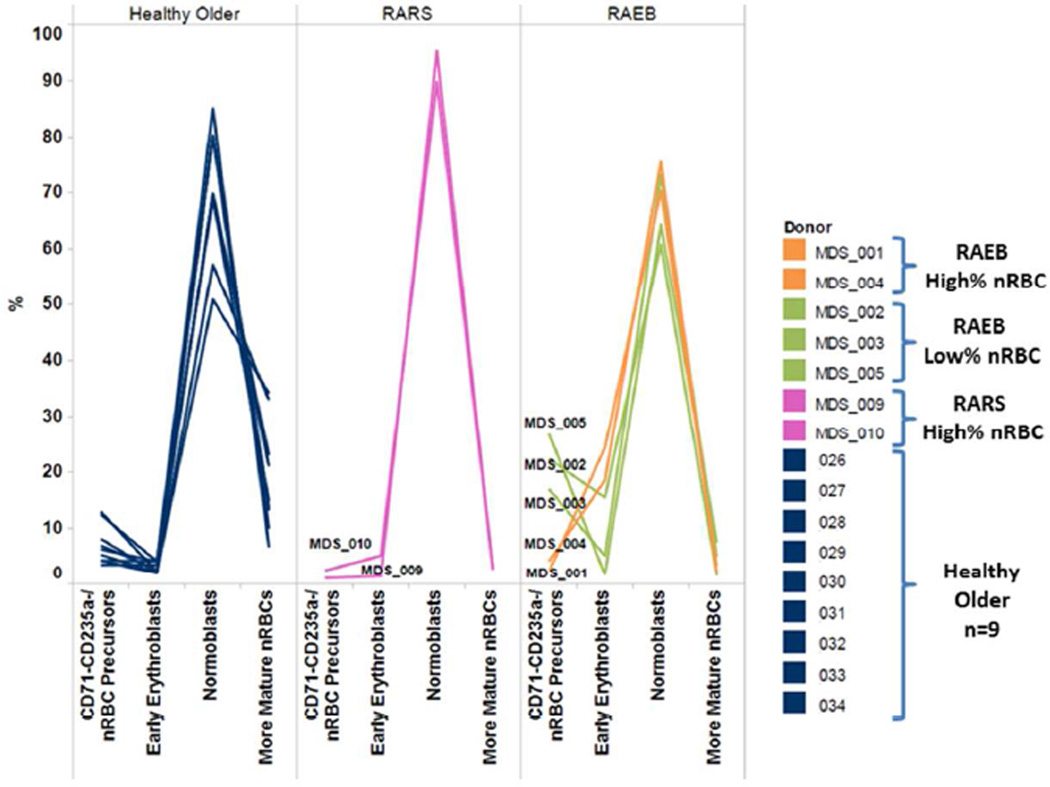
Healthy older donor samples had a median of 31% (range 24–53%) nRBC in BMMC post thaw (Table 3). Of the five BM samples from patients with a diagnosis of RAEB, two (patient 1 and patient 4) had a higher percentage and three (patient 2, patient 3, and patient 5) had a lower percentage of erythroid elements versus healthy age-matched controls (Table 3). In healthy control BMMC samples early erythroid cells (CD71+ CD235a−) comprised the minority of the nRBC subsets while normoblasts (CD71+ CD235a+) and more mature nRBC marrow (CD71− CD235a+) comprised the majority of the nRBC compartment. Conversely, 4 of 5 RAEB BMMC samples had a higher percentage of early erythroid cells and all had a lower percentage of mature nRBC versus healthy age-matched controls (Fig. 3). Of note, both RARS samples assayed in this study had a higher frequency of nRBC and a higher percentage of normoblasts versus either RAEB or healthy control samples (Fig. 3).
Table 3.
Figure 3. Block in Erythroid Differentiation in MDS samples.
Erythroid differentiation from nRBC precursor cells (CD71− CD235a−) to early erythroid cells (CD71+ CD235a−) to normoblasts (CD71+ CD235a+) to more mature nRBC (CD71− CD235a+) in healthy, RARS and RAEB samples.
Classification of RAEB samples based on nRBC and Myeloid Frequency and Function
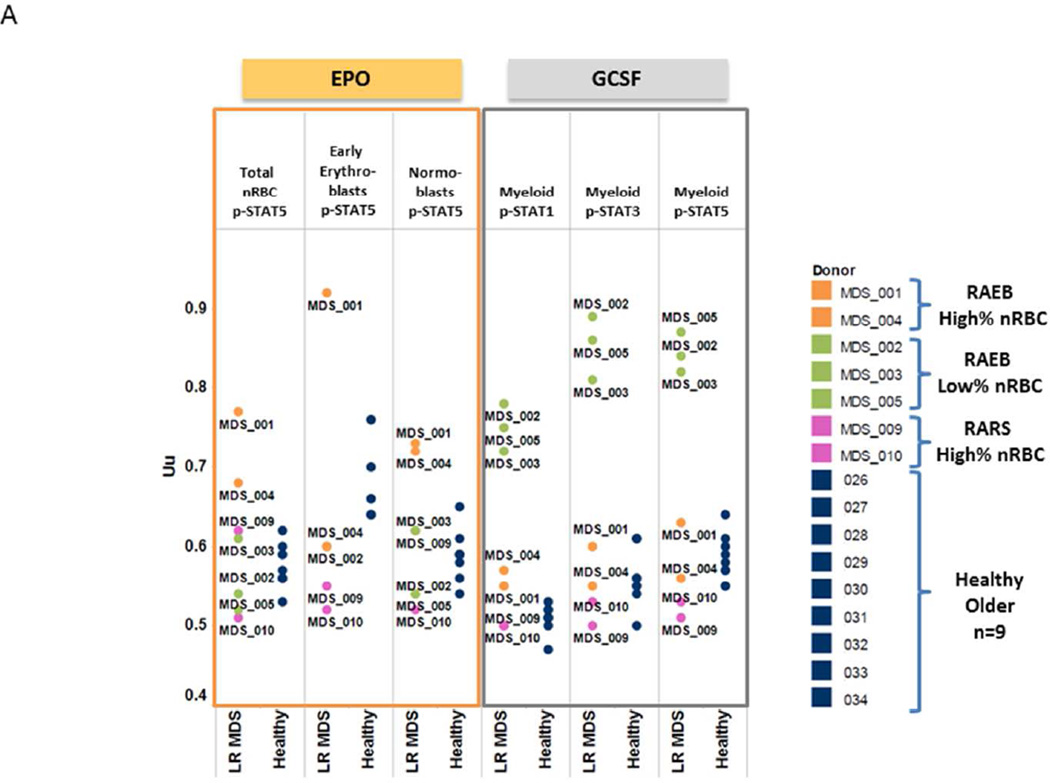
The functional signaling ability of RAEB nRBC and myeloid elements were examined by determining STAT phosphorylation in response to EPO or GCSF in RAEB BM cell subsets. In response to EPO, both RAEB samples with increased nRBC percentage showed an increased proportion of cells showing phosphorylation of STAT5 compared to healthy marrow (Uu = 0.77 and 0.68 versus a median of 0.57 for healthy control) (Table 3, Fig. 4A). Conversely, those with low nRBC frequency displayed EPO-mediated STAT5 phosphorylation responses comparable to age-matched healthy control samples (Table 3, Fig. 4A). These data held true when nRBC subsets (early erythroid and normoblasts) were examined (Fig. 4A).
Figure 4. Low Risk MDS BM samples versus Age-Matched Healthy BM samples.
A. Response of MDS BM samples to EPO or GCSF modulation Plots of EPO induced p-STAT5 levels in total nRBC, early erythroid and normoblasts (left) and GCSF induced p-STAT1, p-STAT3 and p-STAT5 levels in myeloid cells using the Uu metric (right).
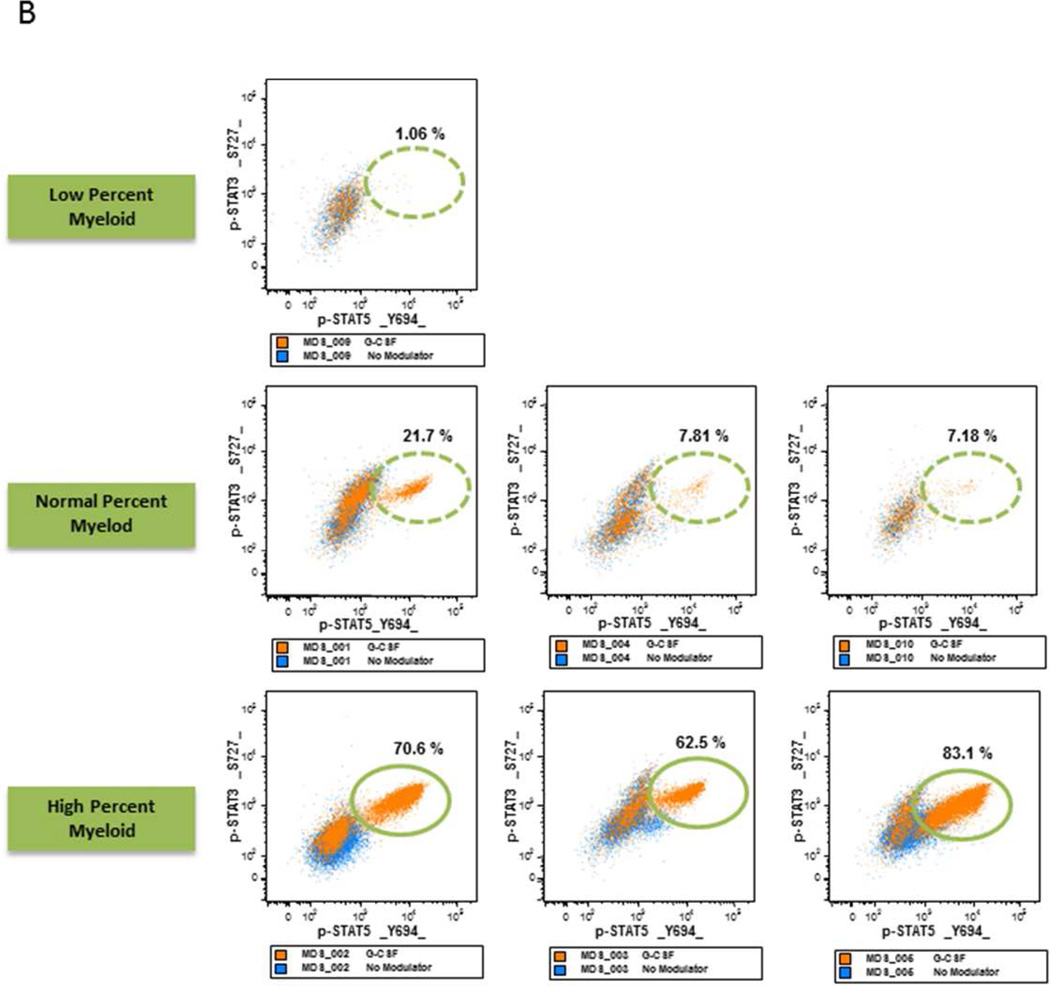
B. MDS Samples with Increase Myeloid Frequency have Increased STAT Activation Flow cytometry dot plots measuring p-STAT5 (X-axis) versus p-STAT3 (Y axis) in response to GCSF in MDS samples with a higher percentage of myeloid elements (lower panels), same percentage (middle panels) and a lower percentage of myeloid elements (upper panel) compared to healthy age-matched control myeloid samples.
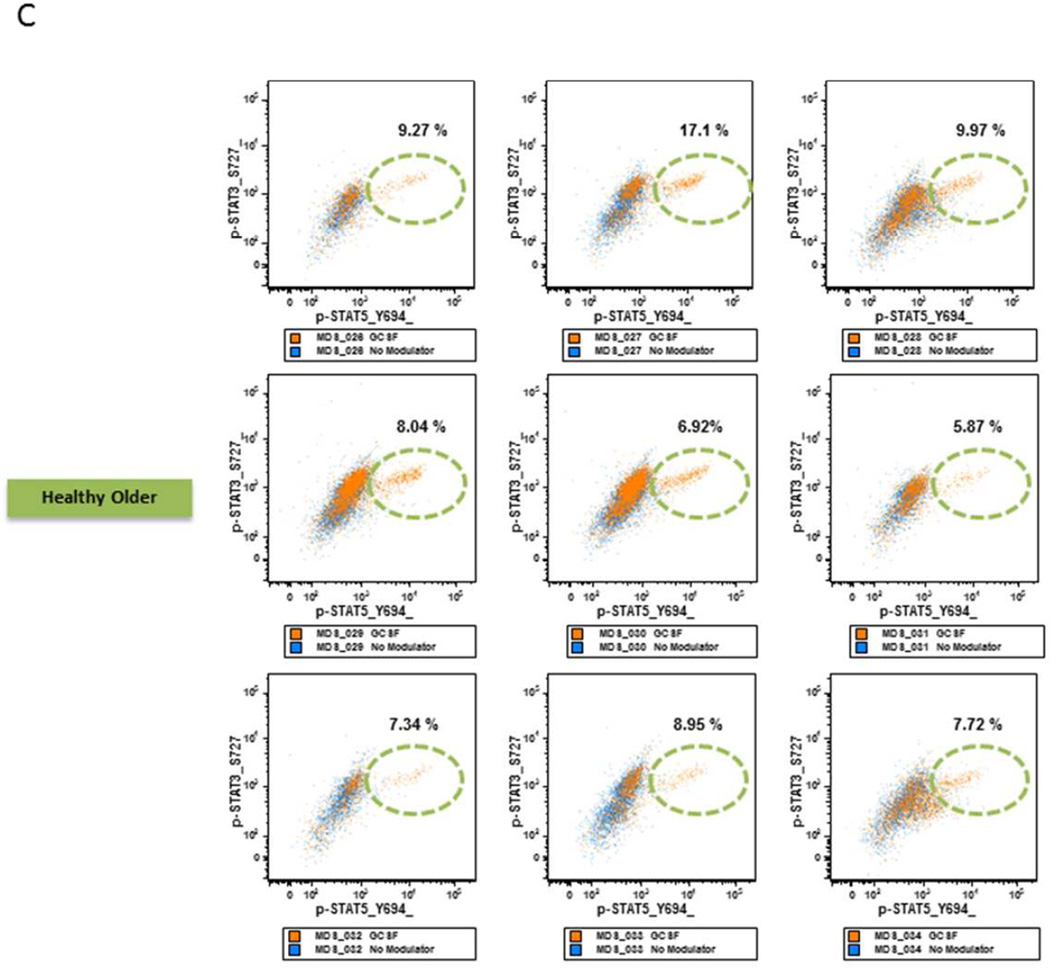
C. GCSF Modulated STAT Activation in Healthy Older BM Samples. Flow cytometry dot plots measuring p-STAT5 (X-axis) versus p-STAT3 (Y axis) in response to GCSF in healthy age-matched control myeloid samples.
RAEB BM with low nRBC frequency showed a higher percentage of myeloid elements compared to age-matched controls (Table 3). When these myeloid and CD34+ cells were examined for signaling function, they displayed an increased proportion of cells with robust STAT3 and STAT5 phosphorylation in response to GCSF (Table 3, Fig. 4A).
RARS with High Frequency of nRBC Demonstrate poor EPO signaling
Bone marrow samples from the two patients with RARS were examined for erythroid and myeloid cell frequency and signaling function. Both RARS samples (patient 9 and patient 10) had a higher percentage of nRBC (Table 3, Fig. 3) and a low to normal percentage of myeloid and CD34+ elements when compared to healthy older control BM samples (Table 3). Unlike RAEB samples with similar nRBC frequency (patient 1 and patient 4) that displayed a robust response in pSTAT5 versus control, RARS nRBC showed low to normal EPO signaling cells compared to age-matched control samples (Table 3, Fig. 4A). Furthermore both RARS samples showed low to normal percentage of GCSF- responding myeloid and CD34+ cells (Table 3, Fig. 4A).
MDS Samples with Increased Myeloid Frequency have increased STAT Activation in response to GCSF modulation
Of the seven LR MDS samples, three (patients 2, 3, and 5) showed a higher and one (patient 9) showed a lower percentage of myeloid elements versus age-matched healthy control samples. When examined for signaling response to GCSF, a higher proportion of cells in the former and lower in the latter showed STAT pathway activation compared to age-matched controls (Table 3, Fig. 4B). RAEB or RARS samples that showed a normal range of myeloid cells demonstrated an intermediate STAT5 phosphorylation versus those with either a higher or lower percentage of myeloid cells in response to GCSF, similar to those found in healthy older subjects (Fig. 4C).
Conclusion
Multiparameter flow cytometry is beginning to play an important role in the diagnosis of MDS and the potential for its application to the disease for individual risk assessment and therapeutic selection is greatly anticipated (10). In this study a flow cytometry-based SCNP assay was used to identify signaling differences related to physiologic (e.g. aging) and pathologic (e.g. MDS) conditions in bone marrow cell subpopulations without the need for physical cell subset separation. SCNP allows for simultaneous examination of the frequency and function of these distinct cell subsets, a unique characteristic compared to the use of either whole blood or sorted populations. Aging was found to be associated with a functional impairment in nRBC EPO response, while myeloid cells appeared to be unaffected in their signaling response to GCSF (STATs or PI3K pathway). In IPSS LR MDS patient samples signaling profiles were heterogeneous and SCNP revealed aberrant signaling versus age-matched controls, which could be used to identify patient subsets with different prognosis and response to treatment.
Since SCNP is a functional assay, standardization of pre-analytic variables is particularly critical for data interpretation. Analytic and postanalytic technical variables most likely to effect SCNP assay have recently been reviewed (27,28). In particular, preanalytic sample characteristics such as the time a sample is in cryopreservation, the time from blood or marrow collection to cryopreservation, and signaling comparison between paired fresh and cryopreserved samples are fundamental to any assay and are critical for data interpretation in functional assays. In AML the SCNP assay was demonstrated to have reproducibility and repeatability, and equivalence between PB and BM signaling was shown for >90% of signaling nodes (proteomic readout in the presence or absence of a specific modulator) examined. In addition, sample cryopreservation was shown to have minimal effects on functional readouts in SCNP assays with Bland Altman and Lin's Concordance methods showing good concordance in sample aliquots with up to 4 years in cryopreservation (29). Recently SCNP has been used to predict the likelihood of response to standard induction chemotherapy in both adult and pediatric patients with AML (7,8,30). These studies provided information that was distinct from known AML prognostic factors, including age, secondary AML, and molecular markers. SCNP is therefore ideally suited for analysis of pathways shown to be involved in disease pathology, and has many potential applications including the creation of a biology-based disease characterization informative of disease outcomes and treatment.
Several methodological considerations warrant discussion and need to be considered in interpreting these results. First, this study used cryopreserved samples from biorepositories rather than fresh samples, raising the question of extrapolability of results to fresh samples. In this regard, the use of sample “health” specifications for sample evaluability to minimize the effect of pre-analytic variables is crucial and, as mentioned above, previous studies have shown high correlation between SCNP readouts in paired fresh and cryopreserved aliquots of the same AML sample (27,29). Second, the limited sample size of MDS samples used in this pilot study makes the observations hypothesis-generating in nature thus requiring confirmation in larger cohort of LR MDS patients.
Despite these limitations, two major findings emerged from this study. First, our data show EPO hyporesponsiveness (as measured by p-STAT5 levels) in nRBC collected from older versus younger healthy donors. This decrease held true when nRBC subsets (normoblasts and early erythroblasts) were examined. Decreased EPO-induced signaling could be responsible, at least in part, for the high incidence of anemia in the elderly population (close to a third of elderly people are anemic) (3). This idiopathic anemia has been shown to occur despite normal levels of EPO and EPO receptor (14,15). In most elderly patients the presence of a decreased EPO signaling response may not manifest clinically, unless the patient is under physiologic stress (e.g. infection, hemorrhage, altitude).
In contrast, the response to GCSF in the myeloid subset was found to be independent of age. This is in line with animal studies that demonstrate constant levels of basal myelopoiesis in murine bone marrow independent of animal age (31). The in-vivo observation of equivalent total cell number, CFU-GM, and CD34+ between older and younger patients after GCSF-mediated stem cell mobilization further supports our observation (32). These data underscore the importance of using age-matched comparisons when evaluating differences between healthy and pathologic signaling in hematologic disorders (e.g. AML, MDS) and suggest that some age-related differences in hematopoiesis may be due to differences in signaling pathway activation. The difference in sample source between healthy older controls (BM obtained during orthopedic procedures) and younger donors (BM aspirates) represents a potential confounding factor for the age-related effects in cell signaling observed in the study. However, because SCNP assay allows for gating on specific populations (e.g. nRBC, CD34+ cells) and differential functional effects were observed in some but not other cell subsets in the same sample, it is likely that the age-related changes in cell signaling observed in the study are real biologic findings.
Recent studies using multiparameter flow cytometry have identified universal abnormal signal transduction in myeloid blasts from patients with AML versus cells from healthy normal bone marrow (33,34). Increased basal phosphoprotein expression, increased or decreased activation in response to cytokines and altered kinetics of response were identified. Due to limited cell numbers a single time-point (15 minutes) of activation was used in the current study to measure protein phosphorylation. We and others have identified this to be the optimal timepoint for detecting p-S6, STAT3 and STAT5 (9,33,34). While not an optimal time point for detecting peak p-Erk activation, in our study p-Erk signaling was still observed (Supplemental Figure S2).
Cell population frequency and signaling profiles could be used to distinguish LR MDS patients from healthy age-matched controls. We observed a block in erythroid differentiation in LR MDS BMMC compared to healthy age-matched controls, consistent with prior findings of ineffective erythropoiesis in MDS. Furthermore we show that in most RAEB samples the differentiation block occurred at the early erythroblast stage while RARS samples showed a differentiation block from normoblasts to mature nRBC. This suggests that RARS and RAEB are biologically distinct diseases with blocks in differentiation at different stages of RBC development.
Defects in MDS erythroid lineage (CD71+CD45−) p-STAT5 response to EPO have been observed and shown to correlate with in-vivo response to EPO therapy while there was no difference observed in CD34+ cell response to GCSF between MDS and healthy donors (16). We observed differences in both erythroid response to EPO and myeloid response to GCSF and noted differences based on MDS subtype (RARS versus RAEB).
In RAEB any of the three hematopoietic lineages (RBC, WBC or platelets) may be affected. In our study samples showing a higher frequency of nRBC also showed higher numbers of EPO responsive cells, suggesting a defect in erythroid lineage development. A robust response of myeloid elements to GCSF was observed in samples where there was an increased frequency of BM myeloid cells compared to control samples, suggesting a possible role for GCSF in the pathogenesis of MDS in these patients. This may put these patients at an increased risk for transformation to AML. In support of this hypothesis patient 2 and patient 5, who had elevated CD34+ frequency and increased GCSF induced STAT3 and STAT5 phosphorylation, suffered rapid (within 2 months of diagnosis) death in the first case and progressed to AML with central nervous system involvement in the second case, respectively.
RARS samples, while few in number, were more homogenous than RAEB samples. RARS samples had a high frequency of nRBC but, in contrast to RAEB, a low-normal proportion of EPO-responsive nRBC and a differentiation block from normoblasts to mature nRBC. Furthermore RARS samples did not appear to have alterations in their myeloid compartment.
Recently, mutations in SF3B1 have been shown to be associated with RARS in up to 80% of cases (35,36). Defects in SF3B1 are associated with aberrant RNA splicing that ultimately leads to ineffective hematopoiesis. A direct effect of mutations in SF3B1 on EPO signaling remains to be examined.
In RARS the generation of abnormal sideroblasts has been shown to be related to a malfunction of the mitochondrial respiratory chain (37). Such dysfunction leads to the accumulation of toxic ferric iron in the mitochondrial matrix and likely contributes to the high frequency of immature nRBC blocked in the late stage of differentiation that is observed in RARS.
Taken together, these data demonstrate the importance of using healthy age-matched controls to define disease-associated signaling and highlight the ability of SCNP to enhance MDS classification based upon functional biology. These data also lay the groundwork for the application of SCNP to identify patients at high risk of progression from MDS to AML. Future studies on larger cohorts will examine EPO and GCSF pathways in conjunction with other modulators, such as DNA damaging agents, to ultimately inform therapeutic choice by matching signaling networks to the clinical response of MDS to agents such as EPO/GCSF, Lenalidomide, or Azacytidine as well as to further define and characterize the biology of MDS.
Supplementary Material
Acknowledgments
We would like to thank Dr. Craig Ferrell at Williamson Medical Center for providing the normal elderly donor bone marrow samples for this study. We would like to thank Michelle Atallah for paper QC and administrative support. We thank Carol Marimpietri and Keith Shults for assistance in planning experiments. We thank the patients that provided samples for research use. AC Cohen, D Soper, YW Huang, and A Cesano are or were employees and stockholders of Nodality, Inc. at the time the research was conducted.
References
- 1.Ma X. Epidemiology of myelodysplastic syndromes. The American journal of medicine. 2012;125:S2–S5. doi: 10.1016/j.amjmed.2012.04.014. [DOI] [PMC free article] [PubMed] [Google Scholar]
- 2.Ershler WB, Sheng S, McKelvey J, Artz AS, Denduluri N, Tecson J, Taub DD, Brant LJ, Ferrucci L, Longo DL. Serum erythropoietin and aging: a longitudinal analysis. J Am Geriatr Soc. 2005;53:1360–1365. doi: 10.1111/j.1532-5415.2005.53416.x. [DOI] [PubMed] [Google Scholar]
- 3.Eisenstaedt R, Penninx BW, Woodman RC. Anemia in the elderly: current understanding and emerging concepts. Blood Rev. 2006;20:213–226. doi: 10.1016/j.blre.2005.12.002. [DOI] [PubMed] [Google Scholar]
- 4.Musso CG, Musso CA, Joseph H, De Miguel R, Rendo P, Gonzalez E, Algranati L, dos Ramos Farias E. Plasma erythropoietin levels in the oldest old. Int Urol Nephrol. 2004;36:259–262. doi: 10.1023/b:urol.0000034682.61762.ad. [DOI] [PubMed] [Google Scholar]
- 5.Puglisi F, Deroma L, Russo S, Carteni G, Sporchia A, Ucci G, De Signoribus G, Del Prete S, Vecchione A, Pinotti G, et al. Effect of age on hemoglobin levels and quality of life following treatment with epoetin alfa in cancer patients. Critical reviews in oncology/hematology. 2009;69:175–182. doi: 10.1016/j.critrevonc.2008.07.010. [DOI] [PubMed] [Google Scholar]
- 6.Chatta GS, Price TH, Allen RC, Dale DC. Effects of in vivo recombinant methionyl human granulocyte colony-stimulating factor on the neutrophil response and peripheral blood colony-forming cells in healthy young and elderly adult volunteers. Blood. 1994;84:2923–2929. [PubMed] [Google Scholar]
- 7.Lacayo N, Alonzo TA, Gayko U, Rosen DB, Westfall M, Purvis N, Putta S, Louie B, Hackett J, Cohen AC, et al. Development and Validation of a Single-Cell Network Profiling (SCNP) Assay-based Classifier to Predict Response to Induction Therapy in Pediatric Patients with de novo Acute Myeloid Leukemia (AML): A Report from the Children’s Oncology Group. British Journal of Haematology. 2013 doi: 10.1111/bjh.12370. [DOI] [PMC free article] [PubMed] [Google Scholar]
- 8.Kornblau SM, Minden MD, Rosen DB, Putta S, Cohen A, Covey T, Spellmeyer DC, Fantl WJ, Gayko U, Cesano A. Dynamic single-cell network profiles in acute myelogenous leukemia are associated with patient response to standard induction therapy. Clin Cancer Res. 2010;16:3721–3733. doi: 10.1158/1078-0432.CCR-10-0093. [DOI] [PMC free article] [PubMed] [Google Scholar]
- 9.Cesano A, Putta S, Rosen DB, Cohen AC, Gayko U, Mathi K, Woronicz J, Hawtin RE, Cripe L, Sun Z, et al. Functional pathway analysis using SCNP of FLT3 receptor pathway deregulation in AML provides prognostic information independent from mutational status. PLoS ONE. 2013;8:e56714. doi: 10.1371/journal.pone.0056714. [DOI] [PMC free article] [PubMed] [Google Scholar]
- 10.Porwit A. Role of flow cytometry in diagnostics of myelodysplastic syndromes--beyond the WHO 2008 classification. Seminars in diagnostic pathology. 2011;28:273–282. doi: 10.1053/j.semdp.2011.06.003. [DOI] [PubMed] [Google Scholar]
- 11.Vardiman J. The classification of MDS: from FAB to WHO and beyond. Leukemia Research. 2012;36:1453–1458. doi: 10.1016/j.leukres.2012.08.008. [DOI] [PubMed] [Google Scholar]
- 12.Corey SJ, Minden MD, Barber DL, Kantarjian H, Wang JC, Schimmer AD. Myelodysplastic syndromes: the complexity of stem-cell diseases. Nat Rev Cancer. 2007;7:118–129. doi: 10.1038/nrc2047. [DOI] [PubMed] [Google Scholar]
- 13.Mittelman M, Oster HS, Hoffman M, Neumann D. The lower risk MDS patient at risk of rapid progression. Leuk Res. 2010;34:1551–1555. doi: 10.1016/j.leukres.2010.05.023. [DOI] [PubMed] [Google Scholar]
- 14.Aul C, Arning M, Runde V, Schneider W. Serum erythropoietin concentrations in patients with myelodysplastic syndromes. Leuk Res. 1991;15:571–575. doi: 10.1016/0145-2126(91)90025-o. [DOI] [PubMed] [Google Scholar]
- 15.Backx B, Broeders L, Hoefsloot LH, Wognum B, Lowenberg B. Erythropoiesis in myelodysplastic syndrome: expression of receptors for erythropoietin and kit ligand. Leukemia. 1996;10:466–472. [PubMed] [Google Scholar]
- 16.Baines P, Bowen D, Jacobs A. Clonal growth of haemopoietic progenitor cells from myelodysplastic marrow in response to recombinant haemopoietins. Leuk Res. 1990;14:247–253. doi: 10.1016/0145-2126(90)90132-s. [DOI] [PubMed] [Google Scholar]
- 17.Hoefsloot LH, van Amelsvoort MP, Broeders LC, van der Plas DC, van Lom K, Hoogerbrugge H, Touw IP, Lowenberg B. Erythropoietin-induced activation of STAT5 is impaired in the myelodysplastic syndrome. Blood. 1997;89:1690–1700. [PubMed] [Google Scholar]
- 18.Park S, Grabar S, Kelaidi C, Beyne-Rauzy O, Picard F, Bardet V, Coiteux V, Leroux G, Lepelley P, Daniel MT, et al. Predictive factors of response and survival in myelodysplastic syndrome treated with erythropoietin and G-CSF: the GFM experience. Blood. 2008;111:574–582. doi: 10.1182/blood-2007-06-096370. [DOI] [PubMed] [Google Scholar]
- 19.Greenberg PL, Sun Z, Miller KB, Bennett JM, Tallman MS, Dewald G, Paietta E, van der Jagt R, Houston J, Thomas ML, et al. Treatment of myelodysplastic syndrome patients with erythropoietin with or without granulocyte colony-stimulating factor: results of a prospective randomized phase 3 trial by the Eastern Cooperative Oncology Group (E1996) Blood. 2009;114:2393–2400. doi: 10.1182/blood-2009-03-211797. [DOI] [PMC free article] [PubMed] [Google Scholar]
- 20.Spinelli E, Caporale R, Buchi F, Masala E, Gozzini A, Sanna A, Sassolini F, Valencia A, Bosi A, Santini V. Distinct signal transduction abnormalities and erythropoietin response in bone marrow hematopoietic cell subpopulations of myelodysplastic syndrome patients. Clin Cancer Res. 2012;18:3079–3089. doi: 10.1158/1078-0432.CCR-11-0686. [DOI] [PubMed] [Google Scholar]
- 21.Frisan E, Pawlikowska P, Pierre-Eugene C, Viallon V, Gibault L, Park S, Mayeux P, Dreyfus F, Porteu F, Fontenay M. p-ERK1/2 is a predictive factor of response to erythropoiesis-stimulating agents in low/int-1 myelodysplastic syndromes. Haematologica. 2010;95:1964–1968. doi: 10.3324/haematol.2010.024349. [DOI] [PMC free article] [PubMed] [Google Scholar]
- 22.Kornblau SM, Minden MD, Rosen DB, Putta S, Cohen A, Covey T, Spellmeyer DC, Fantl WJ, Gayko U, Cesano A. Dynamic single-cell network profiles in acute myelogenous leukemia are associated with patient response to standard induction therapy. Clinical cancer research : an official journal of the American Association for Cancer Research. 2010;16:3721–3733. doi: 10.1158/1078-0432.CCR-10-0093. [DOI] [PMC free article] [PubMed] [Google Scholar]
- 23.Irish JM, Hovland R, Krutzik PO, Perez OD, Bruserud O, Gjertsen BT, Nolan GP. Single cell profiling of potentiated phospho-protein networks in cancer cells. Cell. 2004;118:217–228. doi: 10.1016/j.cell.2004.06.028. [DOI] [PubMed] [Google Scholar]
- 24.Shults KE, Miller DT, Davis BH, Flye L, Hobbs LA, Stelzer GT. A standardized ZAP-70 assay--lessons learned in the trenches. Cytometry B Clin Cytom. 2006;70:276–283. doi: 10.1002/cyto.b.20136. [DOI] [PubMed] [Google Scholar]
- 25.Purvis N, Stelzer G. Multi-platform, multi-site instrumentation and reagent standardization. Cytometry. 1998;33:156–165. [PubMed] [Google Scholar]
- 26.Wang L, Gaigalas AK, Marti G, Abbasi F, Hoffman RA. Toward quantitative fluorescence measurements with multicolor flow cytometry. Cytometry A. 2008;73:279–288. doi: 10.1002/cyto.a.20507. [DOI] [PubMed] [Google Scholar]
- 27.Cesano A, Rosen DB, O’Meara P, Putta S, Gayko U, Spellmeyer DC, Cripe LD, Sun Z, Uno H, Litzow MR, et al. Functional pathway analysis in acute myeloid leukemia using Single Cell Network Profiling (SCNP) assay: effect of specimen source (bone marrow or peripheral blood) on assay readouts. Cytometry Part B. 2012;82:158–172. doi: 10.1002/cyto.b.21007. [DOI] [PMC free article] [PubMed] [Google Scholar]
- 28.Covey TM, Cesano A. Modulated multiparametric phosphoflow cytometry in hematological malignancies: technology and clinical applications. Best Pract Res Clin Haematol. 2010;23:319–331. doi: 10.1016/j.beha.2010.07.002. [DOI] [PubMed] [Google Scholar]
- 29.Cesano A, Gotlib JR, Lacayo NJ, Putta S, Lackey A, Gayko U, Kornblau SM. Sample Cryopreservation Does Not Affect Functional Read Outs In SCNP Assays: Implications for Biomarker Development. Blood (ASH Annual Meeting Abstracts) 2010;116:4843. [Google Scholar]
- 30.Cesano A, Willman CL, Kopecky KJ, Gayko U, Putta S, Louie B, Westfall M, Purvis N, Spellmeyer D, Marimpietri C, et al. Single cell network profiling (SCNP)-based classifier to predict response to induction therapy in elderly patients with acute myeloid leukemia (AML): Validation in two independent sample sets from ECOG and SWOG trials. Blood (ASH Annual Meeting Abstracts) 2012;120 [Google Scholar]
- 31.Williams LH, Udupa KB, Lipshitz DA. Evaluation of the effect of age on hematopoiesis in the C57BL/6 mouse. Exp Hematol. 1986;14:827–832. [PubMed] [Google Scholar]
- 32.Berkahn L, Keating A. Hematopoiesis in the elderly. Hematology. 2004;9:159–163. doi: 10.1080/10245330410001701468. [DOI] [PubMed] [Google Scholar]
- 33.Marvin J, Swaminathan S, Kraker G, Chadburn A, Jacobberger J, Goolsby C. Normal bone marrow signal-transduction profiles: a requisite for enhanced detection of signaling dysregulations in AML. Blood. 2011;117:e120–e130. doi: 10.1182/blood-2010-10-316026. [DOI] [PMC free article] [PubMed] [Google Scholar]
- 34.Woost PG, Solchaga LA, Meyerson HJ, Shankey TV, Goolsby CL, Jacobberger JW. High-resolution kinetics of cytokine signaling in human CD34/CD117-positive cells in unfractionated bone marrow. Blood. 2011;117:e131–e141. doi: 10.1182/blood-2010-10-316224. [DOI] [PMC free article] [PubMed] [Google Scholar]
- 35.Visconte V, Makishima H, Jankowska A, Szpurka H, Traina F, Jerez A, O'Keefe C, Rogers HJ, Sekeres MA, Maciejewski JP, et al. SF3B1, a splicing factor is frequently mutated in refractory anemia with ring sideroblasts. Leukemia. 2012;26:542–545. doi: 10.1038/leu.2011.232. [DOI] [PubMed] [Google Scholar]
- 36.Damm F, Thol F, Kosmider O, Kade S, Loffeld P, Dreyfus F, Stamatoullas-Bastard A, Tanguy-Schmidt A, Beyne-Rauzy O, de Botton S, et al. SF3B1 mutations in myelodysplastic syndromes: clinical associations and prognostic implications. Leukemia. 2011 doi: 10.1038/leu.2011.321. [DOI] [PubMed] [Google Scholar]
- 37.Tehranchi R, Fadeel B, Forsblom AM, Christensson B, Samuelsson J, Zhivotovsky B, Hellstrom-Lindberg E. Granulocyte colony-stimulating factor inhibits spontaneous cytochrome c release and mitochondria-dependent apoptosis of myelodysplastic syndrome hematopoietic progenitors. Blood. 2003;101:1080–1086. doi: 10.1182/blood-2002-06-1774. [DOI] [PubMed] [Google Scholar]
Associated Data
This section collects any data citations, data availability statements, or supplementary materials included in this article.


