

Abstract
Experimental determination of the free energy stabilizing the structure of membrane proteins in their native lipid environment is undermined by a lack of appropriate methods and suitable model systems. Here, we demonstrate how fluorescence correlation spectroscopy can be used to characterize thermodynamics of pH-triggered bilayer insertion of nonconstitutive membrane proteins (e.g., bacterial toxins, colicins). The experimental design is guided by the appropriate thermodynamic scheme which considers two independent processes: pH-dependent formation of a membrane-competent form and its insertion into the lipid bilayer. Measurements of a model protein annexin B12 under conditions of lipid saturation demonstrate that protonation leading to the formation of the membrane-competent state occurs near membrane interface. Lipid titration experiments demonstrate that the free energy of transfer to the intermediate interfacial state is especially favorable, while the free energy of final insertion is modulated by interplay of hydrophobic and electrostatic interactions on the bilayer interface. The general principles of kinetic measurements along the insertion pathway containing interfacial intermediate are discussed and practical examples emphasizing appropriate fitting and normalization procedures are presented.
1. Introduction: Co-Translational Versus Post-Translational Membrane Protein Insertion
Folding and stability of membrane proteins remains one of the most elusive problems in physical biochemistry. Generally, membrane protein folding and bilayer insertion is managed by complex multiprotein translocon complexes (Alder and Johnson, 2004; Johnson and van Waes, 1999; Rapoport et al., 2004). For nonconstitutive proteins (e.g., bacterial toxins (Collier and Young, 2003; Miller et al., 1999; Oh et al., 1999; Senzel et al., 2000; Shatursky et al., 1999) and colicins (Parker et al., 1990; Tory and Merrill, 1999; Zakharov et al., 1999)), however, such insertion is achieved spontaneously, in response to changes in environment. For example, acidification of the endosome causes conformational change in endocytosed diphtheria toxin T-domain, resulting in its insertion into the membrane and translocation of its own N-terminus with the attached catalytic domain into the cytoplasm, possibly through a pore in the lipid bilayer (Oh et al., 1999). Neither translocon-assisted nor spontaneous membrane insertion of proteins is well understood on a molecular level. Despite the obvious structural and mechanistic differences between the two, recent thermodynamic evidence indicates that the underlying physicochemical principles for these processes are likely to be the same (Bowie, 2005; Hessa et al., 2005; White and von Heijne, 2005). Thus, deciphering these principles with the help of spontaneously inserting proteins is relevant to the larger problems of membrane protein folding and stability. The situation with membrane proteins is not too different from that of water-soluble proteins, which also can have assisted and spontaneous folding. Although it is likely that most proteins in the cell require molecular chaperones for efficient folding, the main thermodynamic principles that govern folding of soluble proteins were established from thorough studies of spontaneously folding proteins. Similarly, spontaneous insertion of nonconstitutive proteins can yield important insights into the much broader problem of membrane protein folding and stability, critical for predicting structure from sequence. Here, we present an overview of experimental approaches which utilize fluorescence spectroscopy to characterize kinetics and thermodynamics of pH-triggered insertion of membrane proteins into lipid bilayers.
2. Challenges of Thermodynamic Analysis of Membrane Protein Folding/Insertion
2.1. Lack of additivity of electrostatic and hydrophobic interactions on membrane interfaces
Since most biological membrane are negatively charged, it is important to understand how electrostatic and hydrophobic interactions add up in the interfacial region. While hydrophobic (Fernandez-Vidal et al., 2007; Wimley and White, 1996) and electrostatic (Murray et al., 1997) interactions between peptides lipid bilayers are reasonably well understood separately, their relative interplay in macromolecules with both charged and hydrophobic segments has not received the attention it deserves, and it is often assumed that the two components of the free energy are additive, although without any substantial evidence. Several studies on various systems, including antimicrobial peptides (Ladokhin and White, 2001) and ion-channel blockers (Posokhov et al., 2007), demonstrate the general lack of additivity of free energy components originating from these interactions. Although an empirical rule has been derived from these results allowing the prediction of the free energy of membrane interactions of hydrophobic peptides and segments of proteins with mixed anionic/zwitterionic membranes (Ladokhin and White, 2001), the nature of this phenomenon or the general applicability of such a rule are not clear. The balance of electrostatic and hydrophobic interactions affects membrane insertion of many membrane-active peptides and proteins (Bradshaw, 2000; Heller et al., 1998; Poklar et al., 1999; Wieprecht et al., 2000), most strikingly colicin E1(Zakharov et al., 1996). The latter study presents convincing evidence for an optimal anionic lipid concentration (which is close to physiological values) for channel formation by colicin E1.
2.2. Experimental exploration of transmembrane insertion
Direct experimental exploration of the folding and stability of membrane proteins has been hindered by their insolubility. But because membrane proteins are equilibrium structures, their folding and stability can be examined by studying various aspects of the membrane interactions of peptides and constructing thermodynamic pathways, involving partitioning of unfolded chain, interfacial folding, transbilayer insertion, and association of TM helices. These pathways are not intended to depict the actual biological assembly process, but rather to provide a thermodynamic context within which assembly of membrane protein must proceed. A detailed and in-depth description of these approaches can be found in reviews of White and coworkers (White et al., 1998, 2001).
While various model peptides were extremely useful experimental models for studying interfacial binding and folding (Fernandez-Vidal et al., 2007; Hristova and White, 2005; Ladokhin and White, 1999, 2001; Wimley and White, 1996; Wimley et al., 1998), deciphering the energetics of transbilayer insertion turned out to be much more elusive. A systematic study of membrane interactions of a designed peptide TMX-3 (Ladokhin and White, 2004) demonstrated that the interfacial folded state is the most thermodynamically stable state for a self-inserting peptide. This trend cannot be reversed by an increase in sequence hydrophobicity, since the latter results in peptide precipitation in solution (rendering thermodynamic analysis impossible) prior to any noticeable increase in insertion. To circumvent this limitation one has to switch from peptides to more complex protein systems to study the energetics of membrane insertion such as annexin B12 and diphtheria toxin T-domain. Both of these proteins undergo a reversible pH-dependent membrane insertion (Ladokhin and Haigler, 2005; Ladokhin et al., 2004) which makes them attractive models for thermodynamic and kinetic studies using fluorescence correlation spectroscopy (FCS) and other spectroscopic approaches (Ladokhin et al., 2002; Posokhov et al., 2008a,b).
3. FCS and Protein–Membrane Interactions
FCS measures intensity fluctuations of a small number of fluorescent molecules diffusing through a small focal volume. Due to recent technical developments, FCS is gaining popularity in biological studies (Haustein and Schwille, 2003; Hess et al., 2002; Schwille et al., 1999). Several groups have utilized it to study interfacial binding and transmembrane insertion of peptides and proteins (Posokhov et al., 2008a,b; Rhoades et al., 2006; Rusu et al., 2004). Rusu et al. (2004) compared FCS results to those available from other measurements and found them to be in excellent agreement, opening the doors for quantitative application of FCS to membrane protein binding.
3.1. FCS experiment
The description of FCS experimental setup, calibration, data collection and multiple biological applications can be found in these reviews (Chen et al., 2008; Garcia-Saez and Schwille, 2008; Haustein and Schwille, 2004, 2007). Here, we present several aspects of FCS measurements specific to thermodynamic studies of protein–membrane interactions. Our experiments were conducted using commercially available instrumentation utilizing confocal microscopy technology (e.g., MicroTime 200 from PicoQuant, Berlin, Germany or Alba FCS workstation from ISS, Champaign, IL) as described in detail before (Posokhov et al., 2008a). For a model membrane system we highly recommend the use of large unilamellar vesicles (LUV) with a diameter of ~0.1 μm, which can be prepared by extrusion (Mayer et al., 1986). The use of the smaller sonicated vesicles (SUV) should be avoided, as they are metastable and known to produce anomalous binding (Greenhut et al., 1986; Ladokhin et al., 2000; Seelig and Ganz, 1991), due perhaps to distorted lipid packing associated with high surface curvature. Protein should be labeled with a relatively bright and photostable fluorophore (Alexa series of dyes from Invitrogen, Carlsbad, CA is a popular choice) at a unique position. Normally we used single cysteine mutants (ANXQ4C or DTT N235C) labeled either with Alexa488 or Alexa647 meleimide. The labeling site is chosen so as not to interfere with membrane interactions. The samples typically contained 0.5–6 nM of dye-labeled protein, which falls on the linear range for FCS concentration measurements, determined to be 6 × 10⁻⁸–5 × 10⁻¹¹ M for ANX-Alexa647 and 10−7–4 × 10⁻¹⁰ M for ANX-Alexa488.
3.2. FCS data analysis
The autocorrelation function for single diffusing species can be described with the following equation (Hess et al., 2002):
| (2.1) |
where N is the average number of the fluorescent molecules in the focus volume and τD is the correlation time of the particles. The correlation time represents the diffusion time through the focus volume and equals τD = ω2/4D, where ω2 is the square of the radius of the laser focus and D is the diffusion constant. S is the ratio of the distances from the center of the laser beam focus in the radial and axial directions, respectively. T is the fraction of fluorophores in the triplet state and τP is the phosphorescence lifetime. Because τP is normally several orders of magnitude shorter than the diffusion time of biological macromolecules, the phosphorescence term does not interfere with the determination of protein interactions with membranes and is ignored in our subsequent discussion.
The measured correlation function G(τ) of a multicomponent system is a weighted sum of the autocorrelation functions of each component gi(τ) with amplitudes Ai (Clamme et al., 2003):
| (2.2) |
where Ni is the mean particle number and qi is the ratio of the fluorescence yield of the ith component to that of the first component. For thermodynamic studies of membrane binding only two diffusing species need to be considered: the fluorescently labeled proteins (index P) and bilayer vesicles with bound fluorescently labeled proteins (index V):
| (2.3) |
In our studies of membrane binding we have labeled membrane-inserting proteins ANX (Posokhov et al., 2008a) and diphtheria toxin T-domain (Posokhov et al., 2008b) with Alexa fluorophores which are rather convenient, as their quantum yield is normally insensitive to the changes in environment so that qi = 1 (at least for the systems we have measured so far). Although not crucial, this further simplifies quantitative analysis as the amplitudes in Eq. (2.3) will now depend only on the numbers of fast and slow moving particles in the focal volume (NP and NV, respectively):
| (2.4) |
3.3. Determination of membrane partitioning from FCS data
The goal of these binding studies is to determine the fraction of the protein associated with the membrane: fB = [P]bound/[P]total. There are two principal ways of extracting quantitative information on membrane binding from the FCS data (Eqs. (2.5) and (2.6)), both of which start with the fitting of the data collected in a sample containing free and vesicle-bound protein with Eq. (2.3). Information on the fraction of free and bound ANXcan be extracted from the values of weighting factors, depending on certain assumptions.
3.3.1. Infinite dilution regime and FCS measurements at lipid saturation
The infinite dilution regime refers to the conditions of an overwhelming molar excess of lipid over protein (~106) so that each vesicle contains no more than a single bound protein. It also requires that the protein be the monomer, or, at least, that the number of subunits in the oligomer is known. In this case, the number of particles associated with the slow mobility will be equal to the number of vesicle-bound protein molecules and the fraction of bound protein will be defined by the following expression (Clamme et al., 2003; Posokhov et al., 2008a):
| (2.5) |
Because of the extremely high sensitivity of the FCS experiment, reliable data can be obtained using subnanomolar concentrations of protein, suggesting that the infinite dilution regime can be achieved using a millimolar range of lipid concentrations. The main advantage of this approach is that a single autocorrelation curve, measured at a particular lipid concentration, contains all the information needed to calculate free and bound protein fractions. The example of such an experiment presented in Fig. 2.1 reveals a progressive shift of the autocorrelation curve upon lowering the pH, consistent with progressive binding of ANX to vesicles. The diffusion time measured at pH 7.2 coincided with that of ANX in the absence of vesicles, while one measured at pH4.6 coincided with that of a labeled vesicle. Thus, the limiting curves in Fig. 2.1 can be assigned to a totally free and totally membrane-bound ANX. This assignment allowed us to determine the fractions of free and bound protein at intermediate pH using the global (or linked) analysis approach (Knutson et al., 1983). Specifically, the diffusion times for free and bound ANX were linked for all four curves, while the fractions of free and bound ANX for the two middle curves were allowed to float. The resulting global fit (solid curves) is rather good and provides accurate determination of the bound fractions. Note that the samples are not required to have exactly the same protein concentration and the fractions of free and bound protein can be calculated from the normalized autocorrelation curves.
Figure 2.1.
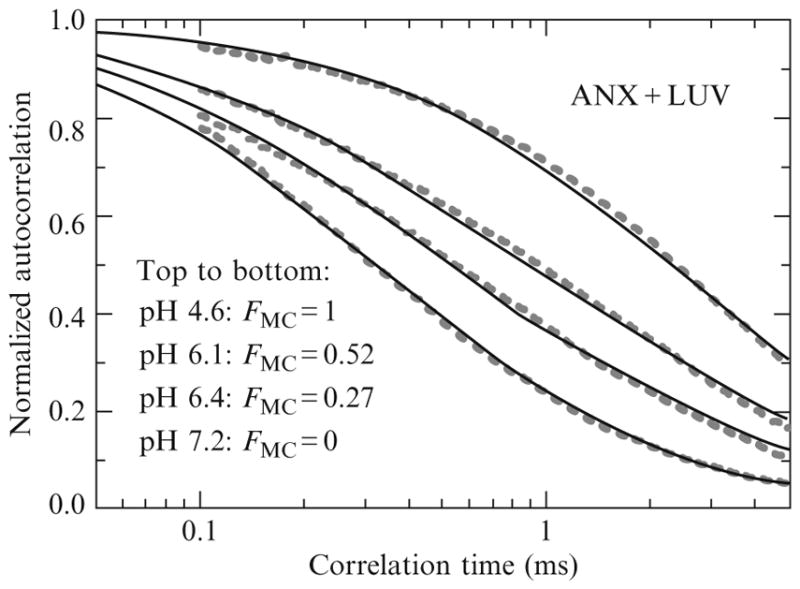
Example of binding measurement using FCS performed under conditions of the “infinite dilution regime” satisfied at extremely high lipid excess over fluorescently labeled protein (~106). Acidification results in a progressive shift of mobility due to a six fold increase of the correlation time resulting from binding of labeled ANX to the vesicles. Quantitative determination of partitioning is achieved by a global analysis (solid lines) of fluorescence autocorrelation curves (dashed lines) that links the two correlation times for all curves and allows free fitting of the preexponential amplitudes (see Eq. (2.3)). All data are normalized to the same number of fluorescent particles in the focal volume for better visual representation (Note that the absolute values of amplitudes are not important under these conditions, but only their relative contributions (Eq. (2.5)). Reproduced from Posokhov et al. (2008a) with permission.
3.3.2. Lipid titration FCS measurements
If the desired experimental conditions do not satisfy the requirements of the infinite dilution regime, the fraction of bound protein can still be calculated from the FCS experiment, in this case by comparing measurements in the presence and in the absence of vesicles. The autocorrelation collected in the presence of LUV is used to determine the amplitude, associated with the free protein (AP) by fitting the data with Eq. (2.3). The autocorrelation for the sample containing the same amount of protein, but noLUV, will be fitted with Eq. (2.1) to determine the total number of proteins/peptides in the focal volume (N). The fraction of the bound protein will be equal (Rusu et al., 2004):
| (2.6) |
An example of such an analysis to membrane interactions of ANX (Posokhov et al., 2008a) is presented in Fig. 2.2: symbols are experimental autocorrelation curves and the solid lines are fitting results with Eq. (2.3) (or Eq. (2.1) in case of no LUV sample). Addition of increasing concentrations of LUV results in progressive membrane binding and reduction in concentration of free ANX. This leads to an overall reduction in the number of fluorescent particles, since under these conditions a single vesicle caries more than a single labeled protein. The average number of particles in the focal volume is inversely proportional to the autocorrelation amplitude. Therefore, the amplitude is expected to increase with increasing lipid concentration, which is indeed observed (Fig. 2.2). The quantitative analysis of binding is based on fitting individual curves to a two-component autocorrelation function Eq. (2.3) (solid lines), and extracting the fractions of bound ANX by comparing relative amplitudes in the presence and absence of LUV (Eq. (2.6)).
Figure 2.2.
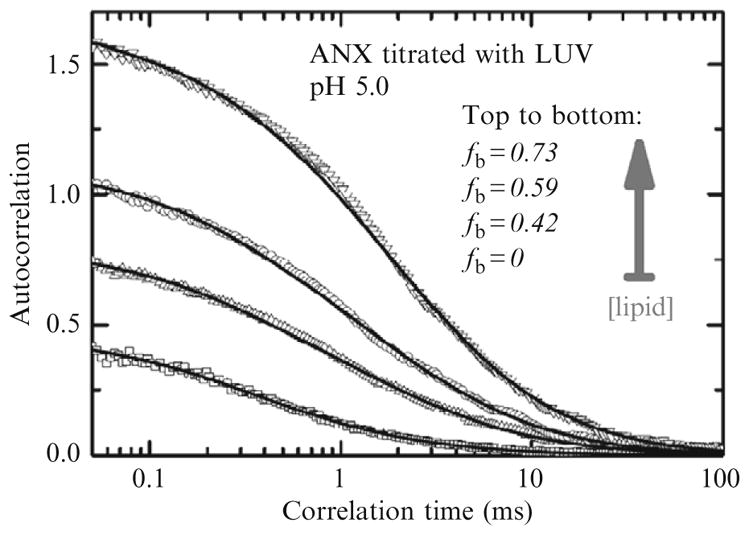
Example of lipid titration measurement using FCS performed outside of the “infinite dilution regime.” Correlation curves (symbols) were measured for samples containing 1 nM ANX and no LUV or LUV with 1, 2, and 4 μM of total lipid LUV (bottom-to-top). Progressive vesicle binding of fluorescently labeled ANX results in a reduction of the number of fluorescent particles in the focal volume and a corresponding increase in total autocorrelation amplitude. Solid curves correspond to fit with Eq. (2.3) (or Eq. (2.1), for sample containing no LUV). The fractions of bound ANX fb are calculated by comparing absolute amplitudes in the presence and absence of LUV (Eq. (2.6)). Reproduced from Posokhov et al. (2008a) with permission.
Although the lipid titration approach based on Eq. (2.6) is more general than the analysis allowed under the conditions of infinite dilution regime (Eq. (2.5)), it is not without drawbacks. First of all, since it relies on comparison of amplitudes in two protein samples, one in the absence and one in the presence of LUV, it is essential that the samples have exactly the same concentration of the protein. This is not a trivial task to accomplish, as membrane samples are notorious for variances in protein concentration due to precipitation and absorption to the surfaces. Another limitation of this approach is an increasing uncertainty at saturation of binding, as the fraction of the free protein is reduced drastically, and, as a result, the autocorrelation amplitudes do not change appreciably. The obvious limitation of the alternative approach based on Eq. (2.5) lies in the stringent requirements of the infinite dilution regime, which makes measurements extremely difficult when lipid concentration is below 50 μM. Nevertheless, we have demonstrated that both approaches are in excellent agreement when comparable conditions are used (Posokhov et al., 2008a).
4. Thermodynamic Schemes for Analysis of Membrane Partitioning
The general definitions of thermodynamic parameters, such as the mole-fraction partitioning coefficient and the free energy of transfer, as well as an overview of the principles and methods used for determining the energetics of the partitioning of peptides into bilayer membranes are discussed in detail by White and coworkers (White et al., 1998). In this section, we present the extension of the ideas developed in thermodynamic studies of peptides and demonstrate their application to more complex and challenging systems, such as nonconstitutive membrane proteins (e.g., bacterial toxins, colicins, and annexins). One of the main distinctions of proteins, as compared to peptides, is that they seldom follow a simple partitioning mode and the description of their membrane interactions requires a more complex thermodynamic scheme, which accounts for the existence of membrane-competent and membrane-incompetent protein conformations. In Section 4.1, we use the example of pH-dependent membrane insertion of ANX to illustrate this type of analysis.
4.1. Free energy of pH-triggered membrane protein insertion
The thermodynamic scheme describing acid-induced membrane interactions of such proteins as ANX or diphtheria toxin T-domain considers two independent processes (Fig. 2.3): pH-dependent formation of a membrane-competent form and its interaction with the lipid bilayer. (We would like to point out that FCS measurements as described here are not designed to distinguish the interfacially bound (Fig. 2.7, I-state) and transmembrane-inserted (T-state) protein conformations. This can be done, however, using other fluorescence techniques, such as steady-state and lifetime quenching topology methods (Ladokhin et al., 2002; Posokhov and Ladokhin, 2006).) By combining these topology measurements with FCS-measured changes in autocorrelation during lipid titration, one can determine the free energy ΔG of both transmembrane insertion and interfacial penetration (Posokhov et al., 2008a).
Figure 2.3.

Thermodynamic scheme employed in the analysis of the energetics of pH-triggered membrane interactions of proteins (Posokhov et al., 2008a), such as Annexin B12 and diphtheria toxin T-domain. Environment acidification leads to the formation of a membrane-competent form (horizontal arrows), which interacts with the lipid bilayer (vertical arrows). Each of the two processes is characterized by an independent equilibrium parameter: pH-dependent fraction of the membrane-competent form (FMC) and the free energy of membrane partitioning of this form (ΔG). Both parameters, FMC and ΔG, can be experimentally determined via FCS methodology using the principal equations presented in the lower panel, as described in the text. Note that a transmembrane T-state and an interfacial I-state are distinguished in a separate membrane topology experiment as described in these publications (Ladokhin et al., 2002; Posokhov and Ladokhin, 2006; Posokhov et al., 2008a).
Figure 2.7.

pH-triggered membrane insertion pathway of ANX, consisting of a water-soluble W-state, final transmembrane T-state, interfacial intermediate I-state, and aggregated A-state. The initial binding and unfolding (W-to-I transition) occurs very fast (Ladokhin et al., 2002), while the final insertion (I-to-T transition), resulting in translocation of several helical hairpins (Posokhov et al., 2008a), may take somewhere from minutes to hours, depending on the lipid composition (see also Fig. 2.6 for an example of kinetic experiment). Excess of anionic lipids will stabilize the insertion intermediate (Ladokhin et al., 2002; Posokhov et al., 2008a), which at high concentrations is prone to aggregation on the timescale of tens of minutes (Ladokhin, 2008). The main gain in free energy occurs upon interfacial penetration (~−9 ÷ −12 kcal/mol), while the free energy of final insertion is modulated by an interplay of hydrophobic and electrostatic interactions in a rather narrow free energy range (−2 ÷ +2 kcal/mol) (Posokhov et al., 2008a).
First, the fraction of bound protein (in this case ANX) as a function of lipid concentration is estimated depending on experimental conditions discussed above using either Eq. (2.5) or (2.6). The resulting titration isotherm (Fig. 2.4) is fitted to a mole-fraction partitioning equation (Ladokhin et al., 2000; White et al., 1998), modified to account for the presence of membrane-incompetent protein species (Posokhov et al., 2008a):
| (2.7) |
where FMC is a fraction of membrane-competent ANX (determined at lipid saturation), [L] is lipid concentration, [W] is water concentration (55.3 M), and Kx is mole-fraction partitioning coefficient which is used to determine the free energy of binding ΔG = −RT ln Kx.
Figure 2.4.
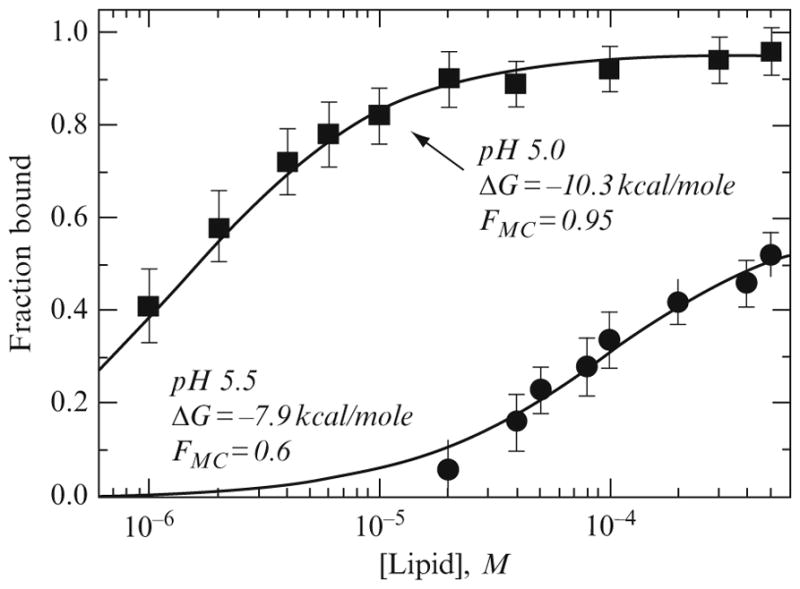
Typical membrane-binding isotherms used in determination of free energy of partitioning. Data for ANX binding to 75PC:25PG LUV was measured at pH 5.5 (circles) and pH 5 (squares). Solid curves are the fitting results using Eq. (2.7) with the corresponding parameters presented on the graph. Note that both parameters, the fraction of the membrane-competent form FMC and the free energy of membrane partitioning ΔG, are pH-dependent. Reproduced from Posokhov et al. (2008a) with permission.
4.2. pH-dependent formation of membrane-competent state
The next step in thermodynamic analysis involves characterization of the protonation required for the formation of membrane-competent protein conformation (Fig. 2.3) and can be accomplished by FCS measurements conducted under lipid saturation. Such measurements usually satisfy the conditions for infinite dilution regime described in Section 3.3.1, which simplifies their experimental implementation and analysis. A typical example of such an experiment is presented in Fig. 2.1, for which fractions of membrane-bound ANX are estimated using Eq. (2.5). Because this experiment is performed under conditions of lipid saturation, the fraction of bound protein corresponds to the fraction of membrane-competent form FMC at this pH (Fig. 2.5). The plots of FMC versus pH, referred to as titration profiles of membrane binding, contain information on the protein protonation required for membrane association (Fig. 2.1) and can be fitted to the following equation:
| (2.8) |
where pK is a negative logarithm of the dissociation constant, and n is the Hill coefficient.
Figure 2.5.
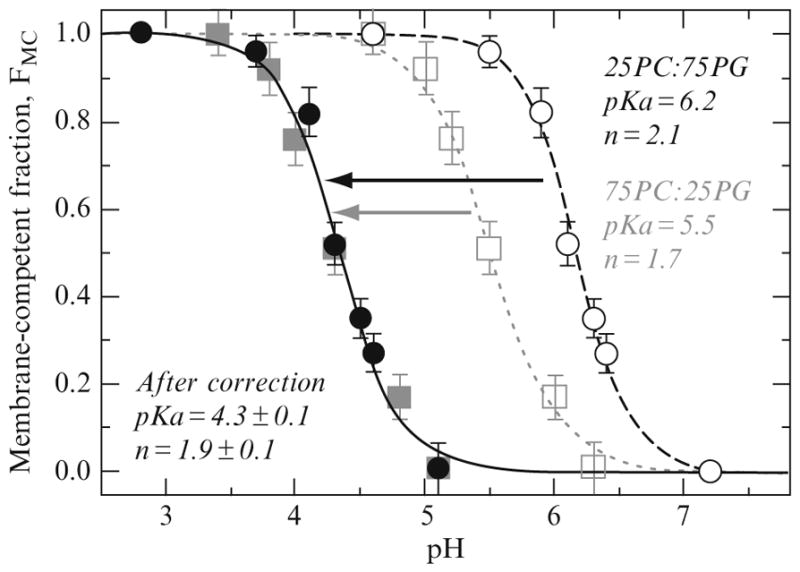
Analysis of pH-dependent formation of membrane-competent state of ANX. Squares and circles correspond to 75PC:25PG and 25PC:75PG lipid compositions, respectively. The same data sets are plotted using either uncorrected bulk pH values (open symbols) or corrected pH values (Eq. (2.9)) near the membrane interfaces with different surface potentials (closed symbols). Corrected pH-dependences for the formation of the membrane-competent form measured with the two lipid compositions coincide and can be fitted with a single curve using Eq. (2.8) (black line). The resulting parameters suggest that the transition to a membrane-competent form occurs near membrane interface with a pKa of 4.3 and requires protonation of two residues (n ~ 2). Reproduced from Posokhov et al. (2008a) with permission.
In general, the following two limiting cases should be considered for interpreting pH-triggered membrane association: (a) protonation occurs predominantly in the bulk phase of solution and (b) protonation occurs predominantly on the interface. The first scenario will result in titration profiles being completely independent of the lipid bilayer, while in the second one a relatively strong dependence on the surface potential is expected. Protonation of ANX falls under the latter case, as the corresponding apparent pK’s differ substantially: 5.5 ± 0.2 for 75PC:25PG and 6.2 ± 0.1 for 25PC:75PG (Posokhov et al., 2008a). This difference for the apparent protonation behavior in solution (presumed to be lipid independent) is surprising only at first glance. In reality, formation of the membrane-competent form is likely to occur near the membrane interface, where local proton concentration is different from that in the bulk solution. Moreover, local proton concentration will be different for the two lipid compositions because of the difference in the surface potential. One can correct for such variation using the equation relating pH values at membrane interfaces and in the bulk of solution with the values of membrane surface potential (φ) (Fernandez and Fromherz, 1977; Posokhov et al., 2008a):
| (2.9) |
where F and R are Faraday and gas constants, respectively, and T is the absolute temperature. Surprisingly, this rather simple correction gives excellent results and the combined dataset (Fig. 2.5 solid symbols) can be fitted with Eq. (2.6) (black line) and the following parameters are obtained: pK = 4.3 ± 0.1; n = 1.9 ± 0.1.
5. Kinetic Analysis of Membrane Protein Insertion
5.1. Interface-directed membrane insertion
To enter the membrane, a nonconstitutive membrane protein must pass through the interfacial region of the bilayer, a region that must play an important role in protein refolding (White et al., 2001). The general concept that emerges from the peptide studies is that the interfacial region of the bilayer can (a) provide special accommodation for large elements of protein structure undergoing refolding and (b) serve as a catalyst for the conformational change resulting in transbilayer insertion. Extension of the peptide results to more complex proteins suggests the importance of transient interfacial unfolded states. Indeed, kinetically populated or stable intermediates have been reported for a number of proteins including colicin E1 (Zakharov et al., 1999), diphtheria toxin T-domain (Chenal et al., 2002; Ladokhin et al., 2004; Wang et al., 1997), and ANX (Ladokhin et al., 2002; Posokhov et al., 2008a). All this evidence allows one to put forward the following hypothesis of interface-directed membrane insertion: an important component of a membrane insertion pathway for nonconstitutive membrane proteins is an obligatory interfacial intermediate state, characterized by high content of secondary structure and few native contacts. Formation of this intermediate and subsequent transbilayer insertion is mediated by a subtle balance of hydrophobic and electrostatic interactions between proteins and the membrane interface. Below we discuss the applications of fluorescence spectroscopy for kinetic measurements of ANX insertion along the pathway from aqueous W-state to interfacial intermediate I-state and finally to transbilayer inserted T-state (Fig. 2.7).
5.2. Spectroscopic approaches to study insertion pathways containing intermediates
5.2.1. On the interpretation of quantitative kinetic analysis
The exact functional form of kinetic equation in a pathway containing intermediate states can be rather complex and generally nonalgebraic (Moore and Pearson, 1981). Working with membrane systems further complicates kinetic analysis, as it limits the usable ranges of concentrations of interacting species. Therefore, it is customary to utilize empirical exponential decay (Eq. (2.10a)), or closely related to it, exponential association functions (Eq. (2.10b)) for quantitative analysis of a certain spectroscopic signal S that changes with the time passed since initiation of reaction, t (Compton et al., 2006; Constantinescu and Lafleur, 2004; Ladokhin, 1999; Ladokhin et al., 2002; Zakharov et al., 1999):
| (2.10a) |
| (2.10b) |
where Ai are the amplitudes of the corresponding kinetic component with apparent rates of ki. A0 can represent a constant value corresponding to the final (Eq. (2.10a)) or initial signal (Eq. (2.10b)), or it can be interpreted as an amplitude associated with an infinitely slow, k0 = ∞, to an infinitely fast component with k0 = 0, in Eqs. (10a) and (10b), respectively.
Fitting with exponential functions, however, often leads to poorly defined fits (a common problem for fitting with any nonorthogonal functions), which further affects the reliability of apparent kinetic rates obtained from such analysis. Given all these limitations, one should be particularly aware of the danger of overinterpretation when describing complex kinetic data. Nevertheless, certain conclusions can be attempted, as long as the underlying assumptions are clearly stated. For a general reaction containing a single intermediate (e.g., W ↔ I ↔ T), the formation of the final state follows a biexponential law, in which the apparent kinetic parameters are complex functions of the four kinetic rates for each of the direct and reverse reaction steps. The assumption that under the conditions of the experiment the reverse reactions can be neglected simplifies the mathematical expressions and results in the apparent kinetic rates coinciding with the two rates for each step of the direct reaction (Moore and Pearson, 1981).
5.2.2. Spectroscopic measurements along W → I → T pathway
The time course of the change in spectroscopic linear-response parameter, S(t), along a W (water-soluble) → I (interfacial intermediate) → T (transmembrane) pathway is as follows:
| (2.11) |
where SW, SI, and ST are the intensities and fW, fI, and fT are the fractional populations of the W, I, and T states, respectively. It should be noted that not all spectroscopic signals satisfy Eq. (2.11), but only those that are linear response parameters (for more discussion see Ladokhin et al., 2000; White et al., 1998). For example, intensity measured at any constant wavelength and at any orientation of polarizers (or without them) is an appropriate linear-response parameter, while position of spectral maximum or ratio of intensities at any two wavelengths are not. The time-dependencies of the fractional populations are given by Ladokhin et al. (2002) and Moore and Pearson (1981):
| (2.12) |
where kwi is the rate of the W → I transition and kit the rate of the I → T transition. The underlying assumption is that the reverse rates can be neglected compared to direct rates, that is, rate for W ← I and for I ← T transition is much smaller than that for W → I and I → T transition, respectively. This assumption significantly simplifies mathematical expression of the kinetics and allows for easy comparison of the model with empirical fitting functions. Note for example, that under these conditions the apparent rate constants k1 and k2 obtained by fitting with Eqs. (2.10a) or (2.10b) coincide with the transition rates kwi and kit for the W → I → T pathway (Eqs. (2.11) and (2.12)).
5.3. Example of kinetic analysis of membrane insertion of ANX
We illustrate the application of kinetic analysis outlined above using the transmembrane insertion of the ANX observed upon acidification in the absence of Ca+2. The crystallographic structure of the soluble W-state is known (Luecke et al., 1995) and the final inserted T-state was shown to form a water-filled pore by site-directed EPR studies (Langen et al., 1998). A helix-loop-helix region of ANX stretching between residues 134 and 162 (Fig. 2.6) undergoes a conformational change and becomes a single transmembrane helix in the inserted state with a residues 134 and 162 on the cis and trans side of the membrane, respectively (Ladokhin et al., 2002; Posokhov et al., 2008a). The kinetics of this process is complex and demonstrates the existence of the interfacial intermediate, which can be stabilized by high content of anionic lipids in the membrane (Ladokhin et al., 2002; Posokhov et al., 2008a). At moderate contents of anionic lipids (~25%) this intermediate can be observed kinetically by following the fluorescence of environment-sensitive probe NBD attached at single cysteine residues introduced in the middle of the TM segment in positions 143 (Fig. 2.6, dotted line) or 144 (dashed line). The trace corresponding to the latter is most indicative of intermediate, as the fluorescence intensity undergoes a rapid increase followed by slow decrease (the decrease of intensity at zero time corresponds to closing of the shutters during vesicle injection and is ignored during the analysis). For ANX-143C-NBD the intermediate can be identified from the nonexponential character of intensity increase: a rapid jump followed by slower increase.
Figure 2.6.

Example of kinetic study of pH-triggered membrane protein insertion pathway containing interfacial intermediate. A ribbon structure represents a segment of ANX flanked by residues 134 and 162 which is a helix-loop-helix in a soluble W-state with a known three-dimensional structure (the rest of the protein structure is omitted for clarity). At low pH in the absence of Ca2+, ANX inserts into the lipid bilayer and forms a water-filled pore in which this segment becomes a single transmembrane helix with residues 134 and 162 on cis and trans sides, respectively (Ladokhin et al., 2002; Langen et al., 1998). The time-dependencies of the change in fluorescence of environment-sensitive probe NBD, attached to single-cysteine mutants T143C and S144C, are shown as dotted and dashed lines, respectively. Membrane interactions were initiated at zero time. Both panels contain the same data normalized to the same amount of the labeled protein (A) or to the same initial intensity (B). The latter normalization obscures correct interpretation of fluorescence changes and precludes proper identification of the intermediate state (see Eq. (2.11) and text for details). The analysis of properly normalized fluorescence kinetics (A) reveals fast formation of the intermediate I-state in which the environment of the probes attached at residues 143 and 144 is similar. The variation in probes environment in the final T-state is consistent with their different exposure to the pore and is confirmed by fluorescence lifetime measurements. Solid lines represent linked fits of the two kinetic datasets using Eq. (2.10b) as described in the text.
Given together the data in Fig. 2.6A indicate a rapid formation of the membrane-associated intermediate state in which the probes attached at positions 143 and 144 are located in a similar environment, and hence similar intensity, followed by slow formation of the final T-state. Because this state is a water-filled pore comprised of several helical segments of the monomeric ANX (Ladokhin and Haigler, 2005; Langen et al., 1998), the slow changes in intensity are position dependent. For the pore-exposed residue 144 the intensity is decreased, while for residue 143, which is facing the lipid, an additional increase is observed. We would like to point out that the intensities in the initial W-state are different, which is consistent with the degree of exposure expected from the crystallographic structure (Fig. 2.6, upper panel). This difference is confirmed by the variation in the lifetime of NBD dye being longer for the ANX-143C-NBD in solution than for ANX-144C-NBD (Ladokhin, unpublished results). Note that the interpretation of relative changes in intensity is more obscured, when the traces are normalized to the same value of signal in W-state (Fig. 2.6B). Unfortunately, this rather common practice of comparing different mutants or proteins contradicts physical principles (see Eq. (2.11)) and can lead to misinterpretation of results (e.g., one would not be able to identify similar environments for both 143 and 144 positions for I-state, based on Fig. 2.6B).
Because the initial binding event occurred faster than the dead-time of the hand-mixing experiment (<10 s), we could not recover the value of the rate of formation of the I-state and fitted the data with a simplified model containing a step and a single exponential component (Eq. (2.10b) with A2 = 0). To more reliably determine the rate of insertion we have fitted both datasets in a linked analysis (Knutson et al., 1983), where a single remaining kinetic constant was shared, and amplitudes were allowed to float independently for the two mutants. The resulting curves (solid lines) adequately describe the data and the rate of T-state formation was found to be kit = 0.005 s−1. Because the kwi rate is more than an order of magnitude higher, the kinetic analysis is rather robust. When the two rates are becoming similar, the reliability of fit decreases and other restraints should be applied (e.g., comparison of kinetics collected in different lipid systems Ladokhin et al., 2002). One possibility would be to use additional experiments which are sensitive only to binding, but not insertion. Another would be the use of a double-kinetic approach (Beechem, 1997), which relies on a combination of stopped-flow kinetics and fluorescence lifetime measurements.
6. Perspectives: Annexin B12 as a Model for Thermodynamic and Kinetic Analysis of Membrane Protein Insertion, Folding and Misfolding
Different stages of the pH-triggered insertion pathway of ANX, along with their corresponding timescales, are summarized in Fig. 2.7. A fast transition from the water-soluble W-state to an interfacial intermediate I-state (<10 s; Ladokhin et al., 2002) is followed by a slower insertion to a final TM T-state. The rate of the latter process is strongly slowed by a high content of anionic lipids, presumably via stabilization of an I-state with Coulombic attraction between anionic lipids and cationic protein groups. If enough protein lingers in the I-state, it starts aggregating (A-state), while the properly inserted T-state shows no signs of aggregation in the same concentration range. At the present time we do not understand what forces contribute to this selective aggregation of the noninserted ANX, but the nature of the interfacial zone of the lipid bilayer is bound to play a role. Importantly, all other transitions involving W-, I-, and T-states are reversible and do not involve oligomerization (Ladokhin and Haigler, 2005; Ladokhin et al., 2004), which simplifies thermodynamic and kinetic analysis. Application of the FCS methodology had permitted accurate determination of the free energy of transfer of ANX from solution into the lipid bilayer. Remarkably, the main gain in free energy occurs already on the first step of the insertion pathway, that is, during formation of interfacial intermediate state (−9 ÷ −12 kcal/mol). The free energy for the final insertion changes from mildly favorable to mildly unfavorable (+2 ÷ −2 kcal/mol) and depends on the lipid composition (Ladokhin, 2008; Posokhov et al., 2008a). All this makes ANX an attractive template for further thermodynamic and kinetic studies of pH-triggered membrane insertion using a combination of spectroscopic approaches described here with the site-directed mutagenesis of key residues involved in insertion and refolding.
One of the reasons that studies of folding and stability of membrane proteins lag far behind those of their soluble counterparts is a shortage of appropriate experimental models of folding, and what is perhaps even more challenging, of misfolding. As illustrated in Fig. 2.7, ANX can also serve as a model for a misfolding process in which hindered insertion leads to aggregation on membrane interfaces (Ladokhin, 2008; Posokhov et al., 2008a). In the cell, a misfolded(-inserted) state of constitutive membrane proteins is believed to be quickly disposed of via a tightly set protein degradation machinery (Sanders and Myers, 2004). Moreover, even a large fraction of the inserted protein is degraded in order to minimize the risk of accumulating any misinserted protein. The evidence for the interfacial state of ANX being prone to aggregation sheds some light on the possible reasons why this may be the case. If aggregation on membrane interfaces is also shared by misinserted constitutive proteins, the cell must act quickly to dispose of them or else deal with much tougher aggregates. We will follow the example of Sanders and Myers, who with following quote drew attention to the dangers attendant on folding membrane protein (Charles Spurgeon, sermon at Newington, 1889, quoted after (Sanders and Myers, 2004)): “Where there is danger there should be prudent haste. Quick! Pilgrim, be quick and tarry not in the place of danger” . . . or you might end up aggregated on membrane interfaces.
Acknowledgments
We are grateful to Mr. M. A. Myers for his editorial assistance. This research was supported by NIH GM-069783.
Abbreviations
- ANX
Annexin B12
- ANX-143C-NBD
NBD labeled single-cysteine mutants T143C and S144C of ANX
- ANX-144C-NBD
NBD labeled single-cysteine mutants T143C and S144C of ANX
- NBD
7-nitrobenz-2-oxa-1,3-diazol-4-yl
- LUV
large unilamellar vesicles
- POPC
palmitoyloleoylphosphatidylcholine
- POPG
palmitoyloleoylphosphatidylglycerol
- 25PC:75PG and 75PC:25PG
mixtures of POPC and POPG that contain a molar percentage of corresponding lipid specified by the number
- TM
transmembrane
- IF
interfacial
- FMC
fraction of membrane-competent ANX
- ΔG
free energy of transfer from water to membrane
- φ
membrane surface potential
- FCS
fluorescence correlation spectroscopy
References
- Alder NN, Johnson AE. Cotranslational membrane protein biogenesis at the endoplasmic reticulum. J Biol Chem. 2004;279:22787–22790. doi: 10.1074/jbc.R400002200. [DOI] [PubMed] [Google Scholar]
- Beechem JM. Picosecond fluorescence decay curves collected on millisecond time scale:Direct measurement of hydrodynamic radii, local/global mobility, and intramolecular distances during protein-folding reactions. Methods Enzymol. 1997;278:24. doi: 10.1016/s0076-6879(97)78005-4. [DOI] [PubMed] [Google Scholar]
- Bowie JU. Border crossing. Nature. 2005;433:367–369. doi: 10.1038/433367a. [DOI] [PubMed] [Google Scholar]
- Bradshaw JP. Phosphatidylglycerol promotes bilayer insertion of salmon calcitonin. Biophys J. 2000;72:2180–2186. doi: 10.1016/S0006-3495(97)78861-1. [DOI] [PMC free article] [PubMed] [Google Scholar]
- Chen H, Farkas ER, Webb WW. Chapter 1: In vivo applications of fluorescence correlation spectroscopy. Methods Cell Biol. 2008;89:3–35. doi: 10.1016/S0091-679X(08)00601-8. [DOI] [PubMed] [Google Scholar]
- Chenal A, Savarin P, Nizard P, Guillain F, Gillet D, Forge V. Membrane protein insertion regulated by bringing electrostatic and hydrophobic interactions into play. A case study with the translocation domain of the diphtheria toxin. J Biol Chem. 2002;277:43425–43432. doi: 10.1074/jbc.M204148200. [DOI] [PubMed] [Google Scholar]
- Clamme JP, Azoulay J, Mely Y. Monitoring of the formation and dissociation of polyethylenimine/DNA complexes by two photon fluorescence correlation spectroscopy. Biophys J. 2003;84:1960–1968. doi: 10.1016/S0006-3495(03)75004-8. [DOI] [PMC free article] [PubMed] [Google Scholar]
- Collier RJ, Young JA. Anthrax toxin. Annu Rev Cell Dev Biol. 2003;19:45–70. doi: 10.1146/annurev.cellbio.19.111301.140655. [DOI] [PubMed] [Google Scholar]
- Compton EL, Farmer NA, Lorch M, Mason JM, Moreton KM, Booth PJ. Kinetics of an individual transmembrane helix during bacteriorhodopsin folding. J Mol Biol. 2006;357:325–338. doi: 10.1016/j.jmb.2005.12.042. [DOI] [PubMed] [Google Scholar]
- Constantinescu I, Lafleur M. Influence of the lipid composition on the kinetics of concerted insertion and folding of melittin in bilayers. Biochim Biophys Acta. 2004;1667:26–37. doi: 10.1016/j.bbamem.2004.08.012. [DOI] [PubMed] [Google Scholar]
- Fernandez MS, Fromherz P. Lipoid pH indicators as probes of electrical potential and polarity in micelles. J Phys Chem. 1977;81:1755–1761. [Google Scholar]
- Fernandez-Vidal M, Jayasinghe S, Ladokhin AS, White SH. Folding amphipathic helices into membranes: Amphiphilicity trumps hydrophobicity. J Mol Biol. 2007;370:459–470. doi: 10.1016/j.jmb.2007.05.016. [DOI] [PMC free article] [PubMed] [Google Scholar]
- Garcia-Saez AJ, Schwille P. Fluorescence correlation spectroscopy for the study of membrane dynamics and protein/lipid interactions. Methods. 2008;46:116–122. doi: 10.1016/j.ymeth.2008.06.011. [DOI] [PubMed] [Google Scholar]
- Greenhut SF, Bourgeois VR, Roseman MA. Distribution of cytochrome b5 between small and large unilamellar phospholipid vesicles. J Biol Chem. 1986;261:3670–3675. [PubMed] [Google Scholar]
- Haustein E, Schwille P. Ultrasensitive investigations of biological systems by fluorescence correlation spectroscopy. Methods. 2003;29:153–166. doi: 10.1016/s1046-2023(02)00306-7. [DOI] [PubMed] [Google Scholar]
- Haustein E, Schwille P. Single-molecule spectroscopic methods. Curr Opin Struct Biol. 2004;14:531–540. doi: 10.1016/j.sbi.2004.09.004. [DOI] [PubMed] [Google Scholar]
- Haustein E, Schwille P. Fluorescence correlation spectroscopy: Novel variations of an established technique. Annu Rev Biophys Biomol Struct. 2007;36:151–169. doi: 10.1146/annurev.biophys.36.040306.132612. [DOI] [PubMed] [Google Scholar]
- Heller WT, Waring AJ, Lehrer RI, Huang HW. Multiple states of β-sheet peptide protegrin in lipid bilayers. Biochemistry. 1998;37:17331–17338. doi: 10.1021/bi981314q. [DOI] [PubMed] [Google Scholar]
- Hess ST, Huang S, Heikal AA, Webb WW. Biological and chemical applications of fluorescence correlation spectroscopy: A review. Biochemistry. 2002;41:697–705. doi: 10.1021/bi0118512. [DOI] [PubMed] [Google Scholar]
- Hessa T, Kim H, Bihlmaler K, Lundin C, Boekel J, Andersson H, Nilsson I, White SH, von Heijne G. Recognition of transmembrane helices by the endoplasmic reticulum translocon. Nature. 2005;433:377–381. doi: 10.1038/nature03216. [DOI] [PubMed] [Google Scholar]
- Hristova K, White SH. An experiment-based algorithm for predicting the partitioning of unfolded peptides into phosphatidylcholine bilayer interfaces. Biochemistry. 2005;44:12614–12619. doi: 10.1021/bi051193b. [DOI] [PubMed] [Google Scholar]
- Johnson AE, van Waes MA. The translocon: A dynamic gateway at the ER membrane. Annu Rev Cell Dev Biol. 1999;15:799–842. doi: 10.1146/annurev.cellbio.15.1.799. [DOI] [PubMed] [Google Scholar]
- Knutson JR, Beechem JM, Brand L. Simultaneous analysis of multiple fluorescence decay curves: A global approach. Chem Phys Lett. 1983;102:501–507. [Google Scholar]
- Ladokhin AS. Evaluation of lipid exposure of tryptophan residues in membrane peptides and proteins. Anal Biochem. 1999;276:65–71. doi: 10.1006/abio.1999.4343. [DOI] [PubMed] [Google Scholar]
- Ladokhin AS. Insertion intermediate of annexin B12 is prone to aggregation on membrane interfaces. Biopolym Cell. 2008;24:101–104. [Google Scholar]
- Ladokhin AS, Haigler HT. Reversible transition between the surface trimer and membrane-inserted monomer of annexin 12. Biochemistry. 2005;44:3402–3409. doi: 10.1021/bi047805u. [DOI] [PubMed] [Google Scholar]
- Ladokhin AS, White SH. Folding of amphipathic α-helices on membranes: Energetics of helix formation by melittin. J Mol Biol. 1999;285:1363–1369. doi: 10.1006/jmbi.1998.2346. [DOI] [PubMed] [Google Scholar]
- Ladokhin AS, White SH. Protein chemistry at membrane interfaces: Nonadditivity of electrostatic and hydrophobic interactions. J Mol Biol. 2001;309:543–552. doi: 10.1006/jmbi.2001.4684. [DOI] [PubMed] [Google Scholar]
- Ladokhin AS, White SH. Interfacial folding and membrane insertion of a designed helical peptide. Biochemistry. 2004;43:5782–5791. doi: 10.1021/bi0361259. [DOI] [PubMed] [Google Scholar]
- Ladokhin AS, Jayasinghe S, White SH. How to measure and analyze tryptophan fluorescence in membranes properly, and why bother? Anal Biochem. 2000;285:235–245. doi: 10.1006/abio.2000.4773. [DOI] [PubMed] [Google Scholar]
- Ladokhin AS, Isas JM, Haigler HT, White SH. Determining the membrane topology of proteins: Insertion pathway of a transmembrane helix of annexin 12. Biochemistry. 2002;41:13617–13626. doi: 10.1021/bi0264418. [DOI] [PubMed] [Google Scholar]
- Ladokhin AS, Legmann R, Collier RJ, White SH. Reversible refolding of the diphtheria toxin T-domain on lipid membranes. Biochemistry. 2004;43:7451–7458. doi: 10.1021/bi036157w. [DOI] [PubMed] [Google Scholar]
- Langen R, Isas JM, Hubbell WL, Haigler HT. A transmembrane form of annexin XII detected by site-directed spin labeling. Proc Natl Acad Sci USA. 1998;95:14060–14065. doi: 10.1073/pnas.95.24.14060. [DOI] [PMC free article] [PubMed] [Google Scholar]
- Luecke H, Chang BT, Mailliard WS, Schlaepfer DD, Haigler HT. Crystal structure of the annexin XII hexamer and implications for bilayer insertion. Nature. 1995;378:512–515. doi: 10.1038/378512a0. [DOI] [PubMed] [Google Scholar]
- Mayer LD, Hope MJ, Cullis PR. Vesicles of variable sizes produced by a rapid extrusion procedure. Biochim Biophys Acta. 1986;858:161–168. doi: 10.1016/0005-2736(86)90302-0. [DOI] [PubMed] [Google Scholar]
- Miller CJ, Elliott JL, Collier RJ. Anthrax protective antigen: Prepore-to-pore conversion. Biochemistry. 1999;38:10432–10441. doi: 10.1021/bi990792d. [DOI] [PubMed] [Google Scholar]
- Moore JW, Pearson RG. Kinetics and mechanism. Wiley; New York: 1981. [Google Scholar]
- Murray D, Ben-Tal N, Honig B, McLaughlin S. Electrostatic interaction of myristoylated proteins with membranes: Simple physics, complicated biology. Structure. 1997;5:985–989. doi: 10.1016/s0969-2126(97)00251-7. [DOI] [PubMed] [Google Scholar]
- Oh KJ, Senzel L, Collier RJ, Finkelstein A. Translocation of the catalytic domain of diphtheria toxin across planar phospholipid bilayers by its own T domain. Proc Natl Acad Sci USA. 1999;96:8467–8470. doi: 10.1073/pnas.96.15.8467. [DOI] [PMC free article] [PubMed] [Google Scholar]
- Parker MW, Tucker AD, Tsernoglou D, Pattus F. Insights into membrane insertion based on studies of colicins. Trends Biochem Sci. 1990;15:126–129. doi: 10.1016/0968-0004(90)90205-p. [DOI] [PubMed] [Google Scholar]
- Poklar N, Fritz J, Macek P, Vesnaver G, Chalikian TV. Interaction of the pore-forming protein equinatoxin II with model lipid membranes: A calorimetric and spectroscopic study. Biochemistry. 1999;38:14999–15008. doi: 10.1021/bi9916022. [DOI] [PubMed] [Google Scholar]
- Posokhov YO, Ladokhin AS. Lifetime fluorescence method for determining membrane topology of proteins. Anal Biochem. 2006;348:87–93. doi: 10.1016/j.ab.2005.10.023. [DOI] [PubMed] [Google Scholar]
- Posokhov YO, Gottlieb PA, Morales MJ, Sachs F, Ladokhin AS. Is lipid bilayer binding a common property of inhibitor cysteine knot ion-channel blockers? Biophys J. 2007;93:L20–L22. doi: 10.1529/biophysj.107.112375. [DOI] [PMC free article] [PubMed] [Google Scholar]
- Posokhov YO, Rodnin MV, Lu L, Ladokhin AS. Membrane insertion pathway of annexin B12: Thermodynamic and kinetic characterization by fluorescence correlation spectroscopy and fluorescence quenching. Biochemistry. 2008a;47:5078–5087. doi: 10.1021/bi702223c. [DOI] [PubMed] [Google Scholar]
- Posokhov YO, Rodnin MV, Das SK, Pucci B, Ladokhin AS. FCS study of the thermodynamics of membrane protein insertion into the lipid bilayer chaperoned by fluorinated surfactants. Biophys J. 2008b;95:L54–L56. doi: 10.1529/biophysj.108.141002. [DOI] [PMC free article] [PubMed] [Google Scholar]
- Rapoport TA, Goder V, Heinrich SU, Matlack KES. Membrane-protein integration and the role of the translocation channel. Trends Cell Biol. 2004;14:568–575. doi: 10.1016/j.tcb.2004.09.002. [DOI] [PubMed] [Google Scholar]
- Rhoades E, Ramlall TF, Webb WW, Eliezer D. Quantification of alpha-synuclein binding to lipid vesicles using fluorescence correlation spectroscopy. Biophys J. 2006;90:4692–4700. doi: 10.1529/biophysj.105.079251. [DOI] [PMC free article] [PubMed] [Google Scholar]
- Rusu L, Gambhir A, McLaughlin S, Radler J. Fluorescence correlation spectroscopy studies of Peptide and protein binding to phospholipid vesicles. Biophys J. 2004;87:1044–1053. doi: 10.1529/biophysj.104.039958. [DOI] [PMC free article] [PubMed] [Google Scholar]
- Sanders CR, Myers JK. Disease-related misassembly of membrane proteins. Annu Rev Biophys Biomol Struct. 2004;33:25–51. doi: 10.1146/annurev.biophys.33.110502.140348. [DOI] [PubMed] [Google Scholar]
- Schwille P, Korlach J, Webb WW. Fluorescence correlation spectroscopy with single-molecule sensitivity on cell and model membranes. Cytometry. 1999;36:176–182. doi: 10.1002/(sici)1097-0320(19990701)36:3<176::aid-cyto5>3.0.co;2-f. [DOI] [PubMed] [Google Scholar]
- Seelig J, Ganz P. Nonclassical hydrophobic effect in membrane binding equilibria. Biochemistry. 1991;30:9354–9359. doi: 10.1021/bi00102a031. [DOI] [PubMed] [Google Scholar]
- Senzel L, Gordon M, Blaustein RO, Oh KJ, Collier RJ, Finkelstein A. Topography of diphtheria toxin’s T domain in the open channel state. J Gen Physiol. 2000;115:421–434. doi: 10.1085/jgp.115.4.421. [DOI] [PMC free article] [PubMed] [Google Scholar]
- Shatursky O, Heuck AP, Shepard LA, Rossjohn J, Parker MW, Johnson AE, Tweten RK. The mechanism of membrane insertion for a cholesterol-dependent cytolysin: A novel paradigm for pore-forming toxins. Cell. 1999;99:293–299. doi: 10.1016/s0092-8674(00)81660-8. [DOI] [PubMed] [Google Scholar]
- Tory MC, Merrill AR. Adventures in membrane protein topology: A study of the membrane-bound state of colicin E1. J Biol Chem. 1999;274:24539–24549. doi: 10.1074/jbc.274.35.24539. [DOI] [PubMed] [Google Scholar]
- Wang Y, Malenbaum SE, Kachel K, Zhan HJ, Collier RJ, London E. Identification of shallow and deep membrane-penetrating forms of diphtheria toxin T domain that are regulated by protein concentration and bilayer width. J Biol Chem. 1997;272:25091–25098. doi: 10.1074/jbc.272.40.25091. [DOI] [PubMed] [Google Scholar]
- White SH, von Heijne G. Do protein-lipid interactions determine the recognition of transmembrane helices at the ER translocon? Biochem Soc Trans. 2005;33:1012–1015. doi: 10.1042/BST20051012. [DOI] [PubMed] [Google Scholar]
- White SH, Wimley WC, Ladokhin AS, Hristova K. Protein folding in membranes: Determining the energetics of peptide-bilayer interactions. Methods Enzymol. 1998;295:62–87. doi: 10.1016/s0076-6879(98)95035-2. [DOI] [PubMed] [Google Scholar]
- White SH, Ladokhin AS, Jayasinghe S, Hristova K. How membranes shape protein structure. J Biol Chem. 2001;276:32395–32398. doi: 10.1074/jbc.R100008200. [DOI] [PubMed] [Google Scholar]
- Wieprecht T, Apostolov O, Beyermann M, Seelig J. Membrane binding and pore formation of the antibacterial peptide PGLa: Thermodynamic and mechanistic aspects. Biochemistry. 2000;39:442–452. doi: 10.1021/bi992146k. [DOI] [PubMed] [Google Scholar]
- Wimley WC, White SH. Experimentally determined hydrophobicity scale for proteins at membrane interfaces. Nat Struct Biol. 1996;3:842–848. doi: 10.1038/nsb1096-842. [DOI] [PubMed] [Google Scholar]
- Wimley WC, Hristova K, Ladokhin AS, Silvestro L, Axelsen PH, White SH. Folding of β-sheet membrane proteins: A hydrophobic hexapeptide model. J Mol Biol. 1998;277:1091–1110. doi: 10.1006/jmbi.1998.1640. [DOI] [PubMed] [Google Scholar]
- Zakharov SD, Heymann JB, Zhang YL, Cramer WA. Membrane binding of the colicin E1 channel: Activity requires an electrostatic interaction of intermediate magnitude. Biophys J. 1996;70:2774–2783. doi: 10.1016/S0006-3495(96)79847-8. [DOI] [PMC free article] [PubMed] [Google Scholar]
- Zakharov SD, Lindeberg M, Cramer WA. Kinetic description of structural changes linked to membrane import of the colicin E1 channel protein. Biochemistry. 1999;38:11325–11332. doi: 10.1021/bi9903087. [DOI] [PubMed] [Google Scholar]