Abstract
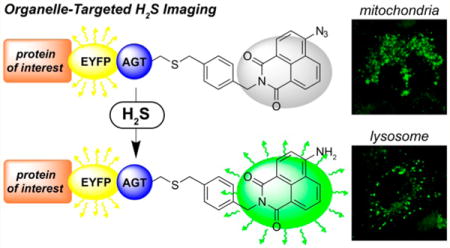
Hydrogen sulfide (H2S) is an essential biological signaling molecule in diverse biological regulatory pathways. To provide new chemical tools for H2S imaging, we report here a fluorescent H2S detection platform (HSN2-BG) that is compatible with subcellular localization SNAP-tag fusion protein methodologies and use appropriate fusion protein constructs to demonstrate mitochondrial and lysosomal localization. We also demonstrate the eӽcacy of this detection platform to image endogenous H2S in Chinese hamster ovary (CHO) cells and use the developed constructs to report on the subcellular H2S distributions provided by common H2S donor molecules AP39, ADT–OH, GYY4137, and diallyltrisulfide (DATS). The developed constructs provide a platform poised to provide new insights into the subcellular distribution of common H2S donors and a useful tool for investigating H2S biochemistry.
Graphical abstract
Hydrogen sulfide (H2S) has emerged as an important biological molecule involved in human health and has motivated significant efforts to develop small-molecule chemical tools to study the different roles of H2S in biology and medicine. Concomitant with the expanding roles of H2S in biology, new chemical tools for H2S detection and delivery have emerged as two pillars of investigative studies.1–11 For example, development of fluorescent H2S reporters has emerged as an attractive strategy to image H2S genesis with the potential to provide spatiotemporal feedback on H2S genesis and action. Complementing detection strategies, the development of H2S donor molecules has emerged as an important strategy for delivering H2S at slow, sustained rates, akin to enzymatic H2S synthesis. These methods offer distinct benefits over direct administration of NaSH, which results in a large bolus of H2S that is quickly metabolized and detoxified by cellular machinery. Despite these benefits, significant challenges remain including separating the pharmacological and toxicological profiles of H2S and resolving controversies including the observation that different donors of H2S exert seemingly paradoxical pro- and anti-inflammatory responses.12 We view that much of this controversy may stem from different bioavailability and localization profiles from synthetic donors.
One strategy to address key needs related to both H2S sensing and delivery is to develop a single sensing platform that can be localized to different subcellular organelles and could be used to investigate the subcellular release of H2S from different donor constructs. In addition, subcellular localization would also increase the dynamic range of the probes by lowering diffuse background signal. One common method to impart subcellular localization to small molecule constructs is to append functional groups that direct the molecules to specific subcellular compartments. For example, triphenylphosphonium and morpholine functionalization are often used to direct molecules to the mitochondria and lysosome, respectively.13 Although such modifications impart subcellular localization, they also increase the number of compounds that must be prepared and can also change the properties of the reporter, thus, making direct comparisons between different scaffolds diӽcult. One option to circumvent this problem is to genetically encode sensing motifs, green fluorescent proteins containing unnatural amino acids, into different cell lines.14,15 A second strategy is to use one probe construct that is compatible with fusion protein techniques to covalently attach the small molecule to proteins that naturally localize in different cellular compartments. We note that initial applications of this approach for H2S sensing appeared in the literature during the review process of the present manuscript.16 Two of the most popular of such techniques include HaloTag, which uses alkyl chlorides in combination with dehalogenase enzymes, and SNAP-tag, which uses benzylguanine-ligated substrates in combination with AGT fusion proteins to generate subcellularly localized probes.17–19 Motivated by this need, we report here the development of a genetically registered, organelle-targeted H2S probe utilizing SNAP-tag methodology and use this developed system to image the differential subcellular donation of H2S from selected synthetic donors.
EXPERIMENTAL SECTION
Material and Methods
Flash chromatography was performed using silica gel and an automated flash chromatography instrument. Thin-layer chromatography (TLC) was performed on silica gel plates (250 μm thickness) and viewed by UV illumination. NMR spectra were acquired on either a 500 or 600 MHz spectrometer at 25.0 °C. Chemical shifts are reported in parts per million (δ) and are referenced to residual protic solvent resonances. The following abbreviations are used in describing NMR couplings: (s) singlet, (d) doublet, (t) triplet, (m) multiplet, and (b) broad. Fluorescence spectra were obtained on an ISS PC1 fluorimeter equipped with a cuvette temperature controller. Aminooxyacetic acid (AOAA) and diallyltrisulfide (DATS) were purchased from Cayman Chemicals, and anhydrous NaSH was purchased from Strem Chemicals. GYY4137, ADTOH, and AP39 were prepared as described in the literature.20 SNAP tag precursors were prepared as described previously.21,22
Plasmid Construction of Human O6-Alkylguanine-DNA Alkyltransferase (AGT) Fusion Proteins
The full length cox8, LAMP1, and EYFP:SNAP plasmid inserts were purchased from Integrated DNA Technologies. The mammalian expression plasmid pSNAPf (New England BioLabs) was digested with NheI-HF/NotI-HF and ligated to the gBlock EYFP:AGT (EYFP:AGT backbone). All fragments were cloned into the N-terminus of EYFP:AGT backbone.
Cell Culture and Fluorescence Labeling of AGT Fusion Proteins
Chinese hamster ovary (CHO-K1) cells, which are AGT-deficient, were cultured in F12K media (LifeTech) supplemented with 10% fetal bovine serum (FBS, HyClone) and 1% penicillin/streptomycin. Cells were seeded on a 22 mm diameter glass coverslip at ∼2 × 10⁶ cells per well in a six-well culture dish and allowed to adhere for 24 h. Transient expression of the AGT-fusion protein was performed by following the standard Liptofectamine LTX and Plus Reagent protocol. CHO-K1 cells were incubated for 72 h at 37 °C, 5% CO2 to allow for high eӽcacy protein expression.
For AGT labeling, the cells were washed with 1× Dulbecco’s phosphate buffered saline (DPBS) and incubated with 1 mL of labeling media (OptiMEM) containing 5 μM of the HSN2 benzyl-guanine conjugate (HSN2-BG) for 30 min at 37 °C. The labeling media was then removed and cells were washed with 1× DPBS twice to remove excess probe. For colocalization studies, fresh OptiMEM media containing Far-Red MitoTracker (300 nM) or Far-Red LysoTracker (90 nM) was added to the cells, after which they were incubated at 37 °C with 5% CO2 for an additional 30 min. For nuclear staining, four drops of NucLIVE stain was added to each well after HSN2-BG treatment and incubated for another 30 min at 37 °C with 5% CO2. Cells were then washed three times with 1× DPBS and fixed for 15 min with 3.7% formaldehyde in 1× DPBS at 37 °C followed by two rinses and two washes with 1× DPBS. Coverslips containing fixed cells were mounted in Vectashield Hardset Mounting Medium (Vector Laboratories).
For inhibition of endogenously produced H2S studies, transiently transfected CHO-K1 cells were treated with aminooxyacetic acid (AOAA, 20 μM) for 45 min at 37 °C with 5% CO2, cells were then washed with 1× DPBS twice to remove any excess AOAA. HSN2-BG (5 μM) was then introduced to the media and incubated at 37 °C with 5% CO2 for 30 min. Cells were then washed three times with 1× DPBS and fixed for 15 min with 3.7% formaldehyde in 1× DPBS at 37 °C followed by two rinses and two washes with 1× DPBS. Coverslips containing fixed cells were mounted in Vectashield Hardset Mounting Medium (Vector Laboratories).
Mitochondria-targeted H2S donor studies were performed by treating transiently transfected CHO-K1 cells with AP39 for 1 h incubation at 37 °C and 5% CO2. Cells were washed with 1× DPBS and then treated with HSN2-BG (5 μM) for 30 min at 37 °C and 5% CO2. Excess substrate was washed off with 1× DPBS and fixed for 15 min with 3.7% formaldehyde in 1× DPBS at 37 °C, followed by two rinses and two washes with 1× DPBS. Coverslips containing fixed cells were mounted in Vectashield Hardset Mounting Medium (Vector Laboratories).
Fluorescence Microscopy and Statistical Analysis
Images were acquired on a confocal microscope (Olympus Fluoview 1000) using an oil-immersion 40× (1.3 NA) or 60× (1.4 NA) objective and laser excitation sources (405, 488, 515, 635 nm). All images were processed with ImageJ.23 Fluorescent data was analyzed using ImageJ software and all statistical comparisons were performed using Prism. (One-way ANOVA with Dunnett’s posttest was performed using GraphPad Prism version 5.01 for Windows; GraphPad Software: San Diego, CA www.graphpad.com). For fluorescence quantification, regions of interest (ROIs) were defined by the EYFP signal. This treatment provided identical results to whole-image analysis, but was employed to ensure that only colocalized HSN2-BG fluorescence was used in the fluorescence quantification.
Syntheses
2-(4-((2-Amino-9H-purin-6-yloxy)methyl)-benzyl)-6-azido-1H-benzo[de]isoquinoline-1,3(2H)-dione (HSN2-BG). Amine 2 (200 mg, 0.739 mmol) was suspended in ∼11 mL of dioxane and 6-azidobenzo[de]isochromene-1,3-dione (1) was added to the solution. The reaction was refluxed under nitrogen in the dark for 7 h. The reaction mixture was then allowed to cool to room temperature, and the solvent was evaporated under vacuum. The resultant crude product was purified by SiO2 chromatography (5% MeOH in DCM) to yield the desired product (80.0 mg, 22% yield). 1H NMR (600 MHz, DMSO-d6) δ 8.57 (m, J = 4.13 Hz, 1H, ArH), 8.56 (d, J = 1.15 Hz, 1H, ArH), 8.52 (d, J = 3 Hz, 1H, ArH), 8.45 (d, J = 9.73 Hz, 1H, ArH), 8.25 (t, J = 8.2 Hz, 1H, ArH), 7.89 (t, J = 7.9 Hz, 1H, ArH), 7.77 (d, J = 8.13 Hz, 1H, ArH), 7.33 (d, J = 10.27 Hz, 2H, ArH), 7.25 (d, J = 7.95 Hz, 2H, ArH), 5.20 (s, 2H, CH2), 5.11 (bs, 2H, NH2), 4.42 (s, 2H, CH2). 13C{1H} NMR (150 MHz, DMSO-d6) δ 163.8, 163.5, 163.4, 163.3, 143.6, 141.9, 136.2, 136.0, 133.4, 132.4, 132.0, 130.4, 129.9, 128.9, 127.9, 127.0, 124.1, 123.2, 122.5, 118.5, 116.5, 63.1, 43.3.
RESULTS AND DISCUSSION
We chose to use the SNAP-tag methodology due to its compatibility with the HSN2 H2S detection platform (vide infra) as well as its previous and effective application for other small bioinorganic analytes including Zn2+, Ca2+, and H2O224–26 To develop a SNAP-tag compatible H2S probe, we modified the HSN2 system, which we reported previously27 and which has been used by other groups to investigate H2S-mediated cytoprotection and differentiation in cancer cell lines, as well as the role of CBS in breast cancer cells.28–30 We expected that simple modification of the HSN2 platform with SNAP-tag compatible benzylguanine moiety would require only simple synthetic modifications but would increase the eӽcacy of the HSN2 platform for organelle-specific detection of endogenous H2S and could provide insight into subcellular release patterns of synthetic H2S donors, To prepare the required HNS2 conjugate, we treated azidonaphthalic anhydride (2) with benzyl guanine precursor 1 to afford benzylguanine ligated HSN2-BG (Scheme 1).
Scheme 1.
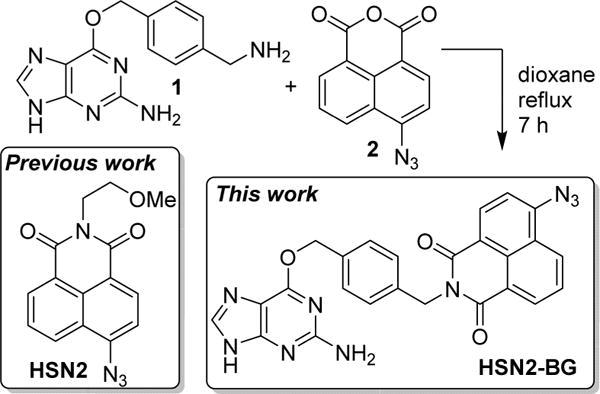
Synthesis of HSN2-BG
With HSN2-BG in hand, we confirmed that HSN2-BG functioned as a viable H2S reporter by incubating HSN2-BG with purified AGT protein, isolated from E. coli, in a 1:1 ratio for 30 min at 37 °C (Scheme 2), followed by the addition of 10 equiv of NaSH. Under these in vitro conditions, we observed an 8-fold fluorescence turn-on response (Figure S1). This lower fluorescence enhancement by comparison to the parent HSN2 is likely due to the shorter reaction time of 30 min, lower NaSH concentration used, and the presence of 1 mM DTT required for in vitro AGT ligation.31 We also observed that ligation of HSN2-BG to AGT was required for fluorescence activation by H2S. For example, treatment of HSN2-BG with NaSH in the absence of AGT failed to produce a fluorescence response, suggesting that the guanine moiety of HSN2-BG may effectively quench the naphthalimide fluorescence, which has been observed previously for common fluorophores.32,33
Scheme 2.
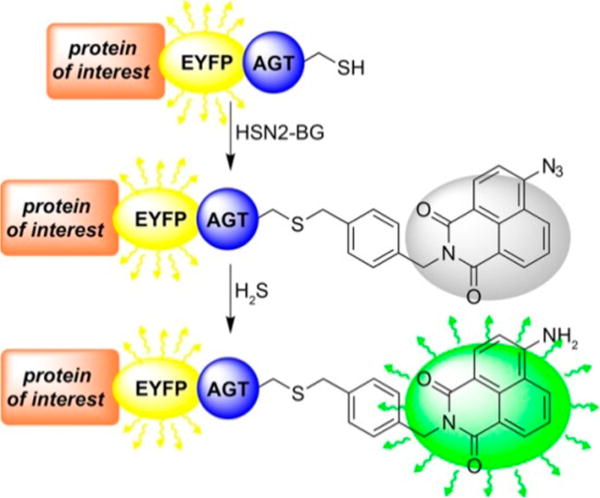
Treatment of Protein Constructs, Labelled with EYFP and AGT, with HSN2-BG Results in Covalent Ligation of the H2S Sensing Moiety
Having verified that AGT-conjugated HSN2-BG is an effective H2S reporter in cuvettes, we next used Chinese hamster ovarian-K1 (CHO) cells to translate our invstigation into cellular systems. We chose to use CHO cells because they do not express AGT endogenously, which ensures that only intentionlly transfected AGT is present. To confirm bioconjugation of HSN2-BG to AGT in CHO cells, we transiently transfected CHO cells with fusion construct containing both EYFP and AGT (EYFP:AGT), followed by treatment with HSN2-BG. Additionally, the excitation profiles of HSN2 (λmax = 435 nm) and EYFP (λmax = 515 nm) are suӽciently separated to ensure eӽcient but separate excitation of each fluorophore. Indeed, in the absence of the HSN2-BG conjugate, excitation in the HSN2-BG channel failed to produce a fluorescence response in the EYFP channel, confirming signal separation under our experimental conditions. We note that, although EYFP is not required for AGT function, incorporation of the genetically encoded fluorophore allows for simple tracking of transfection eӽciency (which we determined to be >85%), and it also serves as an internal standard to confirm colocalization of the EYFP fluorescence with HSN2-BG. For each fusion construct, use of the raw fluorescence intensities or those scaled to the EYFP internal standard provided equivalent results, which is consistent with a both high transfection and AGT labeling eӽciencies. In these experiments, colocalization of EYFP:AGT and HSN2-BG fluorescence was observed. By contrast, treatment of CHO cells that had not been transfected with the EYFP:AGT construct with HSN2-BG failed to generate a fluorescent response, confirming that ligation to AGT is required for signal generation (Figure 1).
Figure 1.
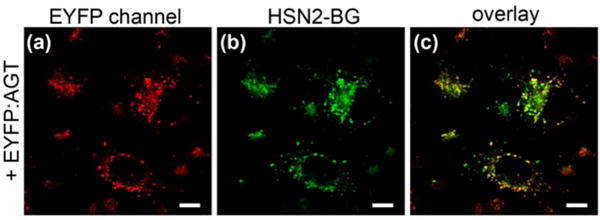
AGT fusion protein is required for HSN2-BG bioconjugation. (a–c) Transiently transfected CHO cells with EYFP:AGT and HSN2-BG (5 μM). Scale bars = 10 μm.
We next constructed organelle-specific conjugates by appending EYFP and AGT to the N-terminus of different proteins that naturally localize to different subcellular compartments. Because 3-mercaptopyruvate sulfurtransferase (3-MST), one of the primary enzymes in H2S synthesis, resides in the mitochondria,34–37 we chose to generate a fusion protein targeted to this cellular compartments.38,39 We also reasoned that the small-molecule H2S donors may accumulate in the lysosome, so generated fusion proteins using Cox8 (cytochrome c-oxidase VIII) and LAMP1 (lysosomal-associated membrane protein I) to generate constructs localized to the mitochondria and lysosome, respectively. After transfection, we monitored the EYFP and HSN2-BG fluorescence in combination with organelle-specific small molecule fluorescent markers and established that the AGT fusion proteins labeled the desired organelles (Figure 2). To further establish this colocalization, we measured the Pearson coeӽcient for the different conjugates. In the Cox8 and LAMP1 systems, Pearson coeӽcients of 0.89 and 0.87, respectively, between the HSN2 and organelle-specific signals confirmed eӽcient colocalization.
Figure 2.
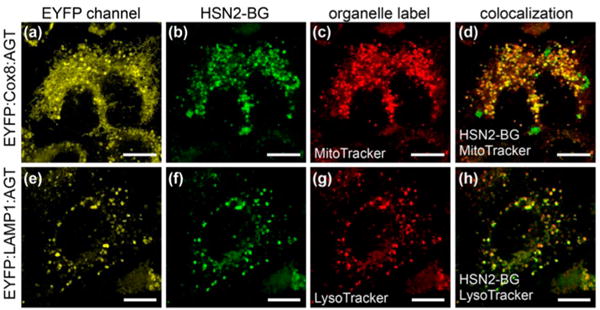
Subcellular labeling of H2S with HSN2-BG and fusion proteins. Columns include the EYFP signal, HSN2 fluorescence, organelle label, and colocalization between the HSN2-BG signal and the organelle dye. (a–d) EYFP:Cox8:AGT construct and (e–h) EYFP:LAMP1:AGT construct. Scale bars = 10 μm.
Having established that HSN2-BG is a suitable substrate for intracellular labeling of different AGT constructs, we next investigated whether the localized constructs were suӽciently sensitive to detection endogenous, enzymatically produced H2S. Our expectation was that covalent ligation of HSN2-BG to specific subcellular locales would increase the dynamic range of the probe by significantly reducing the background fluorescence due to diffuse probe localization and, thus, facilitate endogenous H2S detection. To test this hypothesis, we compared the observed fluorescence from the three organelle-specific conjugates with cells that had been treated with 20 μM AOAA, a cystathionine γ-lyase (CSE) and cystathionine β-synthase (CBS) inhibitor. We observed that, for both lysosomal LAMP1:AGT, a significant reduction in fluorescence was observed. By contrast, mitochondrial H2S levels imaged by Cox8:AGT were statistically unaltered. The differential response to AOAA in the mitochondria and the lysosome is consistent with AOAA inhibition of cytosolic CBS and CSE rather than the mitochondrial 3-MST. Taken together, these results suggest that the HSN2-BG platform is suӽciently sensitive to detect endogenous H2S produced in individual organelles (Figures 3 and 5).
Figure 3.
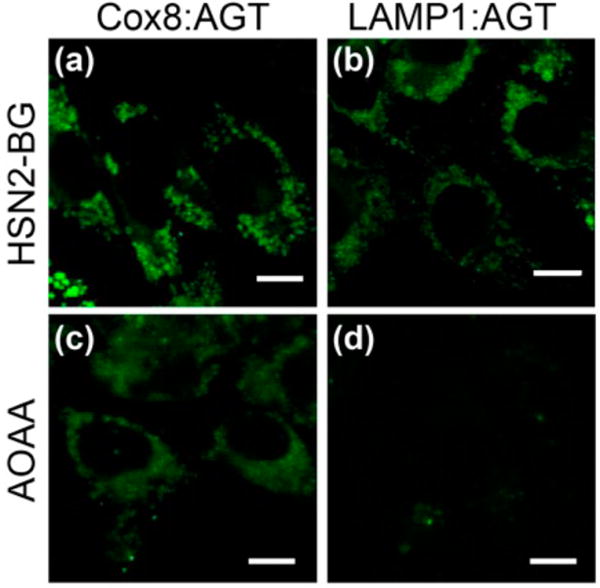
Detection of endogenously produced H2S within organelles of the cell. (top panels) Transiently transfected CHO cells with EYFP:AGT and HSN2-BG treatment (5 μM). (bottom panels) CHO cells treated under identical conditions but with AOAA (20 μM). Scale bars = 10 μm.
Figure 5.
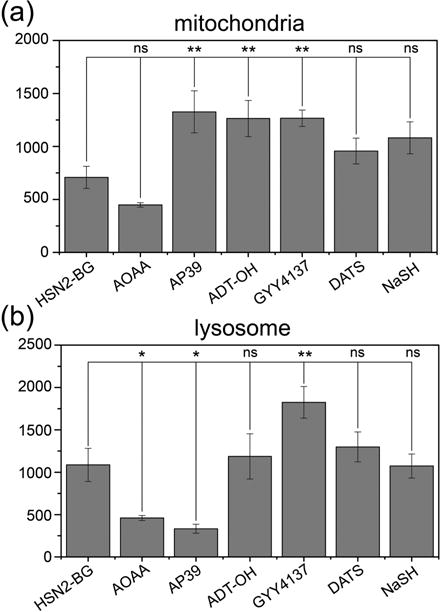
Quantification of fluorescence in CHO-K1 cells from HSN2-BG transiently transfected with (a) Cox8:EYFP:AGT and (b) LAMP1:EYFP:AGT. Cells were treated with 5 μM HSN2-BG and 20 μM AOAA, 100 nM AP39, 30 μM ADT–OH, 400 μM GYY4137, 10 μM DATS, or 50 μM NaSH. *p < 0.05, **p < 0.01.
On the basis of the endogenous H2S detection by HSN2-BG with AGT fusion constructs, we next used HSN2-BG to investigate the differential localization of H2S release from common synthetic donors in specific organelles. In choosing representative donor molecules, we focused on compounds that have been used widely in different biological studies, which included phosphinodithioate donor GYY4137, anethole dithiolethione (ADT–OH), diallyltrisulfide (DATS), and mitochondrially targeted AP39, as well as NaSH for comparison (Figure 4). We note that other useful small molecule donors are also available and refer the interested reader to a recent review on this topic.10 Although it was not possible to test each donor at identical concentrations, we elected to use donor concentrations that have been used commonly in previous reports focusing on the biological and pharmacological effects of these donor molecules.10 These concentrations included 100 nM for AP39, 30 μM ADT–OH, 400 μM GYY4137, 10 μM DATS, and 50 μM NaSH. The primary goal of these studies was not to measure or refine the eӽcacies of the different donor motifs, but rather to demonstrate the benefits of subcellular localization in differentiating H2S donation patters from different common donors. Of these selected donors, AP39 was designed to be a mitochondrially targeted H2S donor, but little is known about how other donors localize within cells.20
Figure 4.
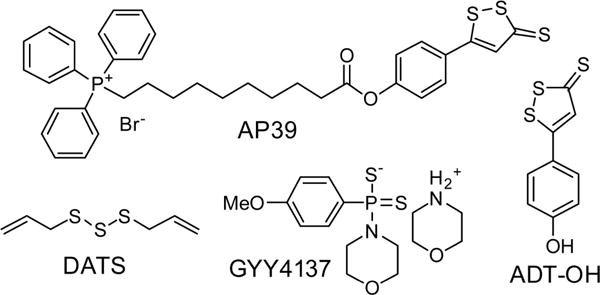
Chemical structures of common slow-release H2S donors investigated with HSN2-BG.
To investigate the distribution of sulfide released from the selected donor molecules, we treated CHO cells transfected with the different localized EYFP:AGT constructs and HSN2-BG with each of the selected donors and monitored the fluorescence (Figure 5). Addition of AP39, ADT–OH, and GYY4137 resulted in significant increases in sulfide levels in the mitochondria. Highlighting the eӽcacy of targeted donors, treatment with 100 nM of AP39 elicited a similar fluorescence response to 30 μM of ADT–OH or 400 μM GYY4137, which are consistent with previous reports of the higher eӽciency of AP39 in increasing cellular H2S levels than other common donors. By contrast to the mitochondria studies, different H2S signals were observed in the lysosome. Of these, only GYY4137 provided an increase in observed sulfide levels, which is consistent with the increased rate of H2S release from GYY4137 under acidic conditions. By comparison to the altered H2S levels observed with slow-releasing donor molecules, we note that 50 μM NaSH failed to elicit a significant fluorescence response within the cells, which is consistent with the rapid metabolism of high levels of free sulfide in biological milieu and highlights the eӽcacy of synthetic H2S donors in delivering H2S. Taken together, these results highlight the eӽcacy of using subcellular-localized H2S reports as a viable method for investigating the H2S release distribution and eӽciency of different types of H2S donors.
CONCLUSIONS
In conclusion, we have demonstrated that the use of AGT fusion proteins with a H2S selective sensor (HSN2-BG) allows for detection of endogenous H2S levels within specific cellular organelles. We leveraged the sensitivity and subcellular localization of these probes to investigate different commonly used H2S donating molecules and observed significantly different localization patterns from the different constructs. Taken together, these results provide new insights into the subcellular H2S release profiles of different H2S donors, which may contribute to the different observed physiological outcomes of using different H2S donor molecules in different contexts.
Supplementary Material
Acknowledgments
This work was supported by NIH Grant R01GM113030. The NMR facilities at the University of Oregon are supported by NSF/ARRA CHE-0923589. We thank the Prehoda and Nolan groups (UO) for use of laboratory equipment, the Guillemin group (UO) for cell culture assistance, and Ognjen Golub (UO) for assistance with molecular cloning experiments.
Footnotes
Supporting Information
The Supporting Information is available free of charge on the ACS Publications website at DOI: 10.1021/acs.analchem.6b00087.
Spectra, images, and selectivity plots (PDF).
Notes
The authors declare no competing financial interest.
References
- 1.Kumar N, Bhalla V, Kumar M. Coord Chem Rev. 2013;257:2335–2347. [Google Scholar]
- 2.Li Q, Lancaster JR., Jr Nitric Oxide. 2013;35:21–34. doi: 10.1016/j.niox.2013.07.001. [DOI] [PMC free article] [PubMed] [Google Scholar]
- 3.Lin VS, Chang CJ. Curr Opin Chem Biol. 2012;16:595–601. doi: 10.1016/j.cbpa.2012.07.014. [DOI] [PMC free article] [PubMed] [Google Scholar]
- 4.Lin VS, Chen W, Xian M, Chang CJ. Chem Soc Rev. 2015;44:4596–4618. doi: 10.1039/c4cs00298a. [DOI] [PMC free article] [PubMed] [Google Scholar]
- 5.Lippert AR. J Inorg Biochem. 2014;133:136–142. doi: 10.1016/j.jinorgbio.2013.10.010. [DOI] [PubMed] [Google Scholar]
- 6.Papapetropoulos A, Whiteman M, Cirino G. Br J Pharmacol. 2015;172:1633–1637. doi: 10.1111/bph.12806. [DOI] [PMC free article] [PubMed] [Google Scholar]
- 7.Song ZJ, Mei Ying N, Lee Z-W, Dai W, Hagen T, Moore PK, Huang D, Deng L-W, Tan C-H. MedChemComm. 2014;5:557–570. [Google Scholar]
- 8.Wallace JL, Wang R. Nat Rev Drug Discovery. 2015;14:329–345. doi: 10.1038/nrd4433. [DOI] [PubMed] [Google Scholar]
- 9.Pluth MD, Bailey TS, Hammers MD, Hartle MD, Henthorn HA, Stiger AK. Synlett. 2015;26:2633–2643. [Google Scholar]
- 10.Zhao Y, Biggs TD, Xian M. Chem Commun. 2014;50:11788–11805. doi: 10.1039/c4cc00968a. [DOI] [PMC free article] [PubMed] [Google Scholar]
- 11.Hartle MD, Pluth MD. Chem Soc Rev. 2016 doi: 10.1039/C6CS00212A. [DOI] [PMC free article] [PubMed] [Google Scholar]
- 12.Whiteman M, Winyard PG. Expert Rev Clin Pharmacol. 2011;4:13–32. doi: 10.1586/ecp.10.134. [DOI] [PubMed] [Google Scholar]
- 13.Murphy MP, Smith RAJ. Annu Rev Pharmacol Toxicol. 2007;47:629–656. doi: 10.1146/annurev.pharmtox.47.120505.105110. [DOI] [PubMed] [Google Scholar]
- 14.Chen S, Chen ZJ, Ren W, Ai HW. J Am Chem Soc. 2012;134:9589–9592. doi: 10.1021/ja303261d. [DOI] [PubMed] [Google Scholar]
- 15.Chen ZJ, Ai HW. Biochemistry. 2014;53:5966–5974. doi: 10.1021/bi500830d. [DOI] [PubMed] [Google Scholar]
- 16.Chen JW, Zhao MK, Jiang XQ, Sizovs A, Wang MC, Provost CR, Huang J, Wang J. Analyst. 2016;141:1209–1213. doi: 10.1039/c5an02497h. [DOI] [PMC free article] [PubMed] [Google Scholar]
- 17.Juillerat A, Gronemeyer T, Keppler A, Gendreizig S, Pick H, Vogel H, Johnsson K. Chem Biol. 2003;10:313–317. doi: 10.1016/s1074-5521(03)00068-1. [DOI] [PubMed] [Google Scholar]
- 18.Keppler A, Gendreizig S, Gronemeyer T, Pick H, Vogel H, Johnsson K. Nat Biotechnol. 2002;21:86–89. doi: 10.1038/nbt765. [DOI] [PubMed] [Google Scholar]
- 19.Los GV, Encell LP, McDougall MG, Hartzell DD, Karassina N, Zimprich C, Wood MG, Learish R, Ohane RF, Urh M, Simpson D, Mendez J, Zimmerman K, Otto P, Vidugiris G, Zhu J, Darzins A, Klaubert DH, Bulleit RF, Wood KV. ACS Chem Biol. 2008;3:373–382. doi: 10.1021/cb800025k. [DOI] [PubMed] [Google Scholar]
- 20.Le Trionnaire S, Perry A, Szczesny B, Szabo C, Winyard PG, Whatmore JL, Wood ME, Whiteman M. MedChemComm. 2014;5:728–736. [Google Scholar]
- 21.Keppler A, Kindermann M, Gendreizig S, Pick H, Vogel H, Johnsson K. Methods. 2004;32:437–444. doi: 10.1016/j.ymeth.2003.10.007. [DOI] [PubMed] [Google Scholar]
- 22.Li X, Lin Y, Wang Q, Yuan Y, Zhang H, Qian X. Eur J Med Chem. 2011;46:1274–1279. doi: 10.1016/j.ejmech.2011.01.050. [DOI] [PubMed] [Google Scholar]
- 23.Schneider CA, Rasband WS, Eliceiri KW. Nat Methods. 2012;9:671–675. doi: 10.1038/nmeth.2089. [DOI] [PMC free article] [PubMed] [Google Scholar]
- 24.Tomat E, Nolan EM, Jaworski J, Lippard SJ. J Am Chem Soc. 2008;130:15776–15777. doi: 10.1021/ja806634e. [DOI] [PMC free article] [PubMed] [Google Scholar]
- 25.Bannwarth M, Correa IR, Jr, Sztretye M, Pouvreau S, Fellay C, Aebischer A, Royer L, Rios E, Johnsson K. ACS Chem Biol. 2009;4:179–190. doi: 10.1021/cb800258g. [DOI] [PMC free article] [PubMed] [Google Scholar]
- 26.Srikun D, Albers AE, Nam CI, Iavarone AT, Chang CJ. J Am Chem Soc. 2010;132:4455–4465. doi: 10.1021/ja100117u. [DOI] [PMC free article] [PubMed] [Google Scholar]
- 27.Montoya LA, Pluth MD. Chem Commun. 2012;48:4767–4769. doi: 10.1039/c2cc30730h. [DOI] [PMC free article] [PubMed] [Google Scholar]
- 28.Ostrakhovitch EA, Akakura S, Sanokawa-Akakura R, Goodwin S, Tabibzadeh S. Exp Cell Res. 2015;330:135–150. doi: 10.1016/j.yexcr.2014.09.027. [DOI] [PubMed] [Google Scholar]
- 29.Sanokawa-Akakura R, Ostrakhovitch EA, Akakura S, Goodwin S, Tabibzadeh S. PLoS One. 2014;9:e108537. doi: 10.1371/journal.pone.0108537. [DOI] [PMC free article] [PubMed] [Google Scholar]
- 30.Sen S, Kawahara B, Gupta D, Tsai R, Khachatryan M, Roy-Chowdhuri S, Bose S, Yoon A, Faull K, Farias-Eisner R, Chaudhuri G. Free Radical Biol Med. 2015;86:228–238. doi: 10.1016/j.freeradbiomed.2015.05.024. [DOI] [PubMed] [Google Scholar]
- 31.We have observed previously that DTT results in partial reduction of common aryl azides used for H2S detection.
- 32.Stoehr K, Siegberg D, Ehrhard T, Lymperopoulos K, Oz S, Schulmeister S, Pfeifer AC, Bachmann J, Klingmueller U, Sourjik V, Herten D-P. Anal Chem. 2010;82:8186–8193. doi: 10.1021/ac101521y. [DOI] [PubMed] [Google Scholar]
- 33.Liu T-K, Hsieh P-Y, Zhuang Y-D, Hsia C-Y, Huang C-L, Lai H-P, Lin H-S, Chen IC, Hsu H-Y, Tan K-T. ACS Chem Biol. 2014;9:2359–2365. doi: 10.1021/cb500502n. [DOI] [PubMed] [Google Scholar]
- 34.Yadav PK, Yamada K, Chiku T, Koutmos M, Banerjee R. J Biol Chem. 2013;288:20002–20013. doi: 10.1074/jbc.M113.466177. [DOI] [PMC free article] [PubMed] [Google Scholar]
- 35.Abe K, Kimura H. J Neurosci. 1996;16:1066–1071. doi: 10.1523/JNEUROSCI.16-03-01066.1996. [DOI] [PMC free article] [PubMed] [Google Scholar]
- 36.Stipanuk MH, Beck PW. Biochem J. 1982;206:267–277. doi: 10.1042/bj2060267. [DOI] [PMC free article] [PubMed] [Google Scholar]
- 37.Hosoki R, Matsuki N, Kimura H. Biochem Biophys Res Commun. 1997;237:527–531. doi: 10.1006/bbrc.1997.6878. [DOI] [PubMed] [Google Scholar]
- 38.Robert K, Vialard F, Thiery E, Toyama K, Sinet PM, Janel N, London J. J Histochem Cytochem. 2003;51:363–371. doi: 10.1177/002215540305100311. [DOI] [PubMed] [Google Scholar]
- 39.Fu M, Zhang W, Wu L, Yang G, Li H, Wang R. Proc Natl Acad Sci U S A. 2012;109:2943–2948. doi: 10.1073/pnas.1115634109. [DOI] [PMC free article] [PubMed] [Google Scholar]
Associated Data
This section collects any data citations, data availability statements, or supplementary materials included in this article.


