

Abstract
Aims
The receptor for advanced glycation end products (RAGE) contributes to the development and progression of diabetic nephropathy. In this study, we examined if the protective effects afforded by RAGE blockade are via modulation of the renal AT-2 receptor.
Methods
Control and streptozotocin diabetic mice, wild type (WT) or deficient in either the angiotensin II type 2 receptor (AT-2 KO) or RAGE (RAGE KO), were studied for 24 weeks. Albumin excretion rate (AER), creatinine clearance (CrCl), renal cortical RAS components and RAGE expression were assessed.
Results
With diabetes, RAGE deficient mice had lower AER and attenuation of hyperfiltration, as compared with both diabetic WT and AT-2 deficient mice. Gene expression of RAGE was elevated in diabetic kidneys, while elevations in renal membranous RAGE expression were evident in WT and AT-2 KO mice with diabetes. Diabetic RAGE KO mice had an amelioration of diabetes induced increases in renal AT-2 gene expression. Although renal AT-2 protein expression was increased by diabetes in WT mice, it was further elevated in diabetic RAGE KO mice. Diabetes-induced increases in renal superoxide, were prevented in diabetic RAGE KO but not diabetic AT-2 KO mice. Adenoviral overexpression of RAGE or AGE treatment, decreased cell surface AT-2 expression, resulting in superoxide generation which was reversed by apocynin in primary mesangial cells.
Conclusions
We postulate that RAGE appears to be a common and key modulator of AT-2 receptor expression, which implicates a newly defined RAGE/AT-2 axis in the development and progression of diabetic nephropathy.
Introduction
The renin-angiotensin system (RAS) is a co-ordinated hormonal cascade, in which the protein angiotensin II (Ang II) elicits its effects by binding to cellular receptors, the angiotensin II type 1 receptor (AT1) or angiotensin II type 2 receptor (AT-2) (1–3). It is thought that AT1 and AT-2 receptors elicit opposing actions upon ligand interaction with Ang II, whereby ligation to the AT-1 is thought to promote vasoconstriction, cellular growth, proliferation and fibrosis. By contrast, the AT-2 receptor is thought to induce vasodilatation and natriuresis (4–7). While the systemic RAS is dampened with diabetes, there is evidence that the renal RAS is activated (8; 9). Not surprisingly, angiotensin II and its receptors play a major role in the pathogenesis and progression of diabetic complications including nephropathy. The most widely used therapies for these disorders are inhibitors of angiotensin converting enzyme-1 (ACE-1) (10; 11) and AT-1 receptor ligation (AT-1 antagonists) (12; 13) or their combination (14). Although effective, these compounds do not completely abrogate renal disease, with progression to end stage still occurring, albeit it at a slower rate. Given that more clinically desirable, earlier intervention with these compounds does not confer additional renoprotection (15; 16), the discovery of additional synergistic pathways as potential drug targets is of paramount importance for diabetic complications.
There is strong experimental evidence supporting a pathogenic role for the receptor for advanced glycation end products (RAGE) in diabetic renal disease. Indeed, RAGE knockout (KO) mice have less renal injury with diabetes (17; 18). Conversely, diabetic mice genetically manipulated to over-express RAGE have significant glomerulosclerosis (19; 20). Our group along with others have demonstrated important interactions between the RAS and advanced glycation in diabetic nephropathy, first recognised by the finding that ACE inhibitors (21; 22) and AT-1 antagonists (22–24) are potent inhibitors of AGE accumulation. We have also shown that administration of AGEs to rodents results in activation of the renal RAS in a manner similar to that seen with diabetes (25). Moreover, we have also demonstrated that the benefits of ACE-inhibitors on nephropathy may involve modulation of soluble RAGE levels in both experimental models and in type 1 diabetic patients (21). In addition, in cell culture, Ang II upregulates RAGE expression in podocytes, which was postulated to be via the AT-2 receptor (26). Since it is likely that the most rational approach to treat diabetic complications are combination therapies, studies have also demonstrated that there may be some synergistic effects afforded by blockade of both the RAS and AGE accumulation (23; 27).
Currently, compounds targeting advanced glycation by decreasing AGE formation or via RAGE antagonism, are under active investigation for the treatment of diabetic nephropathy. Hence, the aims of this study were to examine the effects of manipulating RAGE expression on the AT-2 receptor, in order to assist in the design of more rational combination therapies, which target both the RAS and AGEs for diabetic nephropathy (DN).
Materials and Methods
Animals
Mice deficient in either the AT-2 receptor (AT-2 KO) (28), RAGE (RAGE KO) (29; 30) which were crossed onto C57BL/6J background,(wild-type) (WT; C57BL/6J), were obtained from colonies maintained at the Alfred Medical Research and Education Precinct Animal Services (AMREP AS), Melbourne, Australia. The protocols followed for animal handling and experimentation were in accordance with ethical guidelines of the AMREP animal ethics committee and the National Health and Medical Research Council of Australia.
Experimental diabetes model
Groups of six week old (n=8–10/group) male mice were randomised to have diabetes induced via intraperitoneal injection with streptozotocin (50 mg/kg/day, MP Biomedicals, Eschwege, Germany) or sham injected with vehicle (sodium citrate buffer, pH4.5) for 5 consecutive days as previously described (31). On the sixth day, blood glucose was tested using Accu-Chek® Advantage II test strips (Roche Diagnostics GmbH, Mannheim, Germany), and only mice with a blood glucose reading of >15mmol/L were included (> 90% mice injected) into the diabetic groups of the study. Throughout the duration of the study, mice were given standard mouse chow and water ad libitum. After 24 weeks mice were anaesthetized with Euthal (10mg/kg; Delvet Limited, Seven Hills, Australia), followed by exsanguination by cardiac puncture. Plasma was obtained and kidneys removed and snap frozen for further analysis.
Measurement of physiological and biochemical parameters
During week 23 of the study, mice were individually placed in metabolic cages (Tecniplast®, VA, Italy), for a period of 24 hours. A blood sample was taken, body weight, food and water intake monitored and urine collected. Glycated haemoglobin (GHb) was measured in whole blood by high performance liquid chromatography as per the AMDCC protocol (32) (HPLC; CLC330 GHb Analyser; Primus, Kansas City, MO, USA). Systolic blood pressure (mmHg) was measured using the computerised non-invasive tail-cuff method (AD Instruments, Powerlab, Chart version 5.2.2, Bella Vista NSW, Australia) as previously described (21; 27).
Measurement of kidney function
Albumin excretion rates (AER) were measured in 24 hour urine collections by a Mouse Albumin ELISA Quantitation Set (Cat. No. E90-134, Bethyl Laboratories Inc, Montgomery, TX, USA) as per the manufacturer’s instructions. Creatinine clearance, corrected for body weight, was calculated using urine and plasma aliquots which were mixed with acetyl nitrile (sample 1:5), centrifuged at 4°C and the supernatant removed. The samples were then dried in a speedivac, resuspended in 10mM ammonium acetate, pH3.2 and injected into a C18 column (Waters Division of Millipore, Marlborough, MA, USA). HPLC was used for detection of creatinine at 235nm using a Hewlett Packard PDA detector.
Renal fractionation
In total, 50mg of renal cortex were homogenised (Polytron PT-MR2100, Kinematica, Switzerland) in extraction buffer (20mM HEPES buffer, pH7.2, 1mM EGTA, 210mM mannitol, 70mM sucrose) to isolate nuclear, cytosol, mitochondrial and membranous fractions as previously described (27; 33). Total protein for all fractions were determined by the Bicinchoninic acid method (Pierce, Rockford, IL, USA), according to the manufacturer’s protocol.
Renal superoxide production
Fresh kidney cortex pieces (1mm in size) were placed in oxygen-saturated Krebs buffer (containing 118mM NaCl, 4.7mM KCl, 1.2mM MgSO4.7H2O, 1.2mM KH2PO4, 11mM D-glucose, 0.03mM EDTA and 2.5mM CaCl2, pH7.4). The rate of cytosolic and mitochondrial superoxide anion production was determined by lucigenin, as described previously (17.).
Membranous RAGE expression
RAGE was measured in duplicate in 1:200 diluted membrane extracts using a DuoSet sandwich ELISA from R & D Systems (Minneapolis, MN, USA). The assay was performed according to the company’s instructions and the absorbance was measured at 540nm on the Victor 3 plate reader (Perkin Elmer 1420 multi-channel plate reader, Glen Waverley, Victoria, Australia).
Measurement of Angiotensin II
Angiotensin II was measured in mouse plasma and renal cytosolic samples acquired at the completion of the study, by a quantitative competitive sandwich enzyme immunoassay, AssayMax Human Angiotensin II ELISA Kit as per manufacturer’s instructions (Assaypro St. Charles, MO, USA). There are limitations to this assay as the antibody may cross-react with Ang I and Ang III to low levels.
Expression of AT-1and AT-2 receptors
A total of 35μg (for expression of AT-2 receptors) or 20μg (for expression of AT-1 receptors) of renal cortical membrane extracts were loaded onto 10% precise protein gels (Thermo Scientific, Rockford, IL, USA) and run in Tris-HEPES buffer at 120V for 60 mins. The protein was transferred onto a PVDF membrane (Immobilon, Millipore, Bedford, MA, USA) followed by blocking using 5% milk solution in PBST for 1 hour with agitation. The PVDF membranes were then hybridized overnight with their respective rabbit polyclonal IgG primary antibody prepared in 2.5% milk (AT-2 1:750 against peptide sequence CSQKP SDKHL DAIP (EZ Biolabs, Westfield, IL, USA; AT-1 1:750, Santa Cruz Biotechnology, Santa Cruz, CA, USA). The membrane was washed in PBST 3×10 minutes and the blot hybridized with 1:1000 secondary antibody anti-rabbit IgG (H+L) (Alpha diagnostic Intl. Inc., San Antonio, TX, USA). Following further washes, the blots were developed by incubating the blot in NuGlo (Luminol) ECL substrate (Alpha diagnostic Intl. Inc., San Antonio, TX, USA). The expression image was captured and quantified using the gel imaging system (Alpha Innotech Corporation, San Leandro, CA, USA). The receptor band was normalized by the total protein loading, which was quantified by imaging and analysing the total protein amount visible following Coomassie Brilliant Blue R-250 (EMD Chemicals Inc. Gibbstown, NJ, USA) staining of the membranes.
Quantitative Real-time Reverse transcription PCR (RT-PCR)
For all RT-PCR reactions, 6μg of total RNA extracted from kidney cortex was used to synthesis cDNA with the Superscript first-strand synthesis system for RT-PCR (Life Technologies Inc., Grand Island, NY, USA). Gene expression for Angiotensinogen, Renin AT-1a, Angiotensin II receptor type 2, RAGE, AGE-R1 and AGE-R3 were analysed by real-time quantitative RT-PCR using specific probes and primers (Table 1) employing the TaqMan system based on real-time detection of accumulated fluorescence (ABI Prism 7700, Perkin Elmer, Glen Waverley, Victoria, Australia). To control for variation in the amount of DNA available for PCR between samples, gene expression of the target sequence was normalised in relation to the expression of an endogenous multiplexed control, 18S ribosomal RNA as described previously (21; 34).
Table 1.
Probes and primer sequences used for real time RT-PCR analysis.
| Group | Body Weight (g) | Water (mL) | Food (g) | Urine (mL) | KW/BW ratio (×10−3) |
|---|---|---|---|---|---|
| WT | 36.3 ± 2.2 | 3.5 ± 0.9 | 2.58 ± 0.67 | 1.75 ± 0.29 | 0.98 ± 0.04 |
| WT D | 25.3 ± 1.9* | 35.2 ± 2.7* | 8.14 ± 0.41* | 34.86 ± 3.01* | 1.80 ± 0.22* |
| RAGE KO | 38.6 ± 3.3* | 3.5 ± 1.0 | 2.19 ± 0.64 | 0.62 ± 0.38* | 1.11 ± 0.08* |
| RAGE KO D | 26.2 ± 3.1† | 41.0 ± 5.6 †§ | 9.40 ± 0.70 †§ | 38.33 ± 5.49† | 1.81 ± 0.13† |
| AT-2 KO | 38.0 ± 3.9 | 5.1 ± 2.4 | 2.13 ± 0.70 | 1.47 ± 0.25 | 1.20± 0.19* |
| AT-2 KO D | 22.5 ± 2.1‡ | 22.9 ± 6.5‡§|| | 5.61 ± 1.15‡§|| | 24.50 ± 7.09‡§|| | 2.14 ± 0.18‡§|| |
Cell culture studies in primary mesangial cells
Our in-vitro studies were conducted in primary rat mesangial cells which are a homogenous population of cells which have been phenotyped as Thy 1.1 positive and negative for RECA-1 (endothelial cell marker) and P-vulgaris (epithelial cell marker) (35) and have previously been shown to express cell surface RAGE (33). In the first experiments, primary rat mesangial cells were incubated in the presence and absence of AGE-BSA or BSA 100μg/mL for 7 days in DMEM containing 25mM d-glucose or 25mM L-glucose. For RAGE overexpression, primary rat mesangial cells were infected with an adenovirus vector encoding for RAGE or its empty vector control and cultured in high-glucose (25mM DMEM) for 24hrs at 2.85×10⁸ PFU as previously described (17). On the second day cells were treated with either 100μg/mL of BSA or AGE- and cultured for a further 48hrs with some cells exposed to the antioxidant 1μM apocynin from day 2 to 3 (33). On the third day post-infection or seventh day for cells exposed to AGE-BSA or BSA alone, cells were washed and harvested by gentle scraping, centrifuged and the pellet resuspended in PBSF. Cells (1×10⁵ /tube) were then transferred to FACS tubes to stain for the expression of RAGE, AT-1 and AT-2 expression as previously described (33). Briefly, cells were stained with 10μL of RAGE (N-16), AT-1 (N-10) or AT-2 (H-143) (Santa Cruz, USA) for 30min, RT, washed and then sequentially stained with 1:500 dilution of PE-conjugated secondary antibody, Donkey-anti-Goat (RAGE) or Goat-anti-Rabbit (AT-1 and AT-2) (Southern Biotech, USA) for 30mins at RT in the dark. Following washing and resuspension in PBSF, a minimum of 10,000 events were acquired and positive cells were identified according to fluorescence intensity above relative to the secondary antibody alone using histogram analysis. Data was presented as percentage of control (L-glucose or ADGO). To quantify superoxide production, cultured cells were stained with 10μM Dihydroethidium (Molecular Probes, Invitrogen, Australia) (30mins, 37°C, in dark), washed with excess PBS without Mg+2 and Ca+2 and centrifuged and resuspended in 100 μL PBS and analysed by flow cytometry as described above.
Results
Metabolic and Physiological Parameters
As expected, all diabetic groups had elevations in both plasma glucose and glycated haemoglobin concentrations (Figure 1A&B). Furthermore, systolic blood pressure was modestly decreased in diabetic wild type mice, but was not altered in either diabetic RAGE or AT-2 deficient mice (Figure 1C). In addition, diabetic mice consumed more water and food, had a greater urine output and a corresponding decrease in body-weight (Table 2), although AT-2 deficient mice consumed less water and had a lower urinary output. Kidney to body weight ratios were also greater in all diabetic mice (Table 2), which was further increased in the diabetic AT-2 deficient mice.
Figure 1. Metabolic measures in diabetic and non-diabetic mice at week 24.

(A) Plasma glucose and (B) Glycated Haemoglobin were measured in plasma and whole blood respectively collected from all mice at the completion of the study. C) Mean systolic blood pressure by tail cuff plethysmography. Data presented as Mean ± SD (n=10/group). WT – Wild Type, WT D – Wild Type Diabetic, RAGE KO – RAGE Knockout, AT-2 KO – Angiotensin II type 2 receptor Knockout. * p <0.05 vs WT, † p <0.05 vs RAGE KO, ‡ p <0.05 vs AT-2 KO, § p <0.05 vs RAGE KOD, ¶ p <0.05 vs WTD.
Table 2.
Physiological parameters in diabetic and non-diabetic mice.
| Gene Target | Gene Bank Accession Number | Probe 5′-3′ | Forward Primer 5′-3′ | Reverse Primer 5′-3′ |
|---|---|---|---|---|
| Advanced glycosylation end product specific receptor – (RAGE) | NM_007425 | 6-FAM CACAGCCCGGATTG |
GCTGTAGCTGGTGGTCAGAACA | CCCCTTACAGCTTAGCACAAGTG |
| Advanced glycation end products - receptor 1 (AGER1) | D89063 | 6- FAM ATCAACGTGGAGACCAT |
CCCGTCGGTGGAAGATTTT | GCTGCCGCCACCATCA |
| Advanced glycation end products-receptor 3 (AGER3) | X16834 | 6- FAM CTGGCTCTGGAAACC |
CAGACAGCTTTTCGCTTAACGA | CCATGCACCCGGATATCC |
| Angiotensinogen | NM_007428 | 6- FAM CCTCCTCGAACTCAAA |
AGTGGGAGAGGTTCTCAATAGCA | GACGTGGTCGGCTGTTCCT |
| Angiotensin II Type 1a Receptor (AT1a) | NM_177322 | 6-FAM TCTCGCCTCCGCCG |
CCATTGTCCACCCGATGAA | TGACTTTGGCCACCAGCAT |
| Angiotensin II Type 2 Receptor – (AT-2) | BC003811 | 6-FAM AATCGGTCATCTACCC |
ATTACCTGCATGAGTGTCGATAGG | GGGATTCCTTCTTTGAGACAGAAA |
| Renin | NM_031192 | 6-FAM TTCGCCTTGGCCCGC |
GGCATAACAATCGCATTGGA | GGACAAAGCCAGACAAAATGG |
Data was collected at the end of the study and is presented as Mean ± SD. WT – Wild Type, WT D – Wild Type Diabetic, RAGE KO – RAGE Knockout mice, AT-2 KO – Angiotensin II receptor type 2 Knockout mice.
p <0.05 vs WT,
p <0.05 vs RAGE KO,
p <0.05 vs AT-2 KO,
p <0.05 vs WT D,
p <0.05 vs RAGE KO D.
Renal Function
Increases in urinary albumin excretion rate (AER) were evident with diabetes in wild-type and AT-2 mouse groups (Figure 2A&B). Importantly, an increase in AER was not seen in diabetic RAGE deficient mice as compared with diabetic wild type mice (Figure 2A) While diabetes induced hyperfiltration in wild type mice, this was prevented in diabetic RAGE deficient mice (Figure 2C) and to a lesser extent in AT-2 deficient diabetic mice (Figure 2D). Interestingly, the control AT-2 KO mice had lower creatinine clearance rates when compared to the WT mice.
Figure 2. RAGE KO provides superior renoprotection with diabetes than AT-2 receptor deficiency.

(A–B) Twenty four hour albumin excretion rates (AER) and (C–D) creatinine clearances were quantitated on plasma and urine samples collected from all mice with and without diabetes at study completion. AER and creatinine clearance were quantitated using ELISA and HPLC respectively. Since AER data was not normally distributed it is expressed as geometric mean ± tolerance factors. Values expressed as mean ± SD (n=10/group). WT – Wild Type, WT D – Wild Type Diabetic, RAGE KO – RAGE Knockout, AT-2R KO – Angiotensin II type 2 receptor Knockout.* p <0.05 vs WT, † p<0.05 vs AT-2 KO, ‡ p<0.05 vs WT D, § p < 0.05 vs RAGE KO D
Renal RAGE expression and Superoxide Production
RAGE gene expression was elevated with diabetes in the wild-type and AT-2 KO mouse groups, and as expected was not detectable in RAGE KO mice (Figure 3A). Elevations in renal membranous RAGE expression were also seen in both wild type and AT-2 KO mice with diabetes (Figure 3B). Excess renal cytosolic and mitochondrial superoxide generation were demonstrated in wild type diabetic mice (Figures 3C and D), which was attenuated only with RAGE deletion. By contrast, AT-2 KO mice exhibited significantly higher renal superoxide production relative to the wild-type groups (Figures 3C and D), which remained unaffected by diabetes.
Figure 3. Renal RAGE expression and superoxide production.
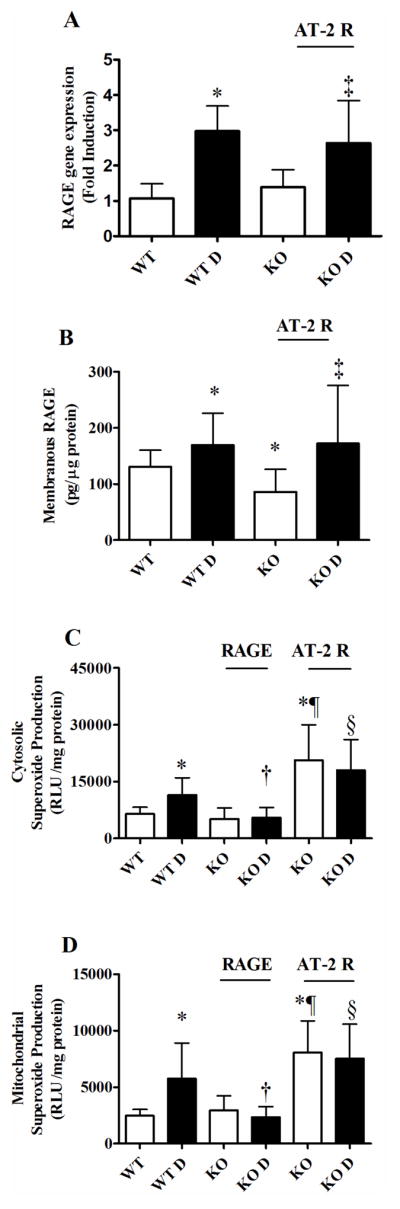
At completion of the study renal tissue was collected to measure (A) RAGE gene expression by RT-PCR, (B) Renal membranous RAGE protein expression by ELISA, and (C) cytosolic and (D) mitochondrial superoxide production by lucigenin substrate enhanced chemiluminescence. Data presented as mean ± SD (n=10/group). WT – Wild Type, WT D – Wild Type Diabetic, RAGE KO – RAGE Knockout, AT-2R KO – Angiotensin II type 2 receptor Knockout.
* p<0.05 vs WT, † p<0.05 vs WT D, ‡ p<0.05 vs AT-2 KO, § p<0.05 vs RAGE KO D, ¶ p <0.05 vs RAGE KO
Components of the Renin-Angiotensin System
Renin gene expression was elevated with diabetes in wild type mice. However this increase in renin mRNA was not observed in the diabetic RAGE or AT-2 KO mice (Table 3). The gene expression of angiotensinogen was also significantly elevated with diabetes, but remained unaffected by RAGE or AT-2 deficiency (Table 3). Although unchanged with diabetes in wild type and RAGE KO mice, circulating levels of Angiotensin II were significantly lower in diabetic AT-2 KO mice (Table 3). Renal cortical cytosolic Ang II levels, were also unchanged with diabetes in wild type mice, however, were modestly elevated in diabetic RAGE KO mice (Table 3). By contrast, both control and diabetic AT-2 KO mice had significantly higher renal cytosolic concentrations of Ang II (Table 3).
Table 3. Renal gene and circulating expression of RAS components and AGE-receptors.
Gene expression levels of AT-1a, AGE-R1, AGE-R3, renin and angiotensinogen were quantitated by real-time RT-PCR on renal tissues collected at the completion of the study. The protein expression of AT-1 receptor was measured in membranous fraction of renal cortex by western immunoblotting and corrected for total protein. Angiotensin II was quantitated by ELISA within plasma and renal cytosolic fractions in all groups at week 24 of the study.
| Group | AT-1a gene | AT-1protein | AGE-R1 | AGE-R3 | Renin | Angiotensinogen | Ang II Plasma (pg/mL) | Ang II Cytosol (pg/mL) |
|---|---|---|---|---|---|---|---|---|
| WT | 1.47 ± 1.04 | 1.00 ± 0.00 | 0.97 ± 0.18 | 1.26 ± 0.91 | 1.02 ± 0.23 | 1.04 ± 0.12 | 791.7 ± 71.9 | 0.04 ± 0.06 |
| WT D | 1.22 ± 0.67 | 0.83 ± 0.30 | 1.14 ± 0.17 | 1.47 ± 0.72 | 2.24 ± 2.23 | 1.34 ± 0.42* | 833.6 ± 128.0 | 0.02 ± 0.04 |
| RAGE KO | 3.12 ± 1.65* | 0.41± 0.12* | 0.53 ± 0.09* | 0.72 ± 0.20 | 0.93 ± 0.26 | 1.24 ± 0.28 | 809.9 ± 125.3 | 0.07 ± 0.06 |
| RAGE KO D | 2.17 ± 1.59 | 0.77 ± 0.16‡ | 0.67 ± 0.05†‡ | 1.13 ± 0.38‡ | 1.25 ± 0.44‡ | 2.07 ± 0.95‡ | 753.9 ± 56.3 | 0.09 ± 0.06† |
| AT-2 KO | 5.07 ± 1.93*‡ | 0.25 ± 0.11* | 0.70 ± 0.08 *‡ | 0.95 ± 0.41 | 0.71 ± 0.23* | 0.70 ± 0.12*‡ | 251.6 ± 94.2*‡ | 0.61 ± 0.26*‡ |
| AT-2 KO D | 4.13 ± 1.38† | 0.40 ± 0.32 | 0.68 ± 0.15† | 2.16 ± 0.75§|| | 0.50 ± 0.24† | 1.69 ± 0.29|| | 70.8 ± 48.6†§|| | 0.61 ± 0.35†§ |
Data presented as mean ± SD. WT – Wild Type, WT D – Wild Type Diabetic, RAGE KO – RAGE Knockout, AT-2 KO – Angiotensin II receptor type 2 Knockout, Ang II Plasma – circulating levels of angiotensin II, Ang II Cytosol – Angiotensin II levels within the renal cytosol.
p<0.05 vs WT,
p<0.05 vs WT D,
p<0.05 vs RAGE KO,
p<0.05 vs RAGE KO D,
p<0.05 vs AT-2 KO.
Renal cortical AT-1a gene expression was elevated by RAGE and AT-2 deficiency in the absence of diabetes (Table 3). However, there were no changes seen in the gene expression of AT-1a with diabetes in RAGE KO mice in contrast to elevations in AT-1a gene expression in diabetic AT-2 KO mice (Table 3). Western immunoblotting showed a lower expression of membranous AT-1 receptor in both RAGE and AT-2 KO control mice (Table 3). However, there were no differences seen among all groups of diabetic mice for AT-1 protein expression (Table 3).
Renal AT-2 gene was significantly increased with diabetes in wild type mice, which was ameliorated in diabetic RAGE KO mice (Figure 4A). Renal cortical membranous expression of AT-2 protein was also modestly elevated in diabetic WT mice and interestingly this was further increased by ~ 4 fold in diabetic RAGE KO mice (Figure 4C).
Figure 4. Modulation of the Angiotensin II Type 2 receptor by RAGE.

Renal AT-2 expression were quantitated at the gene and protein level on tissue collected at the completion of the study (n=10/group). (A) Gene levels of AT-2 in renal cortex were measured by RT-PCR. (B) Representative western blot of AT-2 expression in renal membranes from c57 (WT) and RAGE KO (RAGE) control and diabetic. (C) The protein expression of AT-2 receptor was measured on membranous fraction of renal cortex by western immunoblotting and corrected for total protein. Data presented as mean ± SD. WT – Wild Type, WT D – Wild Type Diabetic, RAGE KO – RAGE Knockout, AT-2 KO – Angiotensin II receptor type 2 Knockout.
* p<0.05 vs WT, † p<0.05 vs WT D, ‡ p<0.05 vs RAGE KO.
In-vitro modulation of AT receptors by RAGE
Based on our in-vivo findings demonstrating potential interactions between RAGE and various components of the RAS, in particular the likelihood that RAGE influences the expression of the AT-2 receptor, a series of in-vitro studies in mesangial cells were performed. AGE-BSA, treatment of mesangial cells in high glucose conditions, increased cell surface RAGE expression (Figure 5A) and resulted in excess ROS production as measured by DHE (Figure 5D). In addition, while cell surface AT-1 receptor expression tended to be elevated, there was a concomitant decline in AT-2 receptor expression with AGE-BSA treatment (Figures 5B and 5C). Overexpression of RAGE in primary mesangial cells induced an up-regulation of RAGE on the cell surface (Figure 5E). AGE-BSA treatment further enhanced the cell surface expression of RAGE (Figure 5E) and ROS production (Figure 5H), which were prevented by concomitant incubation with the antioxidant apocynin (Figure 5F). Furthermore, RAGE overexpression decreased cell surface AT-2 receptor expression in primary mesangial cells, which was abrogated with apocynin (Figure 5G). The AT-1 receptor was elevated by RAGE overexpression. Furthermore, AT-1 receptor expression declined with co-administration of ad RAGE adenovirus in the presence of AGE-BSA, but this was not altered by apocynin (Figure 5F).
Figure 5. AGE-RAGE interactions modulate AT-2 receptor expression in primary mesangial cells.

(A–D) Primary mesangial cells were treated with 100μg/mL AGE-BSA. Data is representative of duplicate experiments (n=3–4/group/experiment). (A) Cell surface RAGE (B) AT-1 (C) and AT-2 receptor expression by flow cytometry. (D) Intracellular ROS production was measured by DHE and flow cytometry. (E–H) Mesangial cells were infected with an adenovirus overexpressing human full length RAGE and treated with/without 100μg/mL BSA or AGE-BSA. Cells were analysed by flow cytometry for the cell surface expression of (E) RAGE, (F) AT-1, (G) or the AT-2 receptor in addition to (H) intracellular ROS production. Data presented as mean ± SD. L-GLU – 25mM L-glucose control, UNT – untreated cells cultured in 25mM D-glucose, ADGO – adenoviral empty vector control RAGE BSA – cells infected with RAGE adenovirus and treated with BSA, RAGE AGE – Cells infected with RAGE adenovirus and treated with AGE-BSA, RAGE AGE APO – Cells infected with RAGE and treated with AGE-BSA in the presence of 1μM Apocynin *p<0.05 vs L-GLU, †p<0.05 vs UNT, ‡p<0.05 vBSA §p<0.05 vs AGE-BSA, ||p < 0.05 vs ADGO, ¶p < 0.05 vs RAGE BSA, # p < 0.05vs RAGE AGE BSA.
Discussion
This group of studies has investigated the relationship between RAGE and the AT-2 receptor in the development of diabetic renal disease. We first identified that a deficiency in the RAGE receptor but not the AT-2 receptor, prevented various diabetes related renal changes including hyperfiltration and albuminuria, as seen in diabetic wild type mice, in the absence of any effects on glycaemic control. Furthermore, diabetic RAGE KO mice had an increase in the expression of the AT-2 receptor and a decline in diabetes-associated renal mitochondrial and cytosolic superoxide production, changes that were not seen in diabetic AT-2 KO mice. Consistent with these in-vivo findings, RAGE adenoviral overexpression in primary mesangial cells, as well as exposure to the well-described RAGE ligand, AGE-BSA, which also elevated cell surface RAGE expression, induced a decrease in the cell surface expression of the AT-2 receptor, in the context of excess cellular superoxide production. Thus, these findings suggest that RAGE plays a pivotal role in modulating renal AT-2 receptor expression, particularly in the context of hyperglycaemia, as seen in diabetes (Figure 6).
Figure 6. Schematic diagram of the postulated interactions among pathogenic pathways in the development of diabetic renal disease.

AGEs – advanced glycation end products, RAGE – receptor for AGEs, AT2 – angiotensin II Type 2 receptor, ROS – reactive oxygen species, AngII – angiotensin II
We and others have previously described the amelioration of diabetic nephropathy in chronically diabetic RAGE KO mice (17; 18). Therefore it is not surprising that in the present study, diabetic RAGE KO mice followed for 24 weeks had a reduction in albuminuria when compared to C57BL/6J (wild type) mice with diabetes. Importantly, the wild type C57BL/6J strain used in the present study are more susceptible to renal injury in diabetes than previously reported (36) and this has been attributed to their decreased expression of the nicotinamide nucleotide transhydrogenase due to mutation of this gene (37). By contrast, AT-2 deficient mice, bred on the same background C57BL/6J strain, demonstrated no protection against diabetes induced renal injury. Although this is studied for the first time in the context of diabetes within the present study, the role of the AT-2 receptor as a protective receptor has been suggested previously in other models of chronic kidney disease in AT-2 deficient mice (38).
One important emerging function of the AT2 receptor is the attenuation of the physiological effects mediated by the AT1 subtype. In numerous studies, including knockout experiments, the AT2 receptor has been shown to counteract the effects of Ang II mediated by the AT1 receptor, suggesting that AT2 might provide a brake for the peptide signal. Since Ang II binds to the two receptor subtypes, AT1 and AT2, with similar affinity, the cellular response is likely to be highly dependent on the relative expression level and/or responsiveness of both receptors (39). Indeed in the present study, there was no increase in renal membranous AT1 receptor expression in diabetic WT mice, despite a 4–5 fold increase in gene expression of the AT1a receptor in AT-2 KO mice. This discrepancy may be due to the differences in measurement of AT1 receptor in the membrane by immunoblotting versus total cortical AT-1a mRNA used for the gene studies. In contrast, while RAGE KO mice had no increases in the AT1 receptor, diabetic RAGE KO mice had elevated membranous AT-2 expression in the context of higher renal expression of AngII. This suggests that once kidney disease is established, the presence of AngII may in fact be protective if it remains below the concentrations required to modulate increased AT1 receptor expression. Furthermore, in the present study, mesangial cells overexpressing RAGE had an increase in the expression of the AT-1a receptor in the context of a significant decline in AT-2 cell surface expression and enhanced superoxide generation. Interestingly, blockade of ROS production by apocynin restored cell surface AT-2 expression, while the AT-1 receptor remained unaffected, suggesting that the loss of AT-2 is the major pathway for promoting superoxide generation in this model. This was also the case in our in vivo studies where diabetes induced ROS generation was attenuated in RAGE KO mice when renal AT2 receptors were increased in the absence effects on the AT1 receptor. Interestingly, inhibition of the AT-2 receptor by PD123319 has been shown to be ineffective in preventing generation of ROS (40; 41), although this may be due to its lack of specificity for the AT-2 receptor. However, AT-2 is thought to be a counter-balance to the NADPH-mediated increases in ROS generation signalled via the AT-1 receptor, although our current findings suggest an additional role for the AT-2 receptor in superoxide generation independent of AT-1. Indeed, signalling via the AT-2 receptor is thought to induce the expression of bradykinin and nitric oxide, in addition to promoting growth inhibition, apoptosis and vasodilation in an attempt to counteract elevations in ROS (42; 43). It is therefore not surprising, that we have demonstrated that a loss of AT-2 expression is associated with increased renal superoxide production in diabetes and shown for the first time that this phenomenon appears to be mediated by RAGE.
AGE-mediated increases in RAGE expression and subsequent modulation of down-stream pathways which lead to the development of diabetic nephropathy, have been previously reported by our group and others (17; 33; 44; 45). In our present studies, increases in renal RAGE mRNA and renal membrane RAGE protein expression, were associated with increases in both renal mitochondrial and cytosolic superoxide production in the presence of AGEs, which is consistent with previous studies from our group demonstrating that increased ligation of AGEs to renal RAGE induces an increase in cytosolic ROS production which subsequently drives mitochondrial ROS (17). Moreover, in our present study, we found that elevated levels of ROS production, were seen with RAGE overexpression only in the presence of AGE-BSA. This further highlights, the importance of RAGE as a central and key modulator of both AGEs and RAS, which conjointly drive the development of DN. In addition, the antioxidant apocynin, prevented ROS production in mesangial cells which is consistent with our previous studies showing improvements in renal ROS production and renoprotection in diabetic rodents treated with apocynin (17; 33).
The absence of the AT-2 receptor has been postulated to lead to vascular and renal hypersensitivity to Ang II, including sustained anti-natriuresis and hypertension (46). In addition, increased levels of AT-1 (47), decrease levels of bradykinin and cGMP (42), which increased interstitial fluid levels of prostaglandins (48) and enhanced fibrosis within the kidney of AT-2 KO mice (5). As AT-2 KO mice did not have increases in circulating AngII in the present study, this may explain the absence of hypertension in these mice. This is in contrast to previous studies in AT-2 KO mice on a mixed background, although this may be due to the pure C57BL/6J background used in the present study. Interesting however, were the local elevations in renal AngII levels. Furthermore, AT-2 KO mice did not adapt their water intake in response to diabetes to the same degree as was seen WT and in particular RAGE KO mice. Indeed, previous studies have shown that AT-2 KO mice do not respond to AngII mediated signals to increase water intake (49; 50). This was also reflected by the lower glomerular filtration rate and urinary output seen in diabetic AT-2 KO mice in the present study.
A decline in renal RAGE expression was associated with an increase in renal cortical AT-2 receptor expression in the current study. Importantly, this finding was supported by our mesangial cell studies where either induction of RAGE with AGEs or RAGE adenoviral overexpression resulted in a decline in the cell surface expression of the AT-2 receptor subtype. A previous study in podocytes has suggested that RAGE expression itself can be modulated by the AT-2 receptor (26). However, we did not identify specific changes in renal RAGE gene or protein expression in AT-2 deficient mice. This is possibly due to the diversity of cell types present within renal tissues, with the podocyte, being only one of more than six resident cell types in the kidney.
Hence, within the present study we have identified that the receptor for advanced glycation end products appears to confer at least some of its renoprotective effects via modulation of the AT-2 receptor in diabetic renal disease (Figure 6). Of particular interest was the finding that manipulation of RAGE resulted in direct effects on the renal expression of the AT-2 receptor in diabetes, most likely via direct induction of ROS. Indeed for the first time, we suggest that AT-2 receptor deficiency is associated with enhanced renal disease in diabetes, while confirming that RAGE deficiency is protective. Taken together, these results suggest that RAGE antagonists, which are currently under clinical investigation for Alzheimer’s disease and under consideration for diabetic complications, may have multiple effects in diabetic renal disease not only via modulation of both RAGE but also the AT-2 receptor subtype.
Acknowledgments
The authors would like to thank Kylie Gilbert for her expert care of the animals throughout the study and Sally Penfold, Maryann Arnstein and Edward Grixti for their technical expertise. This work was completed with support from the Juvenile Diabetes Research Foundation (JDRF) and the National Health and Medical Research Council of Australia (NHMRC). Josephine Forbes is a JDRF Career Development Fellow. Mark Cooper is an Australia Fellow of the NHMRC and a JDRF Scholar. Audrey Koitka is supported by an Association de Langue Française pour l’Etude du Diabète et des Maladies Métaboliques (ALFEDIAM) fellowship as well as grants awarded to MEC in the field of diabetes and atherosclerosis from National Institutes of Health (NIH). Terri Allen is a recipient of a NHMRC Senior Research Fellowship. Merlin Thomas is supported by Kidney Health Australia (Bootle Award) and NHMRC grants.
Footnotes
Disclosures:
The authors have nothing to disclose
References
- 1.Mukoyama M, Nakajima M, Horiuchi M, Sasamura H, Pratt RE, Dzau VJ. Expression cloning of type 2 angiotensin II receptor reveals a unique class of seven-transmembrane receptors. J Biol Chem. 1993;268:24539–24542. [PubMed] [Google Scholar]
- 2.Murphy TJ, Alexander RW, Griendling KK, Runge MS, Bernstein KE. Isolation of a cDNA encoding the vascular type-1 angiotensin II receptor. Nature. 1991;351:233–236. doi: 10.1038/351233a0. [DOI] [PubMed] [Google Scholar]
- 3.Ribeiro-Oliveira A, Jr, Nogueira AI, Pereira RM, Boas WW, Dos Santos RA, Simoes e Silva AC. The renin-angiotensin system and diabetes: an update. Vasc Health Risk Manag. 2008;4:787–803. [PMC free article] [PubMed] [Google Scholar]
- 4.Morrissey JJ, Klahr S. Effect of AT2 receptor blockade on the pathogenesis of renal fibrosis. Am J Physiol. 1999;276:F39–45. doi: 10.1152/ajprenal.1999.276.1.F39. [DOI] [PubMed] [Google Scholar]
- 5.Ma J, Nishimura H, Fogo A, Kon V, Inagami T, Ichikawa I. Accelerated fibrosis and collagen deposition develop in the renal interstitium of angiotensin type 2 receptor null mutant mice during ureteral obstruction. Kidney Int. 1998;53:937–944. doi: 10.1111/j.1523-1755.1998.00893.x. [DOI] [PubMed] [Google Scholar]
- 6.Arima S, Endo Y, Yaoita H, Omata K, Ogawa S, Tsunoda K, Abe M, Takeuchi K, Abe K, Ito S. Possible role of P-450 metabolite of arachidonic acid in vasodilator mechanism of angiotensin II type 2 receptor in the isolated microperfused rabbit afferent arteriole. J Clin Invest. 1997;100:2816–2823. doi: 10.1172/JCI119829. [DOI] [PMC free article] [PubMed] [Google Scholar]
- 7.van Esch JH, Schuijt MP, Sayed J, Choudhry Y, Walther T, Jan Danser AH. AT2 receptor-mediated vasodilation in the mouse heart depends on AT1A receptor activation. Br J Pharmacol. 2006;148:452–458. doi: 10.1038/sj.bjp.0706762. [DOI] [PMC free article] [PubMed] [Google Scholar]
- 8.Miyazaki M, Takai S. Tissue angiotensin II generating system by angiotensin-converting enzyme and chymase. J Pharmacol Sci. 2006;100:391–397. doi: 10.1254/jphs.cpj06008x. [DOI] [PubMed] [Google Scholar]
- 9.Wolf G. New insights into the pathophysiology of diabetic nephropathy: from haemodynamics to molecular pathology. Eur J Clin Invest. 2004;34:785–796. doi: 10.1111/j.1365-2362.2004.01429.x. [DOI] [PubMed] [Google Scholar]
- 10.Tight blood pressure control and risk of macrovascular and microvascular complications in type 2 diabetes: UKPDS 38. UK Prospective Diabetes Study Group. Bmj. 1998;317:703–713. [PMC free article] [PubMed] [Google Scholar]
- 11.Lewis EJ, Hunsicker LG, Bain RP, Rohde RD. The effect of angiotensin-converting-enzyme inhibition on diabetic nephropathy. The Collaborative Study Group. N Engl J Med. 1993;329:1456–1462. doi: 10.1056/NEJM199311113292004. [DOI] [PubMed] [Google Scholar]
- 12.Brenner BM, Cooper ME, de Zeeuw D, Grunfeld JP, Keane WF, Kurokawa K, McGill JB, Mitch WE, Parving HH, Remuzzi G, Ribeiro AB, Schluchter MD, Snavely D, Zhang Z, Simpson R, Ramjit D, Shahinfar S. The losartan renal protection study--rationale, study design and baseline characteristics of RENAAL (Reduction of Endpoints in NIDDM with the Angiotensin II Antagonist Losartan) J Renin Angiotensin Aldosterone Syst. 2000;1:328–335. doi: 10.3317/jraas.2000.062. [DOI] [PubMed] [Google Scholar]
- 13.Brenner BM, Cooper ME, de Zeeuw D, Keane WF, Mitch WE, Parving HH, Remuzzi G, Snapinn SM, Zhang Z, Shahinfar S. Effects of losartan on renal and cardiovascular outcomes in patients with type 2 diabetes and nephropathy. N Engl J Med. 2001;345:861–869. doi: 10.1056/NEJMoa011161. [DOI] [PubMed] [Google Scholar]
- 14.Mogensen CE, Neldam S, Tikkanen I, Oren S, Viskoper R, Watts RW, Cooper ME. Randomised controlled trial of dual blockade of renin-angiotensin system in patients with hypertension, microalbuminuria, and non-insulin dependent diabetes: the candesartan and lisinopril microalbuminuria (CALM) study. BMJ. 2000;321:1440–1444. doi: 10.1136/bmj.321.7274.1440. [DOI] [PMC free article] [PubMed] [Google Scholar]
- 15.Mauer M, Zinman B, Gardiner R, Suissa S, Sinaiko A, Strand T, Drummond K, Donnelly S, Goodyer P, Gubler MC, Klein R. Renal and retinal effects of enalapril and losartan in type 1 diabetes. N Engl J Med. 2009;361:40–51. doi: 10.1056/NEJMoa0808400. [DOI] [PMC free article] [PubMed] [Google Scholar]
- 16.Bilous R, Chaturvedi N, Sjolie AK, Fuller J, Klein R, Orchard T, Porta M, Parving HH. Effect of candesartan on microalbuminuria and albumin excretion rate in diabetes: three randomized trials. Ann Intern Med. 2009;151:11–20. W13–14. doi: 10.7326/0003-4819-151-1-200907070-00120. [DOI] [PubMed] [Google Scholar]
- 17.Coughlan MT, Thorburn DR, Penfold SA, Laskowski A, Harcourt BE, Sourris KC, Tan AL, Fukami K, Thallas-Bonke V, Nawroth PP, Brownlee M, Bierhaus A, Cooper ME, Forbes JM. RAGE-induced cytosolic ROS promote mitochondrial superoxide generation in diabetes. J Am Soc Nephrol. 2009;20:742–752. doi: 10.1681/ASN.2008050514. [DOI] [PMC free article] [PubMed] [Google Scholar]
- 18.Myint KM, Yamamoto Y, Doi T, Kato I, Harashima A, Yonekura H, Watanabe T, Shinohara H, Takeuchi M, Tsuneyama K, Hashimoto N, Asano M, Takasawa S, Okamoto H, Yamamoto H. RAGE control of diabetic nephropathy in a mouse model: effects of RAGE gene disruption and administration of low-molecular weight heparin. Diabetes. 2006;55:2510–2522. doi: 10.2337/db06-0221. [DOI] [PubMed] [Google Scholar]
- 19.Yamamoto Y, Kato I, Doi T, Yonekura H, Ohashi S, Takeuchi M, Watanabe T, Yamagishi S, Sakurai S, Takasawa S, Okamoto H, Yamamoto H. Development and prevention of advanced diabetic nephropathy in RAGE-overexpressing mice. J Clin Invest. 2001;108:261–268. doi: 10.1172/JCI11771. [DOI] [PMC free article] [PubMed] [Google Scholar]
- 20.Inagi R, Yamamoto Y, Nangaku M, Usuda N, Okamato H, Kurokawa K, van Ypersele de Strihou C, Yamamoto H, Miyata T. A severe diabetic nephropathy model with early development of nodule-like lesions induced by megsin overexpression in RAGE/iNOS transgenic mice. Diabetes. 2006;55:356–366. doi: 10.2337/diabetes.55.02.06.db05-0702. [DOI] [PubMed] [Google Scholar]
- 21.Forbes JM, Thorpe SR, Thallas-Bonke V, Pete J, Thomas MC, Deemer ER, Bassal S, El-Osta A, Long DM, Panagiotopoulos S, Jerums G, Osicka TM, Cooper ME. Modulation of soluble receptor for advanced glycation end products by angiotensin-converting enzyme-1 inhibition in diabetic nephropathy. J Am Soc Nephrol. 2005;16:2363–2372. doi: 10.1681/ASN.2005010062. [DOI] [PubMed] [Google Scholar]
- 22.Miyata T, van Ypersele de Strihou C, Ueda Y, Ichimori K, Inagi R, Onogi H, Ishikawa N, Nangaku M, Kurokawa K. Angiotensin II receptor antagonists and angiotensin-converting enzyme inhibitors lower in vitro the formation of advanced glycation end products: biochemical mechanisms. J Am Soc Nephrol. 2002;13:2478–2487. doi: 10.1097/01.asn.0000032418.67267.f2. [DOI] [PubMed] [Google Scholar]
- 23.Nakamura K, Yamagishi S, Nakamura Y, Takenaka K, Matsui T, Jinnouchi Y, Imaizumi T. Telmisartan inhibits expression of a receptor for advanced glycation end products (RAGE) in angiotensin-II-exposed endothelial cells and decreases serum levels of soluble RAGE in patients with essential hypertension. Microvasc Res. 2005;70:137–141. doi: 10.1016/j.mvr.2005.10.002. [DOI] [PubMed] [Google Scholar]
- 24.Forbes JM, Thomas MC, Thorpe SR, Alderson NL, Cooper ME. The effects of valsartan on the accumulation of circulating and renal advanced glycation end products in experimental diabetes. Kidney Int Suppl. 2004:S105–107. doi: 10.1111/j.1523-1755.2004.09225.x. [DOI] [PubMed] [Google Scholar]
- 25.Thomas MC, Tikellis C, Burns WM, Bialkowski K, Cao Z, Coughlan MT, Jandeleit-Dahm K, Cooper ME, Forbes JM. Interactions between renin angiotensin system and advanced glycation in the kidney. J Am Soc Nephrol. 2005;16:2976–2984. doi: 10.1681/ASN.2005010013. [DOI] [PubMed] [Google Scholar]
- 26.Ruster C, Bondeva T, Franke S, Tanaka N, Yamamoto H, Wolf G. Angiotensin II upregulates RAGE expression on podocytes: role of AT2 receptors. Am J Nephrol. 2009;29:538–550. doi: 10.1159/000191467. [DOI] [PubMed] [Google Scholar]
- 27.Coughlan MT, Thallas-Bonke V, Pete J, Long DM, Gasser A, Tong DC, Arnstein M, Thorpe SR, Cooper ME, Forbes JM. Combination therapy with the advanced glycation end product cross-link breaker, alagebrium, and angiotensin converting enzyme inhibitors in diabetes: synergy or redundancy? Endocrinology. 2007;148:886–895. doi: 10.1210/en.2006-1300. [DOI] [PubMed] [Google Scholar]
- 28.Ichiki T, Labosky PA, Shiota C, Okuyama S, Imagawa Y, Fogo A, Niimura F, Ichikawa I, Hogan BL, Inagami T. Effects on blood pressure and exploratory behaviour of mice lacking angiotensin II type-2 receptor. Nature. 1995;377:748–750. doi: 10.1038/377748a0. [DOI] [PubMed] [Google Scholar]
- 29.Bierhaus A, Haslbeck KM, Humpert PM, Liliensiek B, Dehmer T, Morcos M, Sayed AA, Andrassy M, Schiekofer S, Schneider JG, Schulz JB, Heuss D, Neundorfer B, Dierl S, Huber J, Tritschler H, Schmidt AM, Schwaninger M, Haering HU, Schleicher E, Kasper M, Stern DM, Arnold B, Nawroth PP. Loss of pain perception in diabetes is dependent on a receptor of the immunoglobulin superfamily. J Clin Invest. 2004;114:1741–1751. doi: 10.1172/JCI18058. [DOI] [PMC free article] [PubMed] [Google Scholar]
- 30.Constien R, Forde A, Liliensiek B, Grone HJ, Nawroth P, Hammerling G, Arnold B. Characterization of a novel EGFP reporter mouse to monitor Cre recombination as demonstrated by a Tie2 Cre mouse line. Genesis. 2001;30:36–44. doi: 10.1002/gene.1030. [DOI] [PubMed] [Google Scholar]
- 31.Forbes JM, Cooper ME, Thallas V, Burns WC, Thomas MC, Brammar GC, Lee F, Grant SL, Burrell LA, Jerums G, Osicka TM. Reduction of the accumulation of advanced glycation end products by ACE inhibition in experimental diabetic nephropathy. Diabetes. 2002;51:3274–3282. doi: 10.2337/diabetes.51.11.3274. [DOI] [PubMed] [Google Scholar]
- 32.Dunn SR, Qi Z, Bottinger EP, Breyer MD, Sharma K. Utility of endogenous creatinine clearance as a measure of renal function in mice. Kidney Int. 2004;65:1959–1967. doi: 10.1111/j.1523-1755.2004.00600.x. [DOI] [PubMed] [Google Scholar]
- 33.Thallas-Bonke V, Thorpe SR, Coughlan MT, Fukami K, Yap FY, Sourris KC, Penfold SA, Bach LA, Cooper ME, Forbes JM. Inhibition of NADPH oxidase prevents advanced glycation end product-mediated damage in diabetic nephropathy through a protein kinase C-alpha-dependent pathway. Diabetes. 2008;57:460–469. doi: 10.2337/db07-1119. [DOI] [PubMed] [Google Scholar]
- 34.Sourris KC, Lyons JG, de Courten MP, Dougherty SL, Henstridge DC, Cooper ME, Hage M, Dart A, Kingwell BA, Forbes JM, de Courten B. JNK activity in subcutaneous adipose tissue but not NF{kappa}B activity in peripheral blood mononuclear cells is an independent determinant of insulin resistance in healthy individuals. Diabetes. 2009 doi: 10.2337/db08-1725. [DOI] [PMC free article] [PubMed] [Google Scholar]
- 35.Fukami K, Ueda S, Yamagishi S, Kato S, Inagaki Y, Takeuchi M, Motomiya Y, Bucala R, Iida S, Tamaki K, Imaizumi T, Cooper ME, Okuda S. AGEs activate mesangial TGF-beta-Smad signaling via an angiotensin II type I receptor interaction. Kidney Int. 2004;66:2137–2147. doi: 10.1111/j.1523-1755.2004.66004.x. [DOI] [PubMed] [Google Scholar]
- 36.Breyer MD, Bottinger E, Brosius FC, 3rd, Coffman TM, Harris RC, Heilig CW, Sharma K. Mouse models of diabetic nephropathy. J Am Soc Nephrol. 2005;16:27–45. doi: 10.1681/ASN.2004080648. [DOI] [PubMed] [Google Scholar]
- 37.Freeman HC, Hugill A, Dear NT, Ashcroft FM, Cox RD. Deletion of nicotinamide nucleotide transhydrogenase: a new quantitive trait locus accounting for glucose intolerance in C57BL/6J mice. Diabetes. 2006;55:2153–2156. doi: 10.2337/db06-0358. [DOI] [PubMed] [Google Scholar]
- 38.Benndorf RA, Krebs C, Hirsch-Hoffmann B, Schwedhelm E, Cieslar G, Schmidt-Haupt R, Steinmetz OM, Meyer-Schwesinger C, Thaiss F, Haddad M, Fehr S, Heilmann A, Helmchen U, Hein L, Ehmke H, Stahl RA, Boger RH, Wenzel UO. Angiotensin II type 2 receptor deficiency aggravates renal injury and reduces survival in chronic kidney disease in mice. Kidney Int. 2009;75:1039–1049. doi: 10.1038/ki.2009.2. [DOI] [PubMed] [Google Scholar]
- 39.Nouet S, Nahmias C. Signal transduction from the angiotensin II AT2 receptor. Trends Endocrinol Metab. 2000;11:1–6. doi: 10.1016/s1043-2760(99)00205-2. [DOI] [PubMed] [Google Scholar]
- 40.Ding G, Zhang A, Huang S, Pan X, Zhen G, Chen R, Yang T. ANG II induces c-Jun NH2-terminal kinase activation and proliferation of human mesangial cells via redox-sensitive transactivation of the EGFR. Am J Physiol Renal Physiol. 2007;293:F1889–1897. doi: 10.1152/ajprenal.00112.2007. [DOI] [PubMed] [Google Scholar]
- 41.Tsang SW, Ip SP, Leung PS. Prophylactic and therapeutic treatments with AT 1 and AT 2 receptor antagonists and their effects on changes in the severity of pancreatitis. Int J Biochem Cell Biol. 2004;36:330–339. doi: 10.1016/s1357-2725(03)00257-7. [DOI] [PubMed] [Google Scholar]
- 42.Siragy HM, Carey RM. Protective role of the angiotensin AT2 receptor in a renal wrap hypertension model. Hypertension. 1999;33:1237–1242. doi: 10.1161/01.hyp.33.5.1237. [DOI] [PubMed] [Google Scholar]
- 43.Siragy HM, Carey RM. The subtype 2 (AT2) angiotensin receptor mediates renal production of nitric oxide in conscious rats. J Clin Invest. 1997;100:264–269. doi: 10.1172/JCI119531. [DOI] [PMC free article] [PubMed] [Google Scholar]
- 44.Wautier MP, Chappey O, Corda S, Stern DM, Schmidt AM, Wautier JL. Activation of NADPH oxidase by AGE links oxidant stress to altered gene expression via RAGE. Am J Physiol Endocrinol Metab. 2001;280:E685–694. doi: 10.1152/ajpendo.2001.280.5.E685. [DOI] [PubMed] [Google Scholar]
- 45.Forbes JM, Coughlan MT, Cooper ME. Oxidative stress as a major culprit in kidney disease in diabetes. Diabetes. 2008;57:1446–1454. doi: 10.2337/db08-0057. [DOI] [PubMed] [Google Scholar]
- 46.Siragy HM, Inagami T, Ichiki T, Carey RM. Sustained hypersensitivity to angiotensin II and its mechanism in mice lacking the subtype-2 (AT2) angiotensin receptor. Proc Natl Acad Sci U S A. 1999;96:6506–6510. doi: 10.1073/pnas.96.11.6506. [DOI] [PMC free article] [PubMed] [Google Scholar]
- 47.Saavedra JM, Hauser W, Ciuffo G, Egidy G, Hoe KL, Johren O, Sembonmatsu T, Inagami T, Armando I. Increased AT(1) receptor expression and mRNA in kidney glomeruli of AT(2) receptor gene-disrupted mice. Am J Physiol Renal Physiol. 2001;280:F71–78. doi: 10.1152/ajprenal.2001.280.1.F71. [DOI] [PubMed] [Google Scholar]
- 48.Siragy HM, Carey RM. The subtype 2 angiotensin receptor regulates renal prostaglandin F2 alpha formation in conscious rats. Am J Physiol. 1997;273:R1103–1107. doi: 10.1152/ajpregu.1997.273.3.R1103. [DOI] [PubMed] [Google Scholar]
- 49.Wang H, Gallinat S, Li HW, Sumners C, Raizada MK, Katovich MJ. Elevated blood pressure in normotensive rats produced by ‘knockdown’ of the angiotensin type 2 receptor. Exp Physiol. 2004;89:313–322. doi: 10.1113/expphysiol.2004.027359. [DOI] [PubMed] [Google Scholar]
- 50.Li Z, Iwai M, Wu L, Shiuchi T, Jinno T, Cui TX, Horiuchi M. Role of AT2 receptor in the brain in regulation of blood pressure and water intake. Am J Physiol Heart Circ Physiol. 2003;284:H116–121. doi: 10.1152/ajpheart.00515.2002. [DOI] [PubMed] [Google Scholar]