Abstract
The ability to precisely control nanoscale features is increasingly exploited to develop and improve monofunctional catalysts1–4. Striking effects might also be expected in the case of bifunctional catalysts, which play an important role in hydrocracking of fossil and renewable hydrocarbon sources to provide high-quality diesel fuel5–7. Such bifunctional hydrocracking catalysts contain metal sites and acid sites, and for more than 50 years the so-called ‘intimacy criterion’8 has dictated the maximum distance between the two site types beyond which catalytic activity decreases. The lack of synthesis and material characterization methods with nanometer precision has long prevented in-depth exploration of the criterion, which has often been interpreted simply as ‘the closer the better’ for positioning metal and acid sites8–11. Here we show for a bifunctional catalyst, comprised of an intimate mixture of zeolite Y and alumina binder and with platinum (Pt) metal controllably deposited20,21 on either the zeolite or the binder, that close proximity between metal and zeolite acid sites can be detrimental: the selectivity when cracking large hydrocarbon feedstock molecules for high-quality diesel production is optimized with the catalyst that contains Pt on the binder, i.e. with a larger distance between metal and acid sites. Cracking of the large and complex hydrocarbon molecules typically derived from alternative sources such as gas-to-liquid technology, vegetable oil or algal oil6–7 should thus benefit especially from bifunctional catalysts that avoid locating Pt on the zeolite as the traditionally assumed optimal location. More generally, we anticipate that the ability to spatially organize different active sites at the nanoscale demonstrated here will benefit the further development and optimization of the newly emerging generation of multifunctional catalysts12–15.
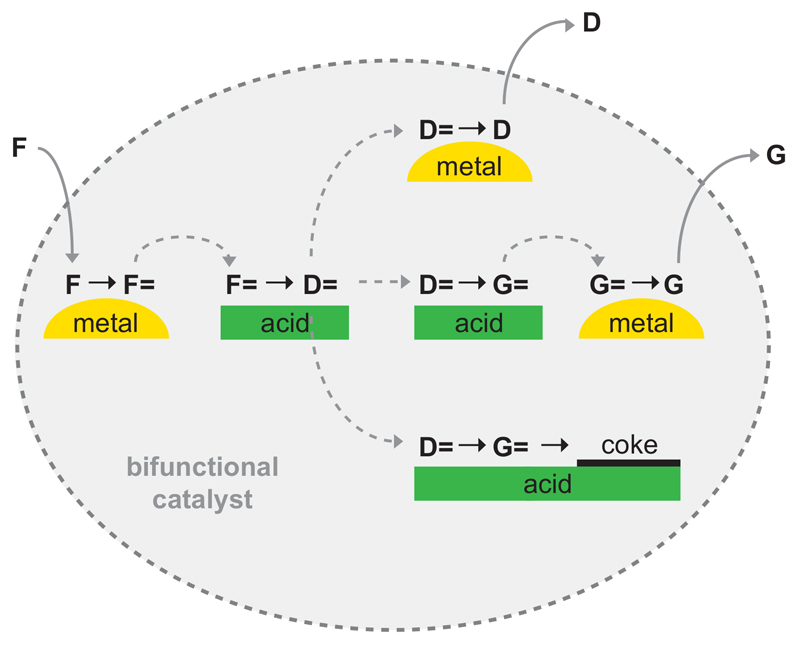
Bifunctional catalysts for conversion of hydrocarbons contain metal sites next to acid sites. In the case of conversion of normal alkanes, the metal sites catalyze (de-)hydrogenation reactions and the acid sites isomerization and cracking reactions to obtain iso-alkanes of the same or reduced molecular weight, respectively16. Critical properties of these catalysts are the ratio of metal sites relative to acid sites and the proximity of both sites with respect to each other8,17. The latter aspect is further illustrated by the schematic presentation of the hydrocracking reactions in Fig. 1. The alkene reaction intermediate has to diffuse from the metal site to the acid site and vice versa for the iso-alkene. If the distances are too large and diffusivity too low concentration gradients develop and catalytic activity decreases. The Intimacy Criterion put forward by Weisz8 in 1962 provides the maximum distance between both types of sites beyond which catalytic activity decreases. Later on it has been realized that, even more importantly, also selectivity may be affected by intimacy9–11,18, since with large distances between metal and acid sites iso-alkenes may undergo secondary reactions giving rise to gas and to coke. Systematic quantitative studies on intimacy effects have only been carried out at macroscale8,11,18 (tens of micrometres and larger) whereas in many other studies the metal function was put in the closest proximity of the acid sites6,9,19 (e.g. metal dispersed in acid zeolite) which has led to the general believe for intimacy of bifunctional catalysts: ‘the closer the better’. Here we report on a new methodology to control and image intimacy of metal and acid sites at nanoscale with large positive effects on selectivity.
Figure 1. Scheme of hydrocracking reactions.
Feed alkane molecules (F) are dehydrogenated on metal surface into alkene intermediates (F=). Alkenes diffuse to zeolite Brønsted acid sites on which they undergo acid-catalyzed isomerization, which can be followed by one (D=) or more (G=) cracking events sometimes leading to coke formation. Isomerized (D=) and/or cracked (D=, G=) alkene intermediates diffuse to the metal site and are hydrogenated to form isomerized or cracked products D (diesel) and G (gas).
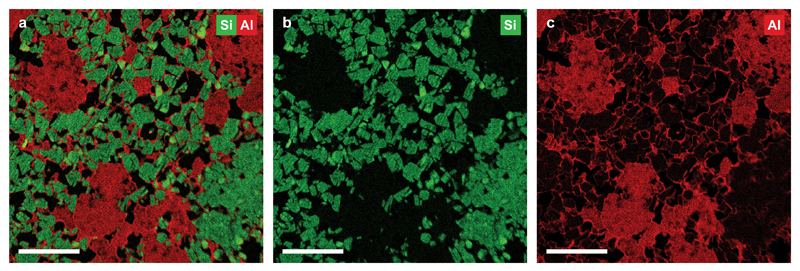
Our strategy for controlling the distance between metal and acid sites at the nanoscale starts with an intimate mixture of 50 wt% of mesoporous zeolite Y providing acid sites (designated as Y) and 50 wt% γ-alumina binder (designated as A), obtained by extrusion and referred to as Y/A. Energy dispersive X-ray (EDX) spectroscopy maps of a 70 nm thin ultramicrotomed slice of Y/A (Fig. 2) show the two components mixed at the nanoscale, with zeolite crystals (500-1000 nm) being surrounded by at least one layer of alumina and alumina regions not exceeding 5 μm. Porosity, apparent as black voids in the EDX map (Fig. 2a) and from N2 physisorption (Extended Data Fig. 1), enables molecular transport via diffusion throughout the extrudates. We then exploit the difference between ion exchange and electrostatic adsorption20,21 to direct the subsequent deposition of Pt metal: ion exchange at pH=5 with an aqueous solution of Pt(NH3)4(NO3)2 results in Pt exclusively located on the zeolite component, while ion adsorption at pH=3 from a solution of H2PtCl6 deposits Pt exclusively on the alumina component (Methods). The resulting samples Pt-Y/A and Pt-A/Y are then either heat-treated in H2 or heat-treated in H2 followed by 1 vol% O2 in N2, respectively, to generate Pt particles with a size of ~3 nm22,23. Inductively coupled plasma (ICP) analysis shows the Pt-Y/A and Pt-A/Y samples to have comparable Pt loading of 0.6 wt% and 0.7 wt%, respectively, which suffices to maintain the metal-acid balance needed for so-called ‘ideal hydrocracking’11.
Figure 2. Distribution of zeolite Y and alumina components within Y/A extrudates.
a, EDX map of 70 nm thin section of Y/A extrudates showing the location of Si (green) and Al (red) indicative of the presence of zeolite Y and alumina components of Y/A respectively. b, EDX map showing only Si (green) signal corresponding to the presence of zeolite Y. c, EDX map showing only Al (red) signal pronounced for regions containing pure alumina phase. Scale bars are 2 μm.
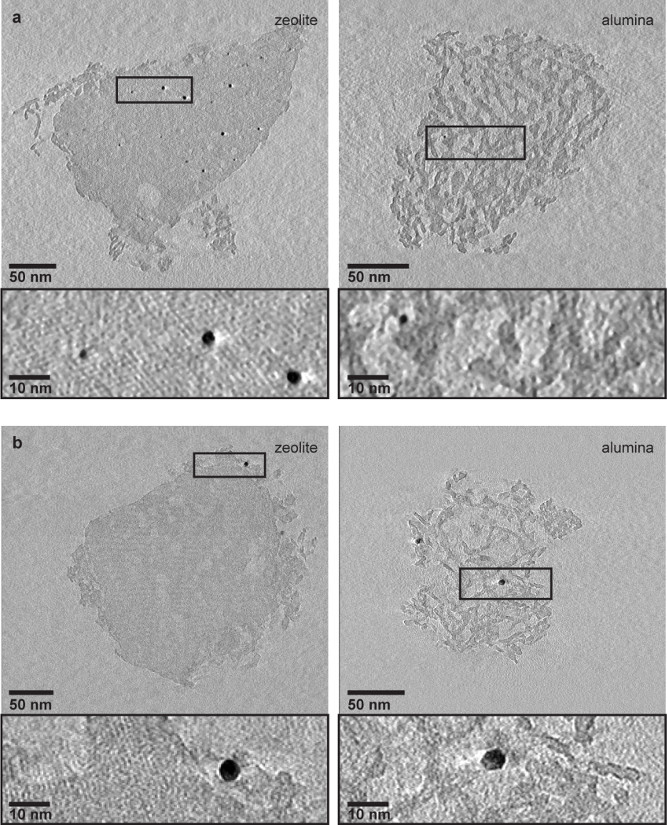
High-angle annular dark field scanning transmission electron microscopy imaging (HAADF-STEM) and EDX elemental mapping of 70 nm thin ultramicrotomed sections of Pt-Y/A (Fig. 3a and b, Extended Data Fig. 2a) confirms that Pt particles with a narrow size distribution around 2.5 nm are exclusively present in the zeolite crystals. Cutting the extrudates with ultramicrotomy to 70 nm thin slices was crucial, to expose regions containing purely the zeolite or alumina components. The images in Figure 3a and b and electron tomography observations (Extended Data Fig. 3a) reveal Pt nanoparticles located within the zeolite crystals even though they exceed the size of the micropores (~ 1 nm), as also reported in an earlier study22. In the Pt-A/Y sample, Pt particles with an average size of 3.5 nm and narrow size distribution reside exclusively on the alumina phase of the extrudates (Fig. 3c and d, Extended Data Fig. 2b). The absence of Pt particles in the zeolite crystals was confirmed by electron tomography (Extended Data Fig. 3b).
Figure 3. Controlled deposition of Pt on either the zeolite Y or the alumina component of Y/A extrudates.
a-b, HAADF-STEM image (a) of 70 nm thin section of Pt-Y/A sample with Pt particles of ~2.5 nm residing within the zeolite crystals exclusively, as evident from the EDX map (b) showing Pt (yellow), Si (green) and Al (red) signals. c-d, HAADF-STEM image (c) and EDX map (d) of 70 nm thin section of Pt-A/Y sample with Pt particles (yellow) of ~3.5 nm residing on the alumina platelets (red) exclusively while the zeolite crystals (green) were empty. Scale bars are 50 nm.
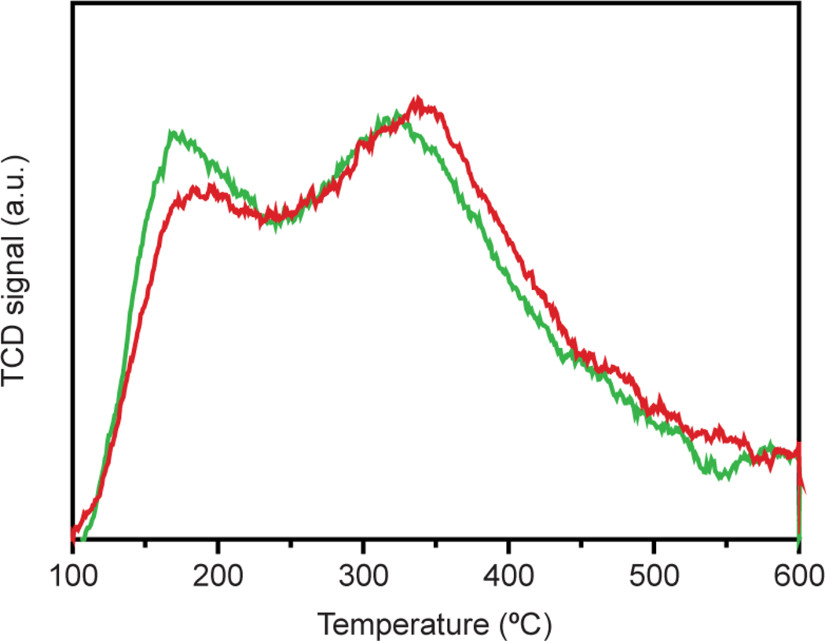
The two catalysts thus have well defined structures, with Pt particles of comparable size located either in intimate proximity to zeolite acid sites (Pt-Y/A sample) or within nanoscale distance of the acid sites (Pt-A/Y). Since only 0.6 wt% of Pt was loaded on the pre-shaped Y/A extrudates, no change in textural properties is expected compared to pristine Y/A extrudates. Temperature programmed desorption of ammonia also indicates very similar acidities for the two catalysts (Extended Data Fig. 4). The two catalyst samples, with all structural parameters identical except for the Pt location, therefore allow us to evaluate the impact of nanoscale intimacy on hydroconversion activity and selectivity.
The model feedstocks in our the catalysis experiments are decane (n-C10), n-nonadecane (n-C19) and pristane (2,6,10,14-tetramethylpentadecane, i-C19), with both catalysts showing very similar n-C10 and n-C19 conversion activity (Fig. 4a and b). But Pt-Y/A, with metal and zeolite acid sites in closest proximity, exhibits improved activity for the conversion of multi-branched i-C19 feed molecules (Fig. 4c). Assuming a typical normal alkene diffusivity in zeolite Y of 1.0 x 10⁻⁹ m2 s−1 the maximum inter site distance for n-alkane conversion has been estimated at 4.5 μm using the formula for the intimacy criterion24. With Pt on the alumina binder, the maximum distance between sites of about 500 nm is below the above estimate and in line with the identical catalytic activities of the two catalysts for n-C10 and n-C19 conversion (Fig. 4a and b). For i-C19, however, the lower activity of the catalyst with Pt on alumina points to activity being limited by transport of the bulky tetramethylbranched i-C19 alkene molecules with their estimated diffusivity of only 1.0 x 10⁻¹¹ m2 s−1.
Figure 4. Impact of nanoscale intimacy on hydrocracking activity and selectivity.
a-c, Alkane conversion against reaction temperature of Pt-Y/A (green squares) and Pt-A/Y (red triangles) catalysts in conversion of n-decane (a), n-nonadecane (b) and pristane (c) feedstock. d-f, Product yields of Pt-Y/A (green) and Pt-A/Y (red) catalysts for n-decane (d), n-nonadecane (e) and pristane (f) feedstock. Yields of isomerized products are shown as full line, full symbols and cracked products are shown as dashed line, open symbols. Experiments were performed at a pressure of 0.45 MPa and H2/hydrocarbon molar ratio of 214 (n-decane), or a pressure of 0.65 MPa and H2/hydrocarbon molar ratio of 14.6 (n-nonadecane and pristane).
In contrast to activity, the selectivities of the two catalysts differ remarkably with all three feeds (Fig. 4d-f): the Pt-A/Y catalyst always produces a much higher yield of skeletal isomers, thus illustrating the importance of nanoscale intimacy between (de-)hydrogenation and acid functions for the selectivity of hydrocracking catalysts. Skeletal branching is succeeded by cracking of the carbon chains. Undesired multiple cracking leads to C3-C4 products19 indicated as gas (Fig. 1). The cracking products at the same cracking conversion were identical for both catalysts for n-C10, but significantly different for n-C19 (Extended Data Fig. 5). In case of n-C19 feedstock, the product distribution was shifted towards the more desired range of middle distillates (C10-C19) when using the Pt-A/Y catalyst, whereas the Pt-Y/A catalyst produced more gas (C3-C4) and naphtha (C5-C9) (Extended Data Fig. 5b).
High isomerization yield and limited secondary cracking are characteristic of ideal hydrocracking. In this regard, the Pt-A/Y catalyst, with the metal function residing on alumina and thus more distant from the zeolite acid sites, outperforms the Pt-Y/A catalyst with Pt nanoparticles located inside the zeolite micropores and thus in more intimate contact with acid sites—contradicting previous suggestions that having metal and acid functions at shortest possible distance promotes immediate hydrogenation of alkene intermediates and prevents undesired consecutive reactions such as multiple cracking11 (Fig. 1). Important to note in this context is that while the earlier work often used n-hexadecane as feedstock, we used a range of hydrocarbons (n-C10, n-C19, i-C19) that allow us to delineate the effects of intimacy on activity and selectivity. Another important difference is that systematic variation of intimacy in earlier studies was achieved by mixing separately functionalized powders at the macroscale (tens of micrometres and larger)8,11,18, whereas we use synthesis and characterization methods that allow for direct control of intimacy at the nanoscale and observation of the reported large impact.
When using catalyst Pt-Y/A, where the Pt metal function resides inside the zeolite crystals and at the highest possible intimacy with acid sites, feed molecules have to diffuse through the micropores to reach the metal sites. Once alkene intermediates are formed on the metal, we envisage them to remain trapped in the zeolite micropores due to their strong adsorption on acid sites and concomitant slow diffusion and longer residence times. This increases the probability of secondary reactions, and in particular multiple cracking. With catalyst Pt-A/Y that has metal nanoparticles located outside the zeolite crystals on the more easily accessible alumina binder, alkene intermediates formed on the metal sites diffuse to zeolite acid sites where they immediately undergo isomerization. We suggest that alkene intermediates mainly react in the outer zeolite layers near the crystal surface, from where they can rapidly diffuse to the metal sites on the alumina. This mechanism has been earlier proposed for medium-pore zeolites exhibiting so-called pore mouth catalysis25 and is now extended to reactions of heavy alkanes on large-pore zeolite Y.
The widely used sulfided NiMo on alumina-zeolite hydrocracking catalysts, in which metal (sulfide) particles are mainly on the alumina binder9,26, probably meet already the requirement that the optimal location for the metal function of bifunctional catalysts is not in the micropores of the zeolite, as long perceived, but rather on the binder or on the surface/mesopores of the zeolite. But with the worldwide growing interest in alternative feedstocks, such as those based on gas-to-liquids6 technology and on vegetable oil and algae oil7, molecules of even larger complexity and size impose new challenges to the process of hydroconversion for high-quality diesel production. Improving hydrocracking catalysts generally and for such challenging applications will undoubtedly benefit from full control over the size and location the metal function in complex catalysts for, which complements recent efforts that have focused on nanozeolites10,27, hierarchical zeolites28, metal particle size29 and nanoscale characterization30 to improve understanding. Importantly, our control strategy and the methodology used to achieve it can be extended to other bifunctional catalysts12–15, and provides the opportunity to tailor catalysts properties in accordance to the specific requirements of the target process beyond a simple ‘the closer the better’ notion of intimacy.
Methods
Catalyst synthesis
Cylindrical extrudates with ~ 8 mm length and ~ 2 mm diameter containing 50 wt% of mesoporous zeolite Y (Zeolyst CBV 760, Si/Al = 30 at/at) and 50 wt% of gamma alumina, were obtained from Shell Projects and Technology and are designated as Y/A. Extrudates were crushed and sieved to 0.2 - 0.5 mm particles and as such used as a support for Pt. Pt(NH3)4(NO3)2 (99.995 % purity) was purchased from Sigma-Aldrich, and H2PtCl6•6H2O (40 wt% Pt) was purchased from Merck.
Introduction of Pt on the zeolite component - Pt-Y/A catalyst
1.485 g of 0.2 - 0.5 mm Y/A particles were suspended in 450 ml Milli-Q water at room temperature and stirred for 1 h after which the pH of the suspension was 6.4. Aqueous solution (50 ml) containing 29.8 mg of Pt(NH3)4(NO3)2 was added dropwise to the suspension, after which the pH dropped to 5.3. At these conditions ion exchange of zeolite protons with Pt(NH3)42+ was dominant over electrostatic adsorption on alumina since the latter surface at pH < 9 is positively charged and does not interact strongly with Pt-cations20. ICP analysis showed that under these synthesis conditions ion exchange led to Pt loading of 0.6 wt% (intake 1 wt%) with respect to Y/A. After addition of the Pt precursor, the suspension was stirred for another 3 h, after which pH dropped to 4.9. The suspension was filtered and washed with Milli-Q water, and dried in air overnight at 120 °C. Dried catalyst was reduced in a flow of H2 (~ 2,580 h−1 GHSV) for 3 h at 600 °C, using a ramp of 5 °C min−1.
Introduction of Pt on the alumina component - Pt-A/Y catalyst
A suspension containing 1.491 g of 0.2 - 0.5 mm Y/A extrudates particles in 450 ml Milli-Q water was stirred for 1 h at room temperature after which the pH of the suspension was lowered from 6.2 to 2.6 by adding 1 M HCl solution. To achieve the same Pt loading as in case of Pt-Y/A sample, 50 ml of aqueous solution containing 22.5 mg of H2PtCl6•6H2O salt (pH = 2.7) was added dropwise to the suspension. At the applied pH range, the adsorption of PtCl62− on positively charged alumina surface is expected21 whereas no ion exchange or electrostatic adsorption on the zeolite will take place. ICP analysis confirmed that electrostatic adsorption was complete and that Pt loading was 0.7 wt% with respect to Y/A. After 3 h of stirring (pH increased to 3.3), the suspension was filtered and washed with Milli-Q water, and dried in air overnight at 120 °C. Dried catalyst was reduced in a flow of H2 (~ 2,580 h−1 GHSV) for 3 h at 600 °C, with a heating ramp of 5 °C min−1, and then heat treated for 1 h at 600 °C in a flow of 1 vol% O2 in N2 (GHSV ~ 2,580 h−1).
When preparing smaller amounts of catalysts, the volume of Milli-Q water in the suspension was proportionally decreased, while GHSV ~ 3,300 h−1 was used for heat treatments, however no impact of these changes on catalysts structure was observed.
Catalyst characterization
N2 physisorption measurements were performed on a Micromeritics TriStar 3000 at liquid nitrogen temperature. The sample was dried for 14 h at 300 °C in nitrogen flow prior to measurement.
Temperature programmed desorption (TPD) of ammonia was performed on a Micromeritics AutoChem II equipped with a TCD detector. Prior to TPD, 0.1 g of catalyst was first dried in He for 1 h at 600 °C with heating ramp of 10 °C min−1. The temperature was decreased to 100 °C and ammonia (10 vol% in He) was adsorbed in a pulse-wise manner until over-saturated, after which the physisorbed ammonia was removed by flowing He for 1 h at 100 °C. The ammonia desorption was monitored until 600 °C with a ramp of 5 °C min−1.
Inductively Coupled Plasma (ICP) for Pt elemental analysis was performed at Kolbe Mikroanalytisches Laboratorium (Mülheim and der Ruhr, Germany) using an ICP-OES Perkin Elmer spectrometer after sample dissolution according to standard in-house procedures.
Electron microscopy studies
High-angle annular dark field (HAADF) imaging and energy dispersive X-ray (EDX) analysis presented in the Fig. 2, Fig. 3 and Extended Data Fig. 2 were performed on a Talos™ F200X (FEI) transmission electron microscope equipped with a high-brightness field emission gun X-FEG and a Super-X EDX detector. For these analyses catalysts were embedded in Epofix resin, left to cure in air overnight at 60 °C, and cut to 70 nm sections using a Reichert-Jung Ultracut E ultramicrotome with Diatome Ultra 35° diamond knife. Sections were deposited on the carbon-coated copper TEM grids. Images and elemental EDX maps were acquired using Velox™ analytical and imaging software in a scanning transmission mode (STEM) with a camera length of 77 mm. Elemental EDX maps of 700x700 pixels shown in Fig. 2 were acquired with 30 min acquisition time. Elemental EDX maps of 512x512 pixels shown in Fig. 3b and d and Extended Data Fig. 2 were acquired with 15 min acquisition time and processed in Velox™ using the box filter (3x3). Electron tomography was performed using a Tecnai 20 (Extended Data Fig. 3a) and Talos™ F200X (Extended Data Fig. 3b) transmission electron microscopes. For electron tomography, catalysts were grinded, sonicated in ethanol and drop-casted on the Quantifoil R2/1 Cu TEM grids with a thin carbon film and 5 nm Au particles as fiducial markers. Series of bright-field TEM images were taken with either a bottom mounted TVIPS CCD (Extended Data Fig. 3a) or a Ceta 16M (Extended Data Fig. 3b) camera, over the angle range of ± 76° with a tilt increment of 2°. Tilt series were aligned using IMOD package31 and by tracking 5 nm Au fiducial markers from the TEM grid. Aligned series were binned by a factor of 2 and reconstructed in IMOD31 using WBP (weighted back projection) algorithm. Resulting reconstructions had a voxel size of (0.36 nm)3, (0.34 nm)3, (0.28 nm)3 or (0.26 nm)3 depending on the magnification used.
Catalytic tests
Catalytic tests were performed in continuous-flow fixed-bed reactors. n-Decane (Sigma) hydroconversion was performed in a high-throughput reactor32,33. The catalyst weight was 50 mg, total pressure was 0.45 MPa, the molar ratio of H2 to n-decane was 214 and the space time at the reactor entrance W/F° 1,400 kg s mol−1. n-Nonadecane (Sigma, 98%) was dissolved in heptane (Acros Organics) at 1 mol% concentration. The mixture was vaporized at 280 °C and mixed with hydrogen before feeding it to the reactor. The catalyst weight was 200 mg. The reaction was performed at a pressure of 0.65 MPa, molar ratio of H2 to hydrocarbons 14.6 and the space time at the reactor entrance W/F° (n-C19) 713 kg s mol−1. Under the investigated reaction conditions heptane was confirmed to be inert. The same reaction conditions as in case of n-nonadecane were used for pristane (Sigma, 98%) hydroconversion. The reaction products were analyzed by on-line GC over an apolar capillary column (HP-1) and flame ionization detector, FID. In both reactors, temperature was increased stepwise, and the reaction was equilibrated for 1 h before product sampling.
Extended Data
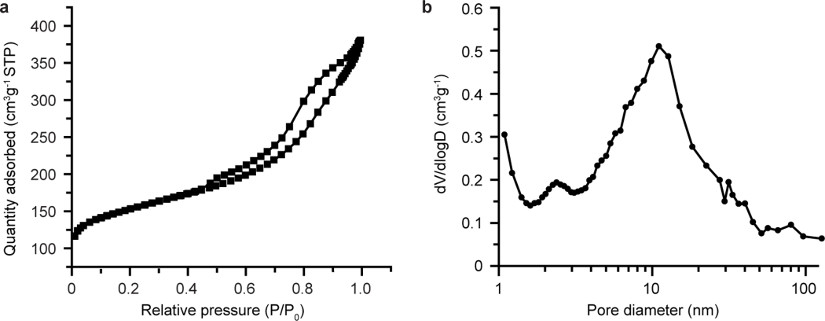
Extended Data Figure 1. Textural analysis of Y/A extrudates.
a, N2 physisorption isotherm displaying the hysteresis loop indicative of presence of mesoporosity (2–50 nm), while adsorbed quantity of N2 at zero relative pressure indicates presence of microporosity (~1 nm). b, The Barrett-Joyner-Halenda (BJH) pore size distribution derived from the adsorption branch of the isotherm points to the broad size distribution of mesopores and macropores (> 50 nm).
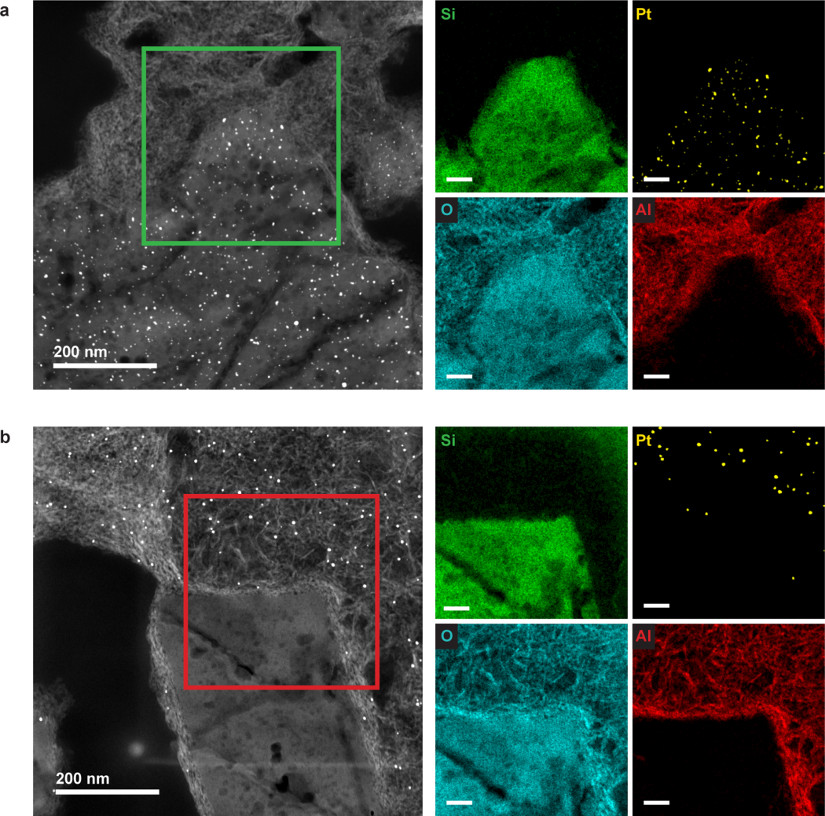
Extended Data Figure 2. Controlled deposition of Pt.
a, EDX elemental maps of 70 nm thin section of Pt-Y/A catalyst recorded in the region indicated with green square in the HAADF-STEM image show the presence of Pt particles (yellow) in the zeolite region with dominant Si signal (green), while the alumina region (red) is empty. b, EDX elemental maps of 70 nm thin section of Pt-A/Y catalyst recorded in the region indicated with red square in the HAADF-STEM image show the presence Pt particles (yellow) in the alumina region (red), while the zeolite crystal (green) contains no Pt particles. Bright spot and a line apparent in the HAADF-STEM image, below the mapped region of interest, originates from prolonged electron beam exposure. Scale bars in EDX maps are 50 nm.
Extended Data Figure 3. 3D structural analysis using electron tomography.
a, One pixel thin slices, equal to 0.34 nm (left) and 0.26 nm (right) thickness, from the middle of the electron tomography reconstructions of zeolite crystal (left) and alumina aggregate (right) of Pt-Y/A catalyst show the presence of ~ 2.5 nm Pt particles inside the zeolite crystal. Within the alumina aggregate (right), only very few Pt particles were detected, of which one is shown in zoomed-in region. b, Ten pixels thin slices, equal to 3.6 nm (left) and 2.8 nm (right) thickness, from the middle of the electron tomography reconstructions of zeolite crystal (left) and alumina aggregate (right) of Pt-A/Y catalyst show that Pt particles of ~3.5 nm diameter were located on the alumina platelets surrounding the zeolite crystal (left) and on the alumina platelets of the aggregate (right). No Pt particles were detected inside the zeolite crystal. For electron tomography analysis both catalysts were grinded, dispersed in ethanol and sonicated to break zeolite crystals and alumina aggregates apart and analyze them separately on the TEM grid.
Extended Data Figure 4. Comparing acidity of the samples.
Temperature programmed desorption of ammonia of Pt-Y/A (green) and Pt-A/Y (red) catalysts displays peaks indicating weak (at ~160 °C) and strong (at ~320 °C) acid sites present within both catalysts, with Pt-A/Y catalyst showing slightly lower peak intensity in the region of weak acid site. The total amount of ammonia desorbed was measured to be 14.3 cm3 g−1 and 14.7 cm3 g−1 STP, respectively.
Extended Data Figure 5. Hydrocracking product distribution at 35 % cracking conversion.
a, n-decane feed. b, n-nonadecane feed. c, and pristane feed. Results obtained with Pt-Y/A and Pt-A/Y catalysts are represented with green squares and red triangles, respectively. Experiments were performed at a pressure of 0.45 MPa and H2/hydrocarbon molar ratio of 214 (n-decane), or a pressure of 0.65 MPa and H2/hydrocarbon molar ratio of 14.6 (n-nonadecane and pristane).
Acknowledgments
This work has been supported by NRSC-C and the European Research Council, EU FP7 ERC Advanced Grant no. 338846. (J.Z., K.P.deJ.), and The Flemish Government via the Methusalem program (J.A.M.). We thank J. D. Meeldijk for assistance with ultramicrotomy and electron microscopy. M. Rigutto (Shell Projects and Technology) is acknowledged for providing the zeolite-alumina extrudates. R. Oord and J. Ruiz-Martínez are thanked for ammonia TPD measurements, and M. De Prins and S. Radhakrishnan for assistance with the catalytic experiments.
Footnotes
Author Contributions
J.Z. synthesized and characterized the samples, and drafted the manuscript. G.V. performed hydrocracking tests. K.P.deJ. and J.A.M. contributed to experiment design, data analysis and manuscript writing.
Author Information
Reprints and permissions information is available at www.nature.com/reprints.
The authors declare no competing financial interests.
References
- 1.Torres Galvis HM, et al. Supported iron nanoparticles as catalysts for sustainable production of lower olefins. Science. 2012;335:835–838. doi: 10.1126/science.1215614. [DOI] [PubMed] [Google Scholar]
- 2.Cui C, Gan L, Heggen M, Rudi S, Strasser P. Compositional segregation in shaped Pt alloy nanoparticles and their structural behaviour during electrocatalysis. Nat Mater. 2013;12:765–771. doi: 10.1038/nmat3668. [DOI] [PubMed] [Google Scholar]
- 3.Prieto G, Zečević J, Friedrich H, de Jong KP, de Jongh PE. Towards stable catalysts by controlling collective properties of supported metal nanoparticles. Nat Mater. 2013;12:34–39. doi: 10.1038/nmat3471. [DOI] [PubMed] [Google Scholar]
- 4.Luo W, et al. High performing and stable supported nano-alloys for the catalytic hydrogenation of levulinic acid to γ-valerolactone. Nat Commun. 2015;6:6540. doi: 10.1038/ncomms7540. [DOI] [PMC free article] [PubMed] [Google Scholar]
- 5.Weitkamp J. Catalytic hydrocracking—mechanisms and versatility of the process. ChemCatChem. 2012;4:292–306. [Google Scholar]
- 6.Bouchy C, Hastoy G, Guillon E, Martens JA. Fischer-Tropsch waxes upgrading via hydrocracking and selective hydroisomerization. Oil Gas Sci Technol. 2009;64:91–112. [Google Scholar]
- 7.Tran NH, et al. Catalytic upgrading of biorefinery oil from micro-algae. Fuel. 2010;89:265–274. [Google Scholar]
- 8.Weisz PB. Polyfunctional heterogeneous catalysis. Adv Catal. 1962;13:137–190. [Google Scholar]
- 9.Francis J, et al. Design of improved hydrocracking catalysts by increasing the proximity between acid and metallic sites. Appl Catal A. 2011;409-410:140–147. [Google Scholar]
- 10.Kim J, Kim W, Seo Y, Kim J-C, Ryoo R. n-Heptane hydroisomerization over Pt/MFI zeolite nanosheets: Effects of zeolite crystal thickness and platinum location. J Catal. 2013;301:187–197. [Google Scholar]
- 11.Batalha N, Pinard L, Bouchy C, Guillon E, Guisnet M. n-Hexadecane hydroisomerization over Pt-HBEA catalysts. Quantification and effect of the intimacy between metal and protonic sites. J Catal. 2013;307:122–131. [Google Scholar]
- 12.Huber GW, Chheda JN, Barrett CJ, Dumesic JA. Production of liquid alkanes by aqueous-phase processing of biomass-derived carbohydrates. Science. 2005;308:1446–1450. doi: 10.1126/science.1111166. [DOI] [PubMed] [Google Scholar]
- 13.Gao J, et al. Identification of molybdenum oxide nanostructures on zeolites for natural gas conversion. Science. 2015;348:686–690. doi: 10.1126/science.aaa7048. [DOI] [PubMed] [Google Scholar]
- 14.Yamada Y, et al. Nanocrystal bilayer for tandem catalysis. Nat Chem. 2011;3:372–376. doi: 10.1038/nchem.1018. [DOI] [PubMed] [Google Scholar]
- 15.Peng X, et al. Impact of hydrogenolysis on the selectivity of the Fischer–Tropsch synthesis: diesel fuel production over mesoporous zeolite-Y-supported cobalt nanoparticles. Angew Chem Int Ed. 2015;54:4553–4556. doi: 10.1002/anie.201411708. [DOI] [PubMed] [Google Scholar]
- 16.Coonradt HL, Garwood WE. Mechanism of hydrocracking. Ind Eng Chem Process Des Dev. 1964;3:38–45. [Google Scholar]
- 17.Guisnet M. “Ideal” bifunctional catalysis over Pt-acid zeolites. Catal Today. 2013;218-219:123–134. [Google Scholar]
- 18.Zhang A, Nakamura I, Aimoto K, Fujimoto K. Isomerization of n-pentane and other light hydrocarbons on hybrid catalyst. Effect of hydrogen spillover. Ind Eng Chem Res. 1995;34:1074–1080. [Google Scholar]
- 19.Martens JA, Jacobs PA, Weitkamp J. Attempts to rationalize the distribution of hydrocracked products. II. Relative rates of primary hydrocracking modes of long chain paraffins in open zeolites. Appl Catal. 1986;20:283–303. [Google Scholar]
- 20.Schreier M, Teren S, Belcher L, Regalbuto JR, Miller JT. The nature of ‘overexchanged’ copper and platinum on zeolites. Nanotechnology. 2005;16:S582–S591. doi: 10.1088/0957-4484/16/7/036. [DOI] [PubMed] [Google Scholar]
- 21.Cho H-R, Regalbuto JR. The rational synthesis of Pt-Pd bimetallic catalysts by electrostatic adsorption. Catal Today. 2015;246:143–153. [Google Scholar]
- 22.Zečević J, van der Eerden AMJ, Friedrich H, de Jongh PE, de Jong KP. Heterogeneities of the nanostructure of platinum/zeolite Y catalysts revealed by electron tomography. ACS Nano. 2013;7:3698–3705. doi: 10.1021/nn400707p. [DOI] [PubMed] [Google Scholar]
- 23.Boubnov A, et al. Structure–activity relationships of Pt/Al2O3 catalysts for CO and NO oxidation at diesel exhaust conditions. Appl Catal B. 2012;126:315–325. [Google Scholar]
- 24.Martens JA, Jacobs PA. Introduction to acid catalysis with zeolites in hydrocarbon reactions. Stud Surf Sci Catal. 2001;137:633–671. [Google Scholar]
- 25.Martens JA, et al. Selective isomerization of hydrocarbon chains on external surfaces of zeolite crystals. Angew Chem Int Ed. 1995;34:2528–2530. [Google Scholar]
- 26.Landau MV, et al. Hydrocracking of heavy vacuum gas oil with a Pt/H-beta-Al2O3 catalyst: effect of zeolite crystal size in the nanoscale range. Ind Eng Chem Res. 2003;42:2773–2782. [Google Scholar]
- 27.Awala H, et al. Template-free nanosized faujasite-type zeolites. Nat Mater. 2015;14:447–451. doi: 10.1038/nmat4173. [DOI] [PubMed] [Google Scholar]
- 28.de Jong KP, et al. Zeolite Y crystals with trimodal porosity as ideal hydrocracking catalysts. Angew Chem Int Ed. 2010;49:10074–10078. doi: 10.1002/anie.201004360. [DOI] [PubMed] [Google Scholar]
- 29.Van Santen RA. Complementary structure sensitive and insensitive catalytic relationships. Acc Chem Res. 2009;42:57–66. doi: 10.1021/ar800022m. [DOI] [PubMed] [Google Scholar]
- 30.Gommes CJ, et al. Mesoscale characterization of nanoparticles distribution using X-ray scattering. Angew Chem Int Ed. 2015;54:11804–11808. doi: 10.1002/anie.201505359. [DOI] [PubMed] [Google Scholar]
- 31.Kremer JR, Mastronarde DN, McIntosh JR. Computer visualization of three-dimensional image data using IMOD. J Struct Biol. 1996;116:71–76. doi: 10.1006/jsbi.1996.0013. [DOI] [PubMed] [Google Scholar]
- 32.Huybrechts W, Mijoin J, Jacobs PA, Martens JA. Development of a fixed-bed continuous-flow high-throughput reactor for long-chain n-alkane hydroconversion. Appl Catal A. 2003;243:1–13. [Google Scholar]
- 33.Burnens G, Bouchy C, Guillon E, Martens J. Hydrocracking reaction pathways of 2,6,10,14-tetramethylpentadecane model molecule on bifunctional silica–alumina and ultrastable Y zeolite catalysts. J Catal. 2011;282:145–154. [Google Scholar]


