

Individual and concerted actions of ER and PR highlight the prognostic and therapeutic value of PR in ER+/PR+ breast cancers.
Keywords: Estrogen, progesterone, breast cancer, chromatin, reprogramming, therapies, agonism, antagonism, prognosis, BRCA1
Abstract
The functional role of progesterone receptor (PR) and its impact on estrogen signaling in breast cancer remain controversial. In primary ER+ (estrogen receptor–positive)/PR+ human tumors, we report that PR reprograms estrogen signaling as a genomic agonist and a phenotypic antagonist. In isolation, estrogen and progestin act as genomic agonists by regulating the expression of common target genes in similar directions, but at different levels. Similarly, in isolation, progestin is also a weak phenotypic agonist of estrogen action. However, in the presence of both hormones, progestin behaves as a phenotypic estrogen antagonist. PR remodels nucleosomes to noncompetitively redirect ER genomic binding to distal enhancers enriched for BRCA1 binding motifs and sites that link PR and ER/PR complexes. When both hormones are present, progestin modulates estrogen action, such that responsive transcriptomes, cellular processes, and ER/PR recruitment to genomic sites correlate with those observed with PR alone, but not ER alone. Despite this overall correlation, the transcriptome patterns modulated by dual treatment are sufficiently different from individual treatments, such that antagonism of oncogenic processes is both predicted and observed. Combination therapies using the selective PR modulator/antagonist (SPRM) CDB4124 in combination with tamoxifen elicited 70% cytotoxic tumor regression of T47D tumor xenografts, whereas individual therapies inhibited tumor growth without net regression. Our findings demonstrate that PR redirects ER chromatin binding to antagonize estrogen signaling and that SPRMs can potentiate responses to antiestrogens, suggesting that cotargeting of ER and PR in ER+/PR+ breast cancers should be explored.
INTRODUCTION
Estrogens and progestogens bind to and function through cognate nuclear receptors, estrogen receptor α (ER) (1) and progesterone receptor (PR) (2), respectively. The physiological functions of these sex hormone receptors are intricately intertwined, as evidenced by their essential roles in orchestrating menstrual cycles and regulating reproductive tissues in women (3). Whereas the oncogenic role of ER in breast cancer is well established and clinically exploited, the value of PR as a biomarker or therapeutic target is a topic of much controversy. Clinical and laboratory studies demonstrate beneficial and detrimental influences of PR signaling in relation to breast cancer risk, prognosis, and progression, which confounds progress in the clinical exploitation of PR in this disease. Almost two-thirds of all breast cancers are positive for ER and PR expression, and most ER+PR+ cancers arise in postmenopausal women (4). Clearly, the ability to therapeutically target PR in addition to ER would be advantageous but predicated on a clear mechanistic understanding of crosstalk between these two receptor signaling pathways and the clinical consequences of this activity. Clinically, PR expression is assessed as a biomarker of functional ER activity even in the absence of detectable ER expression. Hence, women with ER−PR+ tumors receive adjuvant antiestrogenic hormone therapy (4, 5). Although a functional intersection between ER and PR signaling networks occurs in breast cancer cells, including ER-mediated up-regulation of the PR gene (6) and a physical interaction between the two receptors (7–10), the mechanistic details of ER/PR crosstalk are not well understood. Indeed, the prognostic value of PR is controversial because of its largely unstudied crosstalk with ER (6, 11–14). Despite the routine use of antiestrogens in the treatment of ER+/PR+ breast cancers (15), gaps in our knowledge of PR function have limited the use of PR-targeting therapies (16). Furthermore, a lack of mechanistic information regarding ER/PR crosstalk potentially affects millions of users of hormone replacement therapies because it is not clear why the addition of some synthetic progestins, in particular medroxyprogesterone acetate, to estrogen-only replacement therapies increases the risk of ER+ breast cancer (17, 18). In light of these clinical observations, a mechanistic understanding of how progestins modulate estrogen signaling is needed to optimize breast cancer management as well as to reduce the risk of cancer associated with hormonal replacement therapies and contraceptives.
RESULTS
PR reprograms estrogen signaling as a genomic agonist and a phenotypic antagonist
To elucidate the functional relationship between ER and PR in primary human breast tumors (table S1), sliced portions of independent ER+ tumors from 12 consecutively recruited patients were treated ex vivo with vehicle, estrogen [estradiol (E2)], progestin (R5020), or estrogen + progestin (EP). This ex vivo culture procedure, which is initiated within an hour of surgery, retains innate tissue architecture, cellular viability, steroid signaling, and tumor heterogeneity (19). RNA sequencing (RNA-seq) analysis of hormone-treated ER+/PR+ patient tumors and similarly treated ER+PR+ breast cancer cell line models (parental T47D, T47D derivatives with different PR expression profiles, and ZR75-1) revealed that approximately 85% of genes up-regulated (or down-regulated) by estrogen treatment alone were similarly up-regulated (or down-regulated) by progestin treatment alone, suggesting genomic agonism between these hormones. These results were noted in seven of eight ER+/PR+ tumors (P1 to P3 and P5 to P8) and in all of the ER+/PR+ breast cancer cell models (Fig. 1, A to D, and fig. S1, A to H). In T47D cells, similar ER/PR genomic agonism was observed for differentially expressed genes that have ER and PR binding within 100 kb of their promoters (fig. S1I). The transcriptomic results collectively suggest that these sex hormones independently regulate genes in similar directions, although differences were observed in the magnitude of gene expression and the functional annotation of the genes induced. When both hormones were present, progestin elicited a shift of estrogen action such that the progestin effects were dominant (Fig. 1, E, G, and I, and fig. S1J). As demonstrated by row-normalized heat maps, the patterns of gene regulation associated with joint activation of ER and PR were most similar to those induced by PR activation alone in all ER+/PR+ cell models and in at least three of eight ER+/PR+ patient tumors (P1, P3, and P4). Row normalization allows a comparison of the relative expression of a gene across various treatment conditions. For any given gene, red and green colors of a row-normalized heat map represent minimum and maximum magnitudes of gene expression observed in response to various treatments. Notably, EP-regulated transcriptomes were surprisingly different from those controlled by estrogen alone (Fig. 1, E and G). This phenomenon was reflected in subsequent Ingenuity analyses of the cell line and tumor data, which predicted that in isolation, estrogen, and to a lesser extent progestin, can activate proproliferative and prometastatic processes. Significantly, in the presence of both hormones, progestin antagonized estrogen-mediated phenotypes, indicating phenotypic antagonism between these hormones (Fig. 1I and fig. S2A). In agreement with the Ingenuity predictions, although progestin alone independently regulated genes in a similar direction to estrogen, it lacked the same degree of mitogenic activity that is induced by estrogen alone and, in conjunction with estrogen, it abrogated estrogen-induced proliferation in ER+/PR+ primary tumors and in multiple-cell models (fig. S2, B and E to G) (10, 20, 21). Progestin also abrogated estrogen-induced cell migration and invasion. The resulting phenotype was most similar to that observed in the progestin-only treatment (fig. S2, C and D). Remarkably, despite the intrinsic cellular heterogeneity between and within patient tumor samples, progestin treatment significantly altered estrogen-stimulated gene expression in most of the primary tumors (P1 to P6) (Fig. 1G and fig. S1J). These findings are particularly significant because estrogen signaling is considered a key oncogenic pathway in breast cancer and estrogen-regulated gene expression is a known favorable prognostic marker (22). The observation that estrogen and progestin independently regulate genes in similar directions might mechanistically underpin the added prognostic value associated with PR positivity in ER+ tumors. In addition, the observation that progestin antagonizes estrogen-regulated cellular processes further supports the favorable prognosis associated with the presence of PR in ER+ tumors. Collectively, our results show that estrogen and progestin regulate genes in similar directions but with different magnitudes and that EP-regulated transcriptomes mirror progestin-regulated transcriptomes such that progestin acts as a phenotypic antagonist of estrogen-regulated cellular processes in ER+/PR+ breast cancers. These data suggest that, at the receptor level, PR dominantly controls ER activity when both receptors are activated.
Fig. 1. Genomic agonism and phenotypic antagonism between ER and PR in breast cancer.

(A to C) Estrogen and progestin independently regulate gene expression in the same direction for representative patients (A) P2, (B) P8, and (C) T47D cells. Axes denote log fold change of gene expression in response to estrogen (E) or progestin R5020 (P) treatment relative to vehicle (V). Green dots represent genes regulated in similar directions by estrogen or progestin. Red dots represent genes regulated in different directions by estrogen or progestin. (D) Box plot depicts the percentage of all ER- and PR-regulated genes in ex vivo cultured primary breast tumors (n = 8) for which progestin is an agonist or antagonist of estrogen-regulated gene expression. (E and F) Similarity matrices represent correlation between estrogen-, progestin-, and EP-regulated levels of transcriptomes in (E) a PR+ milieu and (F) a PR− milieu. (G and H) Expression of estrogen and progestin-regulated genes in (G) a PR+ milieu (four ER+/PR+ ex vivo cultured human tumors and T47D, ZR75, and T47D PR-deficient cells with ectopic reexpression of PR) and (H) a PR-deficient milieu (four ER+/PR− tumors and PR-deficient T47D and MCF7 cells). Tumors were treated ex vivo and cell lines in vitro with vehicle, estrogen, or progestin or concomitantly with both hormones (EP). All heat maps are row-normalized and include the union of ER- and PR-regulated genes. For any given gene, red (or blue) and green (or yellow) colors of a row-normalized heat map represent minimum and maximum magnitudes of normalized expression that are observed in response to various treatments. (I) Enrichment (P values) and Z scores of activation of functional processes by estrogen-, progestin-, and EP-regulated transcriptomes in five human tumor explants treated ex vivo for 24 hours. For cell models, RT-PCR assessments of RNA-seq were done as three independent experiments (three technical replicates per experiment) (fig. S3). RNA-seq was performed on one of the three biological replicates. For a subset of human tumors, the RT-PCR assessment of estrogen-mediated regulation was done for TFF1, GREB1, and PR genes (table S1). The lists of genes and their expression in response to various treatments are provided in tables S4 and S5.
Approximately 80% of ER+ breast cancers are also positive for PR, presumably because of ER-mediated up-regulation (23). Because antiestrogens are routinely used as adjuvant therapy in women with PR+ breast cancers (24), it is important to understand whether PR is necessary and sufficient for the functional impact of progestin on estrogen signaling. In contrast to PR+ breast cancer models, progestin treatment did not significantly alter estrogen-regulated gene expression in four ER+/PR− primary breast tumors (patients N1 to N4) or in ER+/PR-deficient T47D and MCF7 cells (Fig. 1, F and H, and fig. S3A). Moreover, ectopic reexpression of PR in PR-deficient T47D cells (fig. S3B) rescued the antiestrogenic effects of progestin, suggesting that PR is necessary and sufficient to reprogram gene expression controlled by estrogen treatment (Fig. 1, E and G). For primary responders to estrogen treatment, modulation of estrogen-regulated gene expression was observed as early as 2 hours after EP treatment, indicating that PR can directly affect the transcriptional activities of ER (fig. S3, C and D). In addition to these acute effects, PR activation also reprogrammed estrogen-regulated transcriptomes in tumors and cell lines following relatively long-term hormonal treatment times of 12, 24, or 48 hours (Fig. 1G and fig. S1J). All next-generation sequencing results were validated with real-time polymerase chain reaction (RT-PCR) (fig. S3, E to G). In agreement with these observations, progestin had an insignificant effect on estrogen-induced cell proliferation in ER+/PR− tumors (fig. S2, E to G) and in PR-deficient T47D cells (fig. S2B). However, the antiestrogenic effects of progestin were rescued in PR-deficient T47D cells when PR was reexpressed (fig. S2B). In agreement with these results, the endogenous PR expressed in MCF7 cells under estrogenic conditions was sufficient to abrogate estrogen-induced cell proliferation in response to progestin (fig. S2B). Collectively, these findings illustrate that progestin-activated PR is necessary and sufficient to reprogram estrogen-induced gene expression, cellular signaling pathways, and cell proliferation not only in cell lines but also in primary tumor tissues.
PR dictates ER chromatin binding
Chromatin binding of ER and PR is critical to their function as ligand-activated nuclear transcription factors (25, 26). Hence, it is important to understand ER and PR crosstalk at the chromatin level and determine what happens to the estrogen-stimulated ER cistrome in the presence and absence of activated PR. Chromatin immunoprecipitation sequencing (ChIP-seq) of nine ER+/PR+ patient tumor specimens (27) revealed that ER chromatin binding was remarkably consistent, whereas ER binding in six ER+/PR− patient tumors was highly variable (Fig. 2A). This observation suggests that PR positivity is associated with more consistent ER binding patterns in breast tumors. In accord with these results, activated PR increased activated ER binding events fourfold in ER+/PR+ breast cancer cells (Fig. 2, B and C) and redirected ER to sites that correlated with genomic binding of PR and complexes of ER and PR (Fig. 2, D and E). In comparison to these experiments, which were carried out in charcoal-stripped serum medium with 45 min of hormone exposure, similar experiments in complete medium (estrogenic) and hormonal stimulation for 3 hours demonstrated a significantly higher proportion of ER conserved sites (10). The relative proportions of ER lost, conserved, and gained sites are dynamic and appear to depend on the presence of other factors in complete medium and the duration of hormonal stimulation. Whereas ER largely bound near transcription start sites in PR-negative tumors and in PR-deficient cells (Fig. 2F), ER binding in PR+ samples primarily occurred distal to promoters (Fig. 2G). ER and PR binding was assessed at selected sites by ChIP-PCR (fig. S4, A and B). This observation suggests that activated PR alters ER genomic activity by sequestering ER at sites that promote its function as a distal enhancer rather than as a proximal promoter of gene transcription. In ER+/PR+ T47D cells, PR-redirected ER binding sites did not correlate with ER binding sites observed in the absence of progestin (Fig. 2D). Furthermore, progestin-mediated expansion and redirection of ER binding were significantly diminished in PR-deficient cells (Fig. 2, B and D), demonstrating a critical role for activated PR in determining patterns of ER binding in breast cancer cells. In agreement with these findings, PR and multiple PR-associated transcriptional co-regulators (for example, NF1C, SP1, and KLF5) were the most highly enriched motifs at progestin-dependent ER binding sites (fig. S4C).
Fig. 2. PR redirects ER binding to sites correlated with the binding of PR and ER/PR complexes.

(A) Principal component analysis (PCA) plot displays 79% total variance between ER binding events in nine ER+/PR+ (green) and six ER+/PR− (red) patient tumors [sequencing data were obtained from the study by Ross-Innes et al. (27)]. (B) Overlap of ER binding sites in PR+ and PR-deficient T47D cells treated with estrogen or EP. (C) Heat maps display intensity of sequencing obtained on anti-ER ChIP before and after remodeling by R5020 in PR+ T47D cells. The genomic window of the union of all ER binding sites observed before and after remodeling by PR is displayed. Overlap of at least 1 base pair (bp) was considered to categorize ER binding as lost, conserved, or gained. (D) PCA plot depicts 81% total variance between binding events for ER, PR, and ER/PR complexes observed upon treatment with estrogen, progestin, or EP. Binding events in PR+ and PR-deficient T47D cells are presented. All the binding sites and their annotations are provided in table S6. (E) Distributions of receptor binding around reprogrammed ER binding sites. Distributions for ER binding observed without progestin and binding for PR and ER/PR complexes on estrogen plus progestin treatment are plotted. (F) Distributions around transcription start sites for ER binding observed in six ER+PR− and eight ER+PR+ human tumors. One outlier within the ER+/PR+ group was not included in the analyses. (G) Frequencies of binding events for ER, PR, and ER/PR complexes relative to their distance from transcription start sites. Hormone treatment is mentioned in parentheses. The numerical values for the total number of binding sites (gray) and the number of binding sites within the 3-kb promoter regions (white) are provided. ChIP-PCR assessments of ChIP-seq were done as three independent experiments and three technical replicates per experiment (fig. S4). ChIP-seq was performed on one of the three biological replicates.
Progestin stimulation remodels nucleosomes to redirect ER binding to enhancers and BRCA1 motifs
Given that PR can dictate ER chromatin binding and modulate estrogen-stimulated transcriptional activity, mechanistic insights into how PR orchestrates ER binding would help in the exploitation of ER/PR crosstalk for breast cancer prognosis and treatment. The relative ratio of ER to PR expression may not be a limiting factor, because overexpression of ER (fig. S5, A and B) or moderate knockdown of PR (fig. S5, C and D) did not alter PR-mediated regulation of estrogen-stimulated gene expression. Immunoprecipitation (IP) of ER pulled down PR under all treatment conditions (Fig. 3A and fig. S5E), thus providing direct evidence for the existence of ER/PR complexes and noncompetitive interactions between these receptors (7–10, 28). Joint ligand activation facilitated the formation of ER/PR complexes, as reflected in the 3.8-fold increase in PR pulled down with ER upon dual treatment compared to PR pulled down in cells treated with vehicle (Fig. 3A and fig. S5E). These ER/PR complexes were recruited to chromatin upon joint ligand activation, as illustrated by the strong signal obtained from repeated ChIP (reChIP) experiments with ER-IP followed by PR-IP but not when ER-IP was followed by IP with a nonspecific immunoglobulin control (Fig. 3B and fig. S5F). In addition to the recruitment of ER/PR complexes to genomic loci, ER and PR also interacted via long-distance chromatin looping between their hormone response elements (Fig. 3C), indicating that ER/PR complexes can facilitate interactions between proximal and distal regulatory regions. ER/PR complexes mostly bound to H3K4me1+/H3K27ac1+ enhancers and to the enhancers with the highest H3K4me1+ signal intensity (Fig. 3D), indicating that ER/PR complexes are likely recruited to active enhancers. Also, PR substantially increased ER binding to distal enhancer regions (Fig. 3D). As further evidence for an active role of ER/PR in regulating transcriptional processes, key proteins in breast carcinogenesis, including BRCA1 (29), nuclear factors (30), and forkhead proteins (31), were the most enriched motifs at the binding sites of these complexes (Fig. 3E and fig. S5G). BRCA1/2 carriers are reported to have 121% higher levels of serum progesterone (32), and PR antagonists have been proposed as cancer prevention agents in BRCA1-mediated mammary tumorigenesis (33). BRCA1 motifs were highly enriched at binding sites of ER/PR complexes, suggesting a potential role for BRCA1 in ER/PR crosstalk.
Fig. 3. Progestin stimulation remodels nucleosomes to redirect ER binding to enhancers and binding sites enriched for BRCA1.
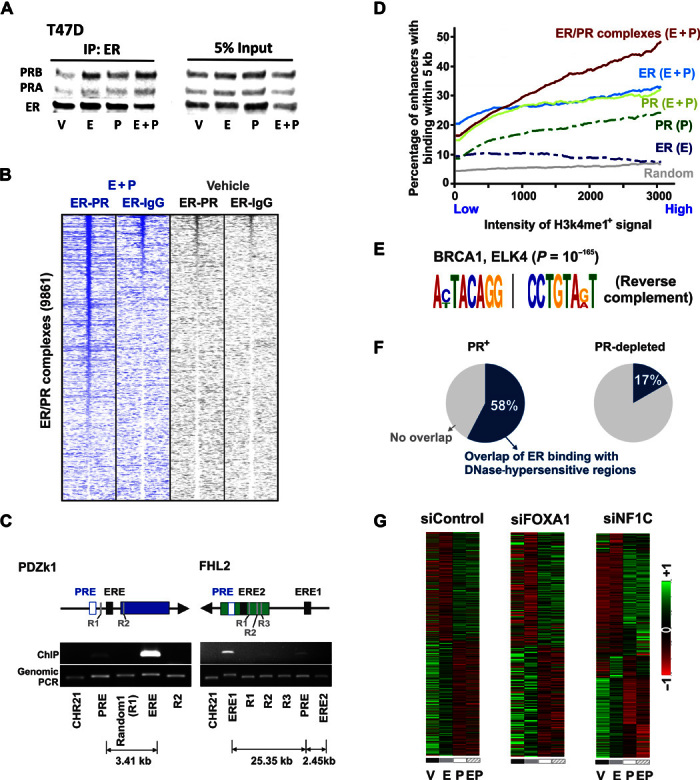
(A) Anti-ER immunoprecipitation followed by immunoblotting for both ER and PR in T47D cells treated with different hormones. (B) Heat maps display intensity of sequencing obtained on reChIP-seq of anti-ER, followed by anti-PR or nonspecific immunoglobulin G (IgG) control. The genomic window of the binding of ER/PR complexes is displayed. (C) Capture of Associated Targets on Chromatin (CATCH) of estrogen response elements at PDZk1 and FHL2 loci pulls down distant progesterone response elements that interact with the pulled-down regions. The PCR enrichment of the pulled-down region, the interacting progesterone response elements, and random controls is shown. (D) Cumulative average of the percentage of H3K4me1+/H3K27ac1+ enhancers with the receptor binding within 5 kb. The enhancers are sorted from left to right in the increasing order of H3K4me1+ signal intensity. (E) BRCA1 and ELK4 binding motifs are highly enriched at binding sites for ER/PR complexes. The significance of the enriched motif is reported by P value. (F) Percentage overlap of ER binding sites with DNase-hypersensitive regions observed upon treatment of T47D or PR-depleted T47D cells with progestin [DNase-seq sequencing data were obtained from the study by Ballaré et al. (34)]. An overlap window of 20 kb is used for analyses. (G) Row-normalized heat maps depicting normalized expression of estrogen- and progestin-regulated genes in T47D cells after small interfering RNA (siRNA)–specific depletion of FOXA1, NF1C, or a nonspecific control. Heat maps for siFOXA1 represent genes that have FOXA1 binding within 100 kb of the gene’s promoter [FOXA1 binding data were obtained from the study by Hurtado et al. (26)].
Whereas activated PR binds regions with high nucleosome occupancy and remodels chromatin (34, 35), ER binding is reported to require previously established chromatin accessibility that is created upon remodeling of nucleosomes (26, 36). In accord with this view, a 58% overlap between ER binding sites and deoxyribonuclease (DNase)–hypersensitive regions (34) was observed after T47D cells were treated with progestin (Fig. 3F). However, depletion of PR reduced this overlap to 17%, suggesting that PR is required for ER binding to progestin-induced DNase-hypersensitive regions (Fig. 3F). Given that activated PR influenced chromatin accessibility for ER binding, it is not surprising that depletion of either of the known cofactors, FOXA1 (31, 37) or NF1C (30, 38, 39) (fig. S6, A and B), did not significantly affect the effects of PR on estrogen-regulated gene expression (Fig. 3G and fig. S6C). This finding is interesting because although FOXA1 and NF1C are important for both ER- and PR-regulated gene expression when considered in isolation (fig. S6, D and E), they are not required for the effects of PR on ER-regulated gene expression, even for genes that have FOXA1 binding sites within 100 kb of their promoters (Fig. 3G and fig. S6C). These results are further supported by reports of a 99% overlap between progesterone-induced ER binding and PR sites. However, FOXA1 could be found at only 49% of those sites (10). Moderate knockdown of PR significantly affected ER-regulated gene expression (fig. S5, C and D), and activated PR was required for progestin-mediated redirection of ER binding (Fig. 2D). Additionally, under joint hormone conditions, PR is the only protein that is differentially pulled down with ER (10), suggesting a far more important role for PR in regulating estrogen signaling. It remains to be determined whether, in addition to its genomic actions, PR is affecting estrogen signaling through nongenomic mechanisms (8) or which chromatin remodelers facilitate the actions of PR (40). Collectively, these results indicate a complex and dynamic interplay between PR and chromatin, and suggest that at a subset of sites, PR can bind regions of high nucleosome occupancy (34, 35) and facilitate the binding of other transcription factors via chromatin remodeling.
The presence and activity of PR contribute to the prognostic value of ER
PR-mediated reprogramming of estrogen signaling further highlights the prognostic value of PR as a breast cancer biomarker. Activated PR reprogrammed the estrogen-regulated transcriptome to enrich for tumor-suppressive processes (Fig. 1I and fig. S2A), and progestin inhibited estrogen-induced increases in cell proliferation (fig. S2B), cell migration (fig. S2C), and invasion (fig. S2D). The breast cancer relevance of PR was further bolstered by the findings that PR-regulated genes were enriched in gene signatures for estrogen response, breast cancer subtype classifiers, therapy resistance, and metastasis (fig. S7A). Although PR is considered a surrogate of functional estrogen signaling, an analysis of Molecular Taxonomy of Breast Cancer International Consortium (METABRIC) (41) and The Cancer Genome Atlas (TCGA) (42) cohorts revealed that PR is independently lost in ER+ tumors because of hypermethylation of its gene locus (Fig. 4, A and B). In agreement with previous reports (6, 10, 43, 44), PR is also lost in ER+ tumors because of deletion of its gene locus (fig. S4B), and the frequency of deletion is higher in aggressive luminal B cancers (Fig. 4C), suggesting an association between the loss of PR and aggressiveness of luminal cancers. The independent loss of PR in patient tumors is likely to result in altered estrogen signaling and tumor biology because activated PR is required for ER-regulated genes to differentiate patient survival (Fig. 4D). In further support of the clinical value of PR, PR-regulated gene profiles had independent prognostic values (fig. S7C), and tumor expression of PR positively correlated with favorable clinicopathological parameters (fig. S7D). Consistent with the importance of PR for determining the outcome of estrogen signaling, tumor ER staining was not able to differentiate survival outcomes for patients with PR-negative tumors (Fig. 4E), whereas tumor ER status significantly correlated with positive survival outcomes in the PR+ patient cohort (Fig. 4E). Collectively, these results suggest that PR is a major contributor to the clinical value of ER.
Fig. 4. Presence and activity of PR contribute to the prognostic value of ER.
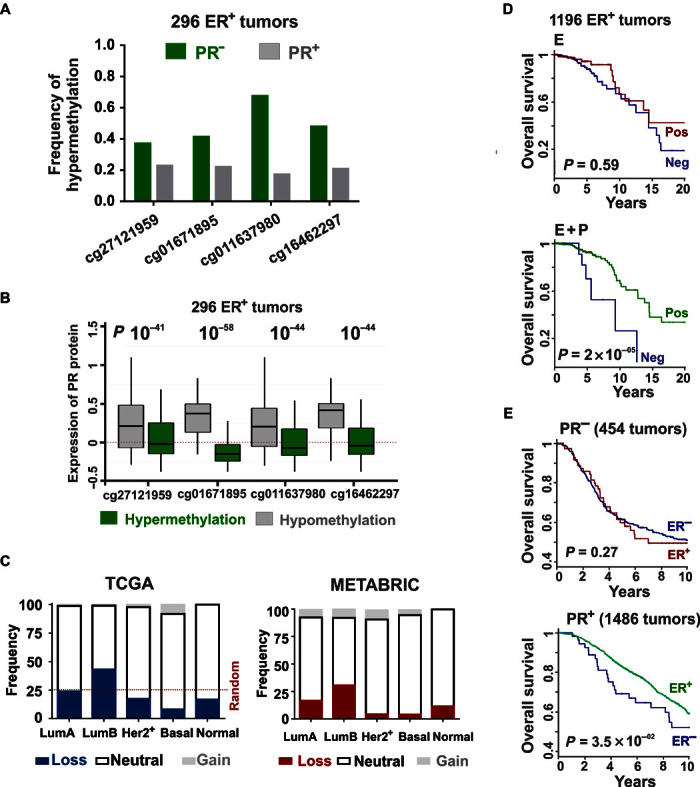
(A) Frequency of hypermethylation of PR locus in ER+ TCGA tumors categorized on the basis of PR status. (B) Hypermethylation of PR gene locus correlates with loss of PR expression in ER+ TCGA tumors, measured using reverse-phase protein arrays. The horizontal axis displays four PR-specific methylation probes from the Human Methylation 450k array. (C) Frequency of copy number variation of PR gene locus in TCGA and METABRIC cohorts categorized on the basis of prediction analysis of microarray 50 (PAM50) breast tumor subtypes (22). (D) Overall survival in the TCGA cohort classified by positive or negative correlation to estrogen-regulated signature scores. Curves are presented for before (red) and after (green) progestin-mediated reprogramming of estrogen signaling. (E) Overall survival as determined by the differential tumor staining for ER in PR-negative (red) and PR+ (green) patient cohorts from METABRIC. Summaries of the patient cohorts are provided in table S7.
Cotherapy with tamoxifen and selective PR modulator/antagonist CDB4124 results in cytotoxic tumor regression
PR-targeted therapies have been used with limited success in various cell lines, mouse models, and clinical trials (9, 16). Most approved PR modulators cross-react with other nuclear receptors, thus limiting their efficacy and utility (45). There is a lack of knowledge about the possible benefits of combined ER- and PR-targeting therapies in the clinic (16). Although ER is the major therapeutic target in ER+/PR+ breast cancers (24), the selective PR modulator/antagonist (SPRM) CDB4124 (45) effectively inhibited estrogen-driven growth of ER+/PR+ T47D xenografts (Fig. 5A). Whereas treatment with either tamoxifen or CDB4124 inhibited tumor growth, combined treatment resulted in a synergistic regression of tumor volume by 70% (Fig. 5A). The effectiveness of joint treatment was further highlighted by the rate of tumor regression, which was significant after 9 days of combination therapy, whereas individual drug treatments required much longer times to achieve significant tumor growth inhibition. In addition, whereas tamoxifen/CDB4124 combination therapy achieved and maintained 70% tumor regression throughout the course of the study, tumors treated with CDB4124 alone regressed initially and then developed resistance after 4 weeks of therapy (Fig. 5A). In contrast to our finding of cytotoxic tumor regression upon joint treatment with tamoxifen and an SPRM, combination therapy with a PR agonist and tamoxifen resulted in cytostatic inhibition of tumor growth (10). It is notable that whereas both agonist- and antagonist-activated PRs potentiate responses to tamoxifen, only the SPRM/antagonist promotes tumor regression. Furthermore, agonist-activated PR is reported to enrich stem cell and receptor-negative populations and contribute to tumor relapse (46, 47), indicating that cotherapy with PR antagonists not only has more potent antitumor activity but also lacks protumor effects of PR agonists and therefore may be a potential way forward. These results indicate that PR-mediated reprogramming of estrogen signaling is therapeutically relevant and that SPRMs, especially in combination with antiestrogens, might be effective therapies for ER+/PR+ breast cancers.
Fig. 5. Cytotoxic tumor regression on combination therapy with tamoxifen and PR antagonist CDB4124.
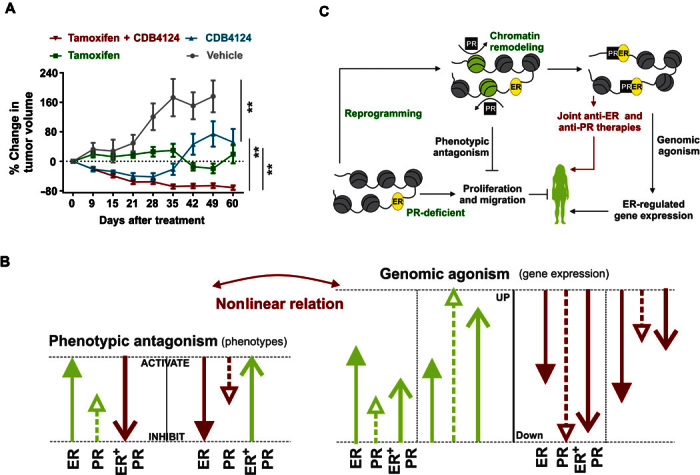
(A) T47D xenografts were grown in ovariectomized nude mice containing estrogen silastic implants and were treated with placebo, tamoxifen, CDB-4124, or tamoxifen plus CDB4124. The average tumor volume at the start of therapies was 125 mm3, and percentage change in tumor volume is shown (n = at least 7). P values are calculated using mixed linear modeling. Control group is plotted until day 49 because a significant number of mice in the control group died after day 49. (B) Genomic agonism: In isolation and in combination, activated ER and PR regulate the expression of most of the genes in similar directions. The magnitude of gene expression on joint estrogen plus progestin treatments correlates with those observed with progestin alone, but not estrogen alone. Phenotypic antagonism: Individually, estrogen and progestin activate most of the oncogenic pathways in similar directions, but progestin lacks the degree of activation induced by estrogen. When both ER and PR are active, PR opposes ER-regulated phenotypes, suggesting phenotypic antagonism between these hormones. (C) Model for ER/PR crosstalk. PR remodels chromatin and redirects ER binding to antagonize estrogen signaling and to potentiate response to antiestrogens. Genomic agonism and the phenotypic antagonism between ER and PR highlight the prognostic and therapeutic value of PR in ER+/PR+ breast cancers. **<0.005.
DISCUSSION
The results presented here demonstrate that estrogen and progestin have different biological consequences when considered in isolation versus when both hormones are present (Fig. 5B). Individually, as well as in combination, these hormones act as genomic agonists because they modulate gene expression in similar directions (Fig. 5B). In isolation, both hormones activate or inhibit cellular processes in similar directions, although the magnitude of these effects is less for progestin alone than for estrogen alone. Although transcriptome patterns and ER/PR recruitment that result from dual-hormone treatment correlate with progestin alone, they are sufficiently different, resulting in net antagonism of oncogenic processes, which is consistent with tumor-suppressive functions of the combined, but not individual, activities of these two receptors. Although PR-mediated antagonism of estrogenic phenotypes is well documented (10, 20), our finding of genomic agonism and phenotypic antagonism suggests a nonlinear relationship between the genomic and phenotypic actions of these receptors (Fig. 5B). In contrast to more uniform cell models, tumor heterogeneity in patients can contribute to observed heterogeneity in tumor response. Despite this expected heterogeneity, net genomic agonism and phenotypic antagonism were observed in most of the patient tumors analyzed in this study. In seven of eight tumors (P1 to P3 and P5 to P8), individual estrogen and progestin treatment modulated gene expression in similar directions (Fig. 1, A to D, and fig. S1, A to F). In addition, joint activation of ER and PR antagonized ER-regulated oncogenic processes in five tumor explants treated ex vivo for 24 hours (Fig. 1I). Thus, the intersection of multiple biological processes (nongenomic effects, posttranslational modifications, transcript levels, etc.) can possibly have the net effect of creating a nonlinear relationship between gene expression and the observed phenotype.
A number of studies have reported that PR forms complexes with ER (7–10, 28). Our data further show that PR redirects ER binding to sites that correlate with the binding of PR. Significantly, the genomic ER binding patterns in primary PR+ tumor explants are highly conserved among multiple tumors (Fig. 2A). PR redirects ER binding to distal enhancers (Fig. 2, F and 2G) enriched for BRCA1 motifs, suggesting a potential role for BRCA1 in ER/PR crosstalk (32, 33). Both receptors interact via long-range looping (Fig. 3C), indicating that ER/PR complexes are probably not preassembled and that these interactions bring together distal regulatory regions. Others have shown that PR binds regions with high nucleosome occupancy and contributes to chromatin opening (30, 34, 35). A high degree of overlap was observed between ER binding and DNase-hypersensitive regions created by PR (Fig. 3F). Knockdown of cofactors FOXA1 and NF1C, which are reported to be important for ER binding (30, 36), had little impact on the effects of PR on ER-regulated gene expression (Fig. 3G). In the presence of estrogen and progestin, PR is the only protein that is differentially pulled down with ER (10), and although there is a 99% overlap between ER and PR binding, FOXA1 is present at only 49% of those sites (10). These results suggest that PR can alter the chromatin landscape and influence the binding of other transcription factors, including ER (Fig. 5C). Experiments carried out in complete estrogenic medium (10) suggested similar reprogramming by PR, and our studies in charcoal-stripped serum medium treated with different combinations of estrogen and progestin allowed a direct comparison between the individual and combined activities of ER and PR. Thus, similar to the transcriptome results, receptor recruitment in response to joint activation of ER and PR correlated with PR alone but not ER alone (Fig. 2D), indicating that PR is a driver of ER activity.
The presence and activity of PR significantly affect the prognostic value of ER. The observed loss of PR protein expression in a subset of ER+/PR+ breast cancers, because of hypermethylation or deletion of the PR gene locus, results in the loss of ER prognostic value (Fig. 4D), demonstrating not only that PR is an essential modulator of ER-regulated genes but also that it significantly contributes to the prognostic value of ER in ER+/PR+ breast cancers. In addition, PR-regulated genes have independent prognostic value, and the presence of PR correlates with favorable clinicopathological outcomes (fig. S7D). These findings emphasize the clinical value of assessing both PR and ER expression in breast cancer samples (6).
As shown in Fig. 5A, the SPRM CDB4124 synergizes with tamoxifen to elicit a sustained 70% regression of T47D ER+/PR+ explants, whereas individual therapies inhibit tumor growth without sustained regression. Combination therapy with tamoxifen and progesterone, a PR agonist, is reported to inhibit T47D tumor explant growth but with no regression (10). Thus, targeting both ER and PR with selective antagonists might have clinical value by promoting tumor regression. Also, the use of PR agonists might not be ideal because PR agonists contribute to tumor relapse by enriching stem cell and receptor-negative populations and expanding drug-resistant clones (46–48).
In conclusion, this study demonstrates that progestin-activated PR redirects ER chromatin binding and functions as a genomic estrogen agonist and as a phenotypic estrogen antagonist in ER+/PR+ breast cancer cells and human tumors. In addition, we show that SPRMs can synergistically potentiate therapeutic responses to tamoxifen, a selective ER modulator, in ER+/PR+ tumor explants. Our data also provide an explanation for how PR contributes to the clinical value of ER as a prognostic/predictive biomarker. Further exploration of combined selective ER/PR therapeutic targeting in hormone-sensitive breast cancers is warranted.
MATERIALS AND METHODS
Patient tumor explants
Twelve tumor samples and all relevant clinical information were obtained from women undergoing breast surgeries at Burnside War Memorial Hospital, Adelaide [Institutional Review Board (IRB) approval nos. H-065-2005 and H-169-2011] and University of Texas Southwestern Medical Center (IRB approval no. STU 032011-187). Eight tumors are ER+/PR+ (P1 to P8), and four tumors are ER+/PR− (N1 to N4). The ex vivo procedure was initiated within hours of surgery (49). Briefly, sliced pieces of tumors were incubated on gelatin sponges for 36 hours in charcoal-stripped serum medium. Representative pieces of tumors were, in parallel, fixed in 4% formalin, and subsequently, immunohistochemistry for ER and PR proteins was performed to assess the status of tumors for these receptors. In parallel, apportioned tumors were treated with vehicle, estradiol (E2), R5020, or the combination of E2 and R5020 for 24 or 48 hours before they were subjected to ki67 immunostaining and RNA extraction. Pieces of treated ER+/PR+ and ER+/PR− tumor samples were immunostained for the proliferation marker ki67, and the slides were scanned at ×40 magnification using a NanoZoomer microscopy system. The sequencing data (FASTQ format) for anti-ER ChIP-seq in nine ER+/PR+ and six ER+/PR− tumors were obtained from Ross-Innes et al. (27). These sequencing data were reanalyzed to answer the questions asked in the current paper.
To study the transcriptome changes in response to hormone treatments, sequencing libraries were made from the RNA extracted from each of the treated tissue samples, and next-generation sequencing was performed. Because of limited tumor size, the R5020-treated explant was not available for tumor N1. See the RNA-seq data analysis section for further details.
Xenograft experiments
All mouse studies were carried out under an approved Institutional Animal Care and Use Committee protocol. Nude mice (J:nu) were obtained from The Jackson Laboratory at an age of 4 to 6 weeks. All mice were ovariectomized females with an average weight of 20 g. Nude mice were anesthetized with isoflurane, and an incision was made on the back of the neck. A silastic implant containing E2 was inserted under the skin, and several sutures were applied. Circulating E2 determinations were made by the University of Chicago clinical laboratory by obtaining blood from mice with implants by cardiac puncture. The 5-mg E2 silastic implants were made as follows: A 1.4-cm portion of silastic tubing (Dow Corning, 0.078 × 0.125–inch outer diameter; catalog no. 508-009) was filled with 5 mg of E2 (Sigma E2758-1G) and 10 mg of cellulose (Sigmacell Cellulose Type 20, 20 μm; S3504-500G) and sealed with aquarium glue. Sufficient numbers of T47D cells were cultured in vitro, and at the day of cell injections, the cells were harvested and suspended in phosphate-buffered saline (PBS). Ten million T47D cells were injected in the mammary fat pad along with biodegradable Matrigel. Two tumors per mice were grown (left- and right-hand side mammary fat pads). From a month of initial cell injections, after the tumors reached 120 mm3, the mice were implanted with 25-mg and 90-day-release pellets for CDB4124, placebo, tamoxifen, or CDB4124 in combination with tamoxifen (Innovative Research of America). Xenograft tumor size was measured weekly, and percentage change in tumor volume since the start of therapy is reported. Sixty days after implantation, tumors were excised, weighed, and fixed or stored in liquid nitrogen for subsequent analysis.
Cell culture
Cells were grown in RPMI 1640 supplemented with 10% fetal bovine serum (FBS) and 1% penicillin-streptomycin. T47D cells and derived sublines were provided by K. Horwitz (50). Briefly, ER+/PR-low T47D cells were derived from parent ER+/PR+ T47D cells through flow cytometry, and PR was stably reexpressed in ER+/PR-low T47D cells to create PR-reexpressed T47D cells. The medium used to grow PR-reexpressed T47D cells was supplemented with geniticin (200 μg/ml) (Life Technologies, no. 10131-027) for selection. Before experiments, cells were cultured for 48 hours in phenol red–free RPMI 1640 supplemented with charcoal-stripped FBS and 1% penicillin-streptomycin (steroid-deprived medium). E2 (Sigma, no. E8875-250MG) and R5020 (PerkinElmer, no. NLP004005MG) dissolved in ethanol (vehicle) were used at a final concentration of 10 nM for all experiments.
Cell migration (scratch wound) assays
T47D cells were grown in 96-well ImageLock plates (Essen BioScience, no. 4379). After the cells reached 90% confluence, they were deprived of steroids for 48 hours. Thereafter, scratch wounds were made using a 96-pin WoundMaker (Essen BioScience, no. 4493) and washed twice with PBS. Cells were then treated, and the confluence of the wound was analyzed over time using an integrated cell migration analysis module (Essen BioScience, no. 9600-0012). Wound confluence is expressed as the percentage of the wound area occupied by cells and was plotted 48 hours after drug treatments.
Cell invasion (Matrigel invasion) assays
Matrigel (BD Biosciences, no. 356231) was dissolved 1:40 in steroid-deprived RPMI 1640, and 50 μl was aliquoted to the bottom of each well of a 96-well ImageLock plate (Essen BioScience, no. 4379). Thereafter, the plate was incubated at 37°C for 30 min to allow the Matrigel to solidify, and excess medium was removed. Cells were then plated on the top of the Matrigel layer and allowed to grow for 48 to 72 hours until they reached 100% confluence. Subsequently, scratch wounds were made using the 96-pin WoundMaker (Essen BioScience, no. 4493) and washed with PBS. Matrigel was then dissolved in steroid-deprived RPMI 1640 containing hormone treatment, and another 50-μl layer of Matrigel was applied above the cells. After complete solidification, 200 μl of steroid-deprived RPMI 1640 containing hormone treatment was added to the wells. Confluence of the Matrigel invasion was analyzed over time using the integrated cell migration analysis module (Essen BioScience, no. 9600-0012). Matrigel invasion is expressed as the percentage of the Matrigel-filled wound area that is occupied by cells. Matrigel invasion represents 48 hours after treatment.
Confluence and proliferation studies
Cells were plated in a 96-well plate. After reaching 30% confluence, cells were deprived of steroids for 48 hours and then treated as indicated. The cell confluence was measured over time using Essen BioScience IncuCyte. Confluence is defined as the percentage of area covered by cells. To count cell number, T47D cell nuclei were labeled green with CellPlayer NucLight Green (Essen BioScience) and counted via the IncuCyte.
Transfection
Small interfering RNA
Cells were cultured to 50 to 60% confluence, the medium was changed to Opti-MEM, and cells were transfected with 100 nM of each siRNA using Lipofectamine 2000. siGENOME RNA pools for siPGR (M-003433-01), siNF1C (M-008362-00), siFOXA1 (M-010319-01), and a nontargeting control (D-001206-13) were obtained from Dharmacon. After 24 hours, the medium was replaced with steroid-deprived RPMI 1640 for 48 hours, following which the cells were incubated with the indicated treatment for 12 hours and collected for analysis.
ER overexpression
Cells were cultured to 50 to 60% confluence and then transfected with either pcDNA3.1 plasmid containing full-length ESR1 or a control pcDNA3.1 vector using FuGENE HD. After 24 hours, the medium was changed to steroid-deprived RPMI 1640 for 48 hours, following which the cells were incubated with the indicated treatment for 12 hours and collected for analysis.
Protein expression
Cells were grown to 60 to 70% confluence and lysed with standard radioimmunoprecipitation assay buffer. The resulting total cell lysate was run on SDS–polyacrylamide gel electrophoresis gel, transferred onto nitrocellulose membrane, and immunoblotted using antibodies for the proteins of interest. Antibodies used for immunoblotting are anti-ER (HC-20 from Santa Cruz Biotechnology), anti-PR KD68 (in-house developed), anti-actin (A2228 from Sigma), anti-FOXA1 (Ab5089 from Abcam), and anti-NF1C (gift from N. Tanese, New York University). Protein expression was normalized to actin loading control.
Coimmunoprecipitation
T47D cells were plated in 10-cm dishes and serum-starved for 72 hours before treatment. Cells at 70 to 80% confluence were then treated as indicated. Cells were washed twice with 5 ml of ice-cold PBS, harvested via scraping, and pelleted at 4°C. The cells were suspended in 300-μl lysis buffer [0.1% CHAPS, 40 mM Hepes (pH 7.5), 120 mM NaCl, 1 mM EDTA, 10 mM Na pyrophosphate, and 10 mM β-glycerophosphate; supplemented with a protease inhibitor cocktail solution (1:100), 50 mM NaF, and 0.5 nM NaOV4] and incubated on ice for 15 min. The cells were lysed via three cycles of snap freeze in liquid nitrogen, followed by thaw on ice. Protein concentration was measured, and 2 mg of total protein was used for co-IP. Five percent, by volume, of the sample was saved as input. Samples were incubated overnight at 4°C with 0.8 μg of anti-ER (Santa Cruz Biotechnology, HC-20) and immunoprecipitated with 30 μl of magnetic protein G beads (Life Technologies, no. 10004D) for 1 hour. After washing three times with lysis buffer, samples were eluted in 20 μl of standard 2× Laemmli buffer and loaded on the gel alongside input samples. The gel was then immunoblotted for ER and PR.
Capture of Associated Targets on Chromatin
T47D cells were grown in regular RPMI medium. When the cells reached 80% confluence, they were fixed with 1% formaldehyde for 10 min, followed by quenching with 250 mM tris (pH 8.0). The fixed cells were harvested, lysed in lysis buffer, and sonicated in Diagenode Bioruptor (30 s high/30 s low) for 15 min. The sheared chromatin was precleared of any endogenous biotin by incubating them with preequilibrated streptavidin beads for 60 min at 25°C. The streptavidin beads were preequilibrated by incubating in CATCH buffer [10 mM Hepes, 30 mM NaCl, 2 mM EDTA (pH 8.0), 0.2% SDS, and protease inhibitors]. Subsequently, the precleared chromatin was obtained, and the beads were discarded. Precleared chromatin (20 μl) was used as input. Biotinylated oligos specific to the genomic regions of interest were designed and ordered from Integrated DNA Technologies (IDT). The sequences of biotinylated oligos are provided in table S3. Then, to pull down the genomic region of interest, the precleared chromatin was incubated with specific biotinylated oligos (300 nM final concentration) in a controlled thermal reaction [25°C for 1 min (equilibration), 81°C for 4 min (genomic DNA denaturation), 72° to 50°C decreasing gradient (15 s/1°C), 42°C for 10 min (hybridization), and 25°C hold].
Unhybridized oligos were removed with illustra Sephacryl (S-400 HR) microspin column according to the manufacturer’s instructions. Subsequently, 300 μl of nuclease-free water was added to the sample. After that, the resulting mixture was incubated with 25 μl of preequilibrated streptavidin beads to immunoprecipitate chromatin annealed to the biotinylated oligos. The streptavidin beads were preequilibrated by incubating in CATCH buffer. Immunoprecipitated protein-DNA complexes were washed thrice with CATCH buffer at 42°C while shaking at 1000 rpm on a thermomixer. The beads were resuspended in 150 μl of de–cross-linking buffer [30 mM tris-Cl (pH 8.0), 30 mM NaCl, 0.5 mM EDTA, 0.1 mM EGTA, and 1% SDS] supplemented with 1 μl of ribonuclease A (RNase A) (20 mg/ml). After that, the beads were incubated at 55°C while shaking at 700 rpm on a thermomixer for 60 min. Subsequently, 5 μl of proteinase K (20 mg/ml) was added to each sample, and the protein-DNA complexes were de–cross-linked for 3 to 6 hours (or overnight) at 65°C while shaking at 700 rpm on a thermomixer. After de–cross-linking, the samples were incubated at 100°C for 1 min. Finally, the DNA fragments were purified using the phenol/chloroform/isoamyl alcohol extraction method. The interaction between genomic regions was assessed by the PCR enrichment of that genomic region in the final pulled-down DNA fragments. PCR was performed with primers designed for regions suspected to be interacting with the targeted pulldown. The PCR of the pulled-down region was used as a positive control. Primers flanking a disparate genomic region (on chromosome 21) were used as a negative control. PCRs with control primers flanking regions up- and/or downstream of these interacting regions were used as experimental controls. The primer sequences used for chromosome capture are provided in table S3. The products of the PCR enrichment were sequenced to confirm the identity of purified regions and other genomic regions that interact with it.
ChIP and ChIP-seq
Cells were grown in steroid-deprived RPMI for 48 hours to 80% confluence, before they were treated for 45 min with ethanol, E2, R5020, or E2 plus R5020. Cells were then fixed with 1% formaldehyde for 10 min, and the cross-linking was quenched with 0.125 M glycine for 5 min. Fixed cells were suspended in ChIP lysis buffer [1 ml of 1 M tris (pH 8.0), 200 μl of 5 M NaCl, 1 ml of 0.5 M EDTA, 1 ml of NP-40, 1 g of SDS, and 0.5 g of deoxycholate] and sheared in Diagenode Bioruptor for 20 min (30-s cycles). Sheared chromatin (100 μl) was removed as input control. A 1:10 dilution of sheared chromatin in ChIP dilution buffer [1.7 ml of 1 M tris (pH 8.0), 3.3 ml of 5 M NaCl, 5 ml of 10% NP-40, and 200 μl of 10% SDS; to 100 ml with H2O], 4 μg of antibody, and 30 μl of magnetic Dynabeads were incubated in a rotator at 4°C overnight. Chromatin was immunoprecipitated overnight using anti-ER (Santa Cruz Biotechnology, HC-20), anti-PR (KD68), or serum IgG. To ChIP for histone enhancer marks, anti-H3K4me1+ (Abcam, ab 8895) and anti-H3K27ac1+ (Abcam, ab 4729) antibodies were used. Next, the immunoprecipitated chromatin was washed with ChIP wash buffer I [2 ml of 1 M tris (pH 8.0), 3 ml of 5 M NaCl, 400 μl of 0.5 M EDTA, 10 ml of 10% NP-40, and 1 ml of 10% SDS; to 100 ml with H2O], ChIP wash buffer II [2 ml of 1 M tris (pH 8.0), 10 ml of 5 M NaCl, 400 μl of 0.5 M EDTA, 10 ml of 10% NP-40, and 1 ml of 10% SDS; to 100 ml with H2O], ChIP wash buffer III [1 ml of 1 M tris (pH 8.0), 5 ml of 5 M LiCl, 200 μl of 0.5 M EDTA, 10 ml of 10% NP-40, and 10 ml of 10% deoxycholate; to 100 ml with H2O], and tris-EDTA (TE) (pH 8.0). Elution was performed twice from beads by incubating them with 100-μl ChIP-elution buffer (1% SDS and 0.1 M NaHCO3) at 65°C for 15 min each. The eluted protein-DNA complexes were de–cross-linked overnight at 65°C in 200 μM NaCl. After de–cross-linking, the mixture was treated with proteinase K for 45 min, followed by incubation with RNase A for 30 min. Finally, DNA fragments were purified using the Qiagen PCR Purification Kit and reconstituted in 50 μl of nuclease-free water. RT-PCR was performed using SYBR Green (table S2). For ChIP-seq library preparations, libraries were prepared using Kapa Biosystems LTP Library Preparation Kit (no. KK8232) according to the manufacturer’s protocol, starting with 15 μl of DNA. For the PCR enrichment step of the library preparation protocol, 12 PCR cycles were performed.
ChIP followed by ChIP (reChIP) and reChIP-seq
T47D cells were treated for 45 min with ethanol or E2 plus R5020. ChIP was then performed using anti-ER (Santa Cruz Biotechnology, HC-20) as described above; however, chromatin was eluted in reChIP elution buffer (1× TE, 2% SDS, and 15 mM dithiothreitol supplemented with protease inhibitors). The eluted anti-ER ChIP sample was diluted 1:20 in ChIP dilution buffer supplemented with 50 μg of bovine serum albumin and protease inhibitors. The secondary ChIP (reChIP) was performed using anti-PR (KD68) or anti-IgG. Primer sequences used for reChIP–qRT-PCR (quantitative RT-PCR) are provided in table S2. For reChIP-seq library preparations, the final reChIPed DNA fragments were reconstituted in 30 μl of nuclease-free water. DNA (15 μl) was used to prepare reChIP-seq libraries using Kapa Biosystems LTP Library Preparation Kit (no. KK8232) according to the manufacturer’s protocol. For the PCR enrichment step of the library preparation protocol, 12 PCR cycles were performed.
RNA expression and RNA-seq
Cells were grown to 60 to 70% confluence and then treated as indicated for 2, 4, 8, or 12 hours. Fresh patient tumors were treated ex vivo for either 24 or 48 hours. Total RNA was extracted using the Qiagen RNeasy Kit, RNA was converted to complementary DNA (cDNA), and transcript levels were analyzed in the cDNA by RT-PCR using TaqMan probes. Transcript-specific oligonucleotides (labeled with TaqMan probes) were procured from IDT, and TaqMan reagents were purchased from Applied Biosystems. For RNA-seq library preparations, poly(A)-tailed mRNA was purified from 250 ng of total RNA using the NEBNext Poly(A) mRNA Magnetic Isolation Module [New England Biolabs (NEB), no. E7490]. The sequencing libraries were prepared using the NEBNext RNA Library Prep Kit (NEB, no. E7530). For the PCR enrichment step of the library preparation protocol, 12 PCR cycles were performed.
Statistical analysis
DNase I–hypersensitive site sequencing and data analysis
The DNase-seq (DNase I–hypersensitive site sequencing) data were obtained from GSE-41617 (http://public-docs.crg.es/mbeato/dsoronellas/DNAseq/). Briefly, T47D-MTLV (T47D cells containing MTV LTR strain C3H linked to luciferase gene) cells were treated with R5020 or vehicle for 60 min and DNase-seq was performed. Additionally, PR was knocked down and a similar DNase-seq experiment was performed in PR-depleted T47D-MTLV cells. Publicly available bigWig files (DNase-seq reads aligned to HG19 genome) were obtained, and vehicle treatment was subtracted from the progestin treatment. Subsequently, overlap was calculated between DNase-hypersensitive regions and all the ER bindings observed in T47D. An overlap window of 20 kb was used for the overlap analyses.
RNA-seq data analysis
About 2.7 billion 50-bp single-end RNA-seq reads were generated using the Illumina HiSeq System. The sequencing reads were groomed and aligned to the HG19 human genome build using a TopHat software. The assembled reads were then constituted in transcripts using the Cufflinks package. The Cufflinks output files of control and experimental samples were merged using cuffmerge, and differential gene expression was estimated by analyzing the merged output using the cuffdiff package. Transcripts that had greater than twofold expression change between the control and experimental drug treatments were selected and used for downstream analysis, such as to compare differential gene expression between experimental conditions, functional pathway analysis, and patient tumor analyses. Genes that were differentially expressed on E2, R5020, or combined E2 and R5020 treatments, compared to their expressions in vehicle-treated controls, are plotted in row-normalized heat maps. Tumor N1 lacks RNA-seq data for R5020 treatment. For this tumor, all the available sequencing reads from the corresponding treatment and PR+ tumor groups were combined and randomly down-sampled to make up for the respective data. Because of the high number of differentially expressed genes obtained in tumors P4, P6, and N5, the differentially expressed gene lists for these tumors were further focused by filtering based on false discovery rate cutoffs.
HTSeq package was used to calculate count matrices by overlapping the exonic browser extensible data (BED) files from the University of California, Santa Cruz (UCSC) with the expression block availability map (BAM) files that are obtained after aligning RNA-seq reads to the HG19 genome build. Subsequently, the count matrices were imported in DESeq2 package, and similarity matrices were computed using sample-to-sample distance function.
Row normalization allows a comparison of the relative expression of a gene across various treatment conditions. For any given gene, red (or blue) and green (or yellow) colors of a row-normalized heat map represent minimum and maximum magnitudes of normalized expression that are observed in response to various treatments. The focus of this article is to study transcriptomic changes in response to individual and dual treatments with estrogen and progestin. For this reason, the effects of PR on ER-regulated gene expression have been visualized using row-normalized heat maps.
ChIP-seq and reChIP-seq analysis
About 1.4 billion 50-bp single-end DNA-seq reads were generated using the Illumina HiSeq System. The sequencing reads were groomed and aligned to the HG19 build of the human genome using the Bowtie 2.0 software. ChIP peaks for different treatment conditions were called using MACS14, with the respective input files used as background. ChIP peaks with enrichment greater than or equal to 15-fold, with respect to input, were selected for each of the treatment conditions. Subsequently, control ChIP peaks obtained after vehicle treatment were subtracted from the ChIP peak data for each of the experimental conditions. The reChIP peaks obtained after vehicle treatment and the reChIP peaks observed upon the second pulldown with control IgG were used as controls. Hence, both of the reChIP controls were subtracted from the reChIP signal obtained on joint E2 plus R5020 treatment. ChIP peaks and reChIP peaks obtained after subtraction of control peaks were used for downstream analysis, such as to compare differential receptor binding between different experimental conditions, Ingenuity pathway analysis, and patient tumor analyses. These final ChIP peaks and reChIP data sets were shuffled 1000 times across the HG19 genome to generate the corresponding random data sets and null distributions for analysis. Differential binding in ChIP-seq was analyzed using the DiffBind R package. Receptor binding heat maps for ChIP were plotted 5 kb up- and downstream of the ChIP peak using the Repitools R package. An overlap of at least 1 bp was considered to determine whether two different ChIP peaks were overlapping. Investigations of ChIP peak overlaps were performed using GenomicRanges, IRanges, and GenomicAlignments R packages. Annotation of ChIP peaks was performed using ChIPseeker and ChIPpeakAnno R packages.
Enrichment analysis of protein binding motifs in ChIP regions
Two hundred thirteen position weight matrices for transcription factor binding were obtained from the JASPAR and TRANSFAC databases. Binding sites for ER or PR or ER/PR complexes were extended by 100 bp on both 5′ and 3′ ends, and their corresponding repeat-masked FASTA sequences were obtained from UCSC Genome Browser. The FASTA sequences were scanned for matches with the position weight matrices using the MEME-ChIP suite. The significance of the enriched binding motif is reported using P value, which is an estimate of the expected number of motifs with the given log likelihood ratio (or higher), width, and site count in a similarly sized set of random sequences. Finally, target transcription factors corresponding to the enriched binding motif were obtained using Tomtom from the MEME suite.
Functional pathway analysis
Ingenuity analyses were used to identify cellular processes that are enriched in the transcriptomes observed in ER+/PR+ explants in response to 24 hours of treatment with various hormones. Before running Ingenuity analyses, the gene expression was calculated relative to vehicle treatment. A separate Ingenuity analysis was done with the transcriptome data from T47D and ZR75 cells. The appropriate P values were calculated using right-tailed Fisher’s exact test and are subjected to Benjamini-Hochberg correction for multiple testing. The corrected P values measure the likelihood of association between the genes of interest and the functional pathway that can be due to random chance. Subsequently, differential regulation of functional pathways between treatments was performed using the comparison tool of Ingenuity and visualized on a radar chart by plotting the negative logarithm of the P value.
Analysis of functional module enrichment in PR-regulated genes
A total of 1412 cancer-relevant gene signatures were downloaded from all the Homo sapiens data sets available in MSigDB version 4.0. Target PR-regulated gene set consisted of genes that are differentially regulated on progestin treatment by at least twofold compared to vehicle control. Transcriptome data from T47D, MCF7, and ZR75 cells were used to perform functional module enrichment analysis. The target PR-regulated gene set was arranged in a descending order (maximally up-regulated genes at the top and maximally down-regulated genes at the bottom) and tested for enrichment in each of the human cancer–relevant gene signatures obtained from MSigDB. The obtained P values were subjected to Bonferroni correction, and the enrichment scores were normalized to the enrichment scores obtained for all the data set permutations. The network for the gene signatures enriched in PR-regulated genes was visualized in Cytoscape version 2.8. Enrichment results with false discovery rate less than 57% were used to make the network. In the network, each node represents a breast cancer signature annotated with its MSigDB identifier. The node size is inversely proportional to the Bonferroni-adjusted P value, and the edge width correlates with the overlap size of the enrichment between the functional modules.
Hypermethylation, copy number analysis, and PR protein expression analyses
Normalized DNA methylation data for 872 patients were obtained from TCGA’s JHU_USC 450 k methylation array. Phosphorylated or total protein expression by reverse-phase protein array (replicate-base normalization) was obtained from TCGA’s MD Anderson database for 747 patients. Subsequently, ER+ tumors that have complete data for methylation and protein expression were retained for downstream analyses. These ER+ tumors were categorized on the basis of their PR status, and the frequency for the methylation of PR-annotated methylation probes (cg27121959, cg01671895, cg011637980, and cg16462297) was determined in these subgroups. To assess the relation between methylation status and PR expression, hyper- and hypomethylated tumor groups were defined as the tumors in the top and bottom quartiles of methylation values. Subsequently, Welch two-sided t test was performed between PR protein expression in the hyper- and hypomethylated subgroups.
Normalized copy number variant (CNV) data sets (germ line deleted) were obtained from the TCGA database for 1099 patients. Similarly normalized CNV data were obtained from METABRIC for 1992 patients. Corresponding clinical information was also obtained from these databases. The tumors were categorized either on the basis of their ER status or according to PAM50 (22) breast cancer classifier (luminal A, luminal B, basal-like, normal, and Her2+). The patient tumors were called into PR gene loss, neutral, or gain groups based on the copy number alterations of the PR gene locus on chromosome 11. The proportions of tumors in a category with lost, unaltered, or gained PR gene locus determined the corresponding frequency of PR copy number alterations in that category. The category labels were permuted to calculate the random frequency levels.
Analysis of ER and PR binding and expression as predictors of clinical outcomes
The signature scores were calculated as a Spearman correlation between the receptor-regulated gene expression and the expression of receptor-target genes in a tumor sample. Estrogen-regulated gene expression in T47D cells before and after reprogramming by progestin was used to calculate ER signature scores in the absence or presence of activated PR. Similarly, progestin-regulated gene expression in T47D cells with or without estrogen was used to calculate PR signature scores in the absence or presence of activated ER. Genes with at least one receptor binding site within 100 kb of the gene’s transcription start site were identified as receptor-target genes (51). Survival analysis was done using these ER signature scores to understand how activated PR affects the prognostic value of ER-regulated genes. Similarly, analysis using the two PR signature scores was done to study the influence of activated ER on the prognostic value of PR-regulated genes. For each of these four independent analyses, ER+ tumors from the TCGA cohort (n = 1196) were divided into two categories based on their positive or negative correlation with ER or PR signature scores. Subsequently, for these two tumor categories, Kaplan-Meier survival curves for overall patient survival were plotted. P values were calculated using the log-rank test. The analysis was performed using the Survival package in R.
Analysis of prognostic value of a tumor ER and PR immunohistochemical staining
The immunohistochemical status of ER and PR (and other clinical data) were obtained from the METABRIC and TCGA patient cohorts. Tumors were divided into subgroups based on their positivity for ER and PR status. Kaplan-Meier survival curves for overall patient survival were plotted. P values were calculated using the log-rank test. The analysis was performed using the survival package in R. Associations between tumor PR status and other clinical and pathologic variables were studied using χ2 contingency test in R.
Supplementary Material
Acknowledgments
We acknowledge the Genomics Core at the University of Chicago for performing the next-generation sequencing. We thank the Human Tissue Resource Center for the tumor histology and the Animal Resources Center for the animal studies. The Center for Research Informatics provided the computing infrastructure. We thank D. Edwards, K. Horwitz, and N. Tanese for providing multiple reagents. We thank S. Birrell and C. Hoffman for consenting and recruiting breast cancer patients for this study and the patients for providing tissue samples. We also acknowledge S. Conzen for insightful discussions and B. A. Russell and G. Laven-Law for technical assistance. Funding: This work was supported by funding from The Virginia and D. K. Ludwig Fund for Cancer Research (G.L.G., H.S., R.J.B., A.L.Z., Y.-F.C., M.E.G., M.L., and A.G.D.). R.J.B. was supported by a Susan G. Komen Postdoctoral Fellowship (PDF12230862). CDB4124, CDB4453, and tamoxifen drugs for animal studies were provided by Repros Therapeutics under a signed material transfer agreement. W.D.T. and T.E.H. are supported by grants from the National Health and Medical Research Council of Australia (ID 1084416) and Cancer Australia/National Breast Cancer Foundation (ID CA1043497). W.D.T. and G.T. are supported by a grant from the National Breast Cancer Foundation (PS-15-041). G.V.R. and S.M. are supported by grants from the Cancer Prevention and Research Institute of Texas (CPRIT DP150096) and from the Department of Defense (W81XWH-13-2-0093, W81XWH-12-1-0288). T.E.H. held a Fellowship Award from the U.S. Department of Defense Breast Cancer Research Program (no. W81XWH-11-1-0592) and currently is supported by a Florey Fellowship from the Royal Adelaide Hospital Research Foundation. Author contributions: H.S. and G.L.G. conceptualized experiments. H.S., R.J.B., W.D.T., T.E.H., and G.L.G. wrote the manuscript with assistance from the other authors. H.S., R.J.B., A.L.Z., and Y.-F.C. performed the in vitro experiments. H.S. performed genomics and data analyses. H.S., M.E.G., M.L., A.L.Z., and A.G.D. performed the animal studies. T.E.H., W.D.T., S.M., G.T., and G.V.R. conceptualized and performed the ex vivo experiments. Competing interests: G.L.G. has a material transfer agreement with Repros Therapeutics Inc. All other authors declare that they have no competing interests. Data and materials availability: All data needed to evaluate the conclusions in the paper are present in the paper and/or the Supplementary Materials. Raw and processed next-generation sequencing data have been deposited in the Gene Expression Omnibus GSE80098. Additional data related to this paper may be requested from the authors.
SUPPLEMENTARY MATERIALS
Supplementary material for this article is available at http://advances.sciencemag.org/cgi/content/full/2/6/e1501924/DC1
table S1. Clinical information of tumors.
table S2. PCR primers for ChIP-PCR and reChIP-PCR.
table S3. PCR primers for CATCH chromosome capture.
table S4. Gene expression changes observed in eight ER+/PR+ patient tumors and three ER+/PR+ cell models in response to various combinations of estrogen and progestin treatments.
table S5. Gene expression changes observed in four ER+/PR− patient tumors and two ER+/PR-deficient cell models in response to various combinations of estrogen and progestin treatments.
table S6. Binding sites for ER, PR, and ER/PR complexes in ER+/PR+ T47D and ER+/PR-deficient T47D cells.
table S7. Summaries of patient cohorts.
fig. S1. Progestin is a genomic agonist of estrogen-regulated gene expression.
fig. S2. Progestin is a phenotypic antagonist of estrogen-induced cell proliferation, invasion, and migration.
fig. S3. Progestin modulates estrogen-regulated gene expression.
fig. S4. PR redirects ER to sites enriched for motifs of PR and PR-associated cofactors.
fig. S5. Noncompetitive interactions between ER and PR.
fig. S6. Depletion of FOXA1 or NF1C insignificantly impacts the effects of PR on ER-regulated gene expression.
fig. S7. PR-regulated genes are enriched for breast cancer signatures, and PR contributes to the prognostic value of ER.
REFERENCES AND NOTES
- 1.Heldring N., Pike A., Andersson S., Matthews J., Cheng G., Hartman J., Tujague M., Ström A., Treuter E., Warner M., Gustafsson J.-Å., Estrogen receptors: How do they signal and what are their targets. Physiol. Rev. 87, 905–931 (2007). [DOI] [PubMed] [Google Scholar]
- 2.Daniel A. R., Hagan C. R., Lange C. A., Progesterone receptor action: Defining a role in breast cancer. Expert Rev. Endocrinol. Metab. 6, 359–369 (2011). [DOI] [PMC free article] [PubMed] [Google Scholar]
- 3.Brisken C., Progesterone signalling in breast cancer: A neglected hormone coming into the limelight. Nat. Rev. Cancer 13, 385–396 (2013). [DOI] [PubMed] [Google Scholar]
- 4.Osborne C. K., Yochmowitz M. G., Knight W. A. III, McGuire W. L., The value of estrogen and progesterone receptors in the treatment of breast cancer. Cancer 46 (Suppl. 12), 2884–2888 (1980). [DOI] [PubMed] [Google Scholar]
- 5.Yang L.-H., Tseng H.-S., Lin C., Chen L.-S., Chen S.-T., Kuo S.-J., Chen D.-R., Survival benefit of tamoxifen in estrogen receptor-negative and progesterone receptor-positive low grade breast cancer patients. J. Breast Cancer 15, 288–295 (2012). [DOI] [PMC free article] [PubMed] [Google Scholar]
- 6.Cui X., Schiff R., Arpino G., Osborne C. K., Lee A. V., Biology of progesterone receptor loss in breast cancer and its implications for endocrine therapy. J. Clin. Oncol. 23, 7721–7735 (2005). [DOI] [PubMed] [Google Scholar]
- 7.Daniel A. R., Gaviglio A. L., Knutson T. P., Ostrander J. H., D’Assoro A. B., Ravindranathan P., Peng Y., Raj G. V., Yee D., Lange C. A., Progesterone receptor-B enhances estrogen responsiveness of breast cancer cells via scaffolding PELP1- and estrogen receptor-containing transcription complexes. Oncogene 34, 506–515 (2015). [DOI] [PMC free article] [PubMed] [Google Scholar]
- 8.Ballaré C., Uhrig M., Bechtold T., Sancho E., Di Domenico M., Migliaccio A., Auricchio F., Beato M., Two domains of the progesterone receptor interact with the estrogen receptor and are required for progesterone activation of the c-Src/Erk pathway in mammalian cells. Mol. Cell. Biol. 23, 1994–2008 (2003). [DOI] [PMC free article] [PubMed] [Google Scholar]
- 9.Giulianelli S., Vaqué J. P., Wargon V., Soldati R., Vanzulli S. I., Martins R., Zeitlin E., Helguero L., Lamb C., Molinolo A. A., Gutkind J. S., Lanari C., The role of estrogen receptor alpha in breast cancer cell proliferation mediated by progestins. Medicina (B. Aires) 72, 315–320 (2012). [PubMed] [Google Scholar]
- 10.Mohammed H., Russell I. A., Stark R., Rueda O. M., Hickey T. E., Tarulli G. A., Serandour A. A., Birrell S. N., Bruna A., Saadi A., Menon S., Hadfield J., Pugh M., Raj G. V., Brown G. D., D’Santos C., Robinson J. L. L., Silva G., Launchbury R., Perou C. M., Stingl J., Caldas C., Tilley W. D., Carroll J. S., Progesterone receptor modulates ERα action in breast cancer. Nature 523, 313–317 (2015). [DOI] [PMC free article] [PubMed] [Google Scholar]
- 11.Olivotto I. A., Truong P. T., Speers C. H., Bernstein V., Allan S. J., Kelly S. J., Lesperance M. L., Time to stop progesterone receptor testing in breast cancer management. J. Clin. Oncol. 22, 1769–1770 (2004). [DOI] [PubMed] [Google Scholar]
- 12.Bardou V.-J., Arpino G., Elledge R. M., Osborne C. K., Clark G. M., Progesterone receptor status significantly improves outcome prediction over estrogen receptor status alone for adjuvant endocrine therapy in two large breast cancer databases. J. Clin. Oncol. 21, 1973–1979 (2003). [DOI] [PubMed] [Google Scholar]
- 13.Dowsett M., Cuzick J., Wale C., Howell T., Houghton J., Baum M., Retrospective analysis of time to recurrence in the ATAC trial according to hormone receptor status: An hypothesis-generating study. J. Clin. Oncol. 23, 7512–7517 (2005). [DOI] [PubMed] [Google Scholar]
- 14.Prat A., Cheang M. C. U., Martín M., Parker J. S., Carrasco E., Caballero R., Tyldesley S., Gelmon K., Bernard P. S., Nielsen T. O., Perou C. M., Prognostic significance of progesterone receptor–positive tumor cells within immunohistochemically defined luminal A breast cancer. J. Clin. Oncol. 31, 203–209 (2013). [DOI] [PMC free article] [PubMed] [Google Scholar]
- 15.Jordan V. C., Tamoxifen: A most unlikely pioneering medicine. Nat. Rev. Drug Discov. 2, 205–213 (2003). [DOI] [PubMed] [Google Scholar]
- 16.Lanari C., Wargon V., Rojas P., Molinolo A. A., Antiprogestins in breast cancer treatment: Are we ready? Endocr. Relat. Cancer 19, R35–R50 (2012). [DOI] [PubMed] [Google Scholar]
- 17.Beral V., Million Women Study Collaborators , Breast cancer and hormone-replacement therapy in the Million Women Study. Lancet 362, 419–427 (2003). [DOI] [PubMed] [Google Scholar]
- 18.Rossouw J. E., Anderson G. L., Prentice R. L., LaCroix A. Z., Kooperberg C., Stefanick M. L., Jackson R. D., Beresford S. A., Howard B. V., Johnson K. C., Kotchen J. M., Ockene J. Writing Group for the Women’s Health Initiative Investigators , Risks and benefits of estrogen plus progestin in healthy postmenopausal women: Principal results From the Women’s Health Initiative randomized controlled trial. JAMA 288, 321–333 (2002). [DOI] [PubMed] [Google Scholar]
- 19.Dean J. L., McClendon A. K., Hickey T. E., Butler L. M., Tilley W. D., Witkiewicz A. K., Knudsen E. S., Therapeutic response to CDK4/6 inhibition in breast cancer defined by ex vivo analyses of human tumors. Cell Cycle 11, 2756–2761 (2012). [DOI] [PMC free article] [PubMed] [Google Scholar]
- 20.Clarke C. L., Sutherland R. L., Progestin regulation of cellular proliferation. Endocr. Rev. 11, 266–301 (1990). [DOI] [PubMed] [Google Scholar]
- 21.Horwitz K. B., The molecular biology of RU486. Is there a role for antiprogestins in the treatment of breast cancer? Endocr. Rev. 13, 146–163 (1992). [DOI] [PubMed] [Google Scholar]
- 22.Parker J. S., Mullins M., Cheang M. C. U., Leung S., Voduc D., Vickery T., Davies S., Fauron C., He X., Hu Z., Quackenbush J. F., Stijleman I. J., Palazzo J., Marron J. S., Nobel A. B., Mardis E., Nielsen T. O., Ellis M. J., Perou C. M., Bernard P. S., Supervised risk predictor of breast cancer based on intrinsic subtypes. J. Clin. Oncol. 27, 1160–1167 (2009). [DOI] [PMC free article] [PubMed] [Google Scholar]
- 23.Howlader N., Altekruse S. F., Li C. I., Chen V. W., Clarke C. A., Ries L. A. G., Cronin K. A., US incidence of breast cancer subtypes defined by joint hormone receptor and HER2 status. J. Natl. Cancer Inst. 106, dju055 (2014). [DOI] [PMC free article] [PubMed] [Google Scholar]
- 24.Clarke R., Liu M. C., Bouker K. B., Gu Z., Lee R. Y., Zhu Y., Skaar T. C., Gomez B., O’Brien K., Wang Y., Hilakivi-Clarke L. A., Antiestrogen resistance in breast cancer and the role of estrogen receptor signaling. Oncogene 22, 7316–7339 (2003). [DOI] [PubMed] [Google Scholar]
- 25.Carroll J. S., Meyer C. A., Song J., Li W., Geistlinger T. R., Eeckhoute J., Brodsky A. S., Keeton E. K., Fertuck K. C., Hall G. F., Wang Q., Bekiranov S., Sementchenko V., Fox E. A., Silver P. A., Gingeras T. R., Liu X. S., Brown M., Genome-wide analysis of estrogen receptor binding sites. Nat. Genet. 38, 1289–1297 (2006). [DOI] [PubMed] [Google Scholar]
- 26.Hurtado A., Holmes K. A., Ross-Innes C. S., Schmidt D., Carroll J. S., FOXA1 is a key determinant of estrogen receptor function and endocrine response. Nat. Genet. 43, 27–33 (2011). [DOI] [PMC free article] [PubMed] [Google Scholar]
- 27.Ross-Innes C. S., Stark R., Teschendorff A. E., Holmes K. A., Ali H. R., Dunning M. J., Brown G. D., Gojis O., Ellis I. O., Green A. R., Ali S., Chin S.-F., Palmieri C., Caldas C., Carroll J. S., Differential oestrogen receptor binding is associated with clinical outcome in breast cancer. Nature 481, 389–393 (2012). [DOI] [PMC free article] [PubMed] [Google Scholar]
- 28.Migliaccio A., Piccolo D., Castoria G., Di Domenico M., Bilancio A., Lombardi M., Gong W., Beato M., Auricchio F., Activation of the Src/p21ras/Erk pathway by progesterone receptor via cross-talk with estrogen receptor. EMBO J. 17, 2008–2018 (1998). [DOI] [PMC free article] [PubMed] [Google Scholar]
- 29.Roy R., Chun J., Powell S. N., BRCA1 and BRCA2: Different roles in a common pathway of genome protection. Nat. Rev. Cancer 12, 68–78 (2012). [DOI] [PMC free article] [PubMed] [Google Scholar]
- 30.Vicent G. P., Zaurin R., Nacht A. S., Font-Mateu J., Le Dily F., Beato M., Nuclear factor 1 synergizes with progesterone receptor on the mouse mammary tumor virus promoter wrapped around a histone H3/H4 tetramer by facilitating access to the central hormone-responsive elements. J. Biol. Chem. 285, 2622–2631 (2010). [DOI] [PMC free article] [PubMed] [Google Scholar]
- 31.Augello M. A., Hickey T. E., Knudsen K. E., FOXA1: Master of steroid receptor function in cancer. EMBO J. 30, 3885–3894 (2011). [DOI] [PMC free article] [PubMed] [Google Scholar]
- 32.Widschwendter M., Rosenthal A. N., Philpott S., Rizzuto I., Fraser L., Hayward J., Intermaggio M. P., Edlund C. K., Ramus S. J., Gayther S. A., Dubeau L., Fourkala E. O., Zaikin A., Menon U., Jacobs I. J., The sex hormone system in carriers of BRCA1/2 mutations: A case–control study. Lancet Oncol. 14, 1226–1232 (2013). [DOI] [PubMed] [Google Scholar]
- 33.Poole A. J., Li Y., Kim Y., Lin S.-C. J., Lee W.-H., Lee E. Y.-H. P., Prevention of Brca1-mediated mammary tumorigenesis in mice by a progesterone antagonist. Science 314, 1467–1470 (2006). [DOI] [PubMed] [Google Scholar]
- 34.Ballaré C., Castellano G., Gaveglia L., Althammer S., González-Vallinas J., Eyras E., Le Dily F., Zaurin R., Soronellas D., Vicent G. P., Beato M., Nucleosome-driven transcription factor binding and gene regulation. Mol. Cell 49, 67–79 (2013). [DOI] [PubMed] [Google Scholar]
- 35.Vicent G. P., Zaurin R., Nacht A. S., Li A., Font-Mateu J., Le Dily F., Vermeulen M., Mann M., Beato M., Two chromatin remodeling activities cooperate during activation of hormone responsive promoters. PLOS Genet. 5, e1000567 (2009). [DOI] [PMC free article] [PubMed] [Google Scholar]
- 36.Carroll J. S., Liu X. S., Brodsky A. S., Li W., Meyer C. A., Szary A. J., Eeckhoute J., Shao W., Hestermann E. V., Geistlinger T. R., Fox E. A., Silver P. A., Brown M., Chromosome-wide mapping of estrogen receptor binding reveals long-range regulation requiring the forkhead protein FoxA1. Cell 122, 33–43 (2005). [DOI] [PubMed] [Google Scholar]
- 37.Voss T. C., Hager G. L., Dynamic regulation of transcriptional states by chromatin and transcription factors. Nat. Rev. Genet. 15, 69–81 (2014). [DOI] [PMC free article] [PubMed] [Google Scholar]
- 38.Hebbar P. B., Archer T. K., Chromatin-dependent cooperativity between site-specific transcription factors in vivo. J. Biol. Chem. 282, 8284–8291 (2007). [DOI] [PMC free article] [PubMed] [Google Scholar]
- 39.Pjanic M., Schmid C. D., Gaussin A., Ambrosini G., Adamick J., Pjanic P., Plasari G., Kerschgens J., Dietler G., Bucher P., Mermod N., Nuclear factor I genomic binding associates with chromatin boundaries. BMC Genomics 14, 99 (2013). [DOI] [PMC free article] [PubMed] [Google Scholar]
- 40.Kittler R., Kittler R., Zhou J., Hua S., Ma L., Liu Y., Pendleton E., Cheng C., Gerstein M., White K. P., A comprehensive nuclear receptor network for breast cancer cells. Cell Rep. 3, 538–551 (2013). [DOI] [PubMed] [Google Scholar]
- 41.Curtis C., Shah S. P., Chin S.-F., Turashvili G., Rueda O. M., Dunning M. J., Speed D., Lynch A. G., Samarajiwa S., Yuan Y., Gräf S., Ha G., Haffari G., Bashashati A., Russell R., McKinney S. METABRIC Group, Langerød A., Green A., Provenzano E., Wishart G., Pinder S., Watson P., Markowetz F., Murphy L., Ellis I., Purushotham A., Børresen-Dale A.-L., Brenton J. D., Tavaré S., Caldas C., Aparicio S., The genomic and transcriptomic architecture of 2,000 breast tumours reveals novel subgroups. Nature 486, 346–352 (2012). [DOI] [PMC free article] [PubMed] [Google Scholar]
- 42.The Cancer Genome Atlas Network , Comprehensive molecular portraits of human breast tumours. Nature 490, 61–70 (2012). [DOI] [PMC free article] [PubMed] [Google Scholar]
- 43.Winqvist R., Hampton G. M., Mannermaa A., Blanco G., Alavaikko M., Kiviniemi H., Taskinen P. J., Evans G. A., Wright F. A., Newsham I., Cavanee W. K., Loss of heterozygosity for chromosome 11 in primary human breast tumors is associated with poor survival after metastasis. Cancer Res. 55, 2660–2664 (1995). [PubMed] [Google Scholar]
- 44.Tomlinson I. P. M., Nicolai H., Solomon E., Bodmer W. F., The frequency and mechanism of loss of heterozygosity on chromosome 11q in breast cancer. J. Pathol. 180, 38–43 (1996). [DOI] [PubMed] [Google Scholar]
- 45.Attardi B. J., Burgenson J., Hild S. A., Reel J. R., In vitro antiprogestational/antiglucocorticoid activity and progestin and glucocorticoid receptor binding of the putative metabolites and synthetic derivatives of CDB-2914, CDB-4124, and mifepristone. J. Steroid Biochem. Mol. Biol. 88, 277–288 (2004). [DOI] [PubMed] [Google Scholar]
- 46.Joshi P. A., Jackson H. W., Beristain A. G., Di Grappa M. A., Mote P. A., Clarke C. L., Stingl J., Waterhouse P. D., Khokha R., Progesterone induces adult mammary stem cell expansion. Nature 465, 803–807 (2010). [DOI] [PubMed] [Google Scholar]
- 47.Horwitz K. B., Dye W. W., Harrell J. C., Kabos P., Sartorius C. A., Rare steroid receptor-negative basal-like tumorigenic cells in luminal subtype human breast cancer xenografts. Proc. Natl. Acad. Sci. U.S.A. 105, 5774–5779 (2008). [DOI] [PMC free article] [PubMed] [Google Scholar]
- 48.Graham J. D., Mote P. A., Salagame U., van Dijk J. H., BAlleine R. L., Huschtscha L. I., Reddel R. R., Clarke C. L., DNA replication licensing and progenitor numbers are increased by progesterone in normal human breast. Endocrinology 150, 3318–3326 (2009). [DOI] [PMC free article] [PubMed] [Google Scholar]
- 49.Centenera M. M., Gillis J. L., Hanson A. R., Jindal S., Taylor R. A., Risbridger G. P., Sutherland P. D., Scher H. I., Raj G. V., Knudsen K. E.; Trina Yeadon for the Australian Prostate Cancer BioResource, Tilley W. D., Butler L. M., Evidence for efficacy of new Hsp90 inhibitors revealed by ex vivo culture of human prostate tumors. Clin. Cancer Res. 18, 3562–3570 (2012). [DOI] [PubMed] [Google Scholar]
- 50.Sartorius C. A., Groshong S. D., Miller L. A., Powell R. L., Tung L., Takimoto G. S., Horwitz K. B., New T47D breast cancer cell lines for the independent study of progesterone B- and A-receptors: Only antiprogestin-occupied B-receptors are switched to transcriptional agonists by cAMP. Cancer Res. 54, 3868–3877 (1994). [PubMed] [Google Scholar]
- 51.Hua S., Kittler R., White K. P., Genomic antagonism between retinoic acid and estrogen signaling in breast cancer. Cell 137, 1259–1271 (2009). [DOI] [PMC free article] [PubMed] [Google Scholar]
Associated Data
This section collects any data citations, data availability statements, or supplementary materials included in this article.
Supplementary Materials
Supplementary material for this article is available at http://advances.sciencemag.org/cgi/content/full/2/6/e1501924/DC1
table S1. Clinical information of tumors.
table S2. PCR primers for ChIP-PCR and reChIP-PCR.
table S3. PCR primers for CATCH chromosome capture.
table S4. Gene expression changes observed in eight ER+/PR+ patient tumors and three ER+/PR+ cell models in response to various combinations of estrogen and progestin treatments.
table S5. Gene expression changes observed in four ER+/PR− patient tumors and two ER+/PR-deficient cell models in response to various combinations of estrogen and progestin treatments.
table S6. Binding sites for ER, PR, and ER/PR complexes in ER+/PR+ T47D and ER+/PR-deficient T47D cells.
table S7. Summaries of patient cohorts.
fig. S1. Progestin is a genomic agonist of estrogen-regulated gene expression.
fig. S2. Progestin is a phenotypic antagonist of estrogen-induced cell proliferation, invasion, and migration.
fig. S3. Progestin modulates estrogen-regulated gene expression.
fig. S4. PR redirects ER to sites enriched for motifs of PR and PR-associated cofactors.
fig. S5. Noncompetitive interactions between ER and PR.
fig. S6. Depletion of FOXA1 or NF1C insignificantly impacts the effects of PR on ER-regulated gene expression.
fig. S7. PR-regulated genes are enriched for breast cancer signatures, and PR contributes to the prognostic value of ER.