

Abstract
The objective of this study was to determine if consuming an extractable or non-extractable fraction of table grapes reduced the metabolic consequences of consuming a high-fat, American-type diet. Male C57BL/6J mice were fed a low fat (LF) diet, a high fat (HF) diet, or a HF diet containing whole table grape powder (5% w/w), an extractable, polyphenol-rich (HF-EP) fraction, a non-extractable, polyphenol-poor (HF-NEP) fraction, or equal combinations of both fractions (HF-EP+NEP) from grape powder for 16 weeks. Mice fed the HF-EP and HF-EP+NEP diets had lower percentages of body fat and amounts of white adipose tissue (WAT) and improved glucose tolerance compared to the HF-fed controls. Mice fed the HF-EP+NEP diet had lower liver weights and triglyceride (TG) levels compared to the HF-fed controls. Mice fed the HF-EP+NEP diets had higher hepatic mRNA levels of hormone sensitive lipase and adipose TG lipase, and decreased expression of c-reactive protein compared to the HF-fed controls. In epididymal (visceral) WAT, the expression levels of several inflammatory genes were lower in mice fed the HF-EP and HF-EP+NEP diets compared to the HF-fed controls. Mice fed the HF diets had increased myeloperoxidase activity and impaired localization of the tight junction protein zonula occludens-1 in ileal mucosa compared to the HF-EP and HF-NEP diets. Several of these treatment effects were associated with alterations in gut bacterial community structure. Collectively, these data demonstrate that the polyphenol-rich, EP fraction from table grapes attenuated many of the adverse health consequences associated with consuming a HF diet.
Keywords: grapes, obesity, steatosis, inflammation, intestines, microbiota
1. Introduction
Obesity has been on the rise since the 1960s, affecting approximately one third of the adult population [1, 2]. Obesity is associated with chronic inflammatory conditions that contribute to the metabolic syndrome (e.g., type 2 diabetes, hypertension, and cardiovascular disease) [3]. Over consumption of calories coinciding with a lack of physical activity are the major risk factors for obesity development resulting in expansion of white adipose tissue (WAT). WAT expansion elicits inflammatory signals that recruit macrophages and other immune cells into the WAT [4]. This inflammatory scenario disrupts metabolic processes, resulting in impaired glucose and fatty acid uptake and metabolism, thereby contributing to the development of metabolic diseases.
Recently, the role that gut microbes play in the development of the metabolic syndrome has received attention due to their sensitivity to environmental changes that can trigger obesity [5], chronic inflammation [6–8], and insulin resistance [reviewed in 9]. Diets high in fat decrease gut microbial diversity and barrier-protecting bacteria while increasing the abundance of deleterious bacteria [reviewed in 10]. For example, an increase in the ratio of Firmicutes to Bacteriodetes is positively correlated with the development of obesity and insulin resistance [11]. Diets rich in saturated fat [11, 12], particularly from milk [13], increase the abundance of sulfidogenic bacteria like Bilophila wadsworthia and Desulfovibrionaceae spp. These bacteria generate the genotoxic and cytotoxic gas hydrogen sulfide gas, which has been linked to ulcerative colitis, gut inflammation, irritable bowel syndrome, and colon cancer [13–15]. Notably, the effects of high fat (HF) diets on body weight gain are repressed in microbiota-free mouse models as well as in human fecal microbiota transplants from healthy donors into obese subjects [16].
The use of non-digestible carbohydrates, fiber, or polyphenols as prebiotics shows promise as potential interventions for the metabolic consequences of obesity [13, reviewed in 17–20]. Fiber, in particular inulin-type fructans, has been shown to increase the abundance of Bifidobacteria which was positively correlated with decreased hyperglycemia, endotoxemia, and systemic cytokine levels [21, 22]. Similar effects have been reported in obese subjects with short-term supplementation of gluco-oligosaccharides [23], and are associated with the production of specific short chain fatty acids (SCFA) that regulate the synthesis of gastrointestinal (GI) peptides. These peptides influence energy intake and metabolism through interactions with G-protein receptors (Gpr) 41, 43, and 119 [reviewed in 20].
Polyphenols found in fruits and vegetables may improve GI health [24–26, reviewed in 27]. Absorption of polyphenols is poor in the upper gastrointestinal tract, leading to increased availability in the lower GI tract [reviewed in 27] that may influence microbiota taxa and their metabolites [reviewed in 28]. Indeed, the anti-inflammatory, anti-oxidant, and anti-microbial actions of polyphenols have been reported to positively influence gut microbes and host inflammation [reviewed in 29].
Grapes and other berries are rich in polyphenols including anthocyanins [reviewed in 29], which are known to have anti-inflammatory and anti-oxidant effects [30]. These beneficial effects of grapes have been associated with reduced cytokine levels via suppression of nuclear factor kappa B (NFκB) and increased peroxisome proliferator-activated receptor (PPAR)α/γ [31]. Similarly, we demonstrated that C57BL/6J mice consuming a HF diet (i.e., 60% kcals from lard) supplemented with whole powdered California table grapes (3%, w/w) had improved glucose tolerance after 5 weeks and decreased markers of inflammation ~20–50% in serum and WAT after 18 weeks [32]. We also showed that consuming a moderate fat diet (i.e., 34% of kcals, primarily from butter fat) supplemented with whole powdered grapes (3% or 5% w/w) reduced adiposity, improved liver triglyceride (TG) levels, modestly reduced WAT inflammatory gene expression, and lowered the cecum levels of sulfidogenic bacteria, while tending to increase the abundance of Akkermansia muciniphila and Allobaculum in the proximal colon and cecum, respectively [33].
However, the identities of the bioactive fractions in whole table grapes and the role that gut microbiota play in improvements in diet-induced obesity in mice fed grapes are unknown. Therefore, the objective of this study was to determine the extent to which consuming extractable, polyphenol-rich and non-extractable, polyphenol-poor fractions of table grapes improved intestinal and systemic health in mice fed a HF, American-type diet. The lyophilized whole grape powder was extracted with acidified methanol, and sugars were removed to afford the extractable polyphenol-rich (EP) fraction. The residual plant material after methanol extraction constituted the non-extractable, polyphenol-poor (NEP) fraction. This separation scheme allowed us to compare the effects of the more soluble polyphenols in the EP fraction compared to insoluble polyphenols typically bound to fiber in the NEP fraction. These fractions were incorporated into a HF, American-type diet [34]. This HF diet was fed alone or in combination with the EP fraction, the NEP fraction, both fractions (EP+NEP), or whole grape powder (GP; 5%, w/w) for 16 weeks.
2. Materials and Methods
2.1 Plant materials and chemicals
The lyophilized (i.e., powdered) table grapes were kindly provided by the California Table Grape Commission and consisted of a mixture of red, green, and purple seeded and seedless grapes. Reference compounds procyanidin B2 (PAC-B2), catechin and epicatechin were purchased from Chromadex (Irvine, CA). 4-dimethylaminocinnamaldehyde (DMAC), Folin-Ciocalteu reagent, and trifluoroacetic acid (TFA) were purchased from Sigma-Aldrich Inc. (St. Louis, MO). All organic solvents were HPLC grade and obtained from VWR International (Suwanee, GA).
2.2 Extraction and polyphenol enrichment
Freeze-dried grape powder (200 g × 5 batches) was blended each with 1 L 50% acidified methanol (0.1% TFA). The mixture was centrifuged (Sorvall RC-6 plus, Asheville, NC) at 3,452 × g for 10 min, and the supernatant was collected. The combined supernatants (2 L) were evaporated to remove the organic solvent, and then loaded to Amberlite XDA-7 resin. The resin was washed with water to get rid of all free sugars and organic acids. The polyphenols were eluted from the resin with 100% methanol, organic solvent was evaporated under vacuum, and the remaining aqueous extract was freeze-dried to afford the EP fraction. The pelleted material (plant debris after extraction) was put in a vacuum oven (45 °C) to get rid of the organic solvent before freeze-drying to afford the NEP fraction.
2.3 Alkaline hydrolysis of NEP fraction
Alkaline hydrolysis of the NEP fraction was performed according to Yang et al. [35] with some modifications. In 15 mL centrifuge tube, 2.0 mL of 4 mol/L NaOH were added to 0.5 g NEP, flushed with nitrogen, closed and incubated for 1 h at room temperature. The mixture was adjusted to pH 7 with drops of concentrated hydrochloric acid, then loaded onto a column packed with celite at a ratio 1:2 v/w. The hydrolyzed polyphenols were eluted with 30 mL methanol-ethyl acetate (20:80 v/v), and evaporated to dryness.
2.4 Determination of total phenolics, anthocyanins and proanthocyanidins
Total phenolics (TP) were determined in EP and NEP hydrolysate fractions with Folin-Ciocalteu reagent [36]. Concentrations were expressed as mg/L gallic acid equivalents. Total monomeric anthocyanin (ANC) content was measured in EP using the pH differential spectrophotometric method [37], and expressed as cyanidin3-O-glucoside equivalents. Total proanthocyanidin content (PAC) was determined in EP using the DMAC method as previously described [38], and quantified as procyanidin B2 equivalents.
2.5 HPLC profile analyses of anthocyanins and proanthocyanidins
HPLC analyses were conducted according to the previously reported protocols [39].
2.6 Animals
Four-week old, male C57BL/6J mice were obtained from Jackson Laboratories (Bar Harbor, ME, USA) and acclimated on a standard chow diet for 1 week. Mice were housed in pairs, maintained at a temperature of 22°C with 50% humidity, and exposed to a 12 h light/12 h dark cycle. Mice received food and water ad libitum and measures of body weight and food intake were conducted once and twice per week, respectively. All experimental procedures were performed under ethical standards and approved by the Institutional Animal Care and Use Committee of the University of North Carolina at Greensboro.
2.7 Diets and western blotting supplies
Animals were randomly assigned to one of six dietary treatments (n=10 per treatment group) as follows: low fat (LF; 10% of energy from fat), HF (44% of energy from fat), HF plus extractable, polyphenol-rich fraction (HF-EP), HF plus non-extractable, polyphenol-poor fraction (HF-NEP), HF plus extractable and non-extractable polyphenol fraction (HF-EP+NEP) and HF plus 5% powdered grapes (HF-grape powder) (Supplemental Table 1). The LF diet consisted of 5.5% energy from soybean oil and 4.5% from lard. The HF diets consisted of approximately 10.5% energy from soybean oil, 9.6% of energy from butter, 7.6% energy from lard, 12.0% energy from shortening, and 4.3% energy from beef tallow [34, 40]. Thus, the HF diets were rich in fat with the proportion of the sources of fat mimicking an American-type diet [34]. Compared to the LF diet, the HF diets also had a greater percentage of energy from saturated and monounsaturated fats and a lesser percentage of energy from polyunsaturated fats. The amounts of EP and NEP fractions that were added to the HF diets were equal to their relatively amounts in the 5% powdered whole grape diet (i.e., grape powder contained 2.3% and 6.9% EP and NEP, respectively). The 5% dietary level of grapes is comparable to 15 human servings of grapes [33]. Because the extraction process removes the sugar fraction in grapes, a mixture of fructose and glucose was added to the HF, HF-EP, HF-NEP, and HF-EP+NEP diets to control for the sugar content of the powdered grape diet.
Immunoblotting buffers and precast gels were purchased from Invitrogen by Life Technologies (Carlsbad, CA). Polyclonal antibodies for anti-glyceraldehyde-3-phosphate dehydrogenase (GAPDH; #sc20357) and a monoclonal antibody for anti-PPARγ (sc#2443S)were obtained from Santa Cruz Biotechnology (Santa Cruz, CA). AMPK (#2532), phospho-AMPK (Thr172; #2535), phospho-acetyl-CoA carboxylase (ACC; Ser79; #11818), phospho-hormone sensitive lipase (HSL; Ser563; #4139), phospho-nuclear factor kappa B (NFκB) p65 (Ser536, #3033) and anti-rabbit IgG horseradish peroxidase (HRP)-linked (#7074) antibodies were purchased from Cell Signaling Technologies (Beverly, MA).
2.8 Plasma markers of insulin resistance and inflammation
Intraperitoneal (i.p.) GTTs were performed on weeks 7, 12, and 16 on non-anesthetized, fasted mice as previously described [33]. Plasma insulin levels were detected using an ultrasensitive mouse insulin kit (Crystal Chem, Inc, Downers Grove, IL). The homeostasis model of assessment (HOMA) for insulin resistance (IR) was calculated as described [32, 33].
Plasma monocyte chemoattractant protein (MCP)-1 was measured using an ELISA kit from R&D Systems, Minneapolis, MN, USA (#MJE00). Plasma lipopolysaccharide (LPS) binding protein (LBP), an acute-phase protein that initiates recognition of LPS and activates host immune responses, was determined using an ELISA kit from Cell Sciences, Canton, MA (#CKM043).
2.9 Body fat measurements via Dual X-Ray Absorptiometry (DEXA)
Percent body fat was measured using DEXA on a GE Lunar Prodigy Advanced System (GE Healthcare, Milwaukee, WI) at weeks 6, 11, and 15 as previously described [33].
2.10 Tissue collection
After 16 weeks of dietary intervention, mice were fasted for 8 h and euthanized via isoflurane-induced anesthesia followed by cardiac puncture. Plasma was collected at the time of harvest. Four WAT depots were collected; epididymal, mesenteric, inguinal, and retroperitoneal. Additionally, livers were harvested and intestinal mucosa and digesta were collected from the duodenum, jejunum, ileum, cecum, or proximal or distal colon. Weights of the WAT depots and livers were recorded and all collected samples were immediately snap-frozen in liquid nitrogen and stored at −80°C until analysis.
2.11 Liver and plasma TG levels
Liver TG content was measured as previously described [41]. Briefly, lipids were extracted from liver samples (~50–100 mg) using chloroform:methanol (vol:vol = 2:1). Next, sulphuric acid (0.05 %) was added to split the phase. After centrifugation (1000 × g for 5 min at room temperature), the bottom/organic phase was transferred to a new glass tube and triton X-100 (1% in chloroform) was added. Samples were dried down at 60°C under nitrogen gas and water was added into each sample (1 ml of 1% Triton X-100 in chloroform: 0.5 ml of water). Liver TGs were measured using commercial enzymatic reagents (Wako Diagnostics L-Type TG M; Richmond, VA). Plasma TG content was determined using a commercial assay from Thermo Scientific (Infinity TG assay #TR22421 and TG standards #TG22923; Norcross, GA).
2.12 Liver Oil-Red-O staining
Liver tissues were frozen in OCT compounds, cut at 5 μm, and mounted on slides. The sections were then fixed, washed, and subjected to Oil-Red-O staining and imaging as previously described [33].
2.13 RNA extraction and qPCR
Adipose and intestinal samples were homogenized and total RNA extracted as previously described [33]. For hepatic samples, a QIAgen mini universal kit from Qiagen was used. The quality and concentration of RNA were examined, complementary cDNA synthesized, and qPCR conducted as we described [33]. The expression of genes related to inflammation, lipogenesis, and lipolysis in WAT depots and liver were measured using Taqman Gene expression assays purchased from Applied Biosystems. TATA-binding protein (Tbp) was the endogenous reference gene utilized for all assays and fold differences in gene expression were calculated as 2−ΔΔCt as previously described [33].
2.14 Intestinal myeloperoxidase (MPO) and alkaline phosphatase (IAP) activities, and ZO-1 staining
MPO activity was measured as described by Kim et al. [42]. Results were expressed as the change in absorbance per minute per gram protein. Briefly, 25 mg of either ileum or proximal colon tissue was homogenized in a potassium phosphate buffer (50 mM, pH=6.0) with hexadecyltrimethylammonium bromide on ice. The homogenate was centrifuged for 6 min at 13,400 × g at 4°C. The resulting supernatant was collected, loaded onto 96 well plates, and the activity monitored at 450 nm for 30 min following the addition of 0.167 g/ml o-dianisidine and 0.005% H2O2.
IAP activity was measured in the duodenum mucosa using a SensoLyte p-nitrophenyl phosphate (pNPP) Alkaline Phosphatase Assay Kit (no. 72146; Anaspec, Fremont, CA) [43]. Duodenal mucosa was homogenized with lysis buffer (i.e., 400 μl/50 mg tissue) and centrifuged for 15 min at 10,000 × g at 4°C. The supernatant was diluted 1:100 and transferred to a 96-well plate. Total protein was measured using the BCA protocol. Samples were incubated with pNPP substrate solution for 15 min, and absorbance was read at 405 nm. Activity was expressed as μg per mL of alkaline phosphatase per mg of protein.
The localization of the tight junction protein zonula occludens-1 (ZO-1) was determined in ileal mucosa samples as previously described [33]. Three to four samples from each group were analyzed by Image J software. Each photo was corrected by its own background and then adjusted by DAPI.
2.15 Short chain fatty acid (SCFA) measurement
SCFAs were extracted from cecal digesta as previously described [44]. Snap frozen cecal digesta samples were collected, weighed (~20–70 mg/sample), and homogenized in water followed by centrifugation at 13,000 × g. Supernatants were acidified with 50% H2SO4 and isobutyric acid (3 mmol/L) was added (internal standard) to each sample. SCFAs were extracted using diethyl ether, derivatized using MTBS-TFA, and run on a Varian Saturn 2000 GC-MS-MS.
2.16. PCR amplification of 16S rRNA and functional gene targets
qPCR amplification of 16S rRNA and functional gene targets was performed with a Roche 480 II Light Cycler. 16S rRNA gene-specific primers were used to target specific bacterial genera; 16s rRNA (F- 5′-TCC TAC GGG AGG CAG CAG T -3′ (R-5′ –GGA CTA CCA GGG TAT CTA ATC CTG TT -3′), dissimulatory sulfate reductase (dsr)AB (F- 5′-CCA ACA TGC ACG GYT CCA -3′) (R- 5′-CGT CGA ACT TGA ACT TGA ACT TGT AG -3′), taurine-pyruvate aminotransferase (tpa; Bilophila specific): (F-5′ –ACT TCT GTT CGA CGG TGG TG -3′) (R-5′ – GCA AGA CCT CTC GCT CCT TC -3′), butyrate kinase (buk) (F- 5′-TCT TGT WGT TGG WAG AGG YGG A -3′) (R- 5′-GCA ACI GCY TTT TGA TTT AAT GCA TGG -3′), hydroxybutyrate-CoA transferase (but): (Forward: 5′-TCG ATA GAC ATA TGC CAK GAG -3′; Reverse: 5′-TCG ATA CCG GAC ATA TGC CAK GAG -3′). Genes were quantified by determining a standard curve for gene copy number by cloning primer sequences into pCR4-TOPO plasmids and gene copy number was determined from cecum mucosa as previously described [45,46].
2.17. Sequencing of 16S rRNA gene using Illumina Mi-Seq platform
To assess bacterial community structure, primers specific for 16S rRNA V4–V5 region (Forward: 338F: 5′-GTGCCAGCMGCCGCGGTAA-3′ and Reverse: 806R: 5′-GGACTACHVGGGTWTCTAAT-3′) that contained Illumina 3′ adapter sequences as well as a 12-bp barcode were used. Sequences were generated by an Illumina MiSeq DNA platform at Argonne National Laboratory and analyzed by the program Quantitative Insights Into Microbial Ecology (QIIME) [47]. Operational Taxonomic Units (OTUs) were picked at 97% sequence identity using open reference OTU picking against the Greengenes database (05/13 release) [48]. OTUs were quality filtered based on default parameters set in the open-reference OTU command in QIIME and sequences were rarified to an equal sampling depth of 5000 reads per sample. Representative sequences were aligned via PyNAST [47], taxonomy assigned using the RDP Classifier [49], and a phylogenetic tree was built using FastTree [50]. Beta Diversity is represented by measuring UniFrac distances calculated using both weighted and unweighted algorithms and visualized with PCoA plots generated in Emperor.
2.18 Statistical analysis
Data were analyzed using a one-way ANOVA and Student’s t-tests to compute individual pairwise comparisons of means (p<0.05). Bonferroni’s posthoc tests were also performed for specific comparisons where appropriate. Analyses were conducted using the JMP software program version 10.0 for Windows (SAS, Cary, NC) for all data except for the gut microbes. Significant changes in relative OTU abundance were assessed using Kruskal Wallis test (FDR correction p ≤ 0.05). Multivariate statistical tests include ADONIS, ANOSIM, and PERMANOVA tests [47]. Spearman correlations and Principal Component Analysis (PCA) were run using MATLAB software. Relative abundances generated from 16s rRNA sequencing were analyzed in GraphPad Prism Version 6 using one-way ANOVA followed by Student’s t- tests. Alpha diversity analyses of microbial data were analyzed using QIIME 1.8 Software [47]. Data are expressed as means + S.E.M.
3. Results
3.1 Polyphenol content and profile of EP, NEP, and grape powder
The percentage yield of the EP and NEP fractions were 2.26% and 6.91%, respectively (Supplemental Table 2). The EP fraction contained 180.0 mg/g total phenolics as gallic acid equivalents (GAE), while the NEP fraction contained 10.5 mg/g. Total anthocyanin and proanthocyanidin content of the EP fraction were 37.8 mg/g (as cyaniding-3-O-glucoside equivalent) and 305.5 mg/g (as procyanidin B2 equivalent), respectively, whereas these polyphenols were not detectable in the NEP fraction (Supplemental Table 2). Individual anthocyanin analysis revealed that the most abundant anthocyanins present in the EP fraction were peonidin-3-O-glucoside (36.6 u/mg), malvidin-3-O-glucoside (30.8 u/mg), and peondin-3-O-cis (6″-O-p-coumaryl)-glucoside (28.5 u/mg) (Table 1). The profile of the degree of polymerization of the proanthocyanidins in the EP fraction is shown in Supplemental Fig. 1.
Table 1.
Anthocyanin Concentration in Grape Powder and the Extractable Polyphenol(EP) Fraction.
| Peak # | Identification | Grape Powder Concentrations (mg/kg) | EP Concentrations (μg/mg) |
|---|---|---|---|
| 1 | Delphinidin-3-O-glucoside | 4.93 | |
| 2 | Pyanidin-3-O-glucoside | 10.56 | |
| 3 | Petunidin-3-O-glucoside | 4.91 | |
| 4 | Peonidin-3-O-glucoside | 36.56 | |
| 5 | Malvidin-3-O-glucoside | 145.2 | 30.83 |
| 6 | Malvidin-3-O-(6″-O-acetyl-glucoside) | 3.70 | |
| 7 | Petunidin-3-O-cis-(6″-p-coumaryl-glucoside) | 2.56 | |
| 8 | Cyanidin-3-O-(6″-O-p-coumaryl-glucoside) | 125.0 | 2.21 |
| 9 | Petunidin-3-O-trans-(6″-O-p-coumaryl-glucoside) | 3.24 | |
| 10 | Peonidin-3-O-cis-(6″-p-coumaryl-glucoside | 31.7 | 2.73 |
| 11 | Malvidin-3-O-cis(6″-p-coumaryl-glucoside | 2.83 | |
| 12 | Peonidin-3-O-cis-(6″-O-p-coumaryl-glucoside) | 28.460 | |
| 13 | Malvidin-3-O-trans-(6″-O-p-coumaryl-glucoside) | 4.93 | |
| Total anthocyanins | 133.52 |
3.2 EP fraction with or without NEP fraction lowers body fat gain
Body weight gains and energy intakes were greater in all HF-fed mice compared to the LF controls (Table 2). There was no difference in the energy intake between the HF-fed mice, with the exception of the HF-EP+NEP group that consumed approximately 10% fewer calories than the HF controls (Table 2). Mice fed the HF-EP and HF-EP+NEP diets had lower body weight gains (Table 2; ~28% and 40%, respectively) and body fat percentages than the HF controls (Fig. 1; 27% and 37%, respectively). Mice fed the HF-EP, HF-NEP and HF-EP+NEP diets had lower total WAT depot weights compared to the HF controls (Fig. 1). Paradoxically, mice fed the HF-grape powder diet did not have improvements in body fat percentage, body weight, and total WAT depot weights compared to the HF controls.
Table 2.
Initial Body Weight (BW), Final BW, Body Weight Gain (BWG), Food Conversion Efficiency (FCE), and Total Calorie Intake per Treatment Group.*
| Diets | Initial BW (g) | Final BW (g) | BWG (g) | FCE (per cage, g food/g BW) | Kcal Intake (per cage) |
|---|---|---|---|---|---|
| LF | 19.2±0.3ab | 30.7±0.6d | 11.4±0.5d | 28.7±1.2a | 2,502±82c |
| HF | 19.6±0.4a | 44.8±0.9a | 24.8±1.0a | 13.7±0.3cd | 3,254±99a |
| EP | 18.9±0.2b | 36.5±0.8bc | 17.8±0.9b | 18.4±0.5b | 3,136±165ab |
| NEP | 19.2±0.3ab | 39.3±1.0b | 20.2±0.9b | 16.0±0.6c | 3,065±121ab |
| EP+NEP | 19.1±0.3ab | 34.3±0.8c | 15.0±0.9c | 20.7±1.2b | 2,915±63b |
| grape powder | 19.2±0.4ab | 44.1±1.1a | 24.9±1.0a | 13.3±0.3d | 3,145±98a |
LF, low fat control; HF, high fat sugar control; EP, extractable polyphenol fraction; NEP, non-extractable polyphenol fraction; grape powder, California Table Grape powder.
Figure 1.

Adiposity indices of C57BL/6J mice fed a low fat (LF), high fat (HF) diet, or a HF diet containing extractable (HF-EP) or non-extractable (HF-NEP) polyphenols, an equal combination of the EP and NEP fractions (HF-EP+NEP), or grape powder (HF-GP) for 16 weeks. Body fat percentages were measured at weeks 6, 11, and 15 using dual energy x-ray absorptiometry (DEXA). At week 16, the inguinal, retroperitoneal, epididymal, and mesenteric white adipose tissue (WAT) depots were excised and weighed. The weights of the inguinal, retroperitoneal, epididymal, and mesenteric depots were measured, and their sum labelled total WAT. Means ± SEM (n = 9–10) without a common lowercase letter differ (p<0.05) using one-way ANOVA and Student’s test.
3.3 EP fraction improves glucose disposal, insulin resistance, hypertriglyceridemia, and plasma MCP-1 and LPS binding protein levels
GTTs were conducted at weeks 7, 12, and 16, and fasting plasma insulin and HOMA-IR were measured at week 16, respectively, to assess the impact of grape consumption on glucose disposal and insulin resistance,. Mice consuming the HF control diet had impaired GTTs at all three time points compared to the LF controls (Fig. 2A). This HF-mediated impairment was attenuated at all three time points in mice fed the HF-EP diet. Mice fed the HF-NEP and HF-EP+NEP diets had improved GTTs at weeks 12 and 16 compared to the HF controls. HOMA-IR scores at week 16 indicated that mice consuming the HF-EP+NEP fraction had improved insulin sensitivity compared to the HF controls (Fig. 2B). Surprisingly, consuming grapes did not significantly improve GTT, fasting plasma insulin, and HOMA-IR scores. Mice fed the HF-EP and the HF-EP+NEP diets had lower plasma TG levels compared to the HF controls (Fig. 2C). Notably, mice consuming the HF diet had increased plasma levels of MCP-1, which were lower in mice consuming the HF-EP and HF-EP+NEP diets (Fig. 2D). Mice consuming the HF diet had higher levels of plasma LPS binding protein, an indicator of circulating LPS levels, compared to controls. LPS binding protein was lower in HF-NEP fed mice compared to HF-fed control mice (Fig. 2E).
Figure 2.
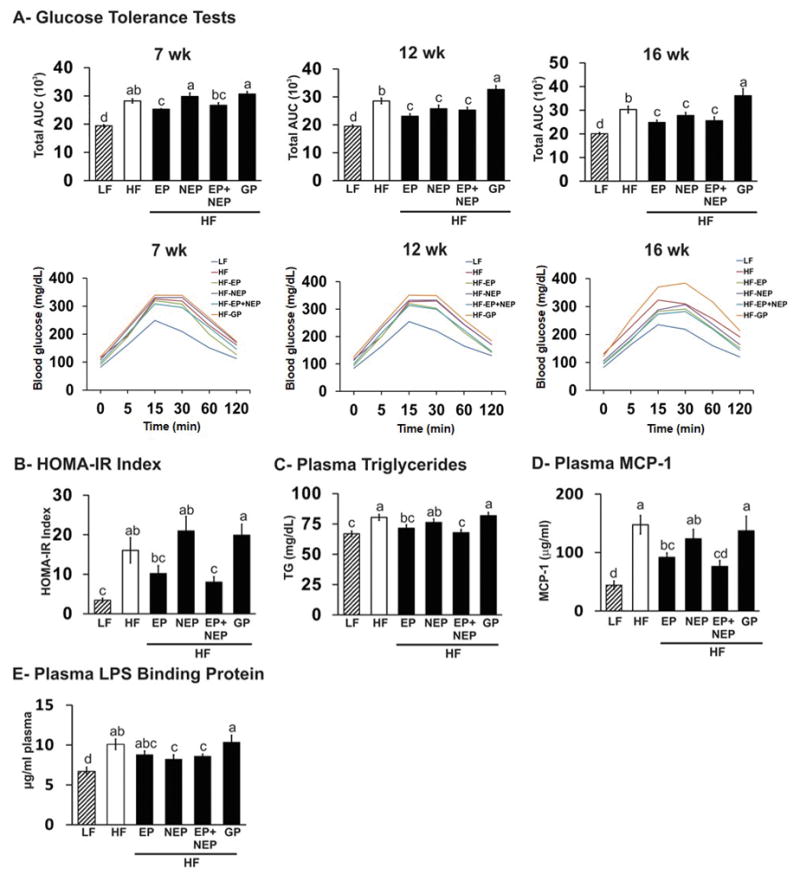
Glucose tolerance tests (GTT)s (A), the homeostatic model assessment of insulin resistance (HOMA-IR) (B), plasma TG levels (C), plasma MCP-1 (D), and plasma LPS binding protein (E) in C57BL/6J mice fed a low fat (LF), high fat (HF) diet, or a HF diet containing extractable (HF-EP) or non-extractable (HF-NEP) polyphenols, an equal combination of the EP and NEP fractions (HF-EP+NEP), or grape powder (HF-GP) for 16 weeks. At weeks 7, 12, and 16, GTTs were conducted on mice fasted for 8 h and injected i.p. with a 20% glucose solution. Fasting plasma insulin was collected at week 16 and used to calculate the HOMA-IR index. Data are expressed as total area under the curve (AUC) for the GTT bar graphs. Means ± SEM (n=9–10) without a common lowercase letter differ (p<0.05) using one-way ANOVA and Student’s test.
3.4 Grape fraction consumption lowers hepatic TG levels and alters the expression of genes associated with lipid metabolism and inflammatory signaling
Liver tissue was analyzed to assess the impact of the diets on liver TG levels and markers of lipogenesis, lipolysis, fatty acid oxidation, and inflammation. Mice consuming the HF control diet had greater liver weights (Fig. 3A) and TG content (Fig. 3B, 3C) compared to the LF-fed mice. These outcomes were lower in mice consuming the HF-EP+NEP diet compared to HF-fed control mice. Consistent with these data, the expression of the lipogenic transcription factor Pparγ was higher in the HF-fed mice compared to the LF-fed mice, and was lower in mice consuming the HF-EP and HF-EP+NEP diets (Fig. 4). Compared to LF controls, HF-feeding also increased gene expression of fatty acid synthase (Fas), stearoyl regulatory element binding protein 1 (Srebp-1c), and stearoyl-CoA desaturase 1 (Scd1; data not shown), which were not affected by grape or grape fraction consumption (Fig. 4).
Figure 3.

Liver weights (A), liver triglyceride content (B), and Oil red O staining of liver tissue (C) of C57BL/6J mice fed a low fat (LF), high fat (HF) diet, or a HF diet containing extractable (HF-EP) or non-extractable (HF-NEP) polyphenols, an equal combination of the EP and NEP fractions (HF-EP+NEP), or grape powder (HF-GP) for 16 weeks. At week 16, liver tissues were excised and frozen in OCT compounds, cut at 5 μm, mounted on slides, and stained with Oil red O solution. Means ± SEM (n=9–10) without a common lowercase letter differ (p<0.05) using one-way ANOVA and Student’s test.
Figure 4.

Liver gene expression of markers of inflammation, lipolysis, and lipogenesis in liver of C57BL/6J mice fed a low fat (LF), high fat (HF) diet, or a HF diet containing extractable (HF-EP) or non-extractable (HF-NEP) polyphenols, an equal combination of the EP and NEP fractions (HF-EP+NEP), or grape powder (HF-GP) for 16 weeks. qPCR was conducted to measure mRNA abundance of genes associated with hepatic inflammation, lipolysis, or lipogenesis. Means ± SEM (n=9–10) without a common lowercase letter differ (p<0.05) using one-way ANOVA and Student’s test.
HF feeding increased the hepatic mRNA levels of the inflammatory marker C-reactive protein 1 (Crp1), which was attenuated by HF-EP and HF-EP+NEP feeding (Fig. 4). Mice fed the HF-EP and HF-EP+NEP diets had greater mRNA levels of lipolytic enzyme hormone sensitive lipase (Hsl), while mice fed the HF-EP+NEP diet had higher mRNA levels of adipose triglyceride lipase (Atgl) compared to HF controls (Fig. 4). No treatment differences were detected in the expression of carnitine palmitoyltransferase 1-a (Cpt1a) (data not shown). Similarly, no treatment differences were detected in the protein levels of AMPK-P, PPARγ, P-ACC-1, HSL-P, or NFκB-p65,
3.5 EP fraction with or without NEP fraction improves the expression of WAT genes associated with inflammatory signaling and lipodystrophy
To determine if the negative metabolic effects caused by HF-feeding were associated with inflammation in WAT, mRNA levels of several proinflammatory genes were measured in inguinal (subcutaneous), epididymal (visceral), and mesenteric (visceral) WAT. In inguinal WAT, mice fed the HF control diet had greater mRNA levels of cluster of differentiation 11c (Cd11c) and monocyte chemoattractant protein 1 (Mcp1) compared to LF controls (Fig. 5A). This increase was attenuated in mice fed the HF-EP and HF-EP+NEP diets. In epididymal WAT, HF-feeding increased the mRNA levels of epidermal growth factor-like module containing mucin-like hormone receptor 1 (Erm1; F4/80 human orthologue), Cd11c, toll-like receptor-4 (Tlr4), inducible nitric oxide synthase (iNos), Mcp1, and tumor necrosis factor alpha (TNFα) compared to the LF controls (Fig. 5B). Consistent with the inguinal data, mice fed the HF-EP and HF-EP+NEP diets had lower mRNA levels of these genes with the exception of iNos (HF-EP only) compared to the HF controls. Similar with the epididymal data, HF-feeding increased mRNA levels of F4/80, Cd11c, Tlr4, and Mcp1 in the mesenteric WAT compared to the LF controls, which were attenuated in mice fed the HF-EP, HF-NEP, and HF-EP+NEP diets, with the exception of Mcp1 (HF-EP diet only; Fig. 5C). Although Cd11c and Tlr4 mRNA levels were lower in HF-GP fed mice compared to the HF controls, F4/80 and Mcp1 levels were not attenuated by the consumption of whole grape powder.
Figure 5.

The expression of markers of inflammation in (A) inguinal (ING; subcutaneous), (B) epididymal (EPI; visceral), and (C) mesenteric (MES; visceral) WAT of C57BL/6J mice fed a low fat (LF), high fat (HF) diet, or a HF diet containing extractable (HF-EP) or non-extractable (HF-NEP) polyphenols, an equal combination of the EP and NEP fractions (HF-EP+NEP), or grape powder (HF-GP) for 16 weeks. qPCR was conducted to measure mRNA abundance of genes associated with inflammation in three WAT depots. Means ± SEM (n=9–10) without a common lowercase letter differ (p<0.05) using one-way ANOVA and Student’s test.
To determine if the reduction in adiposity by consuming grape fractions was associated with alterations in lipid metabolism, inguinal and epididymal WAT were examined for markers of; (i) lipogenesis (i.e., Pparγ, Srebp1c, Scd1, acylglycerol-3-phosphate-O-acyltransferase 2 (Agpat2), fatty acid synthase (Fas), glycerol-3-phosphate acyltransferase2 (Gpat2)), (ii) lipolysis (i.e., Atgl), (iii) beta-oxidation (i.e., carnitine palmitoyltransferase 1-b (Cpt1b), Pparα)), (iv) SCFA receptors (i.e. Gpr43, 41, 119), and (v) plasminogen activator inhibitor-1 (Pai-1). In inguinal WAT, mice fed the HF diet had greater expression of Agpat2, a gene encoding for a protein associated with TG biosynthesis, which was lower in the HF-EP and HF-EP+NEP groups (Fig. 6A). The expression of Cpt1p, a beta-oxidation marker, was lower in mice fed the whole grape powder and grape fractions compared to the HF controls. No treatment differences in gene expression were observed for Srebp1c, Scd1, Fas, Gpat2, Atgl, and Pparα (data not shown).
Figure 6.

The expression of markers of lipogenesis, lipolysis, or fatty-acid oxidation in inguinal (ING) (A) and epididymal (EPI) (B) WAT of C57BL/6J mice fed a low fat (LF), high fat (HF) diet, or a HF diet containing extractable (HF-EP) or non-extractable (HF-NEP) polyphenols, an equal combination of the EP and NEP fractions (HF-EP+NEP), or grape powder (HF-GP) for 16 weeks. qPCR was conducted to measure mRNA abundance of genes associated with lipogenesis, lipolysis, and fatty-acid oxidation in inguinal (A; subcutaneous) and epididymal (B; visceral) WAT depots. Means ± SEM (n=9–10) without a common lowercase letter differ (p<0.05) using one-way ANOVA and Student’s test.
In epididymal WAT, mice consuming the HF diet had higher mRNA levels of Agpat2 compared to LF controls (Fig. 6B). Consumption of the HF-EP+NEP diet attenuated this HF-induced increase in Agpat2 expression. Additionally, mice fed the HF diet with or without grapes had lower levels of Pparγ compared to LF controls. The expression of Pparα, a marker of beta oxidation, was lower in mice fed the HF control and the grape powder diets compared to LF controls. Surprisingly, HF-feeding increased the mRNA levels of Cpt1b, which was reduced by HF-EP and HF-EP+NEP feeding. Additionally, mice fed the HF-EP+NEP diet had lower mRNA levels of Gpr43, a SCFA-activated receptor associated with increased energy harvest, compared to HF and LF controls. Gpr119, a cannabinoid-inducible gene, was markedly increased in the HF-EP group compared to all other treatments. No differences in gene expression in epididymal WAT were observed for Srebp-1c, Scd1, Fas, Gpat2, and Atgl (data not shown).
3.6 HF-feeding increases the activity of MPO and impairs the localization of the tight junction protein ZO-1
Given the reported adverse effects of consuming diets rich in saturated fats on intestinal health [reviewed in 10], and potential prebiotic impact of grapes [reviewed in 29], we measured the effects of the diets on; (i) the activity of MPO, an enzyme associated with neutrophil infiltration, (ii) IAP, an enzyme that deactivates LPS, (iii) ZO-1 localization, a tight junction protein that maintains gut barrier integrity, and (iv) the expression of several inflammatory genes in ileum and proximal colon mucosa. The localization of ZO-1 in the apical area of the ileal epithelium surface was impaired in HF-fed control mice compared to the LF-fed mice, and improved in mice fed the HF-EP and HF-NEP diets (Fig. 7A, B). Consistent with these data, the activity of MPO, but not IAP (data not shown), was greater in the intestinal mucosa of mice consuming the HF diet compared to the LF diet, and attenuated in mice consuming HF diets supplemented with grapes and grape fractions (Fig. 7C). Of the inflammatory genes measured in ileum and proximal colon mucosa (i.e., Cd11c, Cd68, Erm1, Mcp1, Tnfα, Tlr4, iNos, and Il1β; Supplemental Fig. 2 A, B), only Cd11c and Cd68 were increased by HF-feeding in the proximal colon; and only Cd68 expression was decreased by the HF-EP+NEP and HF-GP diets.
Figure 7.

Localization (A) and quantification (B) of the tight junction protein ZO-1 at the apical area of the ileum epithelium and activity of MPO (C) in the ileum mucosa of C57BL/6J mice fed a low fat (LF), high fat (HF) diet, or a HF diet containing extractable (HF-EP) or non-extractable (HF-NEP) polyphenols, an equal combination of the EP and NEP fractions (HF-EP+NEP), or grape powder (HF-GP) for 16 weeks. Means ± SEM (n=9–10) without a common lowercase letter differ (p<0.05) using one-way ANOVA and Student’s t test. Localization of ZO-1 was visualized by immunostaining of ileum samples, the staining was quantified by J1 software, and is representative of at least three mice per treatment. Arrows indicated impairment in localization of ZO-1.
3.7 Influence of grape fractions on epithelial cell gene expression and cecal digesta levels of SCFA
Intestinal microbial metabolites impact local and systemic health, in part, by influencing epithelial cell (e.g., antimicrobial peptide secretion) and microbial products (e.g., SCFA production) that impact energy harvest, and the GPR-mediated release of endocrine signals from L-cells (e.g., glucagon like peptides, PYY) located in the mucosa epithelium. Locally, these metabolites influence microbial metabolism, the integrity of the mucosa barrier, and carbohydrate and lipid metabolism systemically [20]. Therefore, we determined the influence of the dietary treatments on the induction of epithelial genes associated with dysbiosis (e.g., Reg3γ; [51]), SCFA receptor activation (e.g., Gpr41, -43, and -119), and two of their downstream targets (e.g., Glp and Pyy) that have been reported to improve insulin secretion or sensitivity.
Although HF-feeding had no impact on the expression of Gpr41, Grp43, Gpr 119, Reg3γ, Pyy, or Glp in the ileum mucosa (Fig. 8A, Supplemental Fig. 3), Gpr43 mRNA levels were higher in the HF-NEP and HF-EP+NEP groups compared to the HF controls (Fig. 8A). Mice fed the HF-EP+NEP and the HF-GP diets had lower mRNA levels of Gpr41 in the ileum mucosa compared to the HF controls (Supplemental Fig. 3). Mice fed the HF-GP diet had the highest levels of Glp and Gpr119 compared to all other treatments (Supplemental Fig. 3). Notably, HF-fed mice supplemented with EP and grape powder had higher levels of Reg3γ compared to the HF-fed controls (Fig. 8A). Reg3γ encodes for an intestinal protein that protects against infection from Gram-positive bacteria due to its bactericidal activity [51].
Figure 8.

The expression of Gpr43, Reg3γ, and Pyy in the ileum (A) or proximal colon mucosa (B) of C57BL/6J mice fed a low fat (LF), high fat (HF) diet, or a HF diet containing extractable (HF-EP) or non-extractable (HF-NEP) polyphenols, an equal combination of the EP and NEP fractions (HF-EP+NEP), or grape powder (HF-GP) for 16 weeks. qPCR was conducted to measure mRNA abundance of genes associated with regulation of energy balance (Gpr43 and Pyy) and dysbiosis (Reg3γ) in ileum mucosa and proximal colon mucosa. Means ± SEM (n=9–10) without a common lowercase letter differ (p<0.05) using one-way ANOVA and Student’s test.
In contrast to the ileum mucosa data, mice fed the HF control diet had higher mRNA levels of Gpr43, Gpr119, and Pyy in the proximal colon mucosa compared to the LF controls (Fig. 8B; Supplemental Fig. 3). Supplementing HF-fed mice with NEP and EP-NEP or EP-NEP alone decreased Gpr43 and Pyy expression, respectfully, compared to HF control mice (Fig. 8B). Although there were no differences between the LF and HF control groups, mice fed the HF-GP diet had higher levels of the SCFAs acetate, propionate, and butyrate in the cecal contents compared to mice fed the HF-EP+NEP diet (Fig. 9). Furthermore, mice fed the HF-EP+NEP diet had lower levels of cecal acetate, a substrate for lipogenesis, compared to the HF controls. Notably, the abundance of genes encoding dissimilatory sulfite reductase (dsra) and taurine-pyruvate aminotransferase (tpa), markers of Bilophila wadsworthia that produce noxious sulfur metabolites, were increased in the HF control group, but decreased in the HF-GP group (Fig. 10A). Interestingly, the abundance of genes encoding butyrate-producing enzymes including hydroxybutyrate-CoA transferase (but) and butyrate kinase (buk) were elevated in the HF-EP group compared LF or HF controls (Fig. 10B).
Figure 9.

Levels of SCFAs acetate, propionate, and butyrate were measured via GC-MS-MS from cecal contents of C57BL/6J mice fed a low fat (LF), high fat (HF) diet, or a HF diet containing extractable (HF-EP) or non-extractable (HF-NEP) polyphenols, an equal combination of the EP and NEP fractions (HF-EP+NEP), or grape powder (HF-GP) for 16 weeks. Means ± SEM (n=8–10) are shown and significant differences between groups are indicated by * (p<0.05), ** (p<0.01), *** (p<0.001), or **** (p<0.0001) using Student’s t-test.
Figure 10.

Abundance of sulfidogenic and butyrate-producing bacteria in the intestinal mucosa of C57BL/6J mice fed a low fat (LF), high fat (HF) diet, or a HF diet containing extractable (HF-EP) or non-extractable (HF-NEP) polyphenols, an equal combination of the EP and NEP fractions (HF-EP+NEP), or grape powder (HF-GP) for 16 weeks. (A) Abundance of the sulfidogenic bacteria expressing dissimilatory sulfate reductase (dsrA) or taurine-pyruvate aminotransferase (tpa) were measured using qPCR targeting dsrA and tpa in the colonic mucosa. (B) The abundance of genes regulating butyrate production including hydroxybutyrate-CoA transferase (but) and butyrate kinase (buk) were measured in the colonic mucosa. Means ± SEM (n=8–10) are shown and significant differences between groups are indicated by * (p<0.05), ** (p<0.01), *** (p<0.001), or **** (p<0.0001) using Student’s t-test.
3.8. Sequencing of the 16S rRNA gene reveals alterations in microbial structure
In order to better understand the impact of grape extract feeding on gut bacterial community structure, an untargeted approach was used by sequencing the 16S rRNA gene in cecum mucosal samples. Sequencing was performed on an Illumina MiSeq platform using primers targeting the V4–V5 region of the 16S rRNA gene [47]. Alpha Diversity analyses revealed that the HF control group significantly reduced the number of observed species compared to the LF group, whereas the HF-GP diet restored this reduction (Fig. 11A, B). Notably, consuming HF diets supplemented with EP or NEP partially restored the HF diet-mediated reduction in diversity, but not significantly (Fig. 11B). These results suggest that the whole composition of grape powder is necessary to maintain diversity of the microbial community. Principal Coordinate Analysis (PCoA) of weighted UniFrac distances did not reveal obvious differences in beta diversity or community structure across diet groups, but there was clear separation between the LF, HF, and HF-EP groups based on unweighted UniFrac distances (Supplemental Fig. 4). To further interrogate differences between diet groups, multivariate statistical tests including ADONIS, ANOSIM, and PERMANOVA were conducted. Significant differences were found among unweighted and weighted UniFrac distances across diet groups (Table 3). Next, a Kruskal Wallis test was performed to determine significant differences in relative abundance of taxa between groups. Here, it was found that several bacterial taxa were significantly altered based on diet (Fig. 12). For instance, the family Lachnospiraceae from the Firmicutes phylum (Fig. 12A) was decreased in mice consuming the HF control diet, but significantly increased in the HF-EP and in HF-EP+NEP groups. Belonging to the family Lachnospiraceae, the genus Coprococcus was selectively increased in the HF-NEP and HF-EP+NEP groups (Fig. 12A). Concurrently, the HF-EP+NEP group had a suppressive effect on genus Ruminococcus and family Mogibacteriaceae. Differential effects were seen among other phyla such as Bacteroidetes, Actinobacteria, and Tenericutes (Fig. 12B).
Figure 11.

Observed bacterial species in cecum mucosa of C57BL/6J mice fed a low fat (LF), high fat (HF) diet, or a HF diet containing extractable (HF-EP) or non-extractable (HF-NEP) polyphenols, an equal combination of the EP and NEP fractions (HF-EP+NEP), or grape powder (HF-GP) for 16 weeks. (A) Rarefaction curves of observed species are shown. Samples were rarified to 5,000 sequencing reads per sample. (B) Area under the curve (AUC) of rarefaction curves shown for each diet group. Means ± SEM (n=8–10) are shown and significant differences between groups are indicated by * (p<0.05), ** (p<0.01), *** (p<0.001), or **** (p<0.0001) using Student’s t-test.
Table 3.
Statistical Analyses of UniFrac Distances
| Weighted | R2 | P value |
|---|---|---|
| Adonis | 0.28072 | 0.001 |
| Anosim | 0.2462 | 0.001 |
| Pseudo F Statistic | P value | |
| Permanova | 4.059 | 0.001 |
| Unweighted | R2 | P value |
| Adonis | 0.15215 | 0.001 |
| Anosim | 0.4484 | 0.001 |
| Pseudo F Statistic | P value | |
| Permanova | 1.8663 | 0.001 |
Figure 12.

Significantly altered relative abundances of microbial taxa (i.e., Firmicutes (A), Bacteroidetes (B), Actinobacteria (C), and Tenericutes (D)) found across C57BL/6J mice fed a low fat (LF), high fat (HF) diet, or a HF diet containing extractable (HF-EP) or non-extractable (HF-NEP) polyphenols, an equal combination of the EP and NEP fractions (HF-EP+NEP), or grape powder (HF-GP) for 16 weeks. Taxa shown were significantly altered based on Kruskal Wallis test run using QIIME software following rarefaction at 5000 sequences per sample. FDR corrected p values based on this analysis are shown on bottom left of each graph. Means ± SEM (n=8–10) are shown and significant differences between groups are indicated by * (p<0.05), ** (p<0.01), *** (p<0.001), or **** (p<0.0001) using Student’s t-test.
To assess differences between specific diet groups, PCA [52, 53] was conducted and clear clustering was evident between the HF group and the HF-NEP, HF-EP+NEP, and HF-GP groups (Supplemental Fig. 5). PCA between the HF diet and other aforementioned groups revealed that ~35% of the variance in relative bacterial abundance between the groups is explained with Principal Component 1 (PC1). Principal component 2 (PC2) explained an additional ~17% of the variance between groups. When comparing the HF and HF-EP groups, the variance explained by PC1 was primarily associated with Lactobacillus and rc4-4 (Supplemental Table 3). Between the HF and HF-NEP groups, the variance explained by PC1 was primarily associated with Akkermansia. The family S24-7, belonging to the Bacteroidetes phylum, was the primary factor explaining the variance along PC2 when comparing the HF and HF-NEP groups, and along PC1 when comparing the HF and HF-EP+NEP groups. The family Ruminoccoccaceae and the order Clostridiales explained the variance along PC1 between HF and HF-GP groups (Supplemental Table 3). Taken together, different taxa explain the variance between the HF control diet and HF diets supplemented with EP and NEP, explaining that each dietary component has a specific impact on the microbial community.
Lastly, Spearman Correlation analysis revealed a significant negative correlation between the family Lachnospiraceae (R2 = 0.42; p =0.001) and body fat percentage (Table 4), whereas Clostridiales (R2 = 0.45, p = 0.0004) and the genus Ruminococcus (R2 = 0.38, p = 0.004; also belonging to the order Clostridiales) were positively associated with body fat percentage (Table 4). These taxa were similarly correlated with inguinal, mesenteric, and total fat mass (data not shown). Interestingly, significant correlations also existed between several taxa and the expression of Reg3γ, a gene encoding for an epithelial secreted protein with antimicrobial properties (Table 5) [51]. For instance, the families Clostridiaceae and Mogibacteriaceae were negatively associated with Reg3γ expression, while the genus Allobaculum was positively associated with Reg3γ expression. We speculate that a direct host-microbe interaction exists between Allobaculum and Reg3γ expression, and will be a focus of future research.
Table 4.
Taxa Associated with Body Fat Percentage.
| Taxa Associated with Body Fat Percentage: (Phylum; Class; Order; Family; Genus) | Correlation | P Value |
|---|---|---|
| Fimicutes; Clostridia; Clostridiales | 0.454822 | 0.000435 |
| Firmicutes; Clostridia; Clostridiales; Lachnospiraceae | −0.420729 | 0.001231 |
| Firmicutes; Clostridia; Clostridiales; Lachnospiraceae; Ruminococcus | 0.377041 | 0.004059 |
Table 5.
Taxa Associated with Ileal Reg3 Gene Expression.
| Taxa Associated with Body Fat Percentage: (Phylum; Class; Order; Family; Genus) | Correlation | P Value |
|---|---|---|
| Firmicutes; Clostridia; Clostridiales; Clostridiaceae; Other | −0.593189 | 1.75E-05 |
| Firmicutes; Clostridia; Clostridiaceae | −0.6450593 | 1.72E-06 |
| Firmicutes; Clostridia; Clostridiales; Mogibacteriaceae | −0.5933202 | 1.74E-05 |
| Firmicutes; Erysipelotrichi; Erysipelotrichales; Erysipelotrichaceae; Allobaculum | 0.588010 | 2.16E-05 |
4. Discussion
4.1 Rationale and significance of this study
We previously demonstrated that feeding whole GP (i.e., 3% and 5% GP; w/w in the diet) in conjunction with a HF diet (i.e., 34% kcals from fat; 31% of which came from milk fat) for 10 weeks modestly; (i) reduced adiposity (3% and 5% GP), hepatic steatosis (5% GP), and the ileal mucosa abundance of the deleterious sulfidogenic bacterium species DSB and a sulfidogenic gene drsA-Bw (3% GP), (ii) increased the proximal colon mucosa abundance of the beneficial bacterium Akkermansia muciniphila (5% GP), and (iii) improved the localization of the tight junction protein ZO-1 on the apical epithelial surface of the ileum (3% and 5% GP) [33]. However, consuming the HF diet for 10 weeks only modestly increased adiposity, insulin resistance, and several markers of inflammation in epididymal (visceral) WAT, and had no effects on markers of intestinal inflammation.
Therefore, we conducted the current 16 week study using a higher level of dietary fat (i.e., 44% kcals) and a fatty acid profile that was similar to Americans in the 75th percentile (i.e., soybean oil, butter, lard, shortening, and beef tallow) to enhance the metabolic consequences of diet-induced obesity [34]. The sugar content (i.e., 18% of kcals) was also similar to that of Americans in the 75th percentile. We also wanted to know which fraction of GP was responsible for reducing adiposity and its potential metabolic complications. Accordingly, we examined the effects of whole GP (5% or 15 human servings) and two isolated fractions of grapes, which were fed at amounts equal to those in 5% GP, on the development of obesity, glucose intolerance, steatosis, WAT inflammation, and intestinal dysbiosis in C57BL/6J mice fed a HF diet.
The EP fraction accumulated approximately 17 times more total phenolics, particularly anthocyanins and proanthocyanidins, compared to GP or the NEP fraction (Table 1, Supplemental Table 2). The results indicate that in the context of HF-feeding, consumption of the polyphenol-rich EP fraction, alone or in combination with the polyphenol-poor NEP fraction, attenuated diet-induced obesity, insulin resistance, steatosis, and chronic inflammation in WAT while altering the bacterial structure of the cecum mucosa. Paradoxically, consuming GP had no beneficial impact on the host outcomes measured. However, GP supplementation had a positive impact on preserving microbial diversity in the face of HF-feeding (Fig. 11A) and reduced the abundance of the dsra and tpa genes induced by HF diet (Fig. 10A).
4.2 Potential mechanisms by which the EP fraction suppresses adiposity and inflammation and improves insulin sensitivity
Anthocyanins and proanthocyanidins are groups of flavonoids present in relatively large amounts in table grapes. Our phenolic analysis indicated that the most abundant anthocyanins found in our table grapes were peonidin-3-O-glycosides, malvidin-3-O-glucoside, and cyanidin-3-O-glucoside (Table 1). While studies have demonstrated anti-obesity and anti-diabetic effects of anthocyanins [reviewed in 54], studies focusing on the effects of feeding whole grapes and grape fractions in subjects consuming a diet similar in fat amount and types to the American diet are lacking. Consistent with our anthocyanin-rich EP data, mice consuming a HF diet (i.e., 60% kcals from fat, primarily lard) supplemented with anthocyanin-rich muscadine grape or wine extracts for 15 weeks had lower body weights, plasma glucose and TG levels, insulin resistance, and CRP levels compared to controls [55]. In addition, supplementation of grape seed procyanidins prevented body weight gain, reduces WAT inflammatory markers (i.e. Tnfα, Il-6, Crp) in high-fat-fed rats [56]. Similar effects were observed with grape seed extract supplementation in HF-fed mice [57], and in high fructose-fed rats [58]. These findings are consistent with our data demonstrating that EP-fed mice had decreased body weight gain, reduced WAT weights, improved insulin sensitivity, lower plasma levels of TG and MCP-1, and reduced markers of inflammation in epididymal WAT (i.e. F4/80, Cd11c, Tlr4, iNos, Mcp1, and Tnfα).
Anthocyanins have been reported to exert anti-inflammatory and anti-obesity effects in vitro, and in some instances in vivo. For example, anthocyanins from black soybeans reversed weight gain, reduced the levels of serum TG and cholesterol, and increased the levels of high-density lipoproteins [59]. Anthocyanins from purple corn prevented HF-induced increases in body weight and WAT weights in mice [60]. Similarly, in HF (i.e., 60% kcals from lard)-fed mice, purified anthocyanins from blueberries prevented body weight and fat gain [61]. Tart cherries, which have an anthocyanin profile similar to grapes,, reduced fat mass and WAT markers of inflammation including Il6 and Tnfα. [62]. In vitro, 3T3-L1 preadipocytes treated with anthocyanins had decreased TG accumulation and gene and protein expression of Pparγ and Fas [63]. While we did not observe alterations in expression of Pparγ and Fas within the WAT, we did observe that mice fed the EP fraction had reduced expression of the lipogenic gene Agpat2.
We also demonstrated that mice fed the anthocyanin-rich EP fraction had improved glucose tolerance and insulin sensitivity compared to the HF controls. Similar beneficial improvements in glucose tolerance were observed with supplementation of anthocyanins from Maqui Berry in HF-fed mice [64] and with supplementation of anthocyanins from Cornelian cherry in HF-fed mice [65]. Cyanidin-3-O-glucoside supplementation improved insulin sensitivity in diabetic mice via down-regulation of retinol binding protein and up-regulation of GLUT4 gene expression [66]. This could be a potential mechanism by which the EP fraction improved glucose tolerance and insulin sensitivity. One novel finding of our study was that the EP fraction increased expression of Hsl, a gene associated with lipolysis, and reduced expression the lipogenic-related gene Pparγ in the liver. This indicates that the EP fraction may reduce steatosis through up-regulation of lipolytic pathways and suppression of lipogenic pathways.
4.3 Beneficial effects of the NEP fraction
The NEP diet contained non-extractable polyphenols and fiber. As shown in Supplemental Table 2, the NEP fraction contained approximately 17-fold less total phenolics, none of which were detected as anthocyanins or proanthocyanidins. We did not determine what kind of phenolics were in the NEP fraction. However, compared to the HF controls, mice consuming the NEP fraction had; (i) lower body (Table 2) and WAT depot weights (Fig. 1B), (ii) improved GTTs at wks 12 and 16 (Fig. 2A), lower plasma LPS binding protein (Fig. 2E), (iii) lower liver weights (3A), (iv) lower expression levels of macrophage markers in MES WAT (e.g., F4/80, Cdllc, and Tlr4; Fig. 5C), and (v) higher ZO-1 and lower MPO levels in ileum mucosa (Fig. 7B, C). Thus, we speculate that either the non-extractable phenolics (e.g., hydrolysable gallotannins and ellagitannins) or fiber in the NEP fraction reduced some of the detrimental effects of the HF diet.
4.4 Relationship of intestinal to systemic inflammation
Consuming supra-physiological levels of saturated fat is known to increase body fat mass and consistently induce chronic, low-grade inflammation systemically [reviewed in 67]. In the current study, feeding a more physiological level of fat increased MPO activity and impaired ZO-1 localization in intestinal mucosa, and increased LPS binding protein in plasma, which were improved in mice consuming GP or its fractions, depending on the outcome measured. However, HF-feeding did not increase mRNA markers of inflammation in the ileum or proximal colon or IAP activity in duodenal mucosa after 16 weeks. In contrast, other research has shown that feeding non-physiological levels of saturated fat triggers intestinal inflammation that contribute to increase systemic inflammation and insulin resistance, possibly due to intestinal dysbiosis and barrier dysfunction [7–13, 18, 19, 68–70].
Alternatively, the intestinal linkage to systemic effects of HF- and grape fraction-feeding may be due to changes in gut microbiota as shown in the current study and our previous study [33]. For instance, we found that HF diets supplemented with EP, NEP, the combination, or GP partially or fully rescued HF-mediated reduction in observed microbial species in the cecal mucosa. Depending on the grape polyphenol fraction, particular taxa were selectively altered (Fig. 12). For example, the inclusion of EP resulted in a significant increase in the relative abundance of Lachnospiraceae compared to HF diet alone (Fig. 12A). These results support findings that grapes or their polyphenol constituents significantly impact microbial structure, diversity, and relative abundance [71].
Causal relationships have been established between gut microbiota and adiposity. For example, fecal microbiota transplant from lean donors improved insulin sensitivity in humans with metabolic syndrome [72]. Conversely, transfer of obese human microbiota to a germ free recipient mouse resulted in increased adiposity [73]. One proposed mechanism for this relationship is HF diet-mediated impairment of gut barrier function, leading to endotoxemia [74, 75] and impaired regulation of energy metabolism [reviewed in 76]. Elevated circulating inflammatory cytokines and chemokines contribute to insulin resistance [77–79]. Conversely, consumption of dietary fiber and polyphenols may reduce intestinal and systemic inflammation through regulation of energy intake and improved intestinal barrier function [reviewed in 29]. For example, red wine grape polyphenols given to humans for 4 weeks increased the number of Enterococcus, Prevotella, Bacteriodetes, and Bifidobacterium bacteria, which correlated to improved blood pressure, and serum levels of TG, total cholesterol, and CRP [80]. Similarly, rats given grape pomace had increased fecal counts of Lactobacillus and Bifidobacterium which was correlated with increased concentrations of primary bile acids, cholesterol, and cholesterol metabolites and decreased concentrations of secondary bile acids [81]. This suggests that alteration of the microflora by grape polyphenols may inhibit cholesterol absorption thus improving circulating levels. Indeed, fermentation of fiber and polyphenols by colonic microbes into SCFA regulates energy intake and metabolism through stimulating the release of glycoproteins (e.g., Glp-1, Glp-2, and Pyy) or cannabinoids by activating Gpr43 and Gpr41 or Gpr119, respectively [reviewed in 82]. Consistent with these data, butyrate is beneficial to intestinal homeostasis as an endothelial energy source as well as through increasing tight junction protein synthesis and mucin secretions [83, 84].
In the current study, the expression of several markers of enteroendocrine cell secretions associated with SCFA activation were upregulated. However, these results were conflicting between the ileum (i.e., Gpr43 mRNA levels increased by the EP, NEP, EP+NEP diets) and the proximal colon (i.e., Gpr43 mRNA levels increased by HF diet only). Notably, the levels of SCFAs, particularly acetate, were reduced in mice fed HF-EP+NEP compared to the LF and HF-grape powder diets. Diet-mediated changes in the level of these microbial metabolites support functional changes of the gut microbiota upon supplementation with grape polyphenols. In contrast to the SCFA data, the HF-EP diet selectively increased the abundance of genes that regulate microbial production of butyrate, suggesting a potential beneficial impact of grape anthocyanins on butyrate-producing microbes. Future analysis of protein levels of Gprs, Pyy, and Glp1/2 levels, and gut barrier function should provide more insight about the consumption of grape powder or grape fractions on host-microbe interactions that influence these intestinal biomarkers. Of particular interest was the finding that HF-EP robustly induced the mRNA levels of Reg3γ, a gene encoding for an antimicrobial peptide, that was positively correlated with the genus Allobaculum. Healthy metabolic phenotypes and LF-feeding have been previously associated with elevated abundance of Allobaculum [33] and could represent a bacterium that drives beneficial host-microbe interactions by conferring anti-microbial capacity against pathogenic bacteria. Future experiments will examine a direct interaction between grape polyphenols, Allobaculum, and Reg3γ levels in the host.
4.5 Limitations and unanswered questions
The beneficial systemic effects of consuming the EP grape fraction may be due to its rich anthocyanin content. They may also be due to other polyphenols including quercetin, which is abundant in table grapes [32]. However, the whole grape powder diet did not have the same positive outcomes as the EP or NEP diets, or as in our previous study [33]. There were several design differences between these studies that may have contributed to these conflicting results. The previous study was shorter (10 versus 16 weeks) and had a different content of fat (i.e., primarily butter fat at 31% kcals versus a combination of butter, lard, shortening, and beef tallow at 44% kcals from fat, respectively) and fiber (50 g versus 40 g cellulose, respectively). The additional 6 weeks in length of the current study may have caused any potential health benefits of the whole grape diet to have diminished.
There may have been a different interaction between the grape powder and the four types of fats in the current study versus the sole fat source (butter) in the previous study, thereby influencing fat absorption [85]. Furthermore, the extraction process used to obtain the EP fraction may have increased the bioaccessibility and subsequent bioavailability of the polyphenols by liberating them from interactions within the grape powder matrix, making them more susceptible to interactions with brush boarder enzymes that enhanced their absorption in the small intestine. Similarly, liberation of the polyphenols may have altered the luminal environment, thereby improving the confluence of beneficial bacteria.
The reduced dietary fiber in the HF diets in the current study may have influenced gut microbiota, as fiber is a primary energy source for a vast majority of microbes in this environment. As such, the reduced fiber may have impacted the production of SCFAs as well as reduce the diversity of the microbiota. Future studies should focus on feeding single anthocyanins and their combinations (i.e., malvidin or peonidin-3-O-glucoside/glucuronide) in conjunction with a HF diet to determine if they are responsible, in part, to the beneficial effects of the EP fraction.
Supplementary Material
Acknowledgments
We would like to thank the California Table Grape Commission for providing the grape powder.
Abbreviations
- Agpat2
acylglycerol-3-phosphate-O-acyltransferase 2
- ANC
anthocyanin
- Atgl
adipose triglyceride lipase
- AUC
area under the curve
- B. wadsworthia
Bilophila wadsworthia
- BWG
body weight gain
- Cd36
cluster of differentiation 36
- Cd11c
cluster of differentiation 11c
- Cpt
carnitine palmitoyltransferase
- Crp
c-reactive protein
- DEXA
dual-energy X-ray
- DMAC
4-dimethylaminocinnamaldehyde
- DP
degree of polymerization
- DBB
Desulfobulbus spp
- DFM
Desulfotomaculum spp
- DSB
Desulfobacter spp
- dsrA-Bw
B. wadsworthia specific dissimilatory sulfite reductase
- DSV
Desulfovibrio spp
- EPI
epididymal
- Erm1 (F4/80 human orthologue)
epidermal growth factor-like module containing mucin-like hormone receptor 1
- EP
extractable polyphenol
- Fas
fatty acid synthase
- Fabp4
fatty acid binding protein 4
- FCE
food conversion efficiency
- Gpat2
glycerol-3-phosphate acyltransferase
- Glp
glucagon-like peptide
- GP
grape powder
- Gpr
G-protein receptor
- GTT
glucose tolerance test
- HF
high fat
- HOMA-IR
homeostasis model assessment method for insulin resistance
- Hsl
hormone sensitive lipase
- ING
inguinal
- IL
interleukin
- LPS
lipopolysaccharide
- LBP
LPS binding protein
- LF
low fat
- Mcp
monocyte chemoattractant protein
- MPO
myeloperoxidase
- NKT
natural killer T
- NEP
non-extractable polyphenol
- NF-κB
nuclear factor kappa B
- OTU
operational taxonomic units
- PAC
proanthocanidin
- PCA
primary component analysis
- Pck
phosphoenolpyruvate carboxykinase
- PPAR
peroxisome proliferator activated receptor
- PAC-A2
procyanidin A2
- Pyy
peptide yy
- Scd1
stearoyl-CoA desaturase 1
- Srebp
sterol regulatory element binding protein
- Tbp
TATA-binding protein (TBP)
- TG
triglyceride
- Tlr4
toll-like receptor 4
- Tnf
tumor necrosis factor
- TFA
trifluoroacetic acid
- TP
Total phenolics
- WAT
white adipose tissue
- ZO-1
zonula occludens-1
Footnotes
No conflicts of interest: Brian Collins, Jessie Hoffman, Kristina Martinez, Mary Grace, Mary Ann Lila, Chia-Chi Chuang, Chase Cockrell, Anuradha Nadimpalli, Eugene Chang, Jessica Mackert, Wan Shen, Paula Cooney, Robin Hopkins, and Michael McIntosh
References
- 1.Ogdan CL, Carroll MD, Kit BK, Flegal KM. Prevalence of Childhood and Adult Obesity in the United States, 2011–2012. JAMA. 2014;311(8):806–814. doi: 10.1001/jama.2014.732. [DOI] [PMC free article] [PubMed] [Google Scholar]
- 2.WHO. Obesity. http://www.who.int/topics/obesity/en/. Viewed April 4, 2014.
- 3.NIH. Obesity. http://www.ncbi.nlm.nih.gov/pubmedhealth/PMH0004552/. Last reviewed: May 12, 2012.
- 4.Strissel KJ, DeFuria J, Shaul ME, Bennett G, Greenberg AS, Obin MS. T-cell recruitment and Th1 polarization in adipose tissue during diet-induced obesity in C57BL/6 mice. Obesity (Silver Spring) 2010;18(10):1918–25. doi: 10.1038/oby.2010.1. [DOI] [PMC free article] [PubMed] [Google Scholar]
- 5.Ding S, Chi M, Scull M, Rigby R, Schwerbrock N, Magness S, et al. High fat diet: bacterial interactions promote intestinal inflammation which precedes and correlates with obesity and insulin resistance in mice. PLOS One. 2010;5:e12191. doi: 10.1371/journal.pone.0012191. [DOI] [PMC free article] [PubMed] [Google Scholar]
- 6.Garrett WS, Lord GM, Punit S, Lugo-Villarino G, Mazmanian SK, Ito S, et al. Communicable ulcerative colitis induced by T-bet deficiency in the innate immune system. Cell. 2007;131(1):33–45. doi: 10.1016/j.cell.2007.08.017. [DOI] [PMC free article] [PubMed] [Google Scholar]
- 7.Cani P, Amar J, Iglesias M, Poggi M, Knauf C, Bastelica D, Neyrinck N, et al. Metabolic endotoxemia initiates obesity and insulin resistance. Diabetes. 2007;56:1761–1772. doi: 10.2337/db06-1491. [DOI] [PubMed] [Google Scholar]
- 8.Cani P, Bibiloni R, Knauf C, Waget A, Neyrinck A, Delzenne N, Burcelin R. Changes in gut microbiota control metabolic endotoxemia-induced inflammation in high-fat diet-induced obesity and diabetes in mice. Diabetes. 2008;57:1470–1481. doi: 10.2337/db07-1403. [DOI] [PubMed] [Google Scholar]
- 9.Delzenne N, Cani P. Gut microbiota and pathogenesis of insulin resistance. Curr Diab Rep. 2011;11:154–159. doi: 10.1007/s11892-011-0191-1. [DOI] [PubMed] [Google Scholar]
- 10.Shen W, Gaskins HR, McIntosh M. Influence of dietary fat on intestinal microbes, inflammation, barrier function, and metabolic outcomes. J Nutr Biochem. 2014;25:270–280. doi: 10.1016/j.jnutbio.2013.09.009. [DOI] [PubMed] [Google Scholar]
- 11.Zhang C, Zhang M, Wang S, Han R, Cao Y, Hua W, et al. Interactions between gut microbiota, host genetics, and diet relevant to development of metabolic syndromes in mice. The ISME Journal. 2010;4:232–241. doi: 10.1038/ismej.2009.112. [DOI] [PubMed] [Google Scholar]
- 12.Shen W, Wolf PG, Carbonero F, Zhong W, Reid T, Gaskins HR, McIntosh MK. Intestinal and systemic inflammatory responses are positively associated with sulfidogenic bacteria abundance in high-fat-fed male C57BL/6J mice. J Nutr. 2014;144(8):1181–1187. doi: 10.3945/jn.114.194332. [DOI] [PubMed] [Google Scholar]
- 13.Devkota S, Wang Y, Musch M, Leone V, Fehlner-Peach Hl, Nadimpalli A, et al. Dietary-fat-induced taurocholic acid promotes pathobiont expansion and colitis in IL10−/− mice. Nature. 2012;487:104–108. doi: 10.1038/nature11225. [DOI] [PMC free article] [PubMed] [Google Scholar]
- 14.Cabonero F, Benefiel AC, Alizadeh-Ghamsari AH, Gaskins HR. Microbial pathways in colonic sulfur metabolism and links with health and disease. Front Physiol. 2012;3:448. doi: 10.3389/fphys.2012.00448. [DOI] [PMC free article] [PubMed] [Google Scholar]
- 15.Rowan FE, Docherty NG, Coffey JC, O’Connell PR. Sulphate-reducing bacteria and hydrogen sulphide in the aetiology of ulcerative colitis. Br J Surg. 2009;96(2):151–158. doi: 10.1002/bjs.6454. [DOI] [PubMed] [Google Scholar]
- 16.Backhed F, Manchester J, Semenkovich C, Gordon J. Mechanisms underlying the resistance to diet-induced obesity in germ-free mice. Proc Nat Acad Sci. 2007;104:979–984. doi: 10.1073/pnas.0605374104. [DOI] [PMC free article] [PubMed] [Google Scholar]
- 17.Delzenne N, Neyrinck A, Backhed F, Cani P. Targeting gut microbiota in obesity: effects of prebiotics and probiotics. Nat Rev Endocrin. 2011;7:639–646. doi: 10.1038/nrendo.2011.126. [DOI] [PubMed] [Google Scholar]
- 18.Delzenne N, Cani P. Interaction between obesity and gut microbiota: relevance to nutrition. Ann Rev Nutr. 2011;31:15–31. doi: 10.1146/annurev-nutr-072610-145146. [DOI] [PubMed] [Google Scholar]
- 19.Delzenne N, Neyrinck A, Cani P. Modulation of the gut microbiota by nutrients with prebiotic properties: consequences for host health in the context of obesity and metabolic syndrome. Microbial Cell Fact. 2011;10:S10. doi: 10.1186/1475-2859-10-S1-S10. [DOI] [PMC free article] [PubMed] [Google Scholar]
- 20.Geurts L, Neyrnick A, Delzenne N, Knaug C, Cani P. Gut microbiota controls adipose tissue expansion, gut barrier and glucose metabolism: novel insights into molecular targets and interventions using prebiotics. Beneficial Microbes. 2014;5:3–17. doi: 10.3920/BM2012.0065. [DOI] [PubMed] [Google Scholar]
- 21.Cani P, Neyrinck N, Fava F, Knauf C, Burcelin R, Tuophy K, et al. Selective increases of bifidobacteria in the gut microbiota improve high-fat-diet induced diabetes in mice through a mechanisms involving endotoxemia. Diabetolgia. 2007;50:2374–2383. doi: 10.1007/s00125-007-0791-0. [DOI] [PubMed] [Google Scholar]
- 22.Dewulf EM, Cani PD, Neyrinck AM, Possemiers S, Holle AV, Muccioli GG, et al. Inulin-type fructans with prebiotic properties counteract grape powderR43 overexpression and PPARgamma-related adipogenesis in the white adipose tissue of high-fat diet-fed mice. J Nut Biochem. 2011;22:712–722. doi: 10.1016/j.jnutbio.2010.05.009. [DOI] [PubMed] [Google Scholar]
- 23.Serino M, Luche E, Gres S, Baylac A, Berge M, Cenac C, et al. Metabolic adaptation to a high-fat diet is associated with a change in the gut microbiota. Gut. 2012;61:543–553. doi: 10.1136/gutjnl-2011-301012. [DOI] [PMC free article] [PubMed] [Google Scholar]
- 24.Keperman R, Bolca S, Roger L, Vaughan E. Novel approaches for analyzing gut microbes and dietary polyphenols: challenges and opportunities. Microbiology. 2010;156:3224–3231. doi: 10.1099/mic.0.042127-0. [DOI] [PubMed] [Google Scholar]
- 25.Neyrinck A, Van Hee V, Bindels L, Possemiers S, de Backer F, Cani P, et al. Polyphenol-rich extract of pomegranate peel alleviates tissue inflammation and hypercholesterolemia in high-fat-induced obese mice: potential implication of the gut microbiota. Br J Nutr. 2013;109:802–809. doi: 10.1017/S0007114512002206. [DOI] [PubMed] [Google Scholar]
- 26.Benn T, Kim B, Park YK, Wegner C, Harness E, Nam TG, et al. Polyphenol-rich blackcurrant extract prevents inflammation in diet-induced obese mice. J Nutr Biochem. 2014;25:1019–1025. doi: 10.1016/j.jnutbio.2014.05.008. [DOI] [PubMed] [Google Scholar]
- 27.Van Duynhoven J, Vaughan E, Jacobs D, Kemperman R, van Velzen E, Gross G, et al. Metabolic fate of polyphenols in the human superorganism. Proc Nat Acad Sci. 2011;108:4531–4538. doi: 10.1073/pnas.1000098107. [DOI] [PMC free article] [PubMed] [Google Scholar]
- 28.Selma M, Espin J, Tomas-Barberan F. Interactions between phenolics and gut microbiota: role in human health. J Agric Food Chem. 2009;57:6485–6501. doi: 10.1021/jf902107d. [DOI] [PubMed] [Google Scholar]
- 29.Chuang CC, McIntosh MK. Potential mechanisms by which polyphenol-rich grapes prevent obesity-mediated inflammation and metabolic diseases. Ann Rev Nutr. 2011;31:155–176. doi: 10.1146/annurev-nutr-072610-145149. [DOI] [PubMed] [Google Scholar]
- 30.Seymour E, Singer A, Bennink M, Parikh R, Kirakosyan A, Kaufman P, Broiling S. Chronic intake of phytochemical-enriched diet reduces cardiac fibrosis and diastolic dysfunction caused by prolonged salt-sensitive hypertension. J Gerontol A Biol Sci Med Sci. 2008;63:1034–1042. doi: 10.1093/gerona/63.10.1034. [DOI] [PMC free article] [PubMed] [Google Scholar]
- 31.Seymour EM, Bennink MR, Watts SW, Bolling SF. Whole grape intake impacts cardiac peroxisome proliferator-activated receptor and nuclear factor kappaB activity and cytokine expression in rats with diastolic dysfunction. Hypertension. 2010;55:1179–85. doi: 10.1161/HYPERTENSIONAHA.109.149393. [DOI] [PMC free article] [PubMed] [Google Scholar]
- 32.Chuang CC, Shen W, Chen H, Xie G, Jia W, Chung S, McIntosh M. Differential effects of grape powder and its extract on glucose tolerance and chronic inflammation in high fat-fed obese mice. J Agric Food Chem. 2012;60:12458–12468. doi: 10.1021/jf3028107. [DOI] [PubMed] [Google Scholar]
- 33.Baldwin J, Collins B, Wolf PG, Martinez K, Shen W, Chuang C-C, et al. Table grape consumption reduces adiposity and markers of hepatic lipogenesis and alters gut microbiota in butter fat-fed mice. J Nutr Biochem. 2015 doi: 10.1016/j.jnutbio.2015.08.027. http://dx.doi.org/10.1016/j.jnutbio.2015.08.027. [DOI] [PMC free article] [PubMed]
- 34.U.S. Department of Agriculture; Agricultural Research Service; Beltsville Human Nutrition Research Center; Food Surveys Research Group (Beltsville MD) and; U.S. Department of Health and Human Services; Centers for Disease Control and Prevention; National Center for Health Statistics (Hyattsville MD) What We Eat in America, NHANES 2011–2012. [Google Scholar]
- 35.Yang J, Hai Liu R, Halim L. Antioxidant and antiproliferative activities of common edible nut seeds. LWT - Food Sci Tech. 2009;42:1–8. [Google Scholar]
- 36.Singleton VL, Orthofer R, Lamuela-Raventos RM. Analysis of total phenols and other oxidation substrates and antioxidants by means of Folin-Ciocalteu reagent. Methods Enzymol. 1999;299:152–178. [Google Scholar]
- 37.Lee J, Durst RW, Wrolstad RE. Determination of total monomeric anthocyanin pigment content of fruit juices, beverages, natural colorants, and wines by the pH differential method: collaborative study. J AOAC Int. 2005;88:1269–1278. [PubMed] [Google Scholar]
- 38.Prior RL, Fan E, Ji H, Howell A, Nio C, Payne MJ, Reed J. Multi-laboratory validation of a standard method for quantifying proanthocyanidins in cranberry powders. J Sci Food Agric. 2010;90:1473–1478. doi: 10.1002/jsfa.3966. [DOI] [PubMed] [Google Scholar]
- 39.Grace MH, Esposito D, Dunlap K, Lila MA. Comparative analysis of phenolic content and profile, antioxidant capacity, and anti-inflammatory bioactivity in wild Alaskan and commercial Vaccinium berries. J Agric Food Chem. 2014;62:4007–4017. doi: 10.1021/jf403810y. [DOI] [PMC free article] [PubMed] [Google Scholar]
- 40.Hintze KJ, Benninghoff AD, Ward RE. Formulation of the Total Western Diet (TWD) as a Basal Diet for Rodent Cancer Studies. J Agric Food Chem. 2012;60:6736–6742. doi: 10.1021/jf204509a. [DOI] [PubMed] [Google Scholar]
- 41.Shen W, Chuang CC, Martinez K, Reid T, Brown JM, Xi L, et al. Conjugated Linoleic Acid Reduces Adiposity and Increases Markers of Browning and Inflammation in White Adipose Tissue of Mice. J Lipid Research. 2013;54:909–922. doi: 10.1194/jlr.M030924. [DOI] [PMC free article] [PubMed] [Google Scholar]
- 42.Kim JJ, Shajib MS, Manocha MM, Khan WI. Investigating intestinal inflammation in DSS-induced model of IBD. J Vis Exp. 2012;60:e3678. doi: 10.3791/3678. [DOI] [PMC free article] [PubMed] [Google Scholar]
- 43.de La Serre CB, Ellis CL, Lee J, Hartman AL, Rutledge JC, Raybould HE. Propensity to high-fat diet-induced obesity in rats is associated with changes in the gut microbiota and gut inflammation. Am J Physiol Gastrointest Liver Physiol. 2010;299:G440–G448. doi: 10.1152/ajpgi.00098.2010. [DOI] [PMC free article] [PubMed] [Google Scholar]
- 44.Renom G, Bulois P, Hafraoui S, Colombel JF, Degand PM. Simple gas chromatography analysis of faecal butyrate: Application to patients at risk of pouchitis. Clin Chem Lab Med. 2001;391:15–19. doi: 10.1515/CCLM.2001.005. [DOI] [PubMed] [Google Scholar]
- 45.Vital M, Penton CR, Wang Q, Young VB, Antonopoulos DA, Sogin ML, Morrison HG, Raffals L, Chang EB, Huffnagle GB, et al. A gene-targeted approach to investigate the intestinal butyrate- producing bacterial community. Microbiome. 2013;1:8–21. doi: 10.1186/2049-2618-1-8. [DOI] [PMC free article] [PubMed] [Google Scholar]
- 46.Louis P, Young P, Holtrop G, Flint HJ. Diversity of human colonic butyrate-producing bacteria revealed by analysis of the butyryl-CoA:acetate CoA-transferase gene. Environ Microbiol. 2010;12:304–314. doi: 10.1111/j.1462-2920.2009.02066.x. [DOI] [PubMed] [Google Scholar]
- 47.Caporaso JG, Kuczynski J, Stombaugh J, et al. QIIME allows analysis of high-throughput community sequencing data. Nat Methods. 2010;7:335–336. doi: 10.1038/nmeth.f.303. [DOI] [PMC free article] [PubMed] [Google Scholar]
- 48.McDonald D, Price MN, Goodrich J, Nawrocki EP, DeSantis TZ, Probst A, Andersen GL, Knight R, Hogenholtz P. An improved Greengenes taxonomy with explicit ranks for ecological and evolutionary analyses of bacteria and archaea. The ISME J. 2012;6:610–618. doi: 10.1038/ismej.2011.139. [DOI] [PMC free article] [PubMed] [Google Scholar]
- 49.Wang Q, Garrity GM, Tiedje JM, Cole JR. Naïve Bayesian Classifier for Rapid Assignment of rRNA Sequences into the New Bacterial Taxonomy. Appl Environ Microbiol. 2007;73:5261–5267. doi: 10.1128/AEM.00062-07. [DOI] [PMC free article] [PubMed] [Google Scholar]
- 50.Price MN, Dehal PS, Arkin AP. FastTree 2 – Approximately Maximum-Likelihood Trees for Large Alignments. PLoS One. 2010;5:e9490. doi: 10.1371/journal.pone.0009490. [DOI] [PMC free article] [PubMed] [Google Scholar]
- 51.Loonen L, Stolte E, Jaklofsky M, Meijerink M, Dekker J, van Baarlen P, Well J. Reg3g-decient mice have alter mucus distribution and increase mucosal inflammatory responses to the microbiota and enteric pathogens in the ileum. Mucosal Immunology. 2014;7:939–948. doi: 10.1038/mi.2013.109. [DOI] [PubMed] [Google Scholar]
- 52.Aitchison J. Principal component analysis of compositional data. Biometrika. 70(1):57–65. 198. [Google Scholar]
- 53.Filzmoser P, Hron K, Reimann C. Principal component analysis for compositional data with outliers. Environmetrics. 2009;20(6):621–632. [Google Scholar]
- 54.He J, Giusti M. Anthocyanins: natural colorants with health-promoting properties. Ann Rev Food Sci Technol. 2010;1:163–187. doi: 10.1146/annurev.food.080708.100754. [DOI] [PubMed] [Google Scholar]
- 55.Gourineni V, Shay NF, Chung S, Sandhu AK, Gu L. Muscadine grape (Vitis rotundifolia) and wine phytochemicals prevented obesity-associated metabolic complications in C57BL/6J mice. J Agric Food Chem. 2012;60(31):7674–81. doi: 10.1021/jf3013663. [DOI] [PubMed] [Google Scholar]
- 56.Terra X, Pallares V, Ardèvol A, Bladré Cinta, Fernández-Larrea J, Pujadas G, et al. Modulatory effect of grape-seed procyanidins on local and systemic inflammation in diet-induced obesity in rats. J Nutr Biochem. 2010;22(4):380–87. doi: 10.1016/j.jnutbio.2010.03.006. [DOI] [PubMed] [Google Scholar]
- 57.Park SH, Park TS, Cha YS. Grape seed extract (Vitis vinifera) partially reverses high fat diet-induced obesity in C57BL/6J mice. Nutr Res Pract. 2008;2(4):227–33. doi: 10.4162/nrp.2008.2.4.227. [DOI] [PMC free article] [PubMed] [Google Scholar]
- 58.Suwannaphet W, Meeprom A, Yibchok-Anun S, Adisakwattana S. Preventive effect of grape seed extract against high-fructose diet-induced insulin resistance and oxidative stress in rats. Food Chem Toxicol. 2010;48(7):1853–7. doi: 10.1016/j.fct.2010.04.021. [DOI] [PubMed] [Google Scholar]
- 59.Kwon SH, Ahn IS, Kim SO, Kong CS, Chung HY, Do MS, Park KY. Anti-obesity and hypolipidemic effects of black soybean anthocyanins. J Med Food. 2007;10(3):552–6. doi: 10.1089/jmf.2006.147. [DOI] [PubMed] [Google Scholar]
- 60.Tsuda T, Horio F, Uchida K, Aoki H, Osawa T. Dietary cyaniding 3-O-beta-D-glucoside-rich purple corn color prevents obesity and ameliorates hyperglycemia in mice. J Nutr. 2003;133(7):2125–30. doi: 10.1093/jn/133.7.2125. [DOI] [PubMed] [Google Scholar]
- 61.Prior RL, Wu X, Gu L, Hager TJ, Hager A, Howard LR. Whole berries versus berry anthocyanins: interactions with dietary fat levels in the C57BL/6J mouse model of obesity. J Agric Food Chem. 2008;56(3):647–53. doi: 10.1021/jf071993o. [DOI] [PubMed] [Google Scholar]
- 62.Seymour EM, Lewis SK, Urcuyo-Llanes DE, Tanone II, Kirakosyan A, Kaufman PB, Bolling SF. Regular tart cherry intake alters abdominal adiposity, adipose gene transcription, and inflammation in obesity-prone rats fed a high fat diet. J Med Food. 2009;12(5):935–42. doi: 10.1089/jmf.2008.0270. [DOI] [PubMed] [Google Scholar]
- 63.Lee B, Lee M, Lefevre M, Kim HR. Anthocyanins inhibit lipogenesis during adipocyte differentiation of 3T3-L1 preadipocytes. Plant Foods Hum Nutr. 2014;69(2):137–141. doi: 10.1007/s11130-014-0407-z. [DOI] [PubMed] [Google Scholar]
- 64.Rojo LE, Ribnicky D, Logendra S, Poulev A, Rojas-Silva P, Kuhn P, et al. In vitro and in vivo anti-diabetic effects of anthocyanins from Maqui Berry (Aristotelia chilensis) Food Chem. 2011;131(2):387–396. doi: 10.1016/j.foodchem.2011.08.066. [DOI] [PMC free article] [PubMed] [Google Scholar]
- 65.Jayaprakasam B, Olson LK, Schutzki RE, Tai MH, Nair MG. Amelioration of obesity and glucose intolerance in high fat fed C57BL/6 mice by anthocyanins and ursolic acid in Cornelian cherry (Cornus mas) J Agric Food Chem. 2006;54(1):243–248. doi: 10.1021/jf0520342. [DOI] [PubMed] [Google Scholar]
- 66.Sasaki R, Nisimura N, Hoshino H, Isa Y, Kadowaki M, Ichi T, et al. Cyanidin 3-glucoside ameliorates hyperglycemia and insulin sensitivity due to downregulation of retinol binding protein 4 expression in diabetic mice. Biochem Pharmacol. 2007;74(11):1619–27. doi: 10.1016/j.bcp.2007.08.008. [DOI] [PubMed] [Google Scholar]
- 67.Shen W, Gaskins HR, McIntosh M. Influence of dietary fat on intestinal microbes, inflammation, barrier function, and metabolic outcomes. J Nutr Biochem. 2014;25:270–280. doi: 10.1016/j.jnutbio.2013.09.009. [DOI] [PubMed] [Google Scholar]
- 68.Goodrich KM, Fundaro G, Griffin LE, Grant A, Hulver MW, Ponder MA, Neilson AP. Chronic admistration of dietary grape seed extract increases colonic expression of gut tight junction protein occludin and reduces fecal calprotectin: a secondary analysis of healthy Wistar Furth rats. Nutr Res. 2012;32:787–794. doi: 10.1016/j.nutres.2012.09.004. [DOI] [PubMed] [Google Scholar]
- 69.Wang YH, Ge B, Yang XL, Zhai J, Yang LN, Wang XX, et al. Pranthocyanidins from grape seed modulates the nuclear factor-kappa B signal transduction pathways in rats with TNBS-induced recurrent ulcerative colitis. Int Immunopharm. 2011;11:1620–1627. doi: 10.1016/j.intimp.2011.05.024. [DOI] [PubMed] [Google Scholar]
- 70.Paiotti AP, Neto RA, Marchi P, Silva RM, Pazine VL, Noguti J, et al. The anti-inflammatory potential of phenolic compounds in grape juice concentrate (G8000™) on 2, 4,6-trinitrobenzene sulphonic acid-induced colitis. Br J Nutr. 2013;110(6):973–80. doi: 10.1017/S000711451300007X. [DOI] [PubMed] [Google Scholar]
- 71.Roopchand DE, Carmody RN, Kuhn P, Moskal K, Rojas-Silva P, Turnbaugh T, Raksin I. Dietary polyphenols promote growth of the gut bacterium Akkermansia muciniphila and attenuate high-fat diet induced metabolic syndrome. Diabetes. 2015;64:2847–2858. doi: 10.2337/db14-1916. [DOI] [PMC free article] [PubMed] [Google Scholar]
- 72.Turnbaugh PJ, Ridaura VK, Faith JJ, Rey FE, Knight R, Gordon JI. The effect of diet on the human gut microbiome: a metagenomic analysis in humanized gnotobiotic mice. Sci Transl Med. 2009;1(6):6ra14. doi: 10.1126/scitranslmed.3000322. [DOI] [PMC free article] [PubMed] [Google Scholar]
- 73.Vrieze A, Van Nood E, Holleman F, Salojarvi J, Kootte RS, Bartelsman JF, et al. Transfer of intestinal microbiota from lean donors increases insulin sensitivity in individuals with metabolic syndrome. Gastroenterology. 2012;143(4):913–6 e7. doi: 10.1053/j.gastro.2012.06.031. [DOI] [PubMed] [Google Scholar]
- 74.Lam YY, Ha CW, Campbell CR, Mitchell AJ, Dinudom A, Oscarsson J, et al. Increased gut permeability and microbiota change associate with mesenteric fat inflammation and metabolic dysfunction in diet-induced obese mice. PLoS One. 2012;7(3):e34233. doi: 10.1371/journal.pone.0034233. [DOI] [PMC free article] [PubMed] [Google Scholar]
- 75.Cani PD, Possemiers S, Van de Wiele T, Guiot Y, Everard A, Rottier O, et al. Changes in gut microbiota control inflammation in obese mice through a mechanism involving GLP-2-driven improvement of gut permeability. Gut. 2009;58:1091–103. doi: 10.1136/gut.2008.165886. [DOI] [PMC free article] [PubMed] [Google Scholar]
- 76.Reybould HE. Gut microbiota, epithelial function and derangements in obesity. J Physiol. 2012;590(3):441–46. doi: 10.1113/jphysiol.2011.222133. [DOI] [PMC free article] [PubMed] [Google Scholar]
- 77.Turnbaugh PJ, Bäckhed F, Fulton L, Gordon JI. Diet-induced obesity is linked to marked but reversible alterations in the mouse distal gut microbiome. Cell Host Microbe. 2008;3:213–23. doi: 10.1016/j.chom.2008.02.015. [DOI] [PMC free article] [PubMed] [Google Scholar]
- 78.Serino M, Luche E, Gres S, Baylac A, Bergé M, Cenac C, Waget A, Klopp P, et al. Metabolic adaptation to a high-fat diet is associated with a change in the gut microbiota. Gut. 2012;61(4):543–53. doi: 10.1136/gutjnl-2011-301012. [DOI] [PMC free article] [PubMed] [Google Scholar]
- 79.Jumpertz R, LED, Turnbaugh P, Trinidad C, Bogardus C, Gordon J, et al. Energy-balance studies reveals associations between gut microbes, caloric load, and nutrient absorption in humans. Am J Clin Nutr. 2011;94:58–65. doi: 10.3945/ajcn.110.010132. [DOI] [PMC free article] [PubMed] [Google Scholar]
- 80.Queipo-Ortuño MI, Boto-Ordóñez M, Murri M, Gomez-Zumaquero JM, Clemente-Postigo M, Estruch R, et al. Influence of red wine polyphenols and ethanol on the gut microbiota ecology and biochemical biomarkers. Am J Clin Nutr. 2012;95:1323–34. doi: 10.3945/ajcn.111.027847. [DOI] [PubMed] [Google Scholar]
- 81.Sembries S, Dongowski G, Mehrlander K, Will F, Dietrich H. Physiological effects of extraction juices from apple, grape, and red beet pomaces in rats. J Agric Food Chem. 2006;54:10269–10280. doi: 10.1021/jf0618168. [DOI] [PubMed] [Google Scholar]
- 82.Bleau C, Karelis AD, St-Pierre DH, Lamontagne L. Crosstalk between intestinal microbiota, adipose tissue and skeletal muscle as an early event in systemic low-grade inflammation and the development of obesity and diabetes. Diabetes Metab Res Rev. 2014 doi: 10.1002/dmrr.2617. E-pub. [DOI] [PubMed] [Google Scholar]
- 83.Hatayama H, Iwashita J, Kuwajima A, Abe T. The short chain fatty acid, butyrate, stimulates MUC2 mucin production in the human colon cancer cell line, LS174T. Biochem Biophys Res Commun. 2007;356(3):599–603. doi: 10.1016/j.bbrc.2007.03.025. [DOI] [PubMed] [Google Scholar]
- 84.Segain JP, Raingeard, de la Blétière D, Bourreille A, Leray V, Gervois N, Rosales C, et al. Butyrate inhibits inflammatory responses through NFkappaB inhibition: implications for Crohn’s disease. Gut. 2000;47(3):397–403. doi: 10.1136/gut.47.3.397. [DOI] [PMC free article] [PubMed] [Google Scholar]
- 85.Ribnicky D, Roopchand D, Oren A, Grace M, Pouleve A, Lila MA, et al. Effects of a high fat meal matrix and protein complexation on the bioaccessibility of blueberry anthocyanins using TNO gastrointestinal model (TIM-1) Food Chem. 2014;142:349–357. doi: 10.1016/j.foodchem.2013.07.073. [DOI] [PMC free article] [PubMed] [Google Scholar]
Associated Data
This section collects any data citations, data availability statements, or supplementary materials included in this article.