Abstract
In this study, gene expression data of osteosarcoma (OSA) were analyzed to identify metastasis-related biological pathways. Four gene expression data sets (GSE21257, GSE9508, GSE49003 and GSE66673) were downloaded from Gene Expression Omnibus (GEO). An analysis of differentially expressed genes (DEGs) was performed using the Significance Analysis of Microarray (SAM) method. Gene expression levels were converted into scores of pathways by the Functional Analysis of Individual Microarray Expression (FAIME) algorithm and the differentially expressed pathways (DEPs) were then disclosed by a t-test. The distinguishing and prediction ability of the DEPs for metastatic and non-metastatic OSA was further confirmed using the principal component analysis (PCA) method and 3 gene expression data sets (GSE9508, GSE49003 and GSE66673) based on the support vector machines (SVM) model. A total of 616 downregulated and 681 upregulated genes were identified in the data set, GSE21257. The DEGs could not be used to distinguish metastatic OSA from non-metastatic OSA, as shown by PCA. Thus, an analysis of DEPs was further performed, resulting in 14 DEPs, such as NRAS signaling, Toll-like receptor (TLR) signaling, matrix metalloproteinase (MMP) regulation of cytokines and tumor necrosis factor receptor-associated factor (TRAF)-mediated interferon regulatory factor 7 (IRF7) activation. Cluster analysis indicated that these pathways could be used to distinguish between metastatic OSA from non-metastatic OSA. The prediction accuracy was 91, 66.7 and 87.5% for the data sets, GSE9508, GSE49003 and GSE66673, respectively. The results of PCA further validated that the DEPs could be used to distinguish metastatic OSA from non-metastatic OSA. On the whole, several DEPs were identified in metastatic OSA compared with non-metastatic OSA. Further studies on these pathways and relevant genes may help to enhance our understanding of the molecular mechanisms underlying metastasis and may thus aid in the development of novel therapies.
Keywords: osteosarcoma, differentially expressed pathways, differentially expressed genes, metastasis
Introduction
Osteosarcoma (OSA) is the most common primary bone tumor in children and young adults, with 7,104 cases identified during 1999–2008 in the US (1). Although there are a variety of chemotherapeutic and radiation treatments, the survival rate has not greatly improved over the past two decades. Approximately 50% of patients undergo fatal lung metastasis at the late stage of the disease (2,3). The early detection of metastasis is rather critical considering there is a great difference in the survival rate between patients with metastatic OSA (10–20%) and non-metastatic OSA (50–78%) (4,5).
Some achievements have been made in unveiling the molecular mechanisms underlying metastasis. For example, ezrin, an actin-cytoskeleton linker protein, is regarded as a metastatic determinant (6); a high expression of ezrin is associated with a poor outcome in patients with OSA (7). Further studies indicated that ezrin may be involved in metastasis by linking F-actin to the cell membrane following phosphorylation at T567 by protein kinase C) (PKC) (8,9). In addition, heparanase (10), phosphatase and tensin homolog (PTEN) (11) and neuro-pilin2 (12) have also been implicated in the metastasis of OSA. Furthermore, microarray technology has also been widely used for the screening a serial of metastasis-related genes in OSA simultaneously by differential analysis (13,14). However, gene expression signatures show a high variability from different data sets and different literatures, which make them difficult to be used to distinguish metastatic from non-metastatic OSA in the clinic.
Considering that proteins cooperate to exert certain biological functions (15), functional term-based analysis may better distinguish metastatic from non-metastatic OSA. In the present study, gene expression levels were converted into scores of biological pathways. Differentially expressed pathways (DEPs) were identified between metastatic and non-metastatic OSA. The ability of the DEPs to distinguish metastatic OSA from non-metastatic OSA was examined using different gene expression data sets.
Data collection methods
Gene expression data
Gene expression data of OSA were downloaded from Gene Expression Omnibus (GEO, http://www.ncbi.nlm.nih.gov/geo) (16). The following criteria were applied to screen out appropriate gene expression data: i) both metastatic and non-metastatic OSA samples were included; ii) >10 samples were included; iii) human samples.
Four data sets were finally included. Data set GSE21257 (17) contained 34 metastatic OSA tissue samples (from 34 patients, 18.1±12.5 years, 9 females and 25 males) and 19 non-metastatic OSA tissue samples (from 19 patients, 19.4±12.2 years, 10 females and 9 males) that were collected with Illumina Human-6 v2.0 Expression BeadChip (Illumina Inc., San Diego, CA, USA). Data set GSE9508 (18) included 21 metastatic OSA tissue samples (from 11 metastatic patients, 10 of which are analyzed in duplicate, 26.2±19.6 years, 8 females and 3 males), 13 non-metastatic OSA tissue samples (from 7 non-metastatic patients, 6 of which are analyzed in duplicate, 16.6±1.9 years, 2 females and 4 males) and 5 normal controls (66.0±12.9 years, 2 females and 3 males) that were collected with Agilent-Whole Human Genome Oligo Microarray G4112A condensed (Agilent Technologies Inc., Santa Clara, CA, USA). Data set GSE49003 contained 6 metastatic OSA cell samples (KHOS and KRIB, each 3) and 6 non-metastatic OSA cell samples (HOS and U2OS, each 3) that were collected by Illumina Human HT-12 V3.0 Expression BeadChip (Illumina Inc.). Data set GSE66673 contained 12 metastatic OSA cell samples [LM5 cells and Ki-ras transformed HOS cells (143B), each 6] and 12 non-metastatic OSA cell samples(SAOS-2 and HOS, each 6) that were collected by Agilent-028004 SurePrint G3 Human GE 8×60K (Agilent Technologies Inc.).
Data pre-processing and differential analysis of GSE21257
According to annotation files, probes were mapped into genes. Probes mapping to the same gene were averaged as the final expression level of the gene (19). Genes with >20% missing values were excluded and others were filled with the average value, as previously described (20).
Following normalization and log2 transformation, differential analysis was performed using the significance analysis of microarray (SAM) method based on the t-test, as previously described (21). This method can reduce the false-positive by adjusting the p-value to the false discovery rate (FDR) by multiple testing. The relative difference d was calculated as follows:
| (Equation 1) |
where d is the relative difference, x1′ and x2′ are average gene expression levels at two different statuses, and s is the variance. Genes with a fold change in expression of >2 and a FDR of <0.05 were considered as the differentially expressed genes (DEGs).
Functional profile establishment
Pathway information was downloaded from MsigDB (www.broad.mit.edu/gsea/msigdb/) (22). Gene expression levels were converted into scores of functional terms (such as pathways) using the Functional Analysis of Individual Microarray Expression (FAIME) algorithm (23). First, gene expression levels were converted into rank-related weights. High expression levels meant high weights:
| (Equation 2) |
where g and s represent gene g and sample s, respectively; rg,s represents the rank of gene g in sample s in ascending order, and |G| represents the total number of genes.
Normalized centroid (NC) is defined as the average weight of a gene set. For a certain functional term Gene Ontology (GO), it has a gene set GOi. For a certain gene g,g∈GOi. G/GOi represents the complementary set of GOi. The NCs for GOi and G/GOi were calculated as follows:
| (Equation 3a) |
| (Eqution 3b) |
The score of the functional term GO in sample s was defined as the difference between the two NCs as follows:
| (Equation 4) |
| (Equation 5) |
where |GOi| represents the total number of genes in the functional term i. G/GOi is the complementary set of GOi. is the score of functional term i in sample s. FPs represents the scores of all functional terms in sample s. All samples (FP1, FP2 … FPn) constitute the functional expression matrix FP.
After the calculation of the functional expression matrix, the t-test was used to screen the DEPs between metastatic and non-metastatic OSA. The p-value was corrected by the Bonferroni method and the adjusted p<0.05 was set as the threshold value.
Prediction of metastasis
A support vector machines (SVM) model was trained with differentially expressed functional terms using function the svm of package e1071 in R (24). The functional expression matrices of data sets GSE9508, GSE49003 and GSE66673 were calculated and the model was then used to predict the metastasis of OSA samples in the 3 data sets. The accuracy (ACC) was calculated as follows:
| (Equation 6) |
where 'TP' (true-positive) represents right prediction, while 'FP' (false-positive) represents wrong prediction.
Principal component analysis (PCA) was performed to confirm the differential functions of the DEGs and DEPs for the metastatic and non-metastatic OSA samples.
Results
Gene expression data
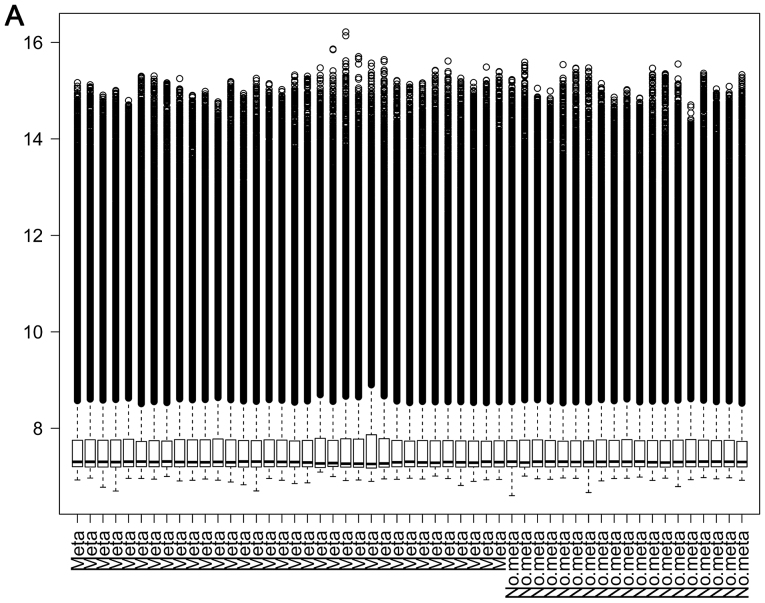
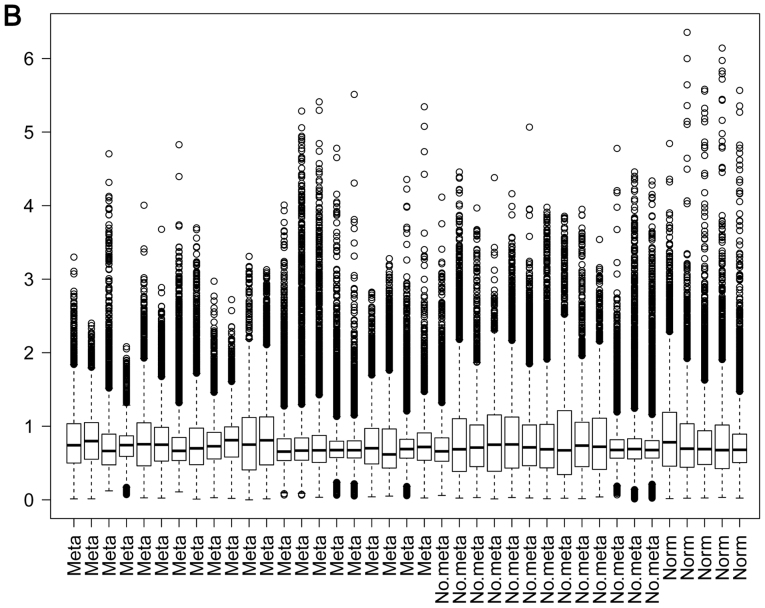
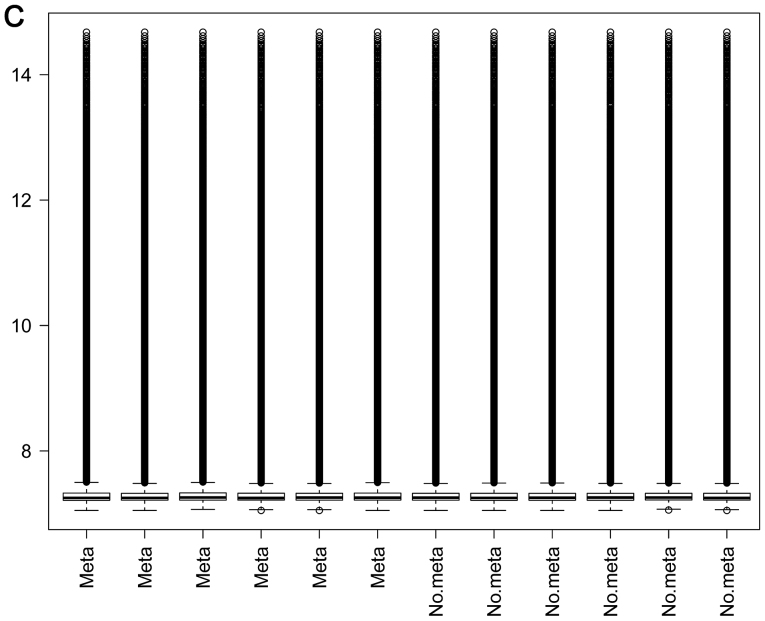
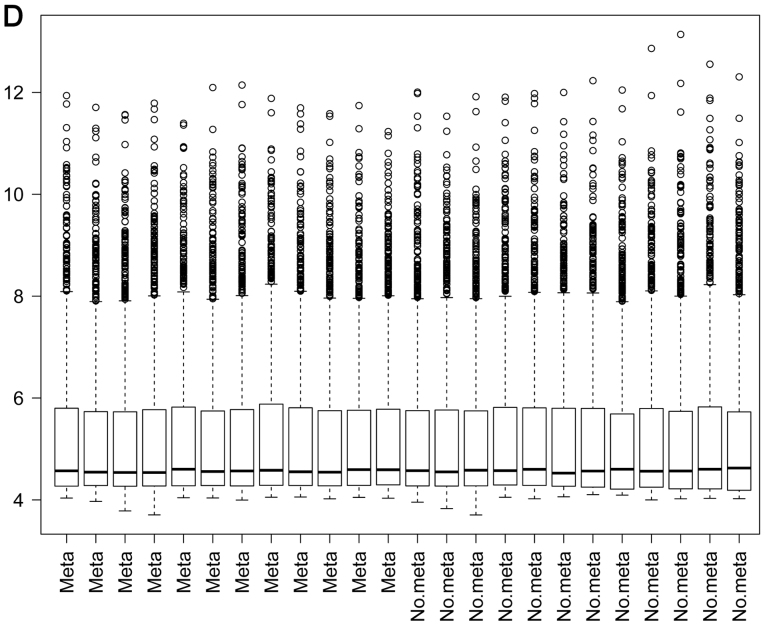
A total of 24,999 genes was identified in data set GSE21275, 3,674 genes in data set GSE9508, 25,159 genes in data set GSE49003 and 18,539 genes in data set GSE66673. The box plots of these 4 data sets are presented in Fig. 1. A good performance of normalization was achieved.
Figure 1.
Box plots of gene expression data from data sets (A) GSE21257 and (B) GSE9508. A good performance of normalization was achieved. Box plots of gene expression data from data sets (C) GSE49003 and (D) GSE66673 (D). A good performance of normalization was achieved.
Identification and biological functions of DEGs
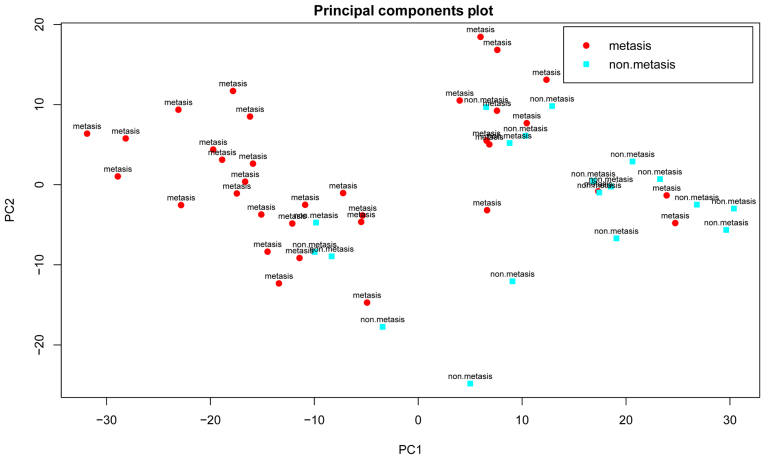
Differential analysis was performed between the metastatic and non-metastatic OSA samples using the SAM method. According to the criteria (fold change >2 and FDR <0.05), a total of 616 down-regulated and 681 upregulated genes were identified in data set GSE21257. However, the results of PCA indicated that the DEGs could not be used to not distinguish the metastatic from non-metastatic OSA samples (Fig. 2), suggesting that other classification features were required.
Figure 2.
Results of principal component analysis (PCA) based upon the 1,297 differentially expressed genes (DEGs). Red circles represent metastatic osteosarcoma (OSA) samples, while blue circles represent non-metastatic OSA samples.
Functional expression matrix and identification of DEGs
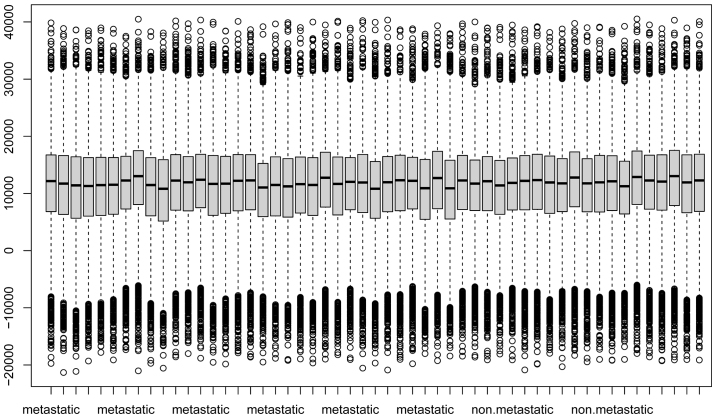
A total of 4,722 pathways (i.e., gene sets) were obtained from MsigDB and 4,721 gene sets which had expression level information for >3 genes were retained. Scores of pathways were calculated for each sample from data set GSE21257 and then a functional expression matrix was obtained. As shown in Fig. 3, a good normalization of pathway scores was achieved, which eliminated the difference in gene expression levels.
Figure 3.
Distribution of F score in the 53 samples of the data set GSE21257.
After t-test analysis and Bonferroni correction, a total of 14 DEPs was revealed (adjusted p-value <0.05) (Table I), such as AML1-MTG8 fusion gene, NRAS signaling, Toll-like receptor (TLR) signaling, matrix metalloproteinase (MMP) regulation of cytokines and tumor necrosis factor receptor-associated factor (TRAF)-mediated interferon regulatory factor 7 (IRF7) activation.
Table I.
Differentially expressed pathways between metastatic and non-metastatic osteosarcoma.
| Pathway term | p-value | Adjusted p-value |
|---|---|---|
| Targets of AML1-MTG8 fusion | 1.18E-06 | 0.006 |
| Leishmania infection | 3.09E-06 | 0.015 |
| NRAS signaling | 3.46E-06 | 0.016 |
| T lymphocyte and NK progenitor | 3.85E-06 | 0.018 |
| Endogenous pathway | 4.63E-06 | 0.022 |
| Liver cancer metastasis | 4.69E-06 | 0.022 |
| Trafficking and processing of endosomal TLR | 5.94E-06 | 0.028 |
| Chronic lymphocytic leukemia | 6.18E-06 | 0.029 |
| TARF6-mediated IRF7 activation in TLR7/8 or 9 signaling | 7.23E-06 | 0.034 |
| Thyroid cancer cluster 4 | 7.31E-06 | 0.035 |
| Tretinoin response | 8.19E-06 | 0.039 |
| NRAS vs. stromal stimulation | 8.61E-06 | 0.041 |
| Aging cerebellum | 8.64E-06 | 0.041 |
| MMP regulation of cytokines | 1.01E-05 | 0.048 |
NK, natural killer; TLR, Toll-like receptor; IRF7, interferon regulatory factor 7; MMP, matrix metalloproteinase.
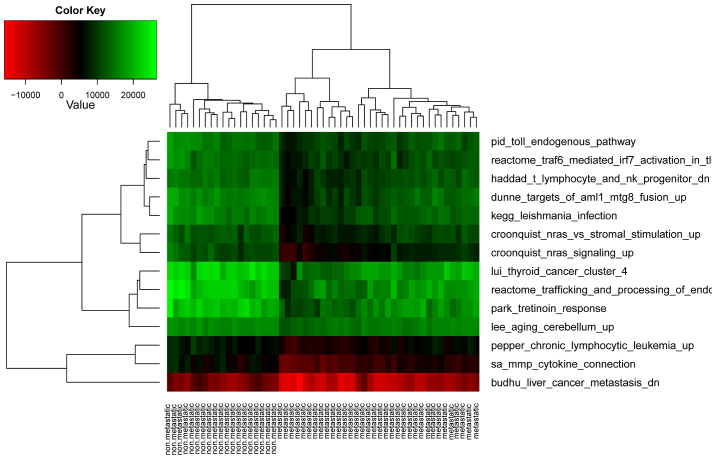
These DEPs contained 400 genes. Compared with the 1,297 DEGs, there were 93 overlapping genes. None of the 14 pathways was significantly over-represented in the 93 DEGs. This finding thus suggested that pathway-based differential analysis was more robust than gene-based analysis at unveiling the molecular mechanisms underlying the metastasis of OSA. As expected, and as shown in Fig. 4, bidirectional hierarchical clustering implied that the metastatic OSA samples were well separated from the non-metastatic OSA samples by these 14 DEPs.
Figure 4.
Results of cluster analysis with the 14 differentially expressed functional terms.
Prediction accuracy
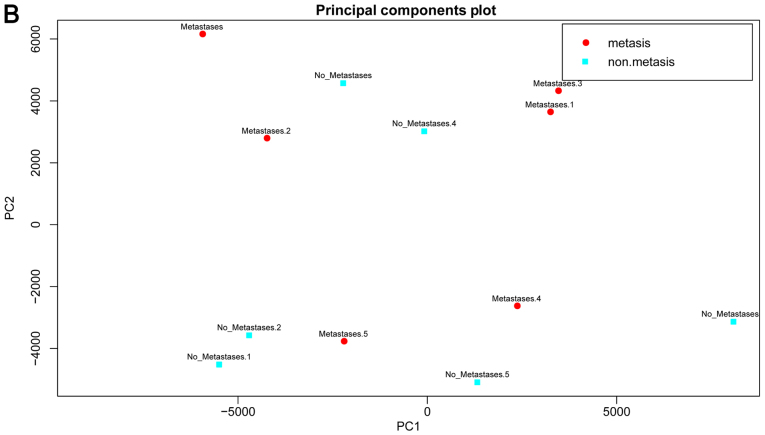
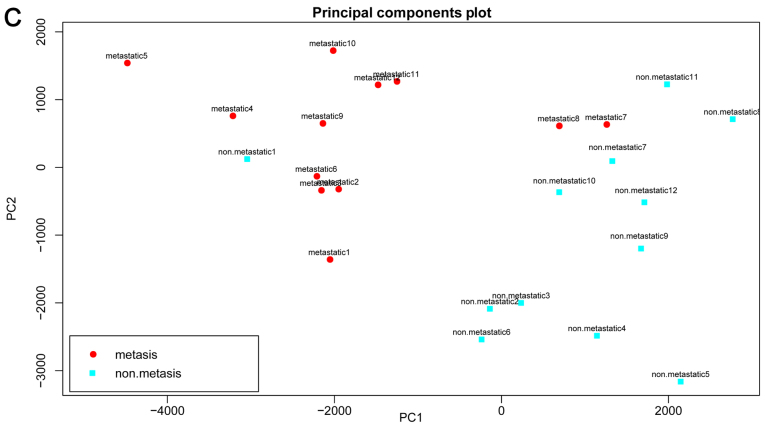
An SVM model was trained with the 14 DEPs. The functional expression matrices of data set GSE9508, GSE49003 and GSE66673 were calculated, and the model was then used to predict the metastasis of OSA samples from these 3 data sets. The accuracy for data set GSE9508 was 91%, that for data set GSE49003 was 66.7% and the accuracy for GSE66673 was 87.5%. The detailed information is listed in Table II.
Table II.
Detailed information of the prediction results.
| Data set | Metastatic samples | Non-metastatic samples | TP/FP for metastatic samples | TP/FP for non-metastatic samples | Accuracy (%) |
|---|---|---|---|---|---|
| GSE9508 | 21 | 13 | 21/0 | 10/3 | 91 |
| GSE49003 | 6 | 6 | 4/2 | 4/2 | 66.7 |
| GSE66673 | 12 | 12 | 10/2 | 11/1 | 87.5 |
TP, true-positive; FP, false-positive.
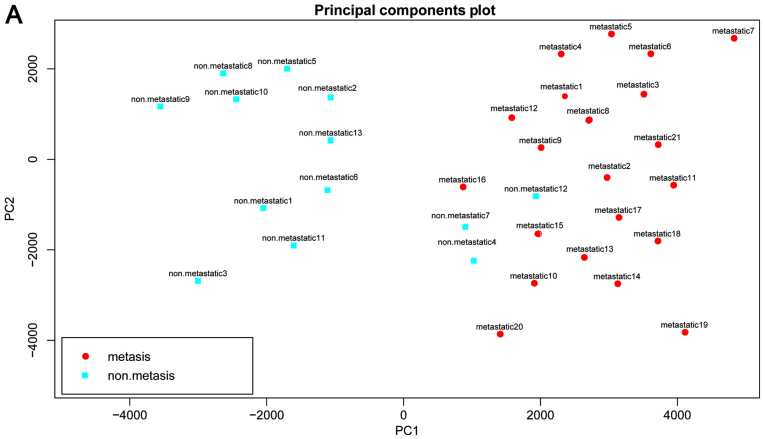
The results of PCA for the 3 data sets are shown in Fig. 5. A good prediction was also achieved with the 14 DEPs, further suggesting the reliability of the DEPs and our method.
Figure 5.
Results of principal component analysis (PCA) based upon the 14 differentially expressed functional terms. (A) GSE9508, (B) GSE49003 and (C) GSE66673. Metastatic osteosarcoma samples are shown in red while non-metastatic osteosarcoma samples are shown in blue.
Discussion
Gene-based differential analysis of gene expression data is a useful method to identify disease-related genes. However, numerous genes are identified in a study and it takes time to further screen out critical genes. Proteins interact with each other to fulfill certain biological functions. Therefore, pathway-based differential analysis could disclose pathways disturbed in disease. In present study, gene expression levels were converted into pathway scores and 14 DEPs were identified in metastatic OSA, such as NRAS signaling, TLR signaling, MMP regulation of cytokines and TRAF-mediated IRF7 activation. Their ability to distinguish metastatic OSA from non-metastatic OSA was proven with 3 different gene expression data sets.
The expression of most TLRs is heterogeneous in OSA cell lines, apart from TLR-2 and TLR-4 (25). The expression levels of TLRs are differentially influenced by p53 and DNA stresses in cancers (26). That is why a pathway-based differential analysis is more robust. A previous study indicated that the expression levels of TLR3, TLR4 and TLR9 have clinical interest as indicators of tumor aggressiveness in breast cancer (27). TLRs also mediate metastasis induced by pancreatic adenocarcinoma upregulated factor (28). The functional expression of TLR9 is related to the metastatic potential of human lung cancer cells (29). Therefore, we speculated that TLR signaling plays a similar role in OSA metastasis and some members of TLRs (such as TLR-7, -8 and -9) may play critical roles in the metastasis.
Several members of TRAFs have been shown to be involved in the growth and invasion of OSA. TRAF6 regulates the proliferation, apoptosis and invasion of OSA cells (30). The knockdown of TRAF4 expression suppresses OSA cell growth in vitro and in vivo (31). The study by Yao et al indicated that TRAF4 can also enhance OSA cell invasion through the AKT signaling pathway (32). IRF7 pathways have also been shown to be involved in metastasis. Bidwell et al reported that the silencing of IRF7 in breast cancer cells promoted bone metastasis through immune escape (33).
MMPs also participate in OSA invasion (34). The effect of S100A4 on metastasis is mediated by MMPs (35). Previous studies have confirmed that MMP-2 and MMP-9 play critical roles in the modulation of metastasis in OSA (36,37). The neuroblastoma RAS viral oncogene homolog (NRAS) mutation status is an independent prognostic factor in metastatic melanoma (38). The loss of NRAS induces the metastatic conversion of Rb1-deficient neuroendocrine thyroid tumors (39). We hypothesized that NRAS signaling plays a similar role in the metastasis of OSA.
Furthermore, immune-related pathways were also differentially expressed in metastatic OSA, including the T lymphocyte and natural killer (NK) progenitor and IRF7 pathway. Immune cells regulate metastatic progression in solid tumors (40). T cell based immune surveillance plays an important role in preventing OSA metastasis (41). NK cells are also involved in metastasis (42,43). The modulation of NK cells may be a method for treating OSA (44).
In conclusion, several DEPs were identified in metastatic OSA. Limited to the disclosed gene expression data sets of OSA, these results warrant further experimental confirmation. However, the accuracy for the prediction of metastasis suggested that the identified pathways are valuable clues. Further studies on these pathways would enhance our understanding of the mechanisms underlying the metastasis of OSA. Potential biomarkers and therapeutic targets may also be identified from these pathways.
References
- 1.Duong LM, Richardson LC. Descriptive epidemiology of malignant primary osteosarcoma using population-based registries, United States, 1999–2008. J Registry Manag. 2013;40:59–64. [PMC free article] [PubMed] [Google Scholar]
- 2.Marina N, Gebhardt M, Teot L, Gorlick R. Biology and therapeutic advances for pediatric osteosarcoma. Oncologist. 2004;9:422–441. doi: 10.1634/theoncologist.9-4-422. [DOI] [PubMed] [Google Scholar]
- 3.Daw NC, Chou AJ, Jaffe N, Rao BN, Billups CA, Rodriguez-Galindo C, Meyers PA, Huh WW. Recurrent osteosarcoma with a single pulmonary metastasis: A multi-institutional review. Br J Cancer. 2012;112:278–282. doi: 10.1038/bjc.2014.585. [DOI] [PMC free article] [PubMed] [Google Scholar]
- 4.Bacci G, Mercuri M, Briccoli A, Ferrari S, Bertoni F, Donati D, Monti C, Zanoni A, Forni C, Manfrini M. Osteogenic sarcoma of the extremity with detectable lung metastases at presentation. Results of treatment of 23 patients with chemotherapy followed by simultaneous resection of primary and metastatic lesions. Cancer. 1997;79:245–254. doi: 10.1002/(SICI)1097-0142(19970115)79:2<245::AID-CNCR7>3.0.CO;2-J. [DOI] [PubMed] [Google Scholar]
- 5.Rasalkar DD, Chu WC, Lee V, Paunipagar BK, Cheng FW, Li CK. Pulmonary metastases in children with osteosarcoma: Characteristics and impact on patient survival. Pediatr Radiol. 2011;41:227–236. doi: 10.1007/s00247-010-1809-1. [DOI] [PubMed] [Google Scholar]
- 6.Ren L, Khanna C. Role of ezrin in osteosarcoma metastasis. Adv Exp Med Biol. 2014;804:181–201. doi: 10.1007/978-3-319-04843-7_10. [DOI] [PubMed] [Google Scholar]
- 7.Xu-Dong S, Zan S, Shui-er Z, Li-na T, Wen-xi Y, Feng L, Yang Y. Expression of Ezrin correlates with lung metastasis in Chinese patients with osteosarcoma. Clin Invest Med. 2009;32:E180–E188. doi: 10.25011/cim.v32i2.6036. [DOI] [PubMed] [Google Scholar]
- 8.Ren L, Hong SH, Cassavaugh J, Osborne T, Chou AJ, Kim SY, Gorlick R, Hewitt SM, Khanna C. The actin-cytoskeleton linker protein ezrin is regulated during osteosarcoma metastasis by PKC. Oncogene. 2009;28:792–802. doi: 10.1038/onc.2008.437. [DOI] [PMC free article] [PubMed] [Google Scholar]
- 9.Ren L, Hong SH, Chen QR, Briggs J, Cassavaugh J, Srinivasan S, Lizardo MM, Mendoza A, Xia AY, Avadhani N, et al. Dysregulation of ezrin phosphorylation prevents metastasis and alters cellular metabolism in osteosarcoma. Cancer Res. 2012;72:1001–1012. doi: 10.1158/0008-5472.CAN-11-0210. [DOI] [PMC free article] [PubMed] [Google Scholar]
- 10.Fan L, Wu Q, Xing X, Liu Y, Shao Z. Targeted silencing of heparanase gene by small interfering RNA inhibits invasiveness and metastasis of osteosarcoma cells. J Huazhong Univ Sci Technolog Med Sci. 2011;31:348–352. doi: 10.1007/s11596-011-0379-2. [DOI] [PubMed] [Google Scholar]
- 11.Hu Y, Xu S, Jin W, Yi Q, Wei W. Effect of the PTEN gene on adhesion, invasion and metastasis of osteosarcoma cells. Oncol Rep. 2014;32:1741–1747. doi: 10.3892/or.2014.3362. [DOI] [PubMed] [Google Scholar]
- 12.Ji T, Guo Y, Lin C, Chen C-F, Zi X, Hoang BH. Neuropilin2 is a novel target gene of Wnt signaling pathway regulating angiogenesis, metastasis and growth of osteosarcoma. Cancer Res. 2014;74(Suppl):4414–4414. doi: 10.1158/1538-7445.AM2014-4414. [DOI] [Google Scholar]
- 13.Diao CY, Guo HB, Ouyang YR, Zhang HC, Liu LH, Bu J, Wang ZH, Xiao T. Screening for metastatic osteosarcoma biomarkers with a DNA microarray. Asian Pac J Cancer Prev. 2014;15:1817–1822. doi: 10.7314/APJCP.2014.15.4.1817. [DOI] [PubMed] [Google Scholar]
- 14.Muff R, Kumar R, Mohan R, Botter SM, Born W, Fuchs B. Genes regulated in metastatic osteosarcoma: Evaluation by microarray analysis in four human and two mouse cell line systems. Sarcoma. 2012;2012:937506. doi: 10.1155/2012/937506. [DOI] [PMC free article] [PubMed] [Google Scholar]
- 15.Wu CJ, Fu Y, Murali TM, Kasif S. Gene expression module discovery using gibbs sampling. Genome informatics. International Conference on Genome Informatics. 2004;15:239–248. [PubMed] [Google Scholar]
- 16.Barrett T, Suzek TO, Troup DB, Wilhite SE, Ngau WC, Ledoux P, Rudnev D, Lash AE, Fujibuchi W, Edgar R. NCBI GEO: Mining millions of expression profiles - database and tools. Nucleic Acids Res. 2005;33:D562–D566. doi: 10.1093/nar/gki022. [DOI] [PMC free article] [PubMed] [Google Scholar]
- 17.Buddingh EP, Kuijjer ML, Duim RA, Bürger H, Agelopoulos K, Myklebost O, Serra M, Mertens F, Hogendoorn PC, Lankester AC, et al. Tumor-infiltrating macrophages are associated with metastasis suppression in high-grade osteosarcoma: A rationale for treatment with macrophage activating agents. Clin Cancer Res. 2011;17:2110–2119. doi: 10.1158/1078-0432.CCR-10-2047. [DOI] [PubMed] [Google Scholar]
- 18.Endo-Munoz L, Cumming A, Rickwood D, Wilson D, Cueva C, Ng C, Strutton G, Cassady AI, Evdokiou A, Sommerville S, et al. Loss of osteoclasts contributes to development of osteosarcoma pulmonary metastases. Cancer Res. 2010;70:7063–7072. doi: 10.1158/0008-5472.CAN-09-4291. [DOI] [PubMed] [Google Scholar]
- 19.Qin S, Kim J, Arafat D, Gibson G. Effect of normalization on statistical and biological interpretation of gene expression profiles. Front Genet. 2013;3:160. doi: 10.3389/fgene.2012.00160. [DOI] [PMC free article] [PubMed] [Google Scholar]
- 20.Liew AW, Law NF, Yan H. Missing value imputation for gene expression data: Computational techniques to recover missing data from available information. Brief Bioinform. 2011;12:498–513. doi: 10.1093/bib/bbq080. [DOI] [PubMed] [Google Scholar]
- 21.Tusher VG, Tibshirani R, Chu G. Significance analysis of microarrays applied to the ionizing radiation response. Proc Natl Acad Sci USA. 2001;98:5116–5121. doi: 10.1073/pnas.091062498. [DOI] [PMC free article] [PubMed] [Google Scholar]
- 22.Liberzon A, Subramanian A, Pinchback R, Thorvaldsdóttir H, Tamayo P, Mesirov JP. Molecular signatures database (MSigDB) 3.0. Bioinformatics. 2011;27:1739–1740. doi: 10.1093/bioinformatics/btr260. [DOI] [PMC free article] [PubMed] [Google Scholar]
- 23.Yang X, Regan K, Huang Y, Zhang Q, Li J, Seiwert TY, Cohen EE, Xing HR, Lussier YA. Single sample expression-anchored mechanisms predict survival in head and neck cancer. PLOS Comput Biol. 2012;8:e1002350. doi: 10.1371/journal.pcbi.1002350. [DOI] [PMC free article] [PubMed] [Google Scholar]
- 24.Karatzoglou A, Meyer D, Hornik K. Support vector machines in R. J Stat Softw. 2005;15:1–28. [Google Scholar]
- 25.Wang ZJ, Zhang K, Yu F. Toll-like receptor expression in osteosarcoma and neuroblastoma. J Clin Oncol. 2010;28(Suppl 15):e20006. [Google Scholar]
- 26.Shatz M, Menendez D, Resnick MA. The human TLR innate immune gene family is differentially influenced by DNA stress and p53 status in cancer cells. Cancer Res. 2012;72:3948–3957. doi: 10.1158/0008-5472.CAN-11-4134. [DOI] [PMC free article] [PubMed] [Google Scholar]
- 27.González-Reyes S, Marín L, González L, González LO, del Casar JM, Lamelas ML, González-Quintana JM, Vizoso FJ. Study of TLR3, TLR4 and TLR9 in breast carcinomas and their association with metastasis. BMC Cancer. 2010;10:665. doi: 10.1186/1471-2407-10-665. [DOI] [PMC free article] [PubMed] [Google Scholar]
- 28.Park HD, Lee Y, Oh YK, Jung JG, Park YW, Myung K, Kim KH, Koh SS, Lim DS. Pancreatic adenocarcinoma upregulated factor promotes metastasis by regulating TLR/CXCR4 activation. Oncogene. 2011;30:201–211. doi: 10.1038/onc.2010.401. [DOI] [PMC free article] [PubMed] [Google Scholar]
- 29.Ren T, Wen ZK, Liu ZM, Liang YJ, Guo ZL, Xu L. Functional expression of TLR9 is associated to the metastatic potential of human lung cancer cell: Functional active role of TLR9 on tumor metastasis. Cancer Biol Ther. 2007;6:1704–1709. doi: 10.4161/cbt.6.11.4826. [DOI] [PubMed] [Google Scholar]
- 30.Meng Q, Zheng M, Liu H, Song C, Zhang W, Yan J, Qin L, Liu X. TRAF6 regulates proliferation, apoptosis, and invasion of osteosarcoma cell. Mol Cell Biochem. 2012;371:177–186. doi: 10.1007/s11010-012-1434-4. [DOI] [PubMed] [Google Scholar]
- 31.Yao W, Wang X, Cai Q, Gao S, Wang J, Zhang P. Knockdown of TRAF4 expression suppresses osteosarcoma cell growth in vitro and in vivo. Int J Mol Med. 2014;34:1655–1660. doi: 10.3892/ijmm.2014.1948. [DOI] [PubMed] [Google Scholar]
- 32.Yao W, Wang X, Cai Q, Gao S, Wang J, Zhang P. TRAF4 enhances osteosarcoma cell proliferation and invasion by Akt signaling pathway. Oncol Res. 2014;22:21–28. doi: 10.3727/096504014X14077751730351. [DOI] [PMC free article] [PubMed] [Google Scholar]
- 33.Bidwell BN, Slaney CY, Withana NP, Forster S, Cao Y, Loi S, Andrews D, Mikeska T, Mangan NE, Samarajiwa SA, et al. Silencing of Irf7 pathways in breast cancer cells promotes bone metastasis through immune escape. Nat Med. 2012;18:1224–1231. doi: 10.1038/nm.2830. [DOI] [PubMed] [Google Scholar]
- 34.Bjørnland K, Flatmark K, Pettersen S, Aaasen AO, Fodstad O, Maelandsmo GM. Matrix metalloproteinases participate in osteosarcoma invasion. J Surg Res. 2005;127:151–156. doi: 10.1016/j.jss.2004.12.016. [DOI] [PubMed] [Google Scholar]
- 35.Bjørnland K, Winberg JO, Odegaard OT, Hovig E, Loennechen T, Aasen AO, Fodstad O, Maelandsmo GM. S100A4 involvement in metastasis: Deregulation of matrix metalloproteinases and tissue inhibitors of matrix metalloproteinases in osteosarcoma cells transfected with an anti-S100A4 ribozyme. Cancer Res. 1999;59:4702–4708. [PubMed] [Google Scholar]
- 36.Cho HJ, Lee TS, Park JB, Park KK, Choe JY, Sin DI, Park YY, Moon YS, Lee KG, Yeo JH, et al. Disulfiram suppresses invasive ability of osteosarcoma cells via the inhibition of MMP-2 and MMP-9 expression. J Biochem Mol Biol. 2007;40:1069–1076. doi: 10.5483/BMBRep.2007.40.6.1069. [DOI] [PubMed] [Google Scholar]
- 37.Kido A, Tsutsumi M, Iki K, Takahama M, Tsujiuchi T, Morishita T, Tamai S, Konishi Y. Overexpression of matrix metalloproteinase (MMP)-9 correlates with metastatic potency of spontaneous and 4-hydroxyaminoquinoline 1-oxide (4-HAQO)-induced transplantable osteosarcomas in rats. Cancer Lett. 1999;137:209–216. doi: 10.1016/S0304-3835(98)00368-1. [DOI] [PubMed] [Google Scholar]
- 38.Jakob JA, Bassett RL, Jr, Ng CS, Curry JL, Joseph RW, Alvarado GC, Rohlfs ML, Richard J, Gershenwald JE, Kim KB, et al. NRAS mutation status is an independent prognostic factor in metastatic melanoma. Cancer. 2012;118:4014–4023. doi: 10.1002/cncr.26724. [DOI] [PMC free article] [PubMed] [Google Scholar]
- 39.Takahashi C, Contreras B, Iwanaga T, Takegami Y, Bakker A, Bronson RT, Noda M, Loda M, Hunt JL, Ewen ME. Nras loss induces metastatic conversion of Rb1-deficient neuroendocrine thyroid tumor. Nat Genet. 2006;38:118–123. doi: 10.1038/ng1703. [DOI] [PubMed] [Google Scholar]
- 40.DeNardo DG, Johansson M, Coussens LM. Immune cells as mediators of solid tumor metastasis. Cancer Metastasis Rev. 2008;27:11–18. doi: 10.1007/s10555-007-9100-0. [DOI] [PubMed] [Google Scholar]
- 41.Merchant MS, Melchionda F, Sinha M, Khanna C, Helman L, Mackall CL. Immune reconstitution prevents metastatic recurrence of murine osteosarcoma. Cancer Immunol Immunother. 2007;56:1037–1046. doi: 10.1007/s00262-006-0257-0. [DOI] [PMC free article] [PubMed] [Google Scholar]
- 42.Zheng LM, Ojcius DM, Garaud F, Roth C, Maxwell E, Li Z, Rong H, Chen J, Wang XY, Catino JJ, et al. Interleukin-10 inhibits tumor metastasis through an NK cell-dependent mechanism. J Exp Med. 1996;184:579–584. doi: 10.1084/jem.184.2.579. [DOI] [PMC free article] [PubMed] [Google Scholar]
- 43.Kodama T, Takeda K, Shimozato O, Hayakawa Y, Atsuta M, Kobayashi K, Ito M, Yagita H, Okumura K. Perforin-dependent NK cell cytotoxicity is sufficient for anti-metastatic effect of IL-12. Eur J Immunol. 1999;29:1390–1396. doi: 10.1002/(SICI)1521-4141(199904)29:04<1390::AID-IMMU1390>3.0.CO;2-C. [DOI] [PubMed] [Google Scholar]
- 44.Pahl JH, Ruslan SEN, Buddingh EP, Santos SJ, Szuhai K, Serra M, Gelderblom H, Hogendoorn PC, Egeler RM, Schilham MW, et al. Anti-EGFR antibody cetuximab enhances the cytolytic activity of natural killer cells toward osteosarcoma. Clin Cancer Res. 2012;18:432–441. doi: 10.1158/1078-0432.CCR-11-2277. [DOI] [PubMed] [Google Scholar]


