Abstract
The development of targeted anti-cancer therapies through the study of cancer genomes is intended to increase survival rates and decrease treatment-related toxicity. We treated a transposon–driven, functional genomic mouse model of medulloblastoma with ‘humanized’ in vivo therapy (microneurosurgical tumour resection followed by multi-fractionated, image-guided radiotherapy). Genetic events in recurrent murine medulloblastoma exhibit a very poor overlap with those in matched murine diagnostic samples (<5%). Whole-genome sequencing of 33 pairs of human diagnostic and post-therapy medulloblastomas demonstrated substantial genetic divergence of the dominant clone after therapy (<12% diagnostic events were retained at recurrence). In both mice and humans, the dominant clone at recurrence arose through clonal selection of a pre-existing minor clone present at diagnosis. Targeted therapy is unlikely to be effective in the absence of the target, therefore our results offer a simple, proximal, and remediable explanation for the failure of prior clinical trials of targeted therapy.
Extensive efforts to understand the molecular underpinnings of medulloblastoma1–7 are driven by the desire to develop rational, targeted therapies that will increase survival rates, and diminish the considerable complications of radiotherapy and cytotoxic chemotherapy8. The development of targeted therapy for medulloblastoma has been hampered by the relative paucity of somatic single nucleotide variants (SNV), the low tumour incidence compared to adult epithelial malignancies, and the existence of four distinct molecular subgroups (Shh, Wnt, Group 3, and Group 4)9,10. The common practice in paediatric oncology is for novel agents to be tested in phase I and/or phase II trials that enroll children previously treated with radiotherapy and cytotoxic chemotherapy. The majority of basic and translational research on the biology of medulloblastoma makes use of samples or models of medulloblastoma that have not been exposed to prior anti-tumour therapies. There are very few genomic studies on recurrent medulloblastoma, as recurrent disease is nearly universally fatal, and surgery at the time of recurrence is associated with significant morbidity and discomfort11. The current clinical pathway in which new agents are tested at recurrence is therefore based on the unsubstantiated premise that the recurrent tumour is biologically and genetically highly similar to the tumour at diagnosis, and therefore well represented by tumour models derived from pre-treatment tissue samples.
Recent genomic approaches in liquid cancers (frequently re-biopsied) have suggested that the tumour genome at the time of recurrence is divergent from the genome at diagnosis12–17, as seen in some solid cancers18–20. Critical and careful examination of human cancer xenografts clearly demonstrates clonal evolution21–23, even in the absence of therapy. Almost all medulloblastoma research to evaluate novel agents has been carried out with cell lines or xenografts derived from naive biopsies, or mouse models in which the experimental therapy is provided at diagnosis (not after standard therapy). Successful phase I or phase II trials of novel agents are uncommon in paediatric oncology, particularly for targeted agents, and almost completely non-existent for medulloblastoma. We hypothesized that recurrent medulloblastoma is highly genetically divergent from patient matched pre-therapy disease, current experimental models fail to model recurrent disease, and that genetic divergence with loss of targets at recurrence could account for the lack of success seen in clinical trials.
A mouse model of recurrent Shh meduloblastoma
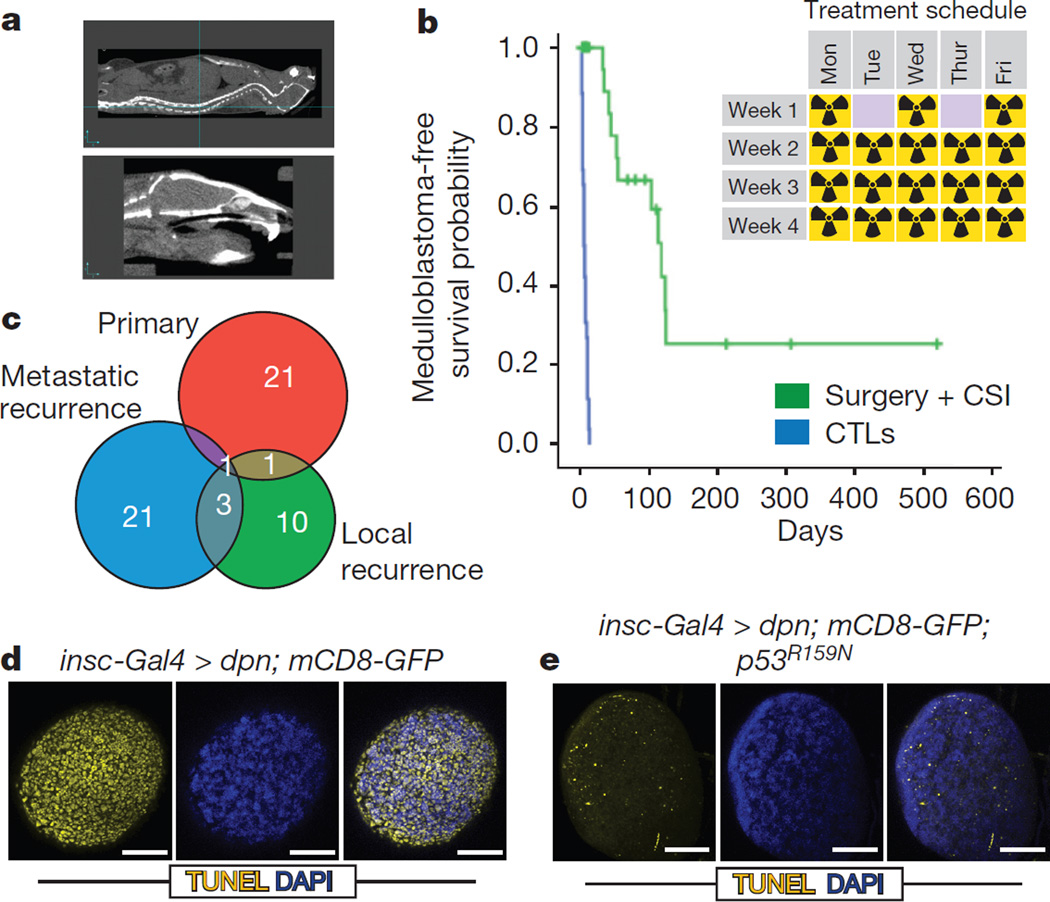
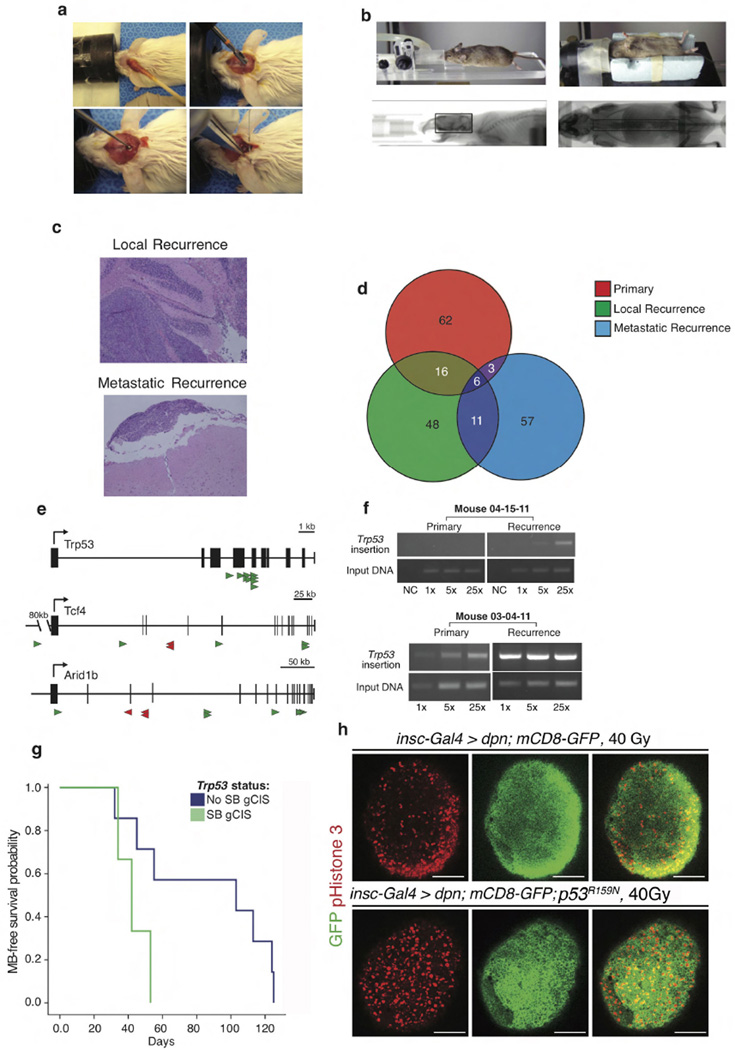
To develop an in vivo, functional genomic, ‘humanized’ mouse model of recurrent medulloblastoma we studied Ptch+/− mice that have transposition of the Sleeping Beauty (SB) transposon in the Math1 compartment of the developing cerebellum (Ptch+/−/Math1-SB11/T2Onc or T2Onc2). These mice have a high penetrance and short latency to develop metastatic sonic hedgehog (Shh) medulloblastoma7,24. To accurately model recurrent medulloblastoma, we performed subtotal tumour removal for 38 Ptch+/−/Math1-SB11/T2Onc or T2Onc2 mice. (Extended Data Fig. 1a). Standard therapy for children with metastatic medulloblastoma includes multi-fractionated image guided craniospinal irradiation (CSI) to 36 Gy over four weeks. After surgery, mice received 18 fractions (2 Gy each) of CSI over four weeks. To selectively target the central nervous system (CNS) and to spare targeting non-CNS tissues, we used two-dimensional (2D) fluoroscopic images (Extended Data Fig. 1b) and three-dimensional (3D) volumetric conebeam CT (computed tomography) images (Fig. 1a). After completion of therapy, mice were monitored for tumour recurrence. The combination of microsurgical resection followed by image guided fractionated CSI allows us to accurately mimic the therapy given to children with medulloblastoma. Using an intent-to-treat analysis, mice treated with surgery and CSI have an increased medulloblastoma-free survival compared to untreated controls (Fig. 1b), median survival is 118 days for the treated group, and 5 days for the control group. However, 11/18 (61%) of treated mice developed local and/or metastatic relapse (Extended Data Fig. 1c).
Figure 1. A novel functional genomic mouse model of recurrent Shh medulloblastoma using microneurosurgical resection and computed-tomography-guided multi-fractionated craniospinal radiotherapy.
a, Ptch+/−/Math1-SB11/T2Onc mice with medulloblastoma underwent subtotal tumour removal (n = 38) and received multi-fractionated CSI post-operatively. Radiation was delivered under computed tomography (CT) guidance. b, Microneurosurgery and CSI strikingly improves tumour-free survival as compared to untreated controls (P = 0.0001, log-rank test, n = 64). Inset schematic indicates the fractionation schedule. c, Venn diagrams demonstrate the paucity of overlap in the gCISs between primary tumours and their recurrences. d, Drosophila brain tumours harbouring wild-type P53 displayed massive apoptosis in response to 40 Gy irradiation. e, Dominant negative P53 (p53R159N) essentially abrogated the radiation-dependent cell death. Scale bar, 50 µm.
Genetic divergence in recurrent mouse medulloblastoma
Massively parallel sequencing of transposon insertions analysed using a significant recurrence method identified 23 gCISs (genic Common Insertion Sites) (Supplementary Table 1a) in 11 primary tumours, and 40 gCISs from the local and metastatic recurrences7,25. gCISs in the diagnostic samples are extremely different from those at recurrence (Fig. 1c), with only the known medulloblastoma tumour suppressor gene CBP (also known as CREBBP) found across all compartments, and only Trp53, Arid1b, and Tcf4 identified in both recurrent compartments (Supplementary Table 1a). We also developed a complementary computational method based on the concept that tumour cell doublings will produce a characteristic pattern of Sleeping Beauty insertion site frequency, with driver-initiating insertions being most frequent. Results from this strategy predict driver events that show a cancer pathway enrichment, replicate the lack of overlap between events important for primary tumorigenesis versus those at recurrence, and identify loss of function of Trp53 as a key event in the pathogenesis of recurrence (Supplementary Table 1b and Supplementary Note).
Clonal transposon insertions in Trp53, Arid1b and Tcf4 are distributed across the coding region of genes and are predicted to result in loss of function (Extended Data Fig. 1e)26,27. End-point PCR for Trp53 insertions shows that they are highly clonal in the recurrences, and either absent or present in a subclone of the matched primary tumours (Extended Data Fig. 1f). Similarly, driver events predicted by our complementary computational method that are clonally prominent at diagnosis are reduced at recurrence, while events prominent at recurrence are not seen at diagnosis (Supplementary Table 1c). We conclude that medulloblastoma recurrences have undergone substantial genetic divergence, possibly due to clonal selection secondary to surgery and radiation.
Humans with germline mutations in TP53 develop Li-Fraumeni syndrome and are at increased risk of developing medulloblastoma. Somatic mutations of TP53 are also found in sporadic human medulloblastomas28. Human Shh medulloblastomas with mutations in TP53 are almost always fatal, as they fail to respond to current therapies including radiation28. Similarly, we find that animals whose recurrence contains a clonally selected Trp53 insertion (gCIS), exhibit a worse prognosis (Extended Data Fig. 1g). In our model, driver Trp53 insertions are not clonal at diagnosis, but become clonal at recurrence (Supplementary Table 1c). We observe decreased expression of the TP53 transcriptional target p21 in recurrent medulloblastomas with gCIS in Trp53, indicating loss of function (Extended Data Fig. 2a). To further demonstrate the consequence of defective p53 signalling on the therapeutic outcome after radiation in vivo, we studied a Drosophila neuronal brain tumour model, in which we expressed the oncogene dpn using insc-Gal4 in the neural stem cell lineage29. Treating the third instar larvae bearing brain tumours with 40 Gy irradiation resulted in widespread apoptosis in the brain lobes (Fig. 1d, e). Strikingly, expressing a dominant negative form of the Drosophila p53, p53R159N (ref. 30), essentially abrogated this radiation-induced cell death response (Fig. 1d, e), while moderately increasing the level of mitosis (Extended Data Fig. 1h).
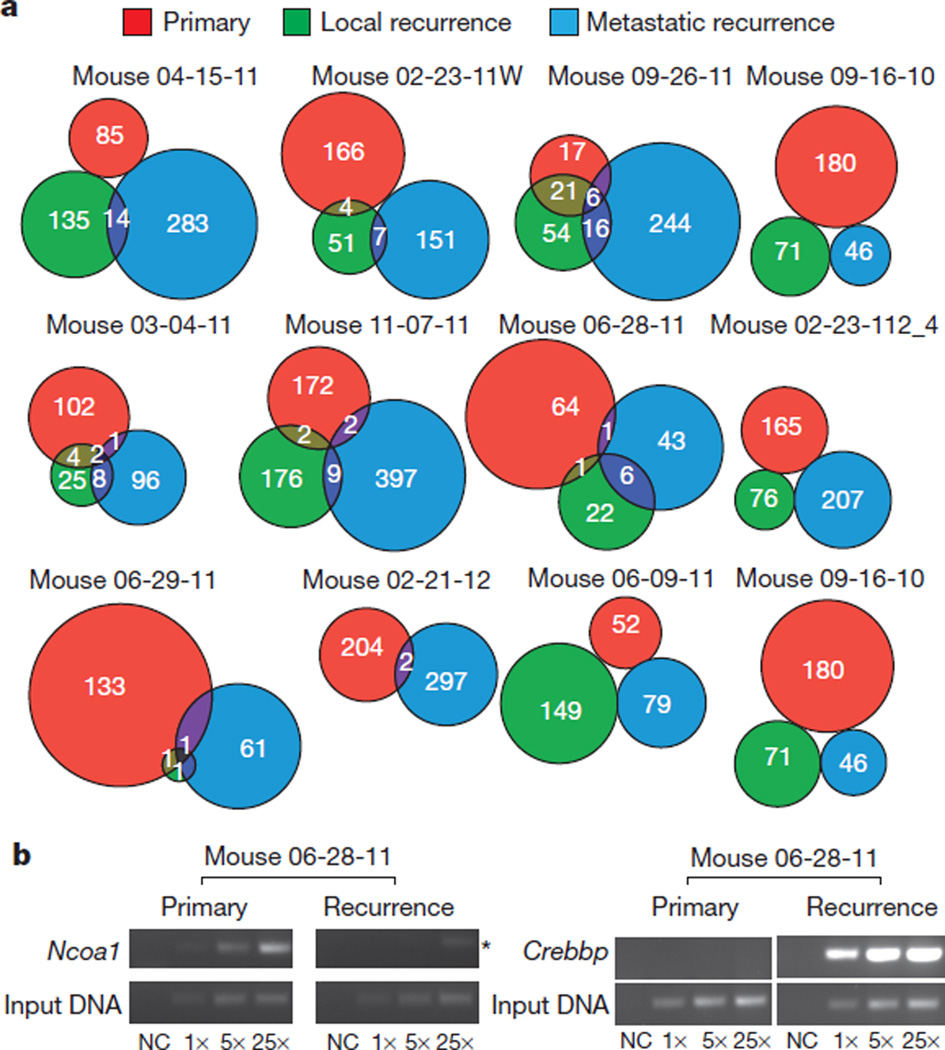
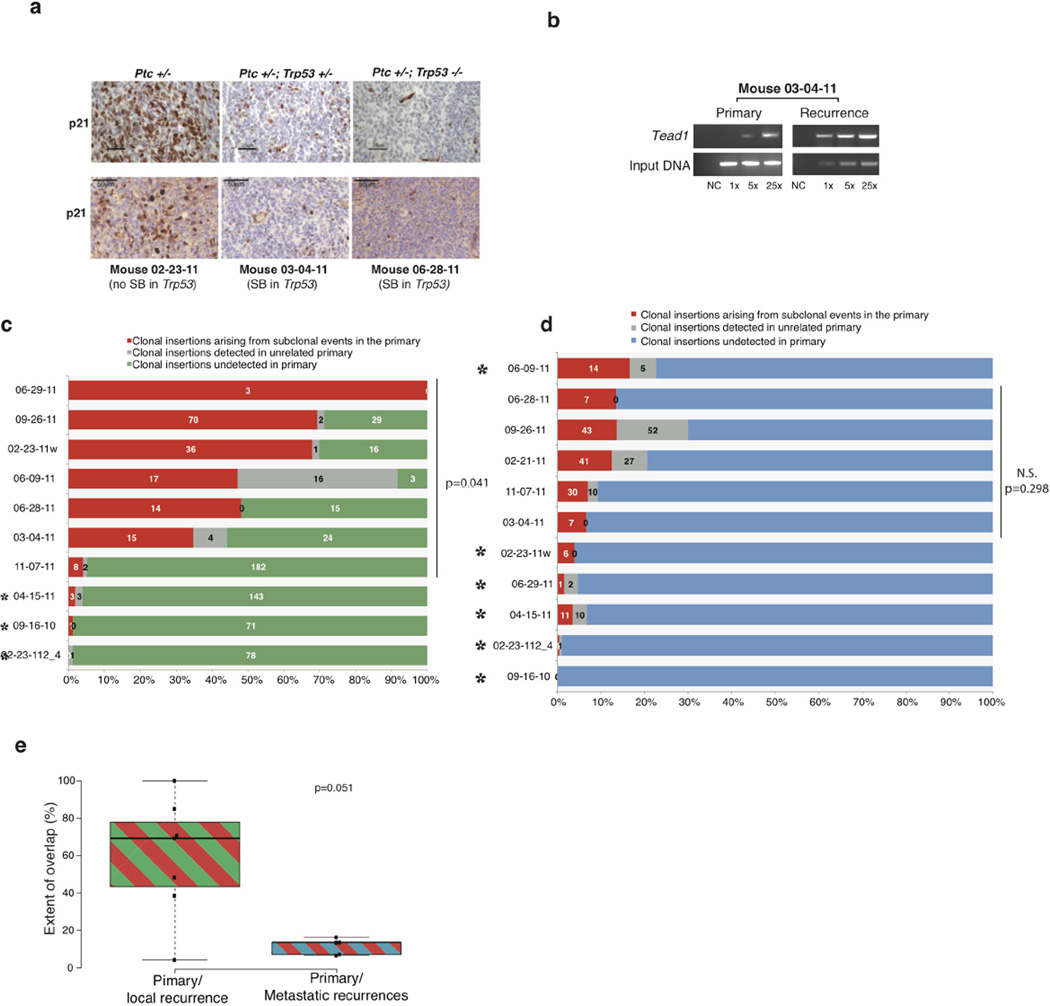
Examination of the transposon insertion patterns in each compartment by animal (Fig. 2a) confirms the paucity of overlap in clonal genetic events between matched diagnostic and recurrent tumours. Although some insertions that assume clonal dominance at recurrence probably arise due to selection, others are true de novo insertions not found in the primary tumour (Fig. 2b and Extended Data Fig. 2b). Many other clonal insertions in the recurrence are indeed found in very restricted subclones of their matching primary tumour (Extended Data Fig. 2c–e). We used pathway analysis to compare the driver events present in the diagnostic samples versus the local recurrent samples. Initiating driver insertions were enriched in the Shh signalling pathway at diagnosis, but not at recurrence. Conversely, the locally recurrent samples had over-representation of insertions in the TP53 pathway, as well as in genes important in the DNA damage response that were not seen at diagnosis (Supplementary Table 1d). We conclude that in our mouse model of recurrent Shh medulloblastoma, the recurrent tumour has undergone a major change in its biology through a process of clonal selection, and that most targets identified in the diagnostic sample are unlikely to be present in the dominant clone at the time of recurrence.
Figure 2. Paucity of shared genetic events between therapy-naive and recurrent tumours in individual mice treated with microneurosurgery and CT-guided multifractionated craniospinal radiation.
a, Venn diagrams demonstrate the paucity of clonal insertions shared between therapy-naive primary tumours and their matched local and metastatic recurrences. Matched recurrences share only very few clonal transposon insertions with the paired primary tumour. b, End-point PCR demonstrates examples of highly clonal insertions that are restricted to the untreated primary (Ncoa1) and the recurrence (Crebbp), (asterisk indicates non-specific amplification). Three levels of input DNA were used for each sample 1×, 5× and 25×; NC, negative control.
Genetic divergence in recurrent human medulloblastoma
To validate our mouse model of recurrent medulloblastoma, we collected therapy-naive primary human medulloblastoma samples and patient-matched recurrent tumours (after radiation and chemotherapy, or radiation alone). Therapy-naive and recurrent medulloblastoma tumour pairs with (n = 15) and without (n = 18) matched germline DNA were profiled by whole-genome sequencing (WGS). An additional 10 recurrent tumours with matching germline also underwent WGS (no pre-therapy biopsy available). Three additional therapy-naive tumours with matching recurrences were also profiled from formalin fixed paraformaldehyde embedded (FFPE) material using whole-exome sequencing (WES), for a total of 46 patient samples (Supplementary Table 2a, b, g, h).
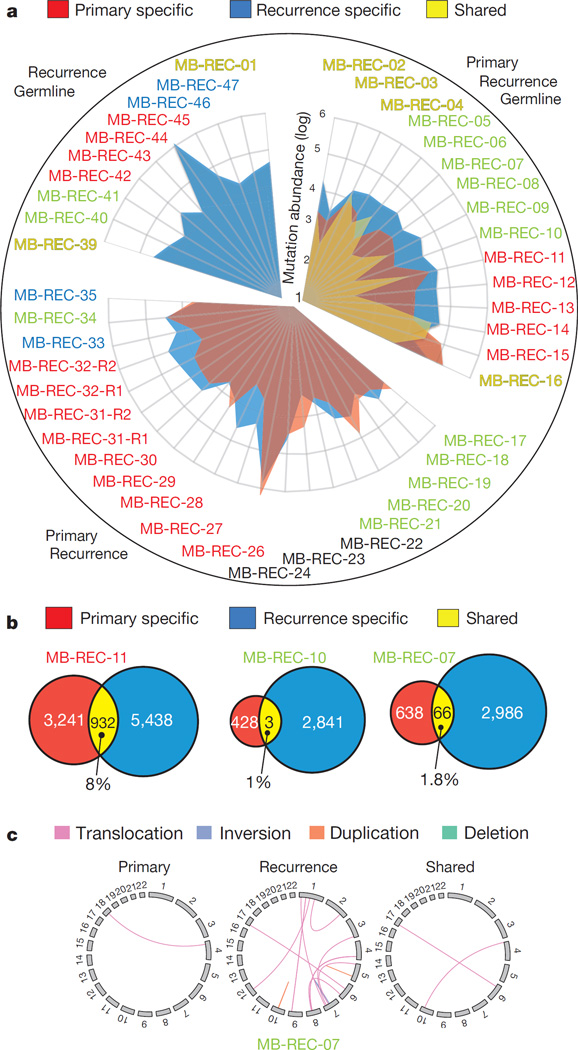
We performed integrative analysis of somatic SNVs, copy number aberrations (CNAs), loss of heterozygosity (LOH), short indels, and large-scale structural rearrangements from our WGS data. Our results demonstrate striking genetic divergence between therapy-naive medulloblastoma and patient-matched recurrent medulloblastoma across all subgroups (Fig. 3a–c and Supplementary Information). Strikingly, in 13/15 patients the somatic mutational burden increased by an average of fivefold at recurrence (P value = 2.7 × 10⁻⁴; Fig. 3a). Although two exceptions (MB-REC-15/16) have more somatic SNVs than the average therapy-naive tumour, their matched recurrences are similar to other recurrent medulloblastomas. In every case, only a minority of genetic events is shared by therapy-naive and patient-matched recurrent tumours (Supplementary Information and Supplementary Table 2c, d). Similar to our mouse model, on average, only 11.8% of human somatic SNVs and indels were present in both the diagnostic and recurrent samples, demonstrating a substantial genetic divergence at recurrence.
Figure 3. Major genetic divergence of human untreated medulloblastoma and patient-matched recurrences determined by whole-genome sequencing.
a, Somatic mutation burden in 45 tumours (43 patients) was increased fivefold in matched post-treatment (blue) versus therapy-naive (red) tumours (Student’s t-test; P value = 2.7 × 10⁻⁴). On average, 11.8% of mutations are shared somatic events (n = 15 cases with germline). Hypermutated samples stand out by two orders of magnitude (MB-REC-26/44). Patient subgroup is indicated by the label (blue, Wnt; red, Shh; yellow, Group 3; green, Group 4; black, undetermined). b, Venn diagrams of three representative patients reveal a minimal overlap in genetic events between therapy-naive (red) and recurrent (blue) tumours. c, Circos plot in a representative patient illustrates compartment-specific somatic structural variations.
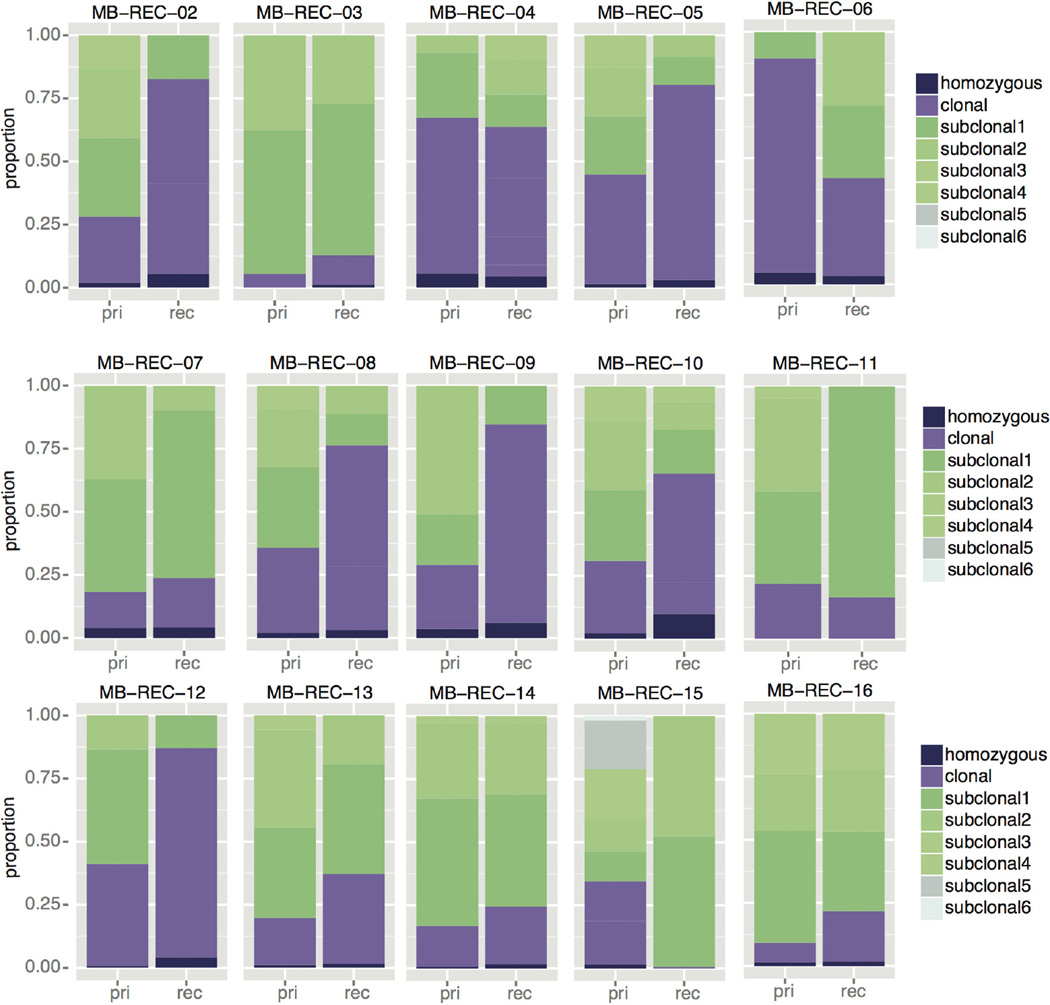
We classified mutations based on their allelic frequencies (Methods; ref. 31) and noted a significant increase in the proportion of clonal mutations post-therapy (1.9-fold increase; P value = 8.7 × 10⁻³; Extended Data Fig. 3, Supplementary Information and Supplementary Table 2j), an observation consistent with therapy-induced selection eliminating low-frequency lineages in the primary tumour. Specifically, the majority (60.5%) of damaging clonal mutations present in primary tumours consistently decrease in abundance post-therapy and either become subclonal (25.9%), or disappear completely (34.6%). Only 25% of patients retain the full set of clonal SNVs post-therapy, with most patients having no retention (41.6%) or partial retention (33.3%) of clonality. Strikingly, damaging clonal mutations post-relapse outnumber the clonal events retained from the primary tumour by fivefold, indicating the importance of profiling this compartment.
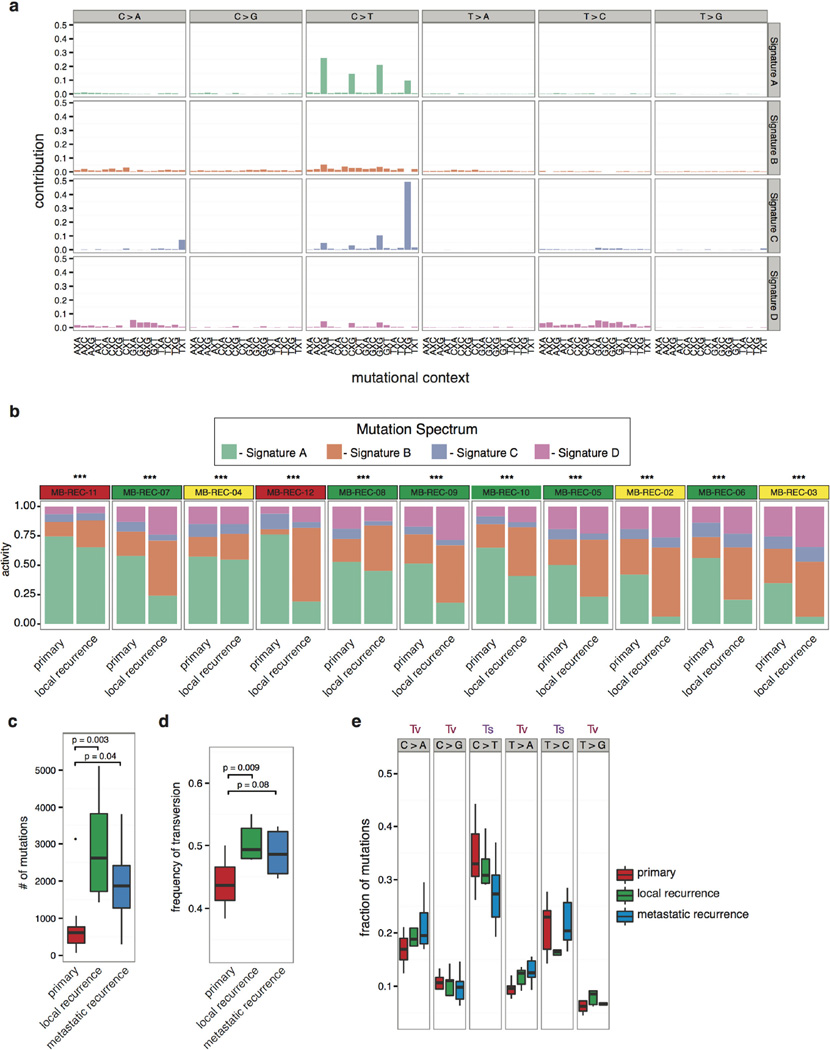
In cases without germline controls, we enriched for somatic variants by considering events restricted to either the therapy-naive or the recurrent tumour, and found the same trend of increased mutational burden at recurrence (Fig. 3a). Comparison of mutational spectra between the therapy-naive and recurrent compartments reveals four main SNV signatures whose relative proportions change significantly at relapse (Extended Data Fig. 4a, b). Consistent with observations in AML14, recurrences had a significantly increased proportion of transversions, possibly due to DNA damage induced by therapy (Extended Data Fig. 4c–e).
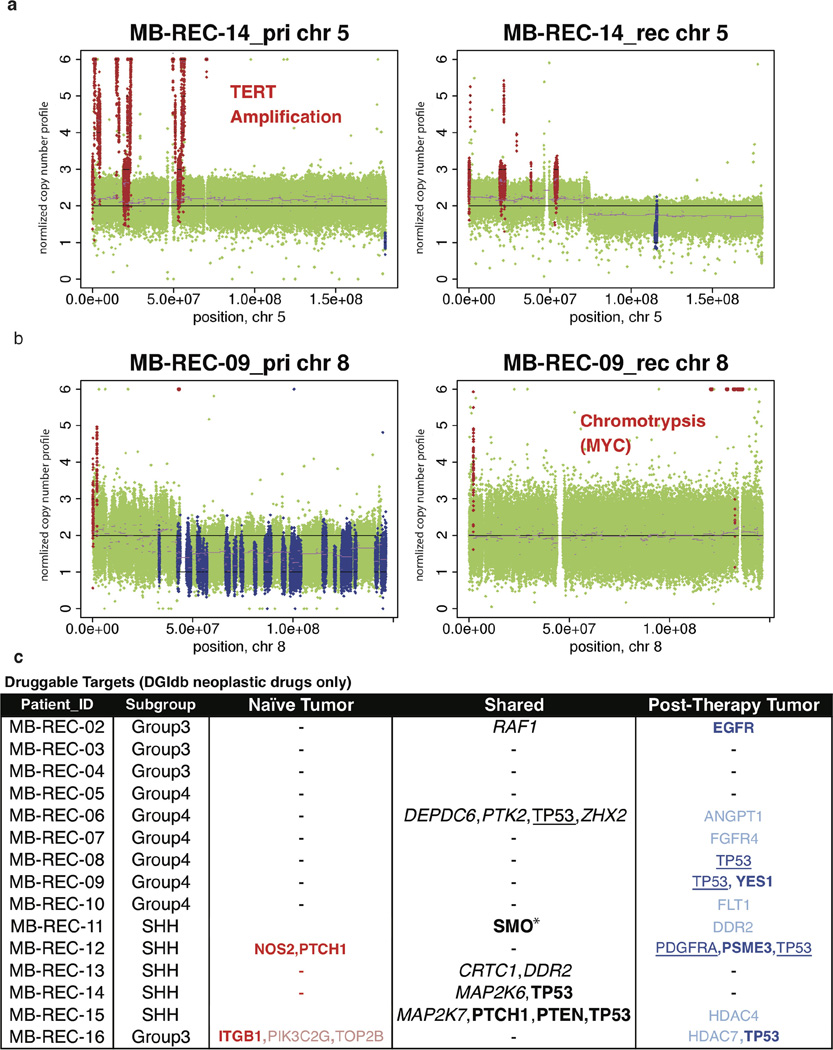
Structural aberrations are also observed at a higher frequency at recurrence (Fig. 3c; Supplementary Table 2e, f and Supplementary Information), with a subset of aberrations identified at diagnosis no longer observed at recurrence. For instance, the diagnostic sample of MB-REC-14 harbours a TERT amplification absent at recurrence (Extended Data Fig. 5a). Discordance across time makes TERT32 a less desirable therapeutic target in this patient at recurrence. Conversely, MB-REC-09 demonstrates chromothripsis involving the MYC locus only at recurrence33 (P value = 3.97 × 10⁻⁷, Extended Data Fig. 5b).
Two-thirds of patients have deleterious events in at least one gene for which an anti-neoplastic drug interaction has been defined34 (n = 9 of 15; Extended Data Fig. 5c and Supplementary Table 2i). The current assumption that all putative drug targets present at diagnosis are retained post-therapy is only valid in 4 of these patients (44.4%), though in one of these cases, we see different mutations in SMO before and after therapy, indicating convergent evolution. Of the other five patients, two have a complete switch in actionable targets from the naive to the post-therapy samples, and three patients gain actionable targets post-therapy (Extended Data Fig. 5c). Cumulatively, our data demonstrate that putative drug targets discovered in therapy-naive tumours are not, as previously assumed, representative of the targets present at recurrence. A number of targetable events are present in the recurrent tumour as subclonal mutations, indicating that a combination therapy approach may be necessary to minimize evolution of resistance35.
Clonal selection drives recurrence
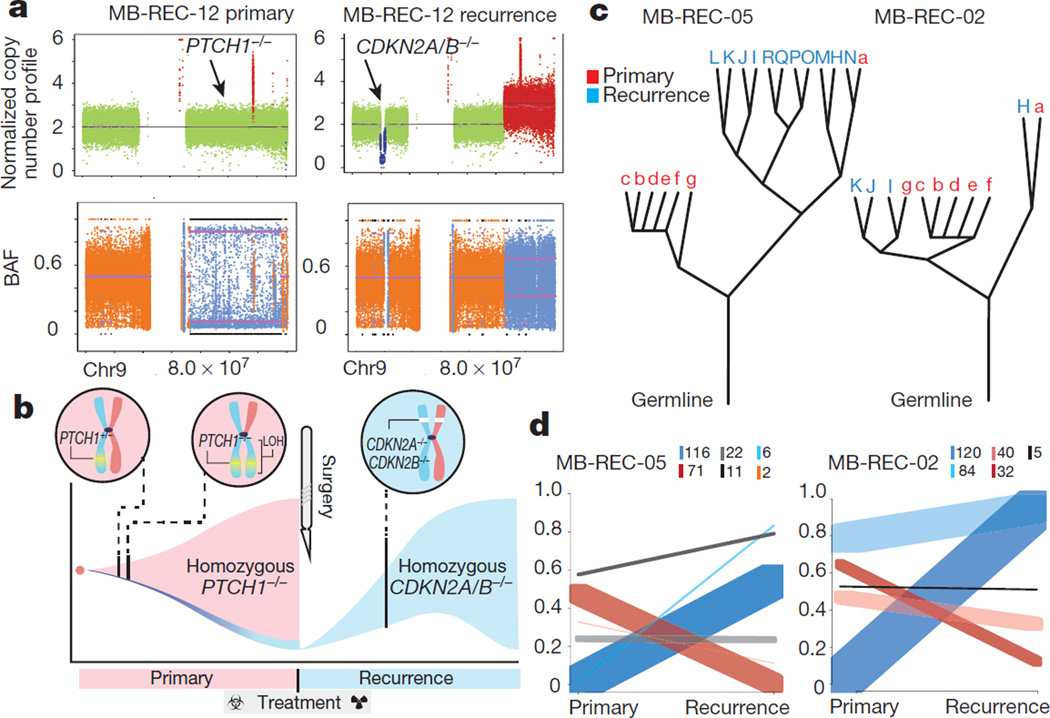
Patient MB-REC-12 harbours a clinically compelling example of a homozygous PTCH1 driver mutation that is clonally dominant in the primary tumour and completely eradicated by therapy (Supplementary Table 2k). The nature of the PTCH1−/− driver (heterozygous mutation followed by chr9q LOH) reveals that the recurrent tumour is derived from an ancestral lineage with wild-type chr9q heterozygosity (Fig. 4a, b). Thus, cells derived from the ancestral clone remained present at low frequency in the primary tumour, and a sub-lineage of these cells driven by CDKN2A and CDKN2B−/− loss successfully reconstituted the tumour post-therapy. The shift in driver from PTCH1 does not change the subgroup affiliation of the tumour, as this and other Shh patients retain a Shh-like transcriptional signature (Supplementary Table 2l). This complete switch in ‘trunk’ driver mutations post-therapy highlights the evolutionary plasticity of medulloblastoma, and imparts a cautionary note to the therapeutic strategy of targeting trunk mutations.
Figure 4. Genetic divergence of recurrent medulloblastoma is driven by clonal selection.
a, Copy-neutral LOH PTCH1−/− driver status reverts to wild type post-therapy in medulloblastoma-REC-12, with homozygous CDKN2A/B loss. b, The evolutionary progression of medulloblastoma-REC-12 is illustrated by (pink) PTCH1+/− lineage expansion, copy-neutral LOH, clonal eradication during treatment, and (blue) subsequent expansion of an ancestral clone with CDKN2A/B−/−. c, Phylogenetic relationships between primary (red) and recurrent (blue) tumours show that recurrences often represent a single rather than multiple primary tumour lineages (for example, medulloblastoma-REC-05/12 compared with medulloblastoma-REC-02). d, Ultra-deep sequencing shows post-treatment expansion of low-frequency or de novo primary clones (blue), and eradication/reduction of therapy-sensitive lineages (red). Inset box indicates number of mutations per cluster.
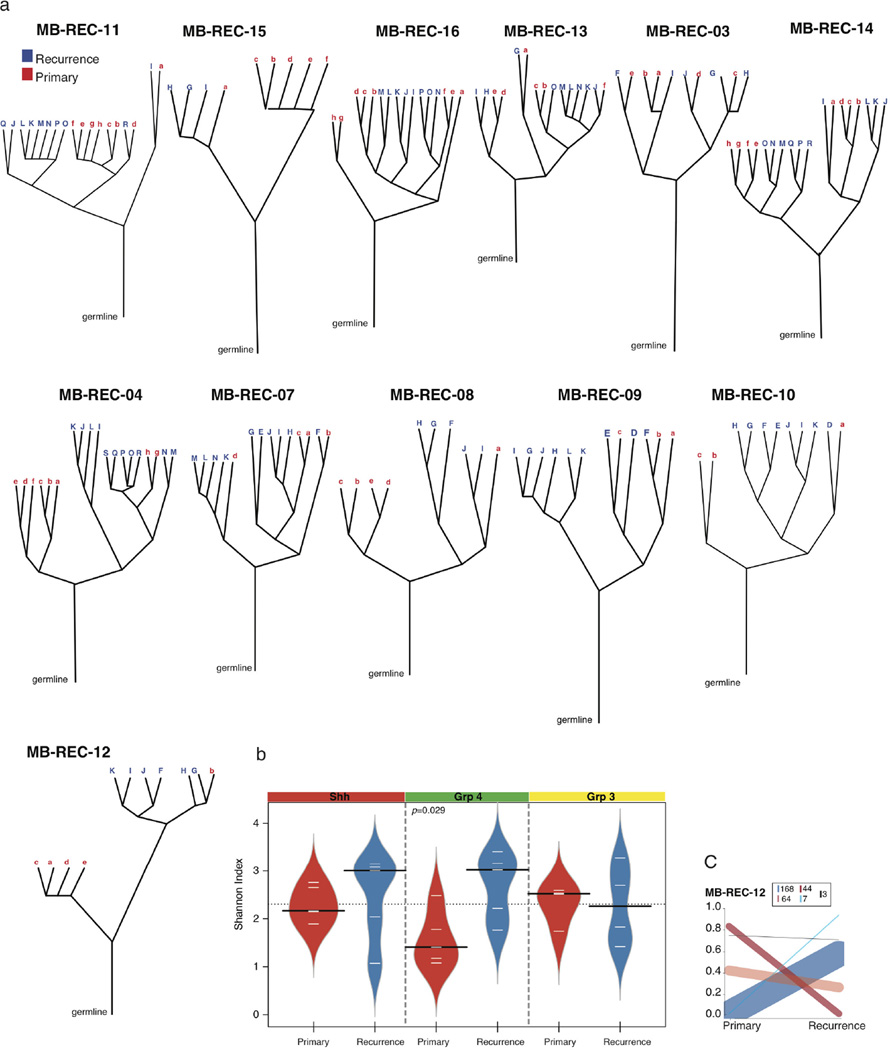
We used EXPANDS36 to computationally model the clonal diversity of the primary and recurrent tumours and globally assess clonal dynamics as a function of therapy. Leveraging genome-wide mutation and copy number data, EXPANDS infers a branched evolution pattern in 14 primary and recurrent tumour samples with matched patient germline (Fig. 4c; Extended Data Fig. 6a and Supplementary Table 3a). In the majority of patients (8/14), all clones in the recurrent tumour arise from a single lineage in the primary tumour (Fig. 4c and Extended Data Fig. 6a). In the remaining 6 patients, we see a more intermediate (MB-REC-02/07/16) or high (MB-REC-03/13/14) phylogenetic similarity to the primary tumour. Most patients have an increased number of clonal populations post therapy (71.4%), and Group 4 tumours stood out as significantly more heterogeneous (diversity measured by the Shannon Index37; P value = 0.029, Extended Data Fig. 6b and Supplementary Table 3b).
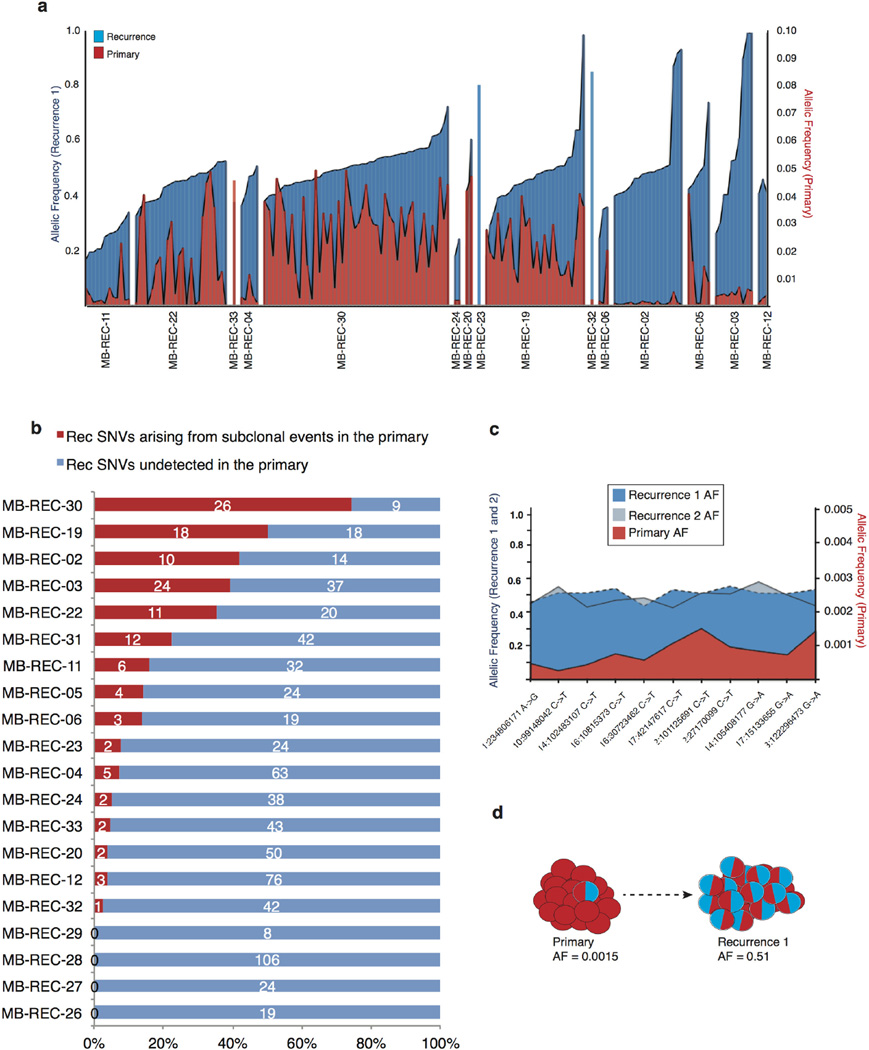
To more precisely delineate the extent of clonal selection in recurrent human medulloblastoma, we performed ultra-deep sequencing of 192 patient-specific SNVs (n = 20 patients; Supplementary Table 3c) and compared their cellular prevalence pre- and post-therapy using PyClone38. PyClone identifies clusters of somatic SNVs that co-occur in the same lineage, and determines their cellular prevalence (the proportion of tumour cells harbouring the SNV). We observed three types of patterns consistent with the findings from EXPANDS: (1) subclonal lineages in the primary tumour expanding to become clonal at relapse, (2) clonal lineages in the primary tumour that become subclonal at relapse, and (3) lineages in the primary tumour that retain the same cellular prevalence upon tumour relapse (Fig. 4d and Extended Data Fig. 6c). In each and every tumour we observe a significant incidence of novel mutations restricted to the dominant clone at the time of recurrence (Extended Data Fig. 7a). On the basis of the results from our mouse model, we hypothesized that some of these events might exist as rare subclones at diagnosis. To determine the sensitivity to detect rare (<5%) sub-clonal events, we focused on clonal SNVs in the recurrences that had at least one read of support in the primary sample and confirmed the presence of subclonal events in the primary tumour present at frequencies as low as 2/10,000 (Extended Data Fig. 7b–d and Extended Data Fig. 8). Overall, we find evidence for significant expansion of clones initially present at <5% in the therapy-naive tumour in 16/20 patients, indicating that clonal selection is commonly observed after therapy for medulloblastoma (Extended Data Fig. 7a).
Convergent biological pathways at relapse
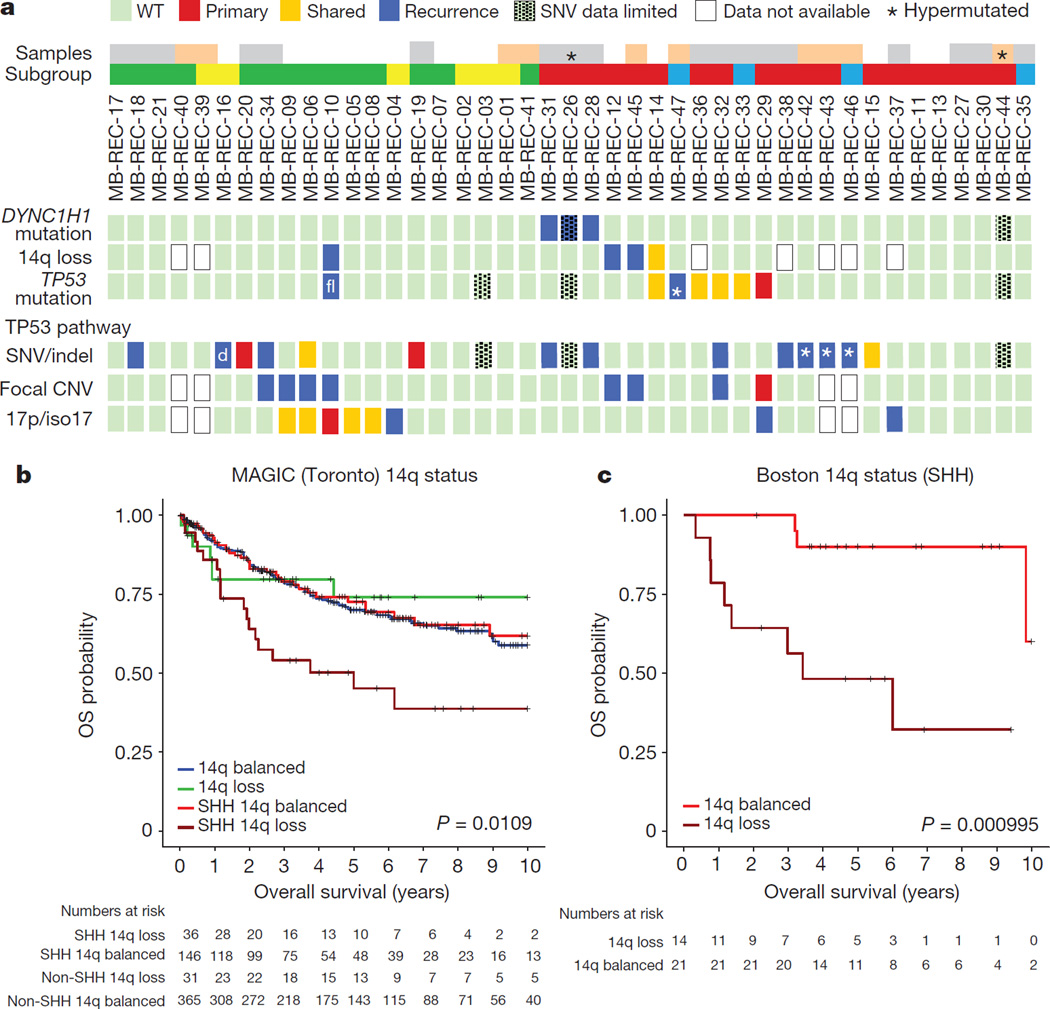
We observe recurrently mutated genes and pathways restricted to the recurrent compartment (Extended Data Fig. 9 and Supplementary Table 2q). Similar to data from our mouse model, genetic events in TP53 pathway genes (n = 12/23, 52.2%; KEGG04115) or the actual TP53 gene (n = 6/23, 26.1%) are frequent in the human recurrences, predominantly in Shh medulloblastoma (Fig. 5). The deleterious effects of TP53 on recurrence of Shh medulloblastoma are known, and we conclude that in both humans and mice, TP53 pathway alterations constitute a common feature observed at recurrence of Shh medulloblastoma28,39.
Figure 5. Signalling pathways in recurrent medulloblastoma.
a, Compartment-specific deleterious events in the TP53 gene (n = 6/23), genes from the TP53 pathway (n = 12/23), DYNC1H1 (n = 3/23), and chr14q loss (3/18). Asterisk indicates mutations in patients with missing diagnostic samples; ‘d’ indicates different events in pre- and post-therapy samples; white, patients with diagnostic, post-therapy, and germline samples; grey, no germline; pink, no matched diagnostic sample; blue, Wnt; red, Shh; yellow, Group 3; green, Group 4. b, Overall survival decreases in Shh patients with a chr14q-loss gene expression signature (versus balanced, log-rank test, n = 578, P = 0.0109); not significant in non-Shh tumours. c, Prognostic differences are replicated in an independent cohort (log-rank test, n = 35, P = 0.000995).
Additionally, recurrent damaging mutations in DYNC1H1 are restricted to the post-therapy compartment in 16% of human Shh tumours (Fig. 5 and Supplementary Table 2q), and mutations in this gene are mutually exclusive with mutations in TP53. Therapy-naive Shh medulloblastoma with deletion of one copy of the DYNC1H1 locus (chr14q) have a poor prognosis, but chr14q loss has no prognostic impact for non-Shh medulloblastoma (Fig. 5b, c; Extended Data Fig. 10a–e and Supplementary Table 4a–d). Notably, recurrence rates were higher in patients with chr14q loss (50%, 7/14) as compared to balanced chr14q (30%, 7/23). Furthermore, cases with chr14q loss were mutually exclusive with DYNC1H1 mutations, and show decreased DYNC1H1 expression (Fig. 5 and Extended Data Fig. 10a, c). Cumulatively, 6/15 (40%) Shh medulloblastoma recurrences functionally lose one DYNC1H1 allele. Taken together, we observed TP53 gene and pathway mutations, DYNC1H1 mutations, or chr14q losses in 79% of recurrent Shh medulloblastoma.
These genomically defined pathway signatures were recapitulated at the transcriptional level (Supplementary Table 2l–p). Comparisons of primary versus relapsed Group 4 recurrences (n = 3) show enrichment for gene sets involving extracellular matrix and cell surface receptor linked signal transduction. In contrast, Shh tumours (n = 3) show significant enrichment in P53 signalling and apoptosis-related gene sets, indicating that apoptotic escape may play a significant role in Shh recurrences; this is consistent with our therapy-resistant Shh mouse model, where we observed enrichment in TP53 pathway gene sets in the local recurrences (Supplementary Table 1d).
Discussion
Genomic approaches, xenografts, and mouse models of medulloblastoma used experimentally to identify targets for rational therapy are based on untreated medulloblastoma. Paradoxically, novel agents are tested in children with highly treated medulloblastoma based on the assumption that biology at recurrence is largely similar to biology at presentation. Targeted therapy by definition is based on the identification of targets present exclusively in the diseased cell. Our data demonstrate that the model of tumour biology as static is not valid for medulloblastoma, which instead demonstrates striking evolution over time. Clinical trials of targeted therapy based on targets no longer present in the dominant clone at the time of recurrence would seem doomed to failure.
Although genetic events present in the dominant clone at diagnosis are unlikely to be present in the dominant clone at recurrence, we have previously shown that molecular subgroup affiliation is extremely stable at the time of recurrence, suggesting that therapeutic strategies based on susceptibility across a subgroup might be efficacious both upfront and at recurrence11,40.
Our results comparing tumour genetics post-therapy for both human and murine medulloblastoma demonstrate that the dominant clone at recurrence arises at least in part through clonal selection of a minor clone that was already present at the time of diagnosis. Although our ability to identify recurrent driver SNVs and CNAs at the time of recurrence is hampered by sample size, there is a clear convergence in both human and mouse Shh medulloblastoma on events that drive genomic instability and aneuploidy. The recurrent convergence on a single pathway (genomic stability) after radiation treatment of Shh medulloblastoma suggests that it might be possible to develop anticipatory therapy41, in which genes/pathways responsible for therapeutic resistance are targeted at the time of initial therapy in order to prevent the emergence of resistance clones, or to modulate pathways such that resistant clones are outcompeted by therapy-sensitive ones42. Our ‘humanized mouse model’ of recurrent medulloblastoma demonstrates the remarkable power of appropriate ‘humanized’ model systems to predict pathways of therapy resistance. We would suggest that for all future clinical trials of targeted therapy of recurrent medulloblastoma, it should be mandatory to include re-biopsy to demonstrate maintenance of the target in the dominant recurrent clone. For cases in which the target is absent at recurrence, consideration should be given to using the novel agent in a neo-adjuvant manner.
Online Content Methods, along with any additional Extended Data display items and Source Data, are available in the online version of the paper; references unique to these sections appear only in the online paper.
Methods
No statistical methods were used to predetermine sample size.
Survival surgery for murine tumour removal
Male and female Ptc+/−/Math1-SB11/T2Onc or T2Onc2 mice (12 to 20 weeks of age; at the time they developed signs of medulloblastoma) were used. We did not perform a formal sample size estimate for the study but based our experimental plan on our previous experience with Sleeping Beauty mutagenesis screening. When mice showed early clinical signs of brain tumours they were anaesthetized with isoflourane, ophthalmic ointment applied to the eyes and the scalp antiseptically prepared. A 1.5 cm long midline incision was made to expose the skull from the coronal suture to the cranio-cervical junction. Using a high-speed drill and a 2.5 mm trephine bit, a cranial defect is drilled 2 mm posterior to lambda to avoid the transverse sinuses. The skull and the dura are lifted with micro-dissecting forceps, the bulk of the tumour is then removed using a harmon forceps with teeth, while smaller sections of tumour are removed with a microcurette (2 mm). Surgical samples are saved in dry ice, the bleeding from the tumour site is counteracted with direct pressure and Gelfoam. When haemostasis is obtained, the surgical wound is sutured using interrupted stitching with absorbable sutures. Animals received analgesia and dexamethasone post-operatively to contain the brain oedema. Male and female Ptc+/−/Math1-SB11/T2Onc or T2Onc2 control mice were monitored for early clinical signs of brain tumours but not subjected to surgery and CSI irradiation, no formal randomization was used. All the procedures involving animals have been approved by the institutional Animal Care Committee, in no case were tumour-bearing animals allowed a tumour burden compromising normal behaviour, food and water intake or exceeding the approved volume of 1,700 mm3.
CT guided craniospinal irradiation
Mice that had recovered from tumour resection were anaesthetized with isoflurane and placed in the brain irradiation bed in the image guided small animal irradiator (X-Rad 225CX, Precision Xray, North Branford, CT, USA). Correct animal setup was confirmed using 2D fluoroscopic images with and without the brain collimator (2 × 2 cm) in place, all images were acquired at 40 kVp, 0.5 mA, using the same X-ray tube which is used for radiation treatment. 3D volumetric cone-beam CT images were used for the visualization of bone and soft tissues within the animal and isocentre placement. The imaging capability of the unit were described previously43, the imaging dose to the animal was estimated to be less than 1 cGy. The delivered dose per fraction was 2 Gy, administered 3 times a week for the first week to prevent brain oedema, followed by five times a week treatment for the following 3 weeks. Each daily dose was delivered with two parallel opposed-lateral beams to correct for tissue attenuation of the dose, total daily dose of 2 Gy. Dose rate for the brain collimator was measured at 3.2 Gy per min at 225 kVp, 13 mA, on a 0.3 mm Cu filter (HVL: 0.93 mm Cu, added filtration: 0.3 mm Cu). The tube was calibrated at these settings following the TG61 protocol44.
The spine treatment was introduced on the second week of CSI irradiation, we used a 4.76Gy per 6 fractions schedule, and the mice received 2 spinal fractions per week. Radiation to the spinal cord was delivered to mice placed supine on the irradiator stage the irradiation was done with single or multiple posterior beams. The same imaging strategy with 2D and volumetric 3D imaging was adopted for spinal cord targeting, using a 0.5 × 5 cm collimator or multiple fields of 0.5 × 2 cm; for the spine treatment a dose correction was applied to compensate for the different depth of the cervical spine compared to lumbo/sacral. Treatment dose was administered at 2.8Gy per min at 225 kVp, 13 mA settings on a 0.3 mm Cu filter. The end-point date of the control and CSI treated groups was assessed by independent veterinary technicians blinded to the experimental group. Medulloblastoma-free survival from the time of diagnosis was assessed for control mice and mice that underwent surgery and radiation, no animal was removed from the study and mice euthanized during the study for different reasons than medulloblastoma were censored in the Kaplan–Meier estimate for tumour-free survival.
Linker-mediated PCR and Illumina HiSeq sequencing of transposon insertion sites
Genomic DNA was isolated and purified from mouse tissues with a PureLink genomic DNA extraction kit (Invitrogen). Libraries for Illumina HiSeq sequencing were prepared as described previously25 with minor modifications. 2 µg of gDNA were digested and ligated to the adapters, after a BamHI digest to eliminate the untransposed copies of the concatamer, an enrichment PCR followed by a barcoding PCR were performed25. The barcode PCR was modified to incorporate a paired-end (PE) sequencing adaptor for paired end sequencing, the sequence of the PE adaptor was: CAAGCAGAAGACGGCATACGAGATCGGTCTCGGCATTCCTGCTGAACCGCTCTTCCGATCTTAGGGCTCCGCTTAAGGGAC. Libraries were purified and pooled as previously described and sequenced on an Illumina HiSeq 2000 (ref. 25).
gCIS prediction
Sequenced libraries were demultiplexed and aligned as described previously25. Demultiplexing and trimming of SB transpon sequences was performed using custom scripts, alignment of reads was performed with Novoalign to mouse assembly NCBI37/mm9 (July 2007) A chi-squared test was used to asses statistical enrichment of the integration events within each transcription unit considering the following: the number of TA dinucleotide sites within the gene relative to the number of TA sites in the genome, the number of integration sites within each tumour, and the total number of tumours in each cohort. This gCIS analysis produced a P value for each of the 19,000 mouse RefSeq genes, and a Bonferroni correction was therefore used to adjust for multiple hypothesis testing. gCIS predictions were manually curated to filter out ambiguities, artefacts and local hopping. BioProject ID PRJNA306269.
Genetic algorithm for driver gene prediction
The model assumes that tumour cell division and growth are initiated by a founding transposon insertion event, and that additional insertion events can subsequently occur in daughter cells. According to the model, insertion events in the transformed daughter cells are expected to decrease by a factor of 2n relative to the initial transformed cell, where n is the number of intervening cell divisions. Details of the model are described in Supplementary Note 1.
As with any model it is important to note its limitations. First, there is a limit to the degree to which distinct lineages can be separated. If two lineages are governed by two sufficiently close values of the parameter G, the components will be superimposed. If the value of d is also the same, the identification of the initiating insertions will not be affected; otherwise, the lineage with lower d will incorrectly identify its initiating mutation as a passenger. The extent of this issue is dependent upon the closeness of G and the depth at which a sample has been sequenced. It almost certainly true that other lineages are present in the data, but arose relatively late and/or have relatively low growth rates. Therefore, the model is best described as identifying the most clear and unambiguous lineages.
Second, a lineage which have undergone multiple gene disruptions that affect growth rate at different generations can appear as two separate lineages. For example, if a disruption of gene A causes rampant cell division/growth, and is followed up two generations later by a disruption in gene B that further increases the growth rate, this will appear as two lineages with putative genotypes A- and B-. In reality, the genotypes are A- and A-;B-. Importantly, this does not affect the ultimate identification of both of these genes as initiators.
Relative clonal prevalence was calculated for the genes predicted as driver as: 2d G and normalized to the total number of predicted drivers for each sample. Driver events predicted to happen in the founder clones (highest G) for each sample, or showing relative cell abundance >10% were selected for pathway enrichment analysis.
PCR for Sleeping Beauty tagged fragments
The primers for amplifying Sleeping Beauty transposon insertion sites were designed based on the chromosomal location of each insertion site and its orientation to the transcription of the gene hosting the insertion. The primers at the inverted repeats/direct repeats (left) (IRL) and inverted repeats/direct repeats (right) (IRR) of the transposon were 5′-AAATTTGTGGAGTAGTTGAAAAACGA-3′ and 5′-GGATTAAATGTCAGGAATTGTGAAAA-3′, respectively. The input represents genomic DNA with Sleeping Beauty transposition, which was illustrated by Sleeping Beauty excision PCR that detected the transposon post-transposition26. Three points of input (1×, 5× and 25×) were used.
Histology
Mice showing signs of late stage brain tumours were euthanized and tissue harvested for genomic DNA extraction as well as histological examination. Extent and location of recurrences was evaluated by standard haematoxylin and eosin staining, Trp53 pathway status was evaluated by p21 staining performed at the Paediatric Laboratory Medicine Department, The Hospital for Sick Children, (Toronto, Canada) using the Ventana BenchMark XT model. The conditions were as follows: HIER: 40 min in a Tris based buffer (pH 8.5) Ventana CC1 (http://www.ventana.com/product/203?type=204), primary antibody p21 (1:50) (BD bioscience 556431, clone SXM30) was incubated for 1 h at 37 °C. The signal was detected using Ventana OptiView DAB IHC Detection Kit.
Fly stocks
The following fly stocks were used: UAS-mCD8-GFP to label cell membrane; insc-Gal4 (Gal41407 inserted in an inscuteable promoter) to drive gene expression in the neuroblast lineage; UAS-dpn for overexpression of dpn.
Fly culture
Flies were mated and maintained at 25 °C. Fly larvae were retrieved at late third instar stage for whole body irradiation at 40 Gy. The larval brains were dissected 4 h after irradiation, followed by fixation and immunohistochemistry analysis.
Immunofluorescence and imaging
Larval brains were dissected, fixed, and stained as previously described29. Briefly, third instar larvae brains were dissected in PBS, fixed in 4% paraformaldehyde solution for 20 min at room temperature, and incubated with the primary antibody (rabbit anti-phospho-histone 3, Millipore, 1:200) overnight at 4 °C and secondary antibody for 2 h at room temperature. Fluorescence images were acquired using a Leica SP5 confocal microscope. Representative images of the dorsal brain lobes were shown in Fig. 1d, e and Extended Data Fig. 1h.
Whole-genome sequencing
All patients gave informed consent to the samples collection; unless indicated otherwise, the samples were sequenced and analysed at Canada’s Michael Smith Genome Sciences Centre at the BC Cancer Agency (GSC). Libraries for whole-genome sequencing were constructed using either the plate-based or SPRI-TE library construction protocol.
Illumina genomic-plate-based library construction (350–450 bp insert size)
2 µg of genomic DNA in a 96-well format was fragmented by Covaris E210 sonication for 30 s using a ‘duty cycle’ of 20% and ‘intensity’ of 5. The paired-end sequencing library was prepared following the BC Cancer Agency’s Genome Sciences Centre 96-well genomic ~350–450 bp insert Illumina Library Construction protocol on a Biomek FX robot (Beckman-Coulter, USA). Briefly, the DNA was purified in a 96-well microtitre plate using Ampure XP SPRI beads (40–45 µl beads per 60 µl DNA), and was subject to end-repair, and phosphorylation by T4 DNA polymerase, Klenow DNA Polymerase, and T4 polynucleotide kinase respectively in a single reaction, followed by cleanup using Ampure XP SPRI beads and 3′ A-tailing by Klenow fragment (3′ to 5′ exo minus). After cleanup using Ampure XP SPRI beads, PicoGreen quantification was performed to determine the amount of Illumina PE adapters used in the next step of adaptor ligation reaction. The adaptor-ligated products were purified using Ampure XP SPRI beads, then PCR-amplified with Phusion DNA Polymerase (Thermo Fisher Scientific Inc. USA) using Illumina’s PE indexed primer set, with cycle conditions: 98 °C for 30 s followed by 6 cycles of 98 °C for 15 s, 62 °C for 30 s and 72 °C for 30 s, and a final extension at 72 °C for 5 min. The PCR products were purified using Ampure XP SPRI beads, and checked with Caliper LabChip GX for DNA samples using the High Sensitivity Assay (PerkinElmer, USA). PCR products of the desired size range were gel purified (8% PAGE or 1.5% Metaphor agarose in an in-house custom built robot), and the DNA quality was assessed and quantified using an Agilent DNA 1000 series II assay and Quant-iT dsDNA HS Assay Kit using Qubit fluorometer (Invitrogen), then diluted to 8 nM. The final concentration was confirmed by Quant-iT dsDNA HS Assay before generating 100 bp paired-end reads on the Illumina HiSeq 2000/2500 platform using v3 chemistry.
SPRI-TE genomic library construction
Whole-genome libraries of patient samples medulloblastoma-Rec-03, -04, -06, -11, -12, -18, -19, -22–24, -26–33 have been constructed using the Spri-TE 300–600 bp fragment protocol as follows.
Genome libraries with fragment size ranges of approximately 400 bp were constructed on a SPRI-TE robot (Beckman Coulter, USA) according to the manufacturer’s instructions (SPRIworks Fragment Library System I Kit, A84801). Briefly, 1 µg of genomic DNA in a 60 µl volume, and 96-well format, was fragmented by Covaris E210 sonication for 30 s using a ‘duty cycle’ of 20% and ‘intensity’ of 5. Up to 10 paired-end genome sequencing libraries were prepared in parallel using the SPRI-TE 300–600 bp size-selection program. Following completion of the SPRI-TE run the adaptor ligated library templates were quantified using a Qubit fluorometer. 5 ng of adaptor ligated template was PCR amplified using Phusion DNA Polymerase (Thermo Fisher Scientific, USA) and Illumina’s PE indexed primer set, with cycle conditions: 98 °C for 30 s followed by 10 cycles of 98 °C for 15 s, 62 °C for 30 s and 72 °C for 30 s, and a final amplicon extension at 72 °C for 5 min. The PCR products were purified using Ampure XP SPRI beads, and checked with Caliper LabChip GX for DNA samples using the High Sensitivity Assay (PerkinElmer, USA). PCR products of the desired size range were purified using gel electrophoresis (8% PAGE or 1.5% Metaphor agarose gels in a custom built robot) and the DNA quality was assessed and quantified using an Agilent DNA 1000 series II assay and Quant-iT dsDNA HS Assay Kit using Qubit fluorometer (Invitrogen), then diluted to 8 nM. The final concentration was verified by Quant-iT dsDNA HS Assay before Illumina Sequencing before generating 100 bp paired-end reads on the Illumina HiSeq 2000/2500 platform using v2 or v3 chemistry.
WGS
Alignment
After marking chastity failed reads, paired-end 100 bp raw reads were aligned to the reference genome GRCh37-lite (http://www.bcgsc.ca/downloads/genomes/9606/hg19/1000genomes/bwa_ind/genome) with the Burrows–Wheeler Aligner (BWA; version 0.5.7)45. Bam files were sorted with SAMTools (version 0.1.13) and merged using Picard MarkDuplicates.jar (version 1.71). The merged bam files were subsequently indexed with SAMTools index (version 0.1.17) and submitted to the European Genome-phenome Archive (EGAD00001000946).
German Cancer Research Centre (DKFZ)
Patient samples medulloblastoma-REC-13-16 and medulloblastoma-REC-34-35 were processed at the DKFZ in Heidelberg as previously described2.
Analysed DNA was isolated using using a Qiagen Allprep DNA/RNA/Protein Mini Kit. On average 125 mg of homogenized (TissueLyser, Qiagen) tumour tissue was used for isolation of analytes. The manufacturer’s protocol was adapted to allow for DNA and total RNA (including miRNA) isolation. DNA from matching blood samples was extracted using Qiagen Blood and Cell Culture Midi Kit according to the manufacturer’s protocol. After quality control of isolated DNA (gel electrophoresis), extracted nucleic acids were submitted for sequencing.
Paired-end (PE) DNA library preparation was carried out using Illumina Inc. v2 protocols. In brief, 1–5 µg of genomic DNA were fragmented to ~300 bp (PE) insert-size with a Covaris device, followed by size selection through agarose gel excision. Deep sequencing was carried out with Illumina HiSeq2000 instruments.
Whole-exome sequencing at McGill
Patient samples medulloblastoma-REC-36-38 and medulloblastoma-REC-48-55 were prepared and sequenced by the Genome Quebec Innovation Centre and analysed at the McGill University Health Centre as follows. Paired-end libraries were prepared with the Illumina’s Nextera Rapid Capture Exome kit. Captured exome DNA fragments were then sequenced on Illumina HiSeq 2500 (rapid-run mode) generating 100-bp paired-end reads. Adaptor sequences were removed and low-quality reads were trimmed using the FASTX toolkit. Quality trimmed reads were aligned to the human genome reference library (hg19) using Burrows–Wheeler Aligner (BWA) version 0.5.9 (ref. 45). Indels were realigned using the Genome Analysis Toolkit (GATK)46 and duplicate reads were marked using Picard.
Genomic SNV analysis
SNVs from WGS data were analysed using all three methods described below, whereas SNVs from exome-seq data were analysed only with MutationSeq.
Samtools mpileup
SNVs were analysed with SAMtools mpileup v.0.1.17 either on single or paired libraries. Each chromosome was analysed separately using the -C50-DSBuf parameters. The resulting vcf files were merged and filtered to remove low-quality SNVs by using samtools varFilter (with default parameters) as well as to remove SNVs with a QUAL score of less than 20. Finally, SNVs were annotated with gene annotations from Ensembl v66 using snpEff and the dbSNP v137 db membership assigned using SnpSift47.
Strelka
To analyse compartment specific SNVs and indels, samples were analysed pair-wise with the default settings of Strelka v0.4.7 (ref. 48). Primary tumour samples and relapse/met were compared against the germline sample. In the absence of a germline sample, the relapse/met samples were compared against the primary tumour sample.
SNV classification
Variant allele frequencies (VAF) of somatic damaging SNVs (called by Strelka in 14 patients with matched germline samples) were classified into distinct clusters using the R package mclust, which uses finite mixture estimation via iterative expectation maximization steps (EM) and the Bayesian Information Criterion (BIC). Each cluster is manually categorized as either ‘homozygous’, ‘clonal’, or ‘subclonal’, depending on the cluster VAF and the uncertainty separating it from the next cluster. Multiple subclonal populations are numbered sequentially, starting with the most highly prevalent population.
MutationSeq
SNVs were analysed pair-wise with SAMtools mpileup v.0.1.17 (ref. 49). Each chromosome was analysed separately using the -C50-DSBuf parameters. Before merging the resulting vcf files, they were filtered to remove all indels and low quality SNVs by using samtools varFilter (with default parameters) as well as to remove SNVs with a QUAL score of less than 20 (vcf column 6). The SNVs in the resulting vcf files were further filtered and scored using mutationSeq v1.0.2 and annotated with gene annotations from Ensembl v66 using SnpEff and the dbSNP v137 and Cosmic 64 db membership using SnpSift
VarScan
Indels were called in the low quality exomes using VarScan version 2.3.6, using the following parameters: P value 95 × 10−2 –strand-filter 1–min-avg-qual 20. The indels in the resulting vcf files were annotated with gene annotations from Ensembl 66 using SnpEff as described above, and screened against dbSNP137 using SnpSift.
Mutation spectra
EMu was used to define mutation spectra for 11 samples with germline (that is, excluding the DKFZ samples), using the expectation-maximization algorithm50. To assess significant changes in the distributions of mutation spectra across primary, local and distal recurrences from each medulloblastoma patient, we used the chi-squared test. Changes in (1) the number of compartment-specific mutations and (2) in frequencies of transversion mutations, were tested with the Wilcoxon rank-sum test. Changes in the frequency of C > T and T > G transversions between primary and recurrent tumours were tested using factorial ANOVA with rank transformation.
CNV analysis (CNA-seq)
The techniques outlined in ref. 51 were followed to analyse copy number changes. Sequence quality filtering was used to remove all reads of low mapping quality (Q < 10). Due to the varying amounts of sequence reads from each sample, aligned reference reads were first used to define genomic bins of equal reference coverage to which depths of alignments of sequence from each of the tumour samples were compared. This resulted in a measurement of the relative number of aligned reads from the tumours and reference in bins of variable length along the genome, where bin width is inversely proportional to the number of mapped reference reads. A hidden Markov model (HMM) was used to classify and segment continuous regions of copy number loss, neutrality, or gain using methodology outlined previously52. The five states reported by the HMM were: loss (1), neutral (2), gain (3), amplification (4), and high-level amplification (5). In cases with germline, copy number gains and losses are called against the germline sample. In cases without germline, CNV calls were made using the primary instead of the germline sample, such that gains and losses reported in the recurrent tumour are relative to the copy number state in the primary. The limitations of this approach are that (1) when both primary and recurrent tumours share an event, the CNV output looks normal, and (2) when a gain (or loss) is called in the recurrent tumour versus the primary tumour, we cannot distinguish between the two scenarios that can give rise to such a result. The first scenario is that there is a gain the recurrence vs the primary, and the second is that there is a loss in the primary only. To resolve this uncertainty for particular chromosomes of interest in a subset of patients without germline, we additionally ran the Control-FREEC algorithm53. Control-FREEC was run using the following default parameters, with the following exceptions: breakPointType = 4, telocentromeric = 75,000, minimal-CoveragePerPosition = 5.
Structural variant detection
Structural variant detection was performed using ABySS (v1.3.2). Genome (WGS) libraries were assembled in single-end mode using k-mer values of k24, and k44. The contigs and reads were then reassembled at k64 in single end mode and then finally at k64 in paired end mode. Large-scale rearrangements and gene fusions were identified using BWA (v0.6.2-r126) alignments. Evidence for the alignments were provided from aligning reads back to the contigs and from aligning reads to genomic coordinates. Events were then filtered on read thresholds. Insertions and deletions were identified by gapped alignment of contigs to the human reference using BWA. Confidence in the event was calculated from the alignment of reads back to the event breakpoint in the contigs. The events were then screened against dbSNP and other variation databases to identify putative novel events.
SNV verification
To verify SNVs, samples were subjected to targeted deep amplicon sequencing of the tumour and normal DNA. Primers were designed with the Primer3 software54 with a GC clamp and an optimal Tm of 64 °C to ensure specificity. Primers aligned against the human reference genome were tested with a combination of UCSC’s in silico PCR tool and custom in-house scripts to obtain unique hits. The primer pairs were designed such that the variant is located within a maximum of 250 bp of the 5′ or 3′ amplicon end. The primers were tagged with Illumina adapters eliminating the need for adaptor ligation during sample preparation. The Illumina adaptor tags are as follows: 5′ -CGCTCTTCCGATCTCTG on the forward amplicon primer and 5′ -TGCTCTTCCGATCTGAC on the reverse amplicon primers. Genomic DNA templates or library construction intermediates were used as starting material to generate PCR products using Phusion DNA polymerase (Fisher Scientific, catalogue number F-540L). The amplicons ranged in size from 188–625 bp. Amplicons were pooled by template for direct sequencing. Preparation for sequencing involved a second round of amplification (6 cycles with Phusion DNA polymerase) with PE primer 1.0-DS (5′-AATGATACGGCGACCACCGAGATCTACACTCTTTCCCTACACGACGCTCTTCCGATCTCTG-3′) and a custom PCR primer (5′-CAAGCAGAAGACGGCATACGAGATNNNNNNGTGACTGGAGTTCAGACGTGTGCTCTTCCGATCTGAC-3′) containing an unique six-nucleotide ‘index’ shown here as the letter N. PCR products of the desired size range were purified using 8% PAGE gels. DNA quality was assessed using the Agilent DNA 1000 series II assay (Agilent, Santa Clara CA, USA) and DNA quantity was measured using by Quant-iT dsDNA HS assay on a Qubit fluorometer (Life Technologies, Grand Island, NY, USA). The indexed libraries were pooled together and sequenced on the Illumina MiSeq platform with paired-end 250 bp reads using v2 reagents. An in-house generated PhiX sequencing control library was spiked in to the samples at molar ratio of 1:100. Reads were aligned using BWA-SW, and SNVs called with Samtools mpileup with the following parameters: -d 1000000 -B -C50 -DES. Indels were called using VarScan and the following parameters: mpileup2indel–min-var.-freq 0–p-value 1–strand-filter 0.
Detection of rare subclones in the primary tumours using DeepSeq data
SNVs with allelic frequencies greater than 15% in recurrent tumours were considered clonal. To find evidence for rare subclones (< 5%) of these SNVs in the primary samples, we generated base quality (baseQ) distributions supporting the reference and all alternate alleles in the primary (and the recurrent) compartments. Due to our amplification and sequencing strategy, all reads start at the same position, and the target SNV is always at a specific position in the read (that is, a given mutation covered by 2,000 reads will be at base position 40 in all reads). Thus, unlike shotgun protocols where read starts are random, the SNVs are never affected by sequencing errors at the end of the read (where errors tend to happen more often), and cumulative sequencing error rates for whole reads are not applicable in estimating local error rates at a specific base. Instead, detection of a real mutation is only confounded by the subset of sequencing errors at the same position in the read that causes a base change to match the mutation; sequencing errors matching the other two possible bases (that is, non-reference and non-mutation) are a non-ambiguous measure of the error rate at a particular position. Thus, to distinguish sequencing errors from real subclonal mutations, for each allele (that is, the reference allele and all three alternate alleles), we generated base quality (baseQ) distributions from all reads covering the position of the mutation; the reference base was further used as the benchmark distribution of a base without appreciable sequencing errors (Extended Data Fig. 8). The non-reference alleles that had the highest (1) mean baseQ value, (2) max baseQ value, and (3) highest number of reads with baseQ values >30, were considered real events. When all three criteria were not matched, the subclonal presence of the mutation could not be confirmed. At positions where these criteria were matched, the baseQ distributions of the alternate allele closely matched the baseQ distribution of the positive control reference base, could be easily distinguished from sequencing errors, and nearly always matched the expected mutation at that position, confirming the subclonal presence of the mutation in the diagnostic sample.
PyClone statistical inference of tumour cell populations using deep sequencing SNV information
The allelic ratios are modelled using a binomial distribution and incorporated into the HMM Titan calculations, where the output is a list of copy number and LOH events. The Titan run for a tumour sample that has the lowest SDbw score is the optimal result and the corresponding number of clonal clusters is the optimal one—this copy number information was then chosen for use in further analysis. Minor and major copy number counts calculated from the optimal TitanCNA zygosity states were attached to the allele frequency information for each SNV and was used as input for Pyclone 0.12.3. PyClone was used to infer subclonal populations for all samples in each case. It introduces a framework that can analyse all samples from a single case in the same run improving accuracy of the inference. Pyclone outputs cellular frequencies and clonal cluster membership for each genomic position, accounting for confounding factors such as mutational genotype in the context of copy number changes. All Pyclone analyses were done using a multi-sample model and a beta-binomial distribution, with pre-calculated parental copy number inferred by TitanCNA.
Genome-wide phylogenetic analysis
Copy number and LOH information was called for 14 patients with matched germline samples using Control-FreeC53, an algorithm that provides fractional copy number level for segments. Sensitive mutation calling was performed using muTect55 and clonal and subclonal somatic mutations were shortlisted if there was adequate sequence coverage in both primary and relapse tumour compartments (10 reads minimum). Shortlisted mutations and copy number segments in areas of neutral heterozygosity were used as input to EXPANDS36. Phylogenetic relationships between the subpopulations inferred by the EXPANDS algorithm in primary and recurrent tumours were generated using both SNV and copy number segments and the BIONJ algorithm. The inferred cellular prevalence values of each subpopulation was used to generate a Shannon Index value for each compartment37.
Gene-expression signature
We identified 14q associated genes in Shh medulloblastoma using ANOVA in the Partek Genomics Suite. Gene expression profiles were analysed according to 14q status in samples from a previously published Toronto data set containing only SHH medulloblastoma samples (n = 82)56 in a subset of cases with available SNP6 data5,57. The top 20 ranking signature genes were applied using k-means clustering using the R2 platform (http://hgserver1.amc.nl/cgi-bin/r2/main.cgi) on a non-overlapping, independent gene expression profiling cohort from Boston58 sub-selecting only SHH medulloblastomas. Survival differences were analysed using log-rank statistics and Kaplan–Meier estimates.
Messenger RNA library construction and sequencing
Two micrograms of total RNA samples were arrayed into a 96-well plate and polyadenylated (Poly(A)+) messenger RNA (mRNA) was purified using the 96-well MultiMACS mRNA isolation kit on the MultiMACS 96 separator (Miltenyi Biotec, Germany) with on-column DNaseI-treatment as per the manufacturer’s instructions. The eluted poly(A)+ mRNA was ethanol precipitated and resuspended in 10 µl of DEPC-treated water with 1:20 SuperaseIN (Life Technologies, USA). First-strand cDNA was synthesized from the purified poly(A)+ mRNA using the Superscript cDNA Synthesis kit (Life Technologies, USA) and random hexamer primers at a concentration of 5 µM along with a final concentration of 1 µg ul−1 actinomycin D, followed by Ampure XP SPRI beads on a Biomek FX robot (Beckman-Coulter, USA). The second strand cDNA was synthesized following the Superscript cDNA Synthesis protocol by replacing the dTTP with dUTP in dNTP mix, allowing the second strand to be digested using UNG (Uracil-N-Glycosylase, Life Technologies, USA) in the post-adaptor ligation reaction and thus achieving strand specificity. The cDNA was quantified in a 96-well format using PicoGreen (Life Technologies, USA) and VICTOR3V Spectrophotometer (PerkinElmer, Inc. USA). The quality was checked on a random sampling using the High Sensitivity DNA chip assay (Agilent). The cDNA was fragmented by Covaris E210 (Covaris, USA) sonication for 55 s, using a duty cycle of 20% and intensity of 5. Plate-based libraries were prepared following the BC Cancer Agency’s Michael Smith Genome Sciences Centre (BCGSC) paired-end (PE) protocol on a Biomek FX robot (Beckman-Coulter, USA). Briefly, the cDNA was purified in 96-well format using Ampure XP SPRI beads, and was subject to end-repair and phosphorylation by T4 DNA polymerase, Klenow DNA Polymerase, and T4 polynucleotide kinase respectively in a single reaction, followed by cleanup using Ampure XP SPRI beads and 3′ A-tailing by Klenow fragment (3′ to 5′ exo minus). After cleanup using Ampure XP SPRI beads, PicoGreen quantification was performed to determine the amount of Illumina PE adapters used in the next step of adaptor ligation reaction. The adaptor-ligated products were purified using Ampure XP SPRI beads, then PCR-amplified with Phusion DNA Polymerase (Thermo Fisher Scientific USA) using Illumina’s PE primer set, with cycle conditions of 98 °C 30 s followed by 10–15 cycles of 98 °C for 10 s, 65 °C for 30 s and 72 °C for 30 s, and then 72 °C for 5 min. The PCR products were purified using Ampure XP SPRI beads, and checked with a Caliper LabChip GX for DNA samples using the High Sensitivity assay (PerkinElmer, USA). PCR products with a desired size range were purified using a 96-channel size selection robot developed at the BCGSC, and the DNA quality was assessed and quantified using an Agilent DNA 1000 series II assay and Quant-iT dsDNA HS Assay Kit using Qubit fluorometer (Invitrogen), then diluted to 8 nM. The final concentration was verified by Quant-iT dsDNA HS assay.The libraries, 2× 100 PE lanes, were sequenced on the Illumina HiSeq 2000/2500 platform using v3 chemistry and HiSeq Control Software version 2.0.10.
Alignment of strand-specific RNA-seq data
Illumina paired-end RNA sequencing data was aligned to GRCh37-lite genome-plus-junctions using BWA (version 0.5.7)49,59. This reference is a combination of GRCh37-lite assembly and exon–exon junction sequences with coordinates defined based on transcripts in Ensembl (v61), Refseq and known genes from the UCSC genome browser (both were downloaded from UCSC in November 2011; The GRCh37-lite assembly is available at http://www.bcgsc.ca/downloads/genomes/9606/hg19/1000genomes/bwa_ind/genome). BWA “aln” and “sampe” were run with default parameters, except for the inclusion of the (-s) option to disable the Smith-Waterman alignment, which is unsuitable for insert size distribution in paired-end RNA-seq data. Finally, reads failing the Illumina chastity filter are flagged with a custom script, and duplicated reads were flagged with Picard Tools (version 1.31). After the alignment, the junction-aligned reads that mapped to exon–exon junctions were repositioned to the genome as large-gapped alignments and tagged with “ZJ:Z”59.
Differential expression analysis of RNA-seq data
We compared the expression values (RPKM) of genes in the primary and recurrent tissues of each tumour with data in both compartments (n = 7 patients). A gene was considered differentially expression when the absolute difference between compartments was greater than 10 and the log2 fold-change was greater than 2. Gene sets enrichment analysis was run on differentially expressed genes that were observed in at least two patients by subgroup, using mSigDB60.
Extended Data
Extended Data Figure 1. Microneurosurgical resection and CT guided multi-fractionated craniospinal radiotherapy in a Shh mousemodel of medulloblastoma.
a, Under general anaesthesia, Ptch+/−/Math1-SB11/T2Onc mice with symptomatic medulloblastoma underwent microneurosurgical posterior fossa craniotomy and subtotal tumour removal (n = 38), followed by post-operative care and monitoring. b, Subsequently, post-operative mice are recurrently anaesthetized, and receive multi-fractionated cranial and spinal cord irradiation in 18 fractions for a total of 36 Gy over a period of four weeks. Radiation is delivered under computed tomography (CT) guidance using custom-made mouse beds and collimators in order to precisely target the entire craniospinal axis. c, Mice that completed the entire course of craniospinal radiation were cured of disease in 39% of cases (7/18), while the remainder had to be euthanized as they recurred locally and/or with leptomeningeal metastases (61%, 11/18). Histology (haematoxylin and eosin staining) at the time of autopsy is shown. d, Extent of overlap of primary, local recurrences and metastatic recurrences initiator genes as predicted by a per-mouse driver modelling approach. e, Clonal transposon insertions in Trp53, Tcf4 and Arid1b disrupt the coding sequence of the gene. Sense orientation insertions are illustrated in green, antisense insertions in red. f, Insertion-site end-point PCR demonstrates Trp53 insertions that are clonal in the recurrence, but present only in a subclone of the matched primary tumour or completely absent. Three levels of input DNA were used for each sample (1×, 5× and 25×). g, Mice treated with microneurosurgical resection and craniospinal radiation, whose tumours show Trp53 gCIS insertions in the local recurrence show a trend for a shorter survival than similarly treated mice without Trp53 insertions (log-rank test; P = 0.054; n = 10). h, Drosophila brain tumours are induced by expressing dpn in the neural stem cell lineage using insc-Gal4. In response to a systemic 40 Gy irradiation at late third instar stage, overexpressing a dominant negative form of Drosophila p53, p53R159N, resulted in moderately increased mitosis in tumour cells labelled by the membrane GFP (mCD8–GFP), scale bar, 50 µm.
Extended Data Figure 2. Subclonal events in primary mouse tumours become clonal at recurrence.
a, Naive tumours from Ptch+/−, Ptch+/−/Trp53+/− or Ptch+/−/Trp53−/− germline mutant mice were analysed by immunohistochemical staining for nuclear p21 (upper panels), demonstrating decreased nuclear p21 expression due to Trp53 pathway dysfunction. Tumours with Trp53 damaging gCIS insertions at recurrence (03-04-11 and 06-28-11) also show decreased immunohistochemical staining for nuclear p21 staining (lower panels), when compared to a recurrent tumour without gCIS Trp53 insertions (02-23-11w) (scale bars, 25 µm and 50 µm as indicated). b, Relative dominance of driver events is shown in one individual tumour where Tead1 is detectable in both primary tumour sample and at recurrence. c, d, Clonal insertions in the local and metastatic recurrences that were found at a subclonal level in the matching primary tumours are shown by mouse. In each case, the number of insertions with evidence for expansion from a subclone of the primary is shown as a proportion (red bar) of the total number of considered events. Green and blue bars depict the proportion of the total number of considered events that were found in local and metastatic recurrences, respectively. The grey bar indicates the proportion of insertions that are also found in an unrelated Sleeping Beauty library of similar depth. We narrowed the analysis on matching primary recurrences with at least 1 clonal insertion in common. This excluded 3 local recurrence cases and 6 metastatic recurrence cases that had no overlap between clonal insertions in the primary and clonal insertions in the matching local recurrences (black stars). c, Local recurrences display statistical support for subclonal derivation from the primary tumours (P = 0.041; n = 7; Mann–Whitney U-test). d, Metastatic recurrences instead show a limited extent of overlap with the matching primaries that does not reach statistical significance (P = 0.298; n = 5; Mann–Whitney U-test). e, Box plot comparing the extent of overlap between primary/local recurrences versus primary/metastatic recurrences, local recurrences (with at least 1 clonal insertion in common with the primary) show a trend for higher evidence of subclonal derivation from their matched primaries than metastatic recurrences (P = 0.051, Mann–Whitney U-test, centre lines show the medians; box limits indicate the 25th and 75th percentiles; whiskers extend 1.5 times the interquartile range from the 25th and 75th percentiles, samples are represented by dots. n = 7 and 5 sample points).
Extended Data Figure 3. Subclonal events in primary human tumours become clonal at recurrence.
The proportion of somatic SNVs in the primary and recurrent disease compartments of 15 patients with matched germline is shown as a function of clonality. Black indicates homozygous events, purple indicates clonal SNVs, and subclonal SNVs are shown in green, where lighter shades correspond to less abundant subpopulations. On average, we observe a 1.9-fold increase in the proportion of clonal and homozygous events across the cohort (Student’s t-test; P value = 8.7 × 10⁻³, n = 15).
Extended Data Figure 4. Altered spectra of somatic SNVs when comparing therapy-naive to recurrent tumours.
a, Mutations in each tumour sample (n = 15) were classified based on their sequence context, and clustered into signatures that represent four known mutational processes. Signature A is the age-related signature observed in most tumour types (deamination of methyl-C). Signature B is characterized by C > A and C > T mutations without a strict context requirement. Signatures C and D respectively resemble the MSI-L and MSI-H signatures that correlate with low (MSI-L) or high (MSI-H) microsatellite instability. b, The contribution of each mutational process to each primary and recurrent tumour is summarized by patient. Recurrent tumours show a shift away from signature A, and an increased prevalence of signature B and signature D. *** P < 0.001, chi-squared test denotes significantly different distributions; NS denotes not significant. All tumours shifted mutational signatures at the time of recurrence, for a and b, n = 15. c, d, The number c, and frequency d, of transversion mutations is summarized in therapy-naive and recurrent samples. Significant increases in the number and frequency of transversions is most strongly observed in local recurrences, and to a lesser extent in metastatic recurrences. P < 0.05, Wilcoxon rank-sum test. e, Breakdown of transversion (Tv) and transition (Ts) mutations in therapy-naive and recurrent samples does not show a significant trend in specific nucleotide changes. Centre lines show the medians; box limits indicate the 25th and 75th percentiles; whiskers extend up to 1.5 times the interquartile range (from the 25th to the 75th percentiles), and data points beyond the whiskers are outliers represented by dots. For c, d and e, n = 13, n = 7 and n = 6, respectively.
Extended Data Figure 5. Compartment-specific driver and druggable events in human tumours.
a, High-level TERT amplification in the primary tumour of patient MB-REC-14 is absent in the recurrent sample. b, Chromothripsis involving the MYC locus is specific to the recurrent tumour on patient MB-REC-09 (P value = 3.97 × 10⁻⁷). c, Genes with defined interactions to neoplastic drugs (DGIdb http://dgidb.genome.wustl.edu/). The majority of patients (n = 15; with matched or parental germline) have distinct druggable targets in the naive versus post-therapy tumour samples. Bolded gene names indicate the presence of damaging mutations that are clonal (versus subclonal events in lighter colours), underlined gene names indicate copy number aberrations (for example, loss at the TP53 locus), and italicized gene names indicate structural rearrangements.
Extended Data Figure 6. Clonal lineage evolution post-therapy in human tumours.
a, Subpopulations of cells in each primary and recurrent tumour were identified using the EXPANDS algorithm, based on somatic SNVs and copy number gains and losses in each sample. Each subpopulation is thus distinguished by (1) a unique combination of somatic aberrations, which are (2) present in a particular subset of cells. Phylogenetic relationships between the primary (lowercase red letter labels) and recurrent (uppercase blue letter labels) tumour subpopulations indicate that in a majority of cases the recurrent tumour lineages are derived from only one lineage in the primary tumour, while only a small proportion of recurrent tumours had a more intermediate similarity to the primary tumour. b, The Shannon Index (SI) of each tumour is calculated using the cellular prevalence of the subpopulations defined by EXPANDS. Increasing values between the primary versus recurrent compartments indicate an increase in tumour heterogeneity (two tailed, paired t-test; P value = 0.029, Black lines show the medians; white lines represent individual data points; polygons represent the estimated density of the data). c, Clonal evolution between therapy-naive and matched recurrent tumours was assayed through ultra-deep sequencing (> 1,500×) of somatic mutations, and analysed using PyClone. Cellular frequencies of clones (y axis) are scaled by the number of mutations in each clone. Ancestral high-frequency clones present in both compartments indicate a common cell of origin in every case. Lower-frequency mutation clusters in the primary tumour indicate clones that subsequently expand to dominance in the recurrent tumour (blue lines). Higher frequency clusters in the primary tumour that are absent or extremely subclonal at the time of recurrence (red lines) indicate therapy-sensitive clones. The number of mutations studied that support each type of event are indicated in the inset box.
Extended Data Figure 7. Subclonal expansion of rare (<5%) SNVs in the primary tumour to clonal dominance in the recurrent compartment.
a, Deep amplicon sequencing was used to profile 20 patients with clonal SNVs restricted to their recurrent tumours as determined by 30× WGS data. Many ‘recurrence specific’ SNVs (blue) were found in a very minor subclone (< 5%) of the primary tumour (red) when studied by deep amplicon sequencing. Clonal SNVs (allele frequency >15%) in recurrent tumours that had >1 read supporting an alternate base in the primary tumour are shown by patient. In each case, the number of events with evidence for expansion from a clone present at <5% is shown as a proportion (red bar) of the total number of considered events (blue bar). b, Evidence for clonal expansion at recurrence of clones present at <5% in the untreated tumour was observed in 16/20 patients, indicating that clonal selection is common after therapy for medulloblastoma. The extent of clonal selection (blue > red) varies across medulloblastoma cases, with prominent clonal selection in some cases (MB-REC-30), and more extreme divergence in others (MB-REC-23). c, d, Deep amplicon sequencing of clonal SNVs from both a first recurrence (dark blue), and a subsequent second recurrence (light blue) of patient MB-REC-31 reveals that clonal SNVs present at recurrence but absent from a 30× WGS profile of the untreated tumour (red) were indeed present at very low prevalence (~1/1,000) in the primary sample, indicating striking clonal expansion after initial treatment of the untreated tumour (c; AF, allele frequency; NA, not available). This is illustrated in panel d, which depicts the allelic frequency of a very low-prevalence PIK3CA mutation in the primary tumour that reaches clonal levels post-therapy.
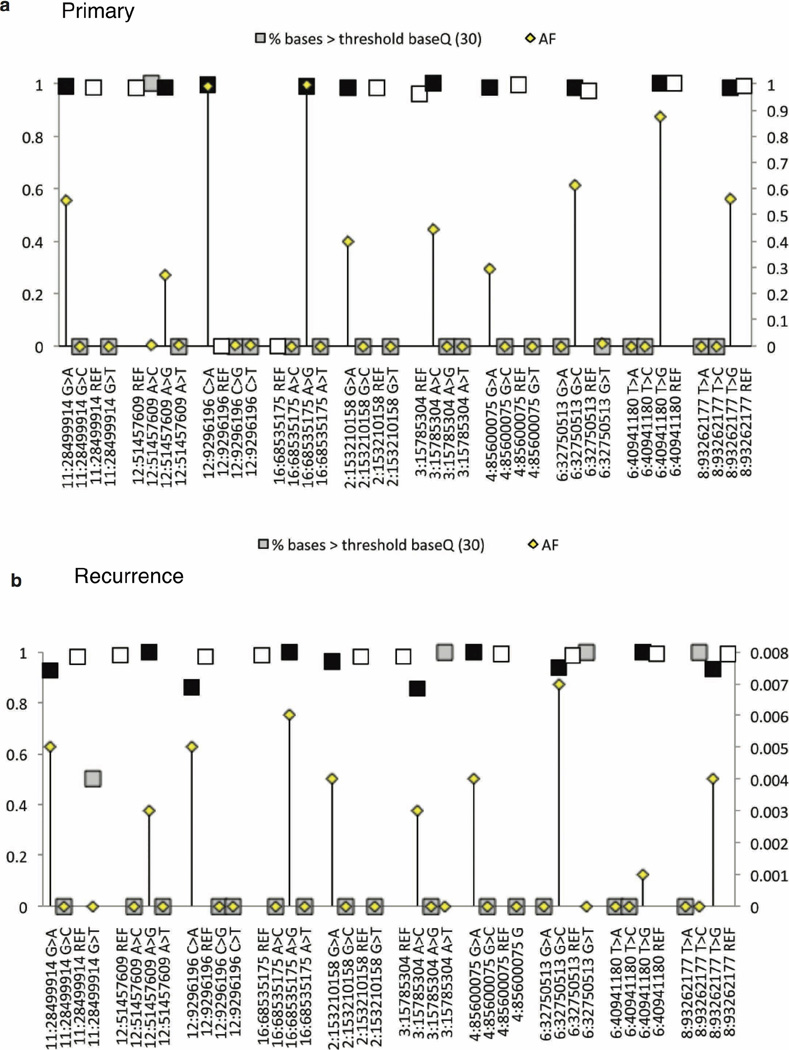
Extended Data Figure 8. Base quality assessment of reference and alternate alleles at SNVs with clonal or rare allelic frequencies.
a, b, To determine whether low-frequency (<5%) base calls were SNVs or sequencing errors, we analysed the distribution of base quality (baseQ) values for each alternate base called. This plot shows the allele frequencies (AF; secondary y axis) and the proportion of supporting reads with baseQ values >30 (primary y axis) for a subset of SNVs in the recurrent tumour of MB-REC-03 (x axis). At all positions, and in both the recurrent (a), and primary (b), tumours, we observe a high proportion (~100%) of reads with baseQ >30 at both the mutant (black square) and wild-type allele (white squares). Grey squares indicate alleles categorized as sequencing errors. Errors have low allelic frequencies (in many cases are just one read) and a much smaller proportion of reads with baseQ values >30. In the primary tumour, the baseQ and AF values match the pattern observed in the recurrent tumour, indicating that these calls represent true SNVs present at very low frequencies. Sequencing errors in the primary sample have the same base distribution as sequencing errors in the recurrent tumour sample.
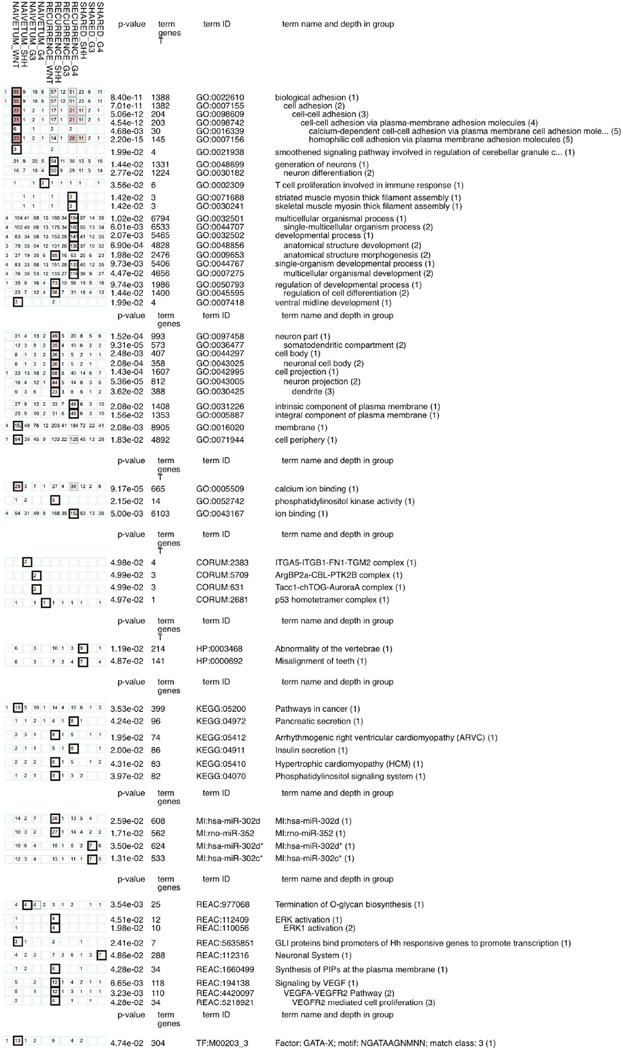
Extended Data Figure 9. Pathway enrichment results for genes recurrently aberrant in the primary tumour or recurrent tumour cohorts.
Pathway enrichment analysis of gene lists derived from the integrative analysis of CNVs (gain or loss of 2 or more copies), SNVs, indels, and structural variants specific to the primary or recurrent tumours of each patient was performed using g:Cocoa.
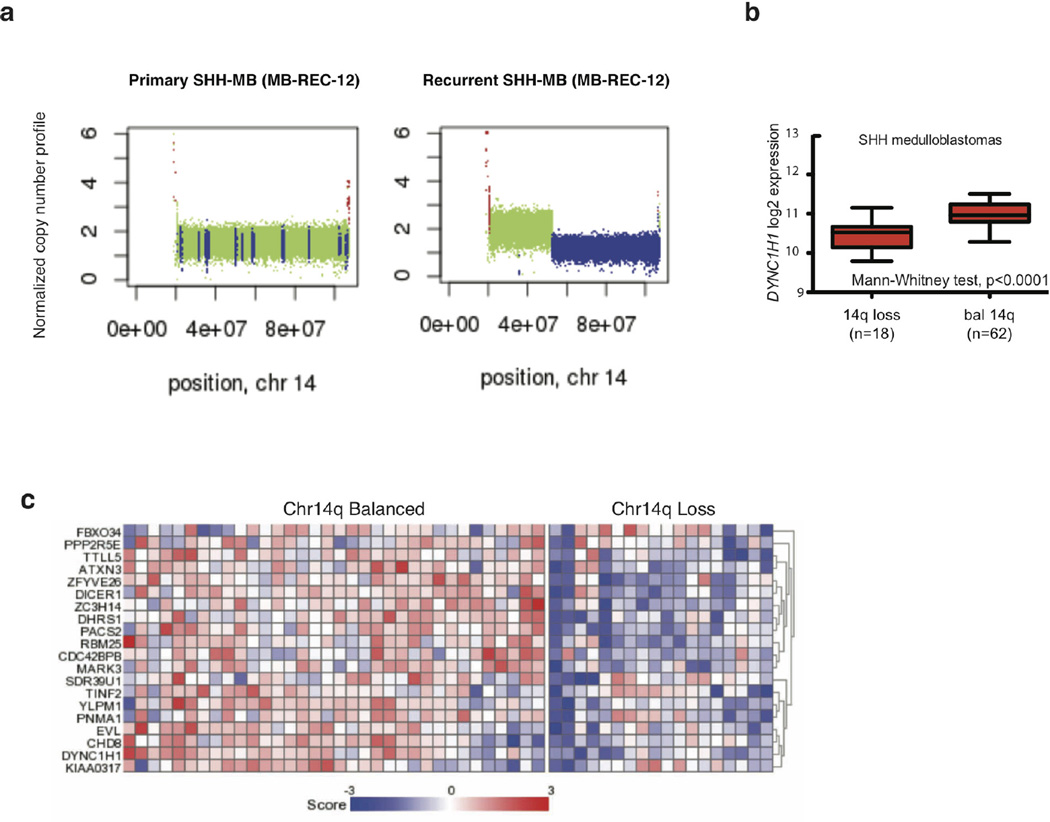
Extended Data Figure 10. Genetic events in recurrent human medulloblastoma converge on specific signalling pathways.
a, Copy number profile of MB-REC-12 therapy-naive (WT, green, left panel) and recurrent tumour (loss, blue, lower panel), showing recurrence-specific loss of chr14q. b, DYNC1H1 expression is reduced in Shh patients with chr14q loss (n = 18/80, Mann–Whitney test, P < 0.0001, centre lines show the medians; box limits indicate the 25th and 75th percentiles; whiskers extend 1.5 times the interquartile range from the 25th and 75th percentiles). c, Expression of the chr14 signature genes discriminating between chr14q balanced (n = 34) and chr14q loss (n = 18) in the Boston cohort of Shh medulloblastoma samples.
Supplementary Material
Acknowledgments
The MAGIC project is financially supported by: Genome Canada, Genome BC, Terry Fox Research Institute, Ontario Institute for Cancer Research, Pediatric Oncology Group Ontario, Funds from ‘The Family of Kathleen Lorette’ and the Clark H. Smith Brain Tumour Centre, Montreal Children’s Hospital Foundation, Hospital for Sick Children: Sonia and Arthur Labatt Brain Tumour Research Centre, Chief of Research Fund, Cancer Genetics Program, Garron Family Cancer Centre, B.R.A.I.N. Child, and BC Childhood Cancer Parents Association. M.D.T. is also supported by a Stand Up To Cancer St. Baldrick’s Pediatric Dream Team Translational Research Grant (SU2C-AACR-DT1113). Stand Up To Cancer is a program of the Entertainment Industry Foundation administered by the American Association for Cancer Research. M.D.T. is supported by The Canadian Cancer Society Research Institute, The Garron Family Chair in Childhood Cancer Research, and grants from the Cure Search for Children’s Cancer Foundation, the National Institutes of Health (R01CA148699 R01CA159859), The Pediatric Brain Tumour Foundation, The Terry Fox Research Institute, Brainchild and The McLaughlin Centre at the University of Toronto. M.D.T. is also supported by the Swifty Foundation. L.G. was supported by the Davis M. Ferguson Memorial Fund at ABTA. Alex’s Lemonade Stand Young Investigator Award supported V.R. This study was conducted with the support of the Ontario Institute for Cancer Research through funding provided by the Government of Ontario. This work was also supported by a Program Project Grant from the Terry Fox Research Institute, and a Grand Challenge Award from CureSearch for Children’s Cancer. Additionally, this work was supported by the PedBrain Tumour Project contributing to the International Cancer Genome Consortium, funded by German Cancer Aid (109252) and by the German Federal Ministry of Education and Research (BMBF, grants 01KU1201A, MedSys 0315416C and NGFNplus 01GS0883). Funding by the German Childhood Cancer Foundation (Deutsche Kinderkrebsstiftung) to S.M.P., G.F. and T.P. The study was also financed by the Hungarian Brain Research Program Grant No. KTIA_13_NAP-A-V/3. and NAP-A-II/7. A.K. was supported by the János Bolyai scholarship of the Hungarian Academy of Sciences. E.G.V.M. was supported by NIH R01 grants CA163722 and NS096236, and St. Baldrick’s and Cure Childhood Cancer Foundations. We would like to acknowledge R. P. Hill (Ontario Cancer Institute), the Labatt Brain Tumour Research Centre Tumour and Tissue Repository, which is supported by B.R.A.I.N. Child and Megan’s Walk. M.R. is supported by a fellowship from the Dr. Mildred Scheel Foundation for Cancer Research/German Cancer Aid. F.M.G.C. is supported by the Stephen Buttrum Brain Tumour Research Fellowship, granted by Brain Tumour Foundation of Canada. V.R. is supported by a CIHR fellowship and an Alberta Innovates-Health Solutions Clinical Fellowship. We would like to thank the Toronto Centre for Phenogenomics for animal housing and veterinary support, and the Preclinical Core II and animal research facility at STTARR (Spatiotemporal Targeting and Amplification of Radiation Response) in Toronto for assistance with CT-guided radiation experiments. We would like to thank Z. Wang for technical help with IHC, S. Archer for technical writing and C. Smith for artwork.
Footnotes
Supplementary Information is available in the online version of the paper.
Author Contributions A.S.M., L.G., and M.D.T. led the study. L.G. planned and carried out in vivo and in vitro experiments and analyses, and performed a subset of bioinformatic analyses. A.S.M. supervised the RNA-seq and WGS experiments, led and executed bioinformatic analyses. D.J.H.S. performed bioinformatics analysis of mutation signatures. S.Z. developed and implemented the computational method of finding initiating events in mouse tumours. X.H. developed the Drosophila brain tumour model and performed imaging of Drosophila brains. P.S. assisted with mouse library preparation and bioinformatics analysis. M.R. and V.R. performed bioinformatics analyses on DYNC1H1 and 14q loss. F.M.G.C. generated visualizations of structural rearrangements. P.E.L. and S.J. developed the radiotherapy schedule for the mouse model and designed the custom made collimators, beds, and stages for mouse CSI. K.Z. assisted with library preparation. B.L. extracted nucleic acids, managed the biobanking, and maintained the patient database. N.T., Y.M., and K.L.M. supervised bioinformatics analyses at the Genome Sciences Center, including sequence alignment, copy number analysis, and SNV and structural variant calling. Y.L., C.M. and E.M. performed bioinformatics analysis of human sequencing and deep-sequencing data. K.T. and T.Z. supervised and implemented the targeted deep-sequencing work. K.S. performed PyClone analysis. A.J.L.R. and S.S. designed and implemented PyClone, and supervised its use. H.F., S.M-L., J.R., and T.P. assisted with bioinformatic analyses. J.L., and L.Q., assisted with animal care, and N.K., B.L.H., J.J.Y.L., L.K.D., Xin W., S.C.M., A.M., K.A.M., C.N., John P., A.R., and Y.Y.T. provided technical support. Xiaochong W. generated the transgenic mouse model and offered technical advice. A.A., M.B., Y.S.N.B., R.C., Y.C., E.C., R.C., N.D., A.H., D.L., H.I.L., W.L., M.M., P.P., J.Q.Q., J.E.S., A.T., T.W., I.B., and Y.Z., led and performed RNA-seq and WGS library preparation and sequencing experiments and performed data analyses. A.K., D.T.W.J., M.K., P.A.N., and S.M.P. at DKFZ performed the sequencing of four patients’ sets. C.C.F., José P., S.N., T.S., M.G., I.F.P., R.L.H., X.-N.Li., A.E.B., D.W.F., A.W.W., T.K., T.T., V.P.C., Y.-J.C., C.H., D.L., J.H.W., J.H.G. Jr, D.S.S., L.M., U.S., J.S., K.Z., S.P., O.A., S.E.D., D.P.C.T., C.G.C., H.W., A.R.H., W.I., T.J.M., J.J.O., E.G.V.M., J.-Y.L., K.-C.W., S.-K.K., B.-K.C., Y.S.R., S.B., J.C.L., S.C.C., C.G.E., M.K.C., R.J.P., M.M., M.L.G., N.J., and S.M.P. obtained the patient samples and clinical details that made the study possible. T.P., G.F., S.T., U.B., U.T., C.E.H., P.D., E.B., J.T.R., R.J.W.-R., W.A.W., L.S.C., A.J.D., A.K., D.T.W.J., M.K., P.A.N., S.M.P., D.A.L., A.J.M., R.A.M., N.J., G.D.B., S.J.M.J., and D.M. provided valuable input regarding study design, data analysis, and interpretation of results. A.S.M., L.G., M.R., S.Z., G.D.B., M.A.M. and M.D.T. wrote the manuscript. M.A.M. and M.D.T. provided financial and technical infrastructure and oversaw the study. M.A.M. and M.D.T. are joint senior authors and project co-leaders.
The authors declare no competing financial interests.
References
- 1.Hovestadt V, et al. Decoding the regulatory landscape of medulloblastoma using DNA methylation sequencing. Nature. 2014;510:537–541. doi: 10.1038/nature13268. [DOI] [PubMed] [Google Scholar]
- 2.Jones DT, et al. Dissecting the genomic complexity underlying medulloblastoma. Nature. 2012;488:100–105. doi: 10.1038/nature11284. [DOI] [PMC free article] [PubMed] [Google Scholar]
- 3.Kool M, et al. Genome sequencing of SHH medulloblastoma predicts genotype-related response to smoothened inhibition. Cancer Cell. 2014;25:393–405. doi: 10.1016/j.ccr.2014.02.004. [DOI] [PMC free article] [PubMed] [Google Scholar]
- 4.Northcott PA, et al. Enhancer hijacking activates GFI1 family oncogenes in medulloblastoma. Nature. 2014;511:428–434. doi: 10.1038/nature13379. [DOI] [PMC free article] [PubMed] [Google Scholar]
- 5.Northcott PA, et al. Subgroup-specific structural variation across 1,000 medulloblastoma genomes. Nature. 2012;488:49–56. doi: 10.1038/nature11327. [DOI] [PMC free article] [PubMed] [Google Scholar]
- 6.Pugh TJ, et al. Medulloblastoma exome sequencing uncovers subtype-specific somatic mutations. Nature. 2012;488:106–110. doi: 10.1038/nature11329. [DOI] [PMC free article] [PubMed] [Google Scholar]
- 7.Wu X, et al. Clonal selection drives genetic divergence of metastatic medulloblastoma. Nature. 2012;482:529–533. doi: 10.1038/nature10825. [DOI] [PMC free article] [PubMed] [Google Scholar]
- 8.Moxon-Emre I, et al. Impact of craniospinal dose, boost volume, and neurologic complications on intellectual outcome in patients with medulloblastoma. J. Clin. Oncol. 2014;32:1760–1768. doi: 10.1200/JCO.2013.52.3290. [DOI] [PubMed] [Google Scholar]
- 9.Northcott PA, Korshunov A, Pfister SM, Taylor MD. The clinical implications of medulloblastoma subgroups. Nature Rev. Neurol. 2012;8:340–351. doi: 10.1038/nrneurol.2012.78. [DOI] [PubMed] [Google Scholar]
- 10.Northcott PA, et al. Medulloblastomics: the end of the beginning. Nature Rev. Cancer. 2012;12:818–834. doi: 10.1038/nrc3410. [DOI] [PMC free article] [PubMed] [Google Scholar]
- 11.Ramaswamy V, et al. Recurrence patterns across medulloblastoma subgroups: an integrated clinical and molecular analysis. Lancet Oncol. 2013;14:1200–1207. doi: 10.1016/S1470-2045(13)70449-2. [DOI] [PMC free article] [PubMed] [Google Scholar]
- 12.Anderson K, et al. Genetic variegation of clonal architecture and propagating cells in leukaemia. Nature. 2011;469:356–361. doi: 10.1038/nature09650. [DOI] [PubMed] [Google Scholar]
- 13.Burrell RA, McGranahan N, Bartek J, Swanton C. The causes and consequences of genetic heterogeneity in cancer evolution. Nature. 2013;501:338–345. doi: 10.1038/nature12625. [DOI] [PubMed] [Google Scholar]
- 14.Ding L, et al. Clonal evolution in relapsed acute myeloid leukaemia revealed by whole-genome sequencing. Nature. 2012;481:506–510. doi: 10.1038/nature10738. [DOI] [PMC free article] [PubMed] [Google Scholar]
- 15.Greaves M, Maley CC. Clonal evolution in cancer. Nature. 2012;481:306–313. doi: 10.1038/nature10762. [DOI] [PMC free article] [PubMed] [Google Scholar]
- 16.Landau DA, et al. Evolution and impact of subclonal mutations in chronic lymphocytic leukemia. Cell. 2013;152:714–726. doi: 10.1016/j.cell.2013.01.019. [DOI] [PMC free article] [PubMed] [Google Scholar]
- 17.Mullighan CG, et al. Genomic analysis of the clonal origins of relapsed acute lymphoblastic leukemia. Science. 2008;322:1377–1380. doi: 10.1126/science.1164266. [DOI] [PMC free article] [PubMed] [Google Scholar]
- 18.Johnson BE, et al. Mutational analysis reveals the origin and therapy-driven evolution of recurrent glioma. Science. 2014;343:189–193. doi: 10.1126/science.1239947. [DOI] [PMC free article] [PubMed] [Google Scholar]
- 19.Shah SP, et al. Mutational evolution in a lobular breast tumour profiled at single nucleotide resolution. Nature. 2009;461:809–813. doi: 10.1038/nature08489. [DOI] [PubMed] [Google Scholar]
- 20.Gerlinger M, Swanton C. How Darwinian models inform therapeutic failure initiated by clonal heterogeneity in cancer medicine. Br. J. Cancer. 2010;103:1139–1143. doi: 10.1038/sj.bjc.6605912. [DOI] [PMC free article] [PubMed] [Google Scholar]
- 21.Eirew P, et al. Dynamics of genomic clones in breast cancer patient xenografts at single-cell resolution. Nature. 2015;518:422–426. doi: 10.1038/nature13952. [DOI] [PMC free article] [PubMed] [Google Scholar]
- 22.Kreso A, et al. Variable clonal repopulation dynamics influence chemotherapy response in colorectal cancer. Science. 2013;339:543–548. doi: 10.1126/science.1227670. [DOI] [PMC free article] [PubMed] [Google Scholar]
- 23.Notta F, et al. Evolution of human BCR–ABL1 lymphoblastic leukaemia-initiating cells. Nature. 2011;469:362–367. doi: 10.1038/nature09733. [DOI] [PubMed] [Google Scholar]
- 24.Mumert M, et al. Functional genomics identifies drivers of medulloblastoma dissemination. Cancer Res. 2012;72:4944–4953. doi: 10.1158/0008-5472.CAN-12-1629. [DOI] [PMC free article] [PubMed] [Google Scholar]
- 25.Brett BT, et al. Novel molecular and computational methods improve the accuracy of insertion site analysis in Sleeping Beauty-induced tumors. PLoS ONE. 2011;6:e24668. doi: 10.1371/journal.pone.0024668. [DOI] [PMC free article] [PubMed] [Google Scholar]
- 26.Collier LS, Carlson CM, Ravimohan S, Dupuy AJ, Largaespada DA. Cancer gene discovery in solid tumours using transposon-based somatic mutagenesis in the mouse. Nature. 2005;436:272–276. doi: 10.1038/nature03681. [DOI] [PubMed] [Google Scholar]
- 27.Dupuy AJ, Akagi K, Largaespada DA, Copeland NG, Jenkins NA. Mammalian mutagenesis using a highly mobile somatic Sleeping Beauty transposon system. Nature. 2005;436:221–226. doi: 10.1038/nature03691. [DOI] [PubMed] [Google Scholar]
- 28.Zhukova N, et al. Subgroup-specific prognostic implications of TP53 mutation in medulloblastoma. J. Clin. Oncol. 2013;31:2927–2935. doi: 10.1200/JCO.2012.48.5052. [DOI] [PMC free article] [PubMed] [Google Scholar]
- 29.Zhu S, et al. The bHLH repressor Deadpan regulates the self-renewal and specification of Drosophila larval neural stem cells independently of Notch. PLoS ONE. 2012;7:e46724. doi: 10.1371/journal.pone.0046724. [DOI] [PMC free article] [PubMed] [Google Scholar]
- 30.Ollmann M, et al. Drosophila p53 is a structural and functional homolog of the tumor suppressor p53. Cell. 2000;101:91–101. doi: 10.1016/S0092-8674(00)80626-1. [DOI] [PubMed] [Google Scholar]
- 31.Fraley C, Raftery EA, Murphy TB, Scrucca L. mclust Version 4 for R. Normal Mixture Modeling for Model-Based Clustering, Classification, and Density Estimation. 2012 Technical Report No. 597. [Google Scholar]
- 32.Remke M, et al. TERT promoter mutations are highly recurrent in SHH subgroup medulloblastoma. Acta Neuropathol. 2013;126:917–929. doi: 10.1007/s00401-013-1198-2. [DOI] [PMC free article] [PubMed] [Google Scholar]
- 33.Govind SK, et al. ShatterProof: operational detection and quantification of chromothripsis. BMC Bioinformatics. 2014;15:78. doi: 10.1186/1471-2105-15-78. [DOI] [PMC free article] [PubMed] [Google Scholar]
- 34.Griffith M, et al. DGIdb: mining the druggable genome. Nature Methods. 2013;10:1209–1210. doi: 10.1038/nmeth.2689. [DOI] [PMC free article] [PubMed] [Google Scholar]
- 35.McGranahan N, Swanton C. Perspective biological and therapeutic impact of intratumor heterogeneity in cancer evolution. Cancer Cell. 2015;27:15–26. doi: 10.1016/j.ccell.2014.12.001. [DOI] [PubMed] [Google Scholar]
- 36.Andor N, Harness JV, Müller S, Mewes HW, Petritsch C. EXPANDS: expanding ploidy and allele frequency on nested subpopulations. Bioinformatics. 2014;30:50–60. doi: 10.1093/bioinformatics/btt622. [DOI] [PMC free article] [PubMed] [Google Scholar]
- 37.Maley CC, et al. Genetic clonal diversity predicts progression to esophageal adenocarcinoma. Nature Genet. 2006;38:468–473. doi: 10.1038/ng1768. [DOI] [PubMed] [Google Scholar]
- 38.Roth A, et al. PyClone: statistical inference of clonal population structure in cancer. Nature Methods. 2014;11:396–398. doi: 10.1038/nmeth.2883. [DOI] [PMC free article] [PubMed] [Google Scholar]
- 39.Hill RM, et al. Combined Myc and p53 defects emerge at medulloblastoma relapse and define rapidly progressive, therapeutically targetable disease. Cancer Cell. 2015;27:72–84. doi: 10.1016/j.ccell.2014.11.002. [DOI] [PMC free article] [PubMed] [Google Scholar]
- 40.Wang X, et al. Medulloblastoma subgroups remain stable across primary and metastatic compartments. Acta Neuropathol. 2015;129:449–457. doi: 10.1007/s00401-015-1389-0. [DOI] [PMC free article] [PubMed] [Google Scholar]
- 41.Aparicio S, Caldas C. The implications of clonal genome evolution for cancer medicine. N. Engl. J. Med. 2013;368:842–851. doi: 10.1056/NEJMra1204892. [DOI] [PubMed] [Google Scholar]
- 42.Maley CC, Reid BJ, Forrest S. Cancer prevention strategies that address the evolutionary dynamics of neoplastic cells: simulating benign cell boosters and selection for chemosensitivity. Cancer Epidemiol. Biomarkers Prev. 2004;13:1375–1384. [PubMed] [Google Scholar]
References
- 43.Clarkson R, et al. Characterization of image quality and image-guidance performance of a preclinical microirradiator. Med. Phys. 2011;38:845–856. doi: 10.1118/1.3533947. [DOI] [PMC free article] [PubMed] [Google Scholar]
- 44.Ma CM, et al. AAPM protocol for 40–300 kV X-ray beam dosimetry in radiotherapy and radiobiology. Med. Phys. 2001;28:868–893. doi: 10.1118/1.1374247. [DOI] [PubMed] [Google Scholar]
- 45.Li H, Durbin R. Fast and accurate short read alignment with Burrows–Wheeler transform. Bioinformatics. 2009;25:1754–1760. doi: 10.1093/bioinformatics/btp324. [DOI] [PMC free article] [PubMed] [Google Scholar]
- 46.McKenna A, et al. The genome analysis toolkit: a MapReduce framework for analyzing next-generation DNA sequencing data. Genome Res. 2010;20:1297–1303. doi: 10.1101/gr.107524.110. [DOI] [PMC free article] [PubMed] [Google Scholar]
- 47.Cingolani P, et al. Using Drosophila melanogaster as a model for genotoxic chemical mutational studies with a new program, SnpSift. Front. Genet. 2012;3 doi: 10.3389/fgene.2012.00035. http://dx.doi.org/10.3389/fgene.2012.00035. [DOI] [PMC free article] [PubMed] [Google Scholar]
- 48.Saunders CT, et al. Strelka: Accurate somatic small-variant calling from sequenced tumour-normal sample pairs. Bioinformatics. 2012;28:1811–1817. doi: 10.1093/bioinformatics/bts271. [DOI] [PubMed] [Google Scholar]
- 49.Li H, et al. The Sequence Alignment/Map format and SAMtools. Bioinformatics. 2009;25:2078–2079. doi: 10.1093/bioinformatics/btp352. [DOI] [PMC free article] [PubMed] [Google Scholar]
- 50.Fischer A, Illingworth CJ, Campbell PJ, Mustonen V. EMu: probabilistic inference of mutational processes and their localization in the cancer genome. Genome Biol. 2013;14:R39. doi: 10.1186/gb-2013-14-4-r39. [DOI] [PMC free article] [PubMed] [Google Scholar]
- 51.Jones SJ, et al. Evolution of an adenocarcinoma in response to selection by targeted kinase inhibitors. Genome Biol. 2010;11:R82. doi: 10.1186/gb-2010-11-8-r82. [DOI] [PMC free article] [PubMed] [Google Scholar]
- 52.Shah SP, et al. Integrating copy number polymorphisms into array CGH analysis using a robust HMM. Bioinformatics. 2006;22:431–439. doi: 10.1093/bioinformatics/btl238. [DOI] [PubMed] [Google Scholar]
- 53.Boeva V, et al. Control-FREEC: a tool for assessing copy number and allelic content using next-generation sequencing data. Bioinformatics. 2012;28:423–425. doi: 10.1093/bioinformatics/btr670. [DOI] [PMC free article] [PubMed] [Google Scholar]
- 54.Rozen S, Skaletsky H. Primer3 on the WWW for general users and for biologist programmers. Methods Mol. Biol. 2000;132:365–386. doi: 10.1385/1-59259-192-2:365. [DOI] [PubMed] [Google Scholar]
- 55.Cibulskis K, et al. Sensitive detection of somatic point mutations in impure and heterogeneous cancer samples. Nature Biotechnol. 2013;31:213–219. doi: 10.1038/nbt.2514. [DOI] [PMC free article] [PubMed] [Google Scholar]
- 56.Vanner RJ, et al. Quiescent Sox2+ cells drive hierarchical growth and relapse in sonic hedgehog subgroup medulloblastoma. Cancer Cell. 2014;26:33–47. doi: 10.1016/j.ccr.2014.05.005. [DOI] [PMC free article] [PubMed] [Google Scholar]
- 57.Shih DJH, et al. Cytogenetic prognostication within medulloblastoma subgroups. J. Clin. Oncol. 2014;32:886–896. doi: 10.1200/JCO.2013.50.9539. [DOI] [PMC free article] [PubMed] [Google Scholar]
- 58.Cho Y-J, et al. Integrative genomic analysis of medulloblastoma identifies a molecular subgroup that drives poor clinical outcome. J. Clin. Oncol. 2011;29:1424–1430. doi: 10.1200/JCO.2010.28.5148. [DOI] [PMC free article] [PubMed] [Google Scholar]
- 59.Butterfield YS, et al. JAGuaR: junction alignments to genome for RNA-seq reads. PLoS ONE. 2014;9:e102398. doi: 10.1371/journal.pone.0102398. [DOI] [PMC free article] [PubMed] [Google Scholar]
- 60.Subramanian A, et al. Gene set enrichment analysis: a knowledge-based approach for interpreting genome-wide expression profiles. Proc. Natl Acad. Sci. USA. 2005;102:15545–15550. doi: 10.1073/pnas.0506580102. [DOI] [PMC free article] [PubMed] [Google Scholar]
Associated Data
This section collects any data citations, data availability statements, or supplementary materials included in this article.


