Significance
Too much light can be dangerous for photosynthetic organisms because the simultaneous presence of excitation energy and molecular oxygen, as it occurs in the photosynthetic membranes, may lead to the formation of reactive oxygen species and induce photodamage. To avoid these effects, photosynthetic organisms dissipate a large part of the absorbed energy as heat in a process known as nonphotochemical quenching (NPQ). This process is very complex, and the molecular understanding of its mechanisms in vivo represents a challenge. Here we have developed a “minimal NPQ cell” of the green alga Chlamydomonas reinhardtii. Using these cells, we could check a series of suggestions coming from in vitro studies and obtain new insights on the mechanism of NPQ in this alga.
Keywords: photosynthesis, light-harvesting, nonphotochemical quenching, green algae, thylakoid membranes
Abstract
To avoid photodamage, photosynthetic organisms are able to thermally dissipate the energy absorbed in excess in a process known as nonphotochemical quenching (NPQ). Although NPQ has been studied extensively, the major players and the mechanism of quenching remain debated. This is a result of the difficulty in extracting molecular information from in vivo experiments and the absence of a validation system for in vitro experiments. Here, we have created a minimal cell of the green alga Chlamydomonas reinhardtii that is able to undergo NPQ. We show that LHCII, the main light harvesting complex of algae, cannot switch to a quenched conformation in response to pH changes by itself. Instead, a small amount of the protein LHCSR1 (light-harvesting complex stress related 1) is able to induce a large, fast, and reversible pH-dependent quenching in an LHCII-containing membrane. These results strongly suggest that LHCSR1 acts as pH sensor and that it modulates the excited state lifetimes of a large array of LHCII, also explaining the NPQ observed in the LHCSR3-less mutant. The possible quenching mechanisms are discussed.
Photosynthetic organisms get their energy from light and have developed a series of mechanisms to respond to the changes in light intensity that occur in their natural environment (1, 2). This is particularly important in high-light conditions, as the energy absorbed in excess can induce photodamage, eventually leading to the death of the organism. Photosynthetic organisms are equipped with many pigment–protein complexes, most of which in plants and green algae are members of the light-harvesting complex (Lhc) multigenic family (3). These complexes maximize light absorption in low light, but can easily become overexcited in high light (4), when a large part of the absorbed light cannot be used for charge separation in the reaction centers of the photosystems. Especially when the changes in light intensity are very fast, and thus protein degradation is not an option, photoprotective mechanisms need to be switched on to avoid the formation of singlet oxygen. The most rapid response to high light intensity is the dissipation of a large part of the absorbed energy as heat in a series of processes known as nonphotochemical quenching (NPQ) (1, 5, 6).
The general idea is that the LHCs can switch between a light-harvesting conformation, characterized by a long excited-state lifetime, and a quenched (Q) conformation that shows a shorter lifetime because of the presence of competing de-excitation processes (7). How this switch is induced and the nature of these de-excitation processes is a matter of debate. It is known that NPQ is triggered by low luminal pH, which is a signal for the overexcitation of the membrane; this activates the quenching processes (5, 8), which involves the proteins PsbS (in plants and mosses) (9, 10) and/or light-harvesting complex stress related (LHCSR) (in green algae, mosses, and diatoms) (10–12). The green alga C. reinhardtii has two LHCSR proteins: LHCSR3, the product of the Lhcsr3.1 and Lhcsr3.2 genes, and LHCSR1, encoded by the Lhcsr1 gene. These two proteins have 82% sequence identity (11) and are expressed in stress conditions such as high light (13), but also iron- (14) and sulfur-deficiency (15). However, their transcription is differently regulated; whereas LHCSR3 is only expressed on high light stress in photoautotrophic conditions at ambient CO2, LHCSR1 transcription seems to be mainly controlled by light (16). LHCSR3 is considered the protein mainly responsible for NPQ in C. reinhardtii, as a mutant lacking this protein shows a strong reduction of NPQ (11). LHCSR3 is a pigment-binding protein able to switch in vitro to a Q conformation at low pH (17) because of the protonation of its C terminus (18). No information is available regarding LHCSR1, which has not been purified or reconstituted in vitro. In addition to these proteins, LHCBM1, one of the main components of the major antenna complex LHCII, has also been shown to be important for NPQ in C. reinhardtii (19). The role of de-epoxidation of the carotenoid violaxanthin to zeaxanthin, important for NPQ in other systems (20, 21), is not clear in C. reinhardtii (22): zeaxanthin is not required for the activity of LHCSR3 (17), but in its absence, the levels of NPQ are lower (22).
One of the main obstacles to the complete understanding of NPQ mechanisms resides in the gap between in vitro and in vivo studies. On the one hand, the complexity of the thylakoid membrane makes it very difficult to obtain molecular information from in vivo experiments. On the other hand, a definitive in vitro system for the study of the quenching is not available. Here we have developed a “minimal NPQ cell,” in which we study the effect of the individual NPQ players in the membrane of C. reinhardtii. We show that the presence of LHCII and a small amount of LHCSR1 is sufficient for inducing a very fast and reversible pH-dependent quenching. This system represents an excellent model to study the mechanism of NPQ in cells.
Results
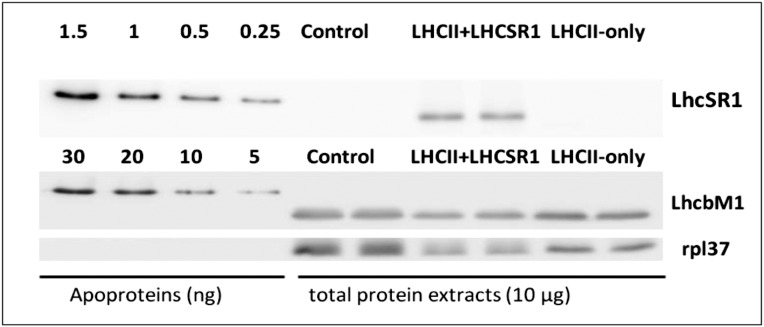
Using a vitamin repressor system, it is possible to completely deplete C. reinhardtii cells of photosystem (PS) I and II core components under normal and high-light conditions (23–25) (Fig. S1A). As shown previously, at the beginning of the treatment, the cells contain all the components of the photosynthetic apparatus and grow normally. After vitamin treatment, the photosynthetic apparatus is degraded, starting with the core complexes of PSI and PSII, and after 6 d in normal light and 3 in high light, the thylakoid membrane of these cells contains mainly LHCII (24, 25) (Fig. S1B). The advantage of these cells compared with PSI- and PSII-less mutants is that they can grow in light and acclimate to different conditions even during the first days of the vitamin treatment, allowing the selective expression of stress-response proteins such as LHCSR. Fig. 1 shows that cells that were grown in normal light conditions do not contain LHCSR proteins; such cells are designated as LHCII-only. Note that these cells contain LHCBM1, the LHCII subunit that has been shown to be important for NPQ in C. reinhardtii (19). In contrast, expression of LHCSR1 (but not of LHCSR3) was observed in cells exposed to high light. The absence of LHCSR3 is expected in these conditions, as this protein was shown to be expressed only in photoautotrophic growth (11). Our data instead indicate that the expression of LHCSR1 is differently controlled, in agreement with the data on the transcripts (16). Expression of LHCSR1 increased during the first 24 h of high light, and then slowly declined (Fig. S1C). After 3 d of high light, the cells contained LHC (mainly LHCII) and LHCSR1 and are designated as LHCII+LHCSR1. To determine the relative amount of LHCSR1 with respect to LHCII, we immunologically quantified LHCII and LHCSR1, using LHCBM1 and LHCSR1 apoproteins expressed in E. coli as references (Fig. 1). The LHCSR1/LHCBM1 ratio was estimated to be 0.050 ± 0.003. Considering that LHCBM1 is only one of the major LHCII proteins (26), we can conclude that LHCSR1 represents less than 5% of the proteins in the membrane.
Fig. S1.
Immunoblot analysis of photosynthetic proteins from cells in high-light conditions during vitamin repression. (A) Three dilutions of cells before treatment (0 h point) and at different times during vitamin treatment, as indicated. (B) LHCII, (C) LHCSR1, and LHCSR3 expression under highlight conditions during vitamin repression. CC-4402 wild-type cells in photoautotrophic condition treated under high light used as control (Cont). Next, 10 µg of total protein extract were loaded in each well. Rpl37 was used as loading control in each blot. All blots are within the linear dynamic range of the antibody.
Fig. 1.
Quantification of the LHCSR1 and LHCBM1 proteins in cells before vitamin treatment (Cont) and in LHCII-only and LHCII+LHCSR cells. The apoproteins overexpressed in E. coli (0.25–5 ng) and in control, LHCII-only, and LHCII+LHCSR1 cells were detected immunologically, using LHCSR1 and LHCBM1 antibodies. Four dilutions of the apoproteins (the quantities in ng loaded on each well are indicated on the figure) and two replicas for the total protein extracts are loaded (10 µg for each well). Rpl37 was used as loading control in each blot. In each blot, the samples derive from the same experiment, and gels/blots were processed in parallel.
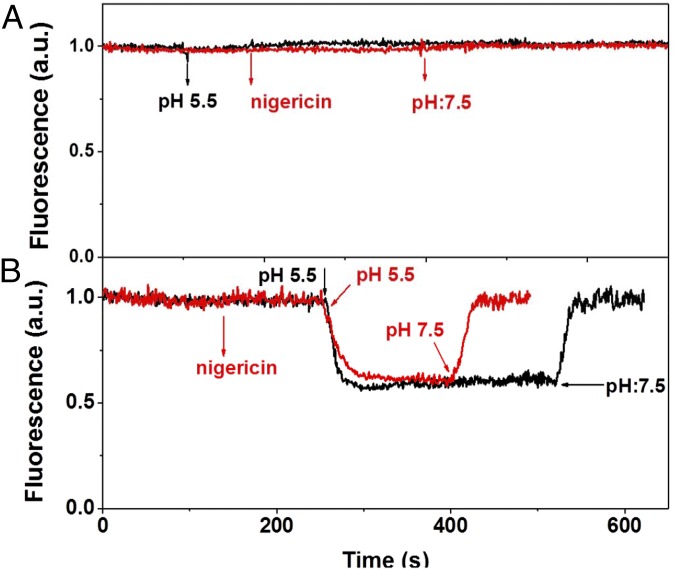
To test the ability of the membranes to respond to pH changes, we measured the fluorescence of the cells at pH 7.5 and 5.5. The fluorescence intensity of the LHCII-only cells is the same at the two pHs (Fig. 2A). To ensure that the result is not a result of the absence of a rapid equilibration of the proton concentration between the medium and the cells and between the stroma and the lumen of the thylakoids, we added the protonophore nigericin (27–29). The presence of nigericin did not affect the results, indicating that the absence of equilibration of the proton concentration is not the reason for the absence of quenching (Fig. 2A).
Fig. 2.
Fluorescence traces of LHCII-only and LHCII+LHCSR1 cells. (A) LHCII-only, (B) LHCII+LHCSR1 cells with (red)/without (black) nigericin. The signal was collected at 680 nm. Nigericin (100 μM) addition and pH changes are indicated by arrows.
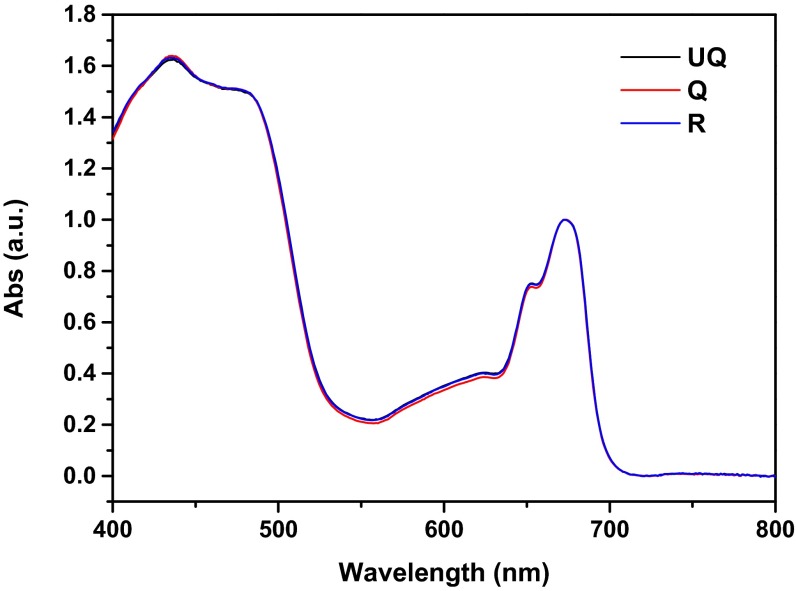
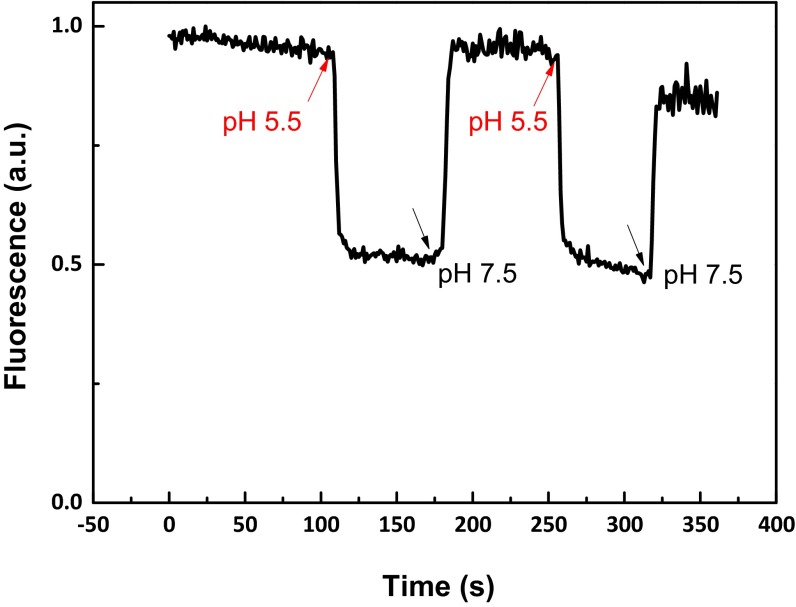
In contrast to the results obtained with the LHCII-only cells, the LHCII+LHCSR1 cells showed nearly 50% fluorescence quenching at pH 5.5 (Fig. 2B) compared with pH 7.5 while the differences in absorption are negligible (Fig. S2). The very rapid quenching observed indicates a rapid equilibration between the medium and the cells and within the stroma and the lumen, suggesting that after vitamin treatment, the membranes are porous. This was confirmed by the fact that the addition of nigericin did not change the extent of the quenching. To further exclude the possibility that the observed quenching is a result of damage of the membrane induced by the low pH, we checked the reversibility of this process. Fig. 2B shows that the quenching process is fully reversible when the pH is adjusted back to 7.5. In addition, the quenching recovery process can be repeated many times, showing that the high fluorescence in the recovery state is not a result of irreversible processes such as pigment loss or damage (Fig. S3).
Fig. S2.
Absorption spectra of UQ, Q, and R samples. All spectra were normalized to 674 nm.
Fig. S3.
Fluorescence trace of LHCII+LHCSR1 cells. pH changes are indicated by the arrows.
To check whether the difference in quenching between LHCII-only and LHCII+LHCSR1 cells was a result of morphological differences in their thylakoid membrane, electron microscopy was performed. (Fig. 3). The cells lacking the core complexes showed short and hyper-layered thylakoids forming small hyperstacked islands, a pattern previously observed in PSI-less mutants (30). However, the thylakoid organization was the same in LHCII-only and LHCII+LHCSR1 cells (Fig. 3 B and C), indicating that this is not the reason for the observed difference in their response to pH.
Fig. 3.
Freeze-fracture electron micrographs of the cells. (A) Control cells. (B) LHCII-only cells. (C) LHCII+LHCSR1 cells. T, thylakoids.
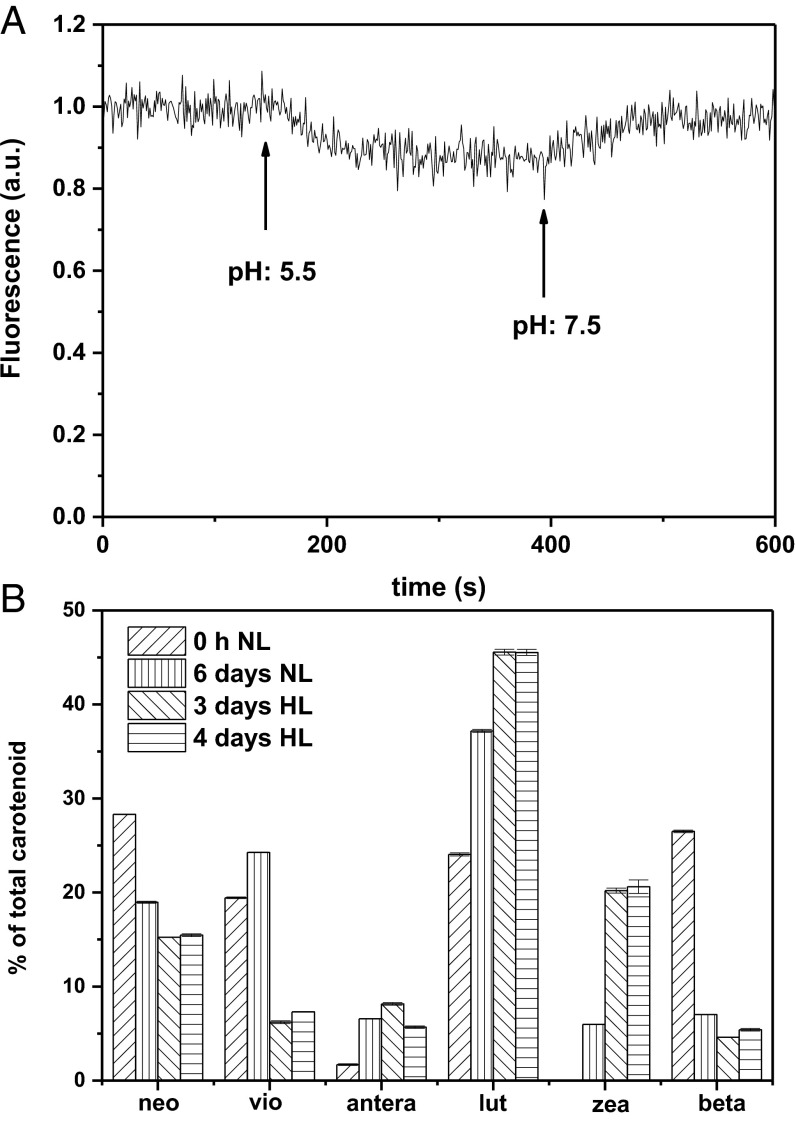
Zeaxanthin-dependent quenching has been identified as a component of NPQ, and in plants has been suggested to enhance the pH response of the complexes (8). However, Bonente et al. (17) showed that in C. reinhardtii, zeaxanthin was not necessary for the activation of LHCSR3, and they suggested that the lower NPQ observed in some conditions in a mutant without zeaxanthin (22) could be a result of the binding of this xanthophyll to LHCBM1. We therefore tested the presence of zeaxanthin in our cells, as well as its possible involvement with the observed fluorescence quenching. In the LHCII-only cells, zeaxanthin accounts for ∼5% of the total carotenoids (Fig. 4), but no pH-dependent quenching was observed in these cells (Fig. 2A). The amount of zeaxanthin reaches 20% of the total carotenoids in the LHCII+LHCSR1 cells that have been exposed to high light for 3 d, wherein pH-induced quenching is robust (Fig. 2B). The amount of zeaxanthin remains the same after 4 d of high light treatment (Fig. 4B), whereas LHCSR1 is strongly reduced, as it is degraded faster than LHCBM1, which was still present in a high amount (Fig. S1). In these cells, the pH-dependent quenching becomes very small (Fig. 4A), indicating that zeaxanthin is not able to induce a pH response in LHCBM1 by itself, and suggesting a correlation between the amount of LHCSR1 and the quenching.
Fig. 4.
Fluorescence kinetic and carotenoid compositions. (A) Fluorescence trace of 4 d high light (LHCII+zea) cells. The signal was collected at 680 nm. pH changes are indicated by arrows. (B) Carotenoid composition of the control (before vitamin treatment), Six days normal light (LHCII-only), 3 d high light (containing LHCII+LHCSR1+zea), and 4 d high light (containing LHCII+zea) cells. neo, neoxanthin; vio, violaxanthin; antera, anteraxanthin; lut, lutein; zea, zeaxanthin; beta, β-carotene. The data derive from three replicates.
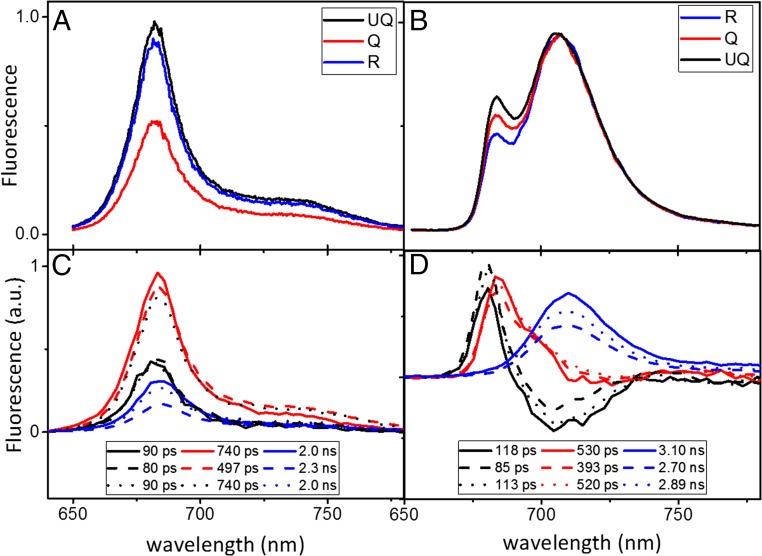
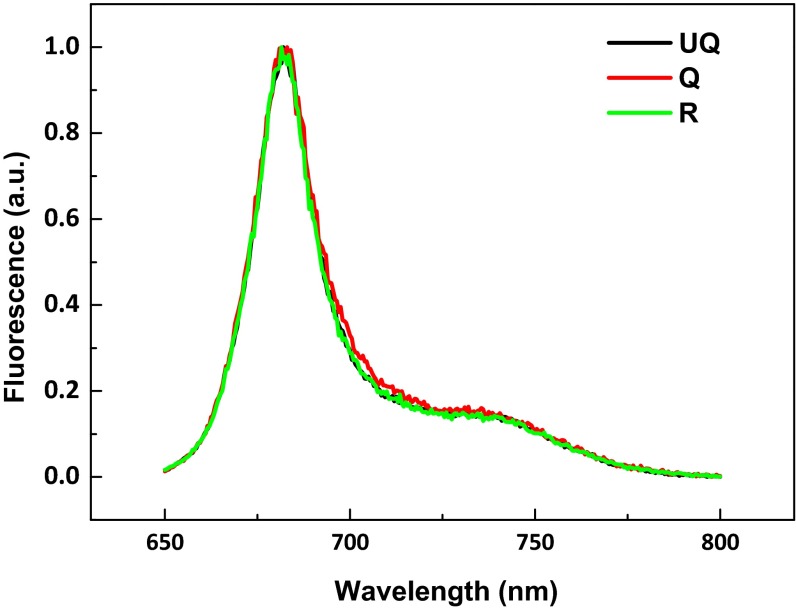
We next investigated the characteristics of the fluorescence quenching in LHCII+LHCSR1 cells. Steady-state fluorescence spectra of unquenched (UQ), Q, and recovered (R) cells were measured at room temperature (RT) and 77 K (Fig. 5 A and B). At RT, in agreement with the fluorescence kinetic results (Fig. 2B), we observed ∼50% fluorescence quenching when the pH was lowered to pH 5.5 (Q) compared with the cells initially at pH 7.5 (UQ). This change was largely reversible when the pH was adjusted back to 7.5 (R). The spectral shape did not change during quenching, suggesting that no major changes in the organization of the thylakoid membrane are associated with the quenching (Fig. S4).
Fig. 5.
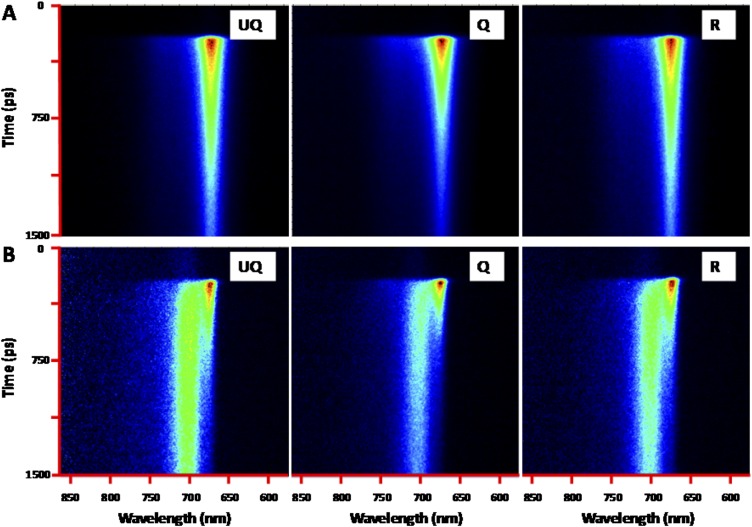
Steady-state and time-resolved fluorescence spectra of LHCII+LHCSR1 cells. (A) Steady-state fluorescence at room temperature (B) and at 77 K. (C) Time-resolved fluorescence at room temperature and (D) at 77 K. For the time-resolved data, DAS, estimated from global analysis, are shown and the corresponding lifetimes are indicated. The excitation wavelength was 475 nm for all experiments. Fluorescence spectra of UQ, Q, and R were induced and measured on the same cells at room temperature, but on different cells at 77 K. The 77 K spectra under different conditions were normalized to their respective maximum in B and to their time 0 emissions in D; see streak images in Fig. S5.
Fig. S4.
Fluorescence emission spectra of UQ, Q, and R cells. All spectra were normalized to their maximum. The excitation wavelength was 475 nm.
Fig. S5.
Streak-camera images of LHCII+LHCSR cells. (A) at RT (B) at 77 K. Three states, UQ, Q, and R, were recorded at each temperature. The images show the fluorescence intensity (in linear color gradient) over time (vertical axis, ∼1.5 ns in total) and over wavelength (horizontal axis, from 590 to 860 nm).
The 77 K emission spectra of the cells in all three conditions showed maxima at 680 and 705 nm (Fig. 5B). As shown previously (25), the 705-nm peak is a result of the presence of a small amount of LHCA, the antenna complexes of PSI, characterized by red emission (31, 32), that receive energy from LHCII and/or to LHCII aggregates, and is thus an indication of the presence of LHC clusters in the membrane. The shape of the emission spectra of the UQ and Q cells remains similar, again suggesting the pH treatments do not disturb the local equilibrium/connection of the complexes in the thylakoid membrane. The intensity of the 680-nm peak relative to the 705-nm peak is lower in the Q cells, suggesting the 680-nm form is more Q than the 705-nm form. Please note that only relative conclusions can be obtained from the 77 K spectra.
To investigate the kinetics of the quenching and its absolute effect on the different spectral components, we next performed time-resolved fluorescence measurements on the cells at RT and 77 K in UQ, Q and recovery conditions. At RT, the fluorescence decay of UQ and R cells can be described with three components with lifetimes of 90 and 740 ps and 2 ns. The decay-associated spectra (DAS) are shown in Fig. 5C. These three components are assigned to different LHC populations, where the nature of this heterogeneity has been presented in our previous work (25). Three components are necessary for the fit of the decay kinetics in the Q cells, but they differ in amplitude and lifetime from those of UQ and R. The quenching mainly affects the longest lifetime component, the amplitude of which is reduced by >40% in Q cells compared with UQ cells. However, the quenching is not limited to the slowest component: the lifetime of the second component was reduced from 740 ps in UQ cells to ∼500 ps in Q cells, and a small change in lifetime (from 90 ps in UQ to 80 ps in Q cells) was observed for the fastest component.
The decay kinetics at 77 K provide detailed spectral information of the quenching process. These kinetics are also well described by three lifetime components. The lifetimes and their corresponding DAS are shown in Fig. 5D. The first DAS with a lifetime of ∼100 ps has a positive peak at 680 nm and a negative one at ∼705 nm, indicating downhill excitation energy transfer. The quenching process affects this component, as upon quenching, the amplitude of the positive signal increased and that of the negative signal decreased, and its lifetime was reduced by ∼30%. This means that the quenching is very fast, taking place in the first 100 ps after excitation, and thereby competing with energy transfer to the red forms.
The DAS of the 500-ps component has a large positive contribution at ∼685 nm and a small dip at ∼710 nm. Two processes occur on this time scale: the depopulation of the 685-nm form, which is responsible for most of the positive signal, and an excitation energy transfer process to far-red pigments. The 500-ps component responds to the quenching process as well: the lifetime becomes shorter, from 530 to 390 ps, and the DAS shows less excitation energy transfer character in the Q cells. The DAS with a 3- ns lifetime has positive amplitude with maximum at 710 nm and represents the fluorescence decay of the red-most pigments, most likely associated with the LHCA proteins (25). At 77 K, these red pigments receive most of the energy, acting as energy traps, indicating that they are well connected to the LHCII. That the amplitude of this component decreases on quenching is because less energy is funneled to these forms in quenching conditions, as the quenching process competes with energy transfer to these forms. The lifetime of this component also remains very long in Q cells (2.7 vs. 3.1 ns), showing that these red pigments are not the quenching sites.
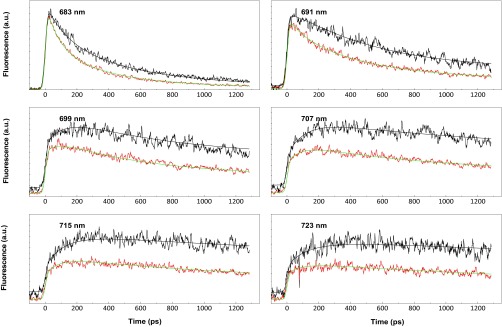
To extract the rate constants of the quenching processes, we performed target analysis on the 77 K measurements, using a sequential model (see fit in Fig. S6). The results are shown in Fig. 6. The evolution-associated spectra of the three components in UQ and Q cells are identical, suggesting no changes occur in the LHC organization (e.g., aggregation) during quenching. Note that the creation of aggregates would result in the appearance of a component around 700 nm (33). The analysis shows that most of the quenching occurs in the 680 nm form, with a rate constant of 2.6 ns−1 (360 ps).
Fig. S6.
Selected fluorescence traces at different wavelengths from the 77 K data in Fig. 6: UQ (black), Q cells (red) and their fittings in black and green, respectively.
Fig. 6.
Target analysis. (A) Kinetic scheme used for target analysis of the time-resolved fluorescence measurements of UQ and Q cells at 77K. Depopulation pathways are represented by arrows; the red arrows designate additional quenching pathways present only in Q cells. Rates are given in (ns)−1. *Location of the initial excitation. (B) Evolution-associated spectra calculated from the target analysis. Spectra are linked to the compartments in A by colors. Solid lines correspond to UQ cells, and dashed lines to Q cells.
Discussion
In this work, we have created a minimal cell, lacking both PSI and PSII, for the study of NPQ in vivo in the green alga C. reinhardtii. These cells have made it possible to disentangle the role of individual NPQ components in the quenching process and to test a series of hypotheses regarding the mechanism of NPQ.
Based on measurements on isolated complexes, it has been proposed that the protonation of LHCII at low pH induces a conformational change of the complex to a Q state (34, 35). We have recently shown that this is not the case for isolated LHCII in the absence of aggregation from both plants and C. reinhardtii (18, 26). Our results here show that LHCII in the membrane is not quenched in response to pH changes, and that the quenching can also not be induced by the interaction of zeaxanthin with LHCBM1. The data clearly show that the membrane only acquires the ability to switch states in response to pH when LHCSR1 is present. Very little information is available about LHCSR1 of C. reinhardti;, however, this protein has a very high homology with LHCSR3 that was previously shown to assume a Q conformation at low pH by in vitro experiments, with a reduction in its fluorescence yield of ∼30% (17, 18). LHCRS1 also retains the C-terminal tail that was shown to be essential in LHCSR3 for sensing the pH (18). Here we observe a 50% quenching of the fluorescence of a large amount of LHCII in the presence of a very small amount of LHCSR1, which suggests this protein is an excellent quencher.
How is quenching created? The time-resolved data show that most of the quenching occurs in the 680-nm fluorescence band (LHCII) in 360 ps. The quenching competes with the energy transfer from LHCII to the LHCI. The energy transfer from LHCII to LHCI indicates these complexes are already clustered and well connected in the UQ membrane. Interestingly, the change in pH does not influence the spectra of the components, which remain the same in UQ and Q conditions. This indicates that no (additional) aggregation is induced in the Q state, as new emission forms would have been expected if LHCII aggregates were forming (36, 37). The data thus suggest that the low pH mainly “activates” LHCSR1.
How can this effect on LHCSR1 be extended to LHCII? Two possible mechanisms can be put forward. In the first, a pH-dependent conformational change in LHCSR1 induces a conformational change in LHCII. This can occur via direct protein–protein interactions between LHCSR1 and the neighboring LHCIIs, or it can be the result of a “domino effect,” facilitated by the tight packing of the complexes in the membrane. In the second, LHCSR1 acts as a local fast trap, receiving the excitation energy from LHCII. The rate constant of the quenching is ∼2.6 ns−1 (360 ps of lifetime), and a LHCII population with a similar lifetime has been previously observed in vitro (38); alternatively, 360 ps may represent the time the energy takes to arrive at the trap, where it is quenched very rapidly. Both mechanisms are plausible options, although a 360-ps transfer time might seem rather fast (39, 40) if the quencher is only LHCSR1, as this complex is only present in small amounts in the membrane.
In conclusion, our data strongly suggest that, as is the case for LHCSR3, LHCSR1 acts as a pH sensor in the membrane of C. reinhardtii and induces quenching of LHCII. The presence of LHCSR1 can explain the large NPQ observed recently in the npq4 mutant of C. reinhardtii, which lacks LHCSR3 but still contains LHCSR1 (41).
Materials and Methods
Strain and Cell Growth.
The RR5 strain containing the Nac2 gene fused to the MetE promoter and Thi4A riboswitch was grown in TAP (Tris-acetate-phosphate) medium under continuous normal light (60 μmol photons m−2 s−1). Addition of vitamins B12 and thiamine-HCl for Nac2 repression was carried out as described earlier (23, 24). Normal-light grown cells were kept under the same light conditions for 6 d after the start of vitamin repression. High-light cells were grown under 400 μmol photons m−2 s−1.
Protein Extraction and Immunoblot Analysis.
Total protein extraction and immunoblot analysis was performed as described earlier (24). Protein extracts were quantified using a bicinchoninic acid assay (Sigma). All the antibodies used are from Agrisera, with the exception of Rpl37, which was a gift from Jean-David Rochaix. The antibody against LhcbM1, LHCSR1, and LHCSR3 of C. reinhardtii is specific for these proteins, as they are produced using a peptide that is specific for each protein.
LHCSR1 and LhcbM1 Apoproteins.
LHCSR1 was amplified from a cDNA library (Stress III, Chlamydomonas Resource Center) with the primers 5′ AGAGGATCCCAGCCCTTCAACCCTACCAA 3′ and 5′ ACCATGGGATCCATGGCTATGATGATGCGCAAGG 3′, using the Q5 polymerase (New England Biolabs) in a reaction supplemented with 1 M betaine. The PCR product and expression vector petMHis were digested with BamHI and XhoI, ligated, and transformed into BL21 Escherichia coli for expression (42). LhcbM1 was cloned and expressed as described (26). The apoproteins were quantified using a bicinchoninic acid assay (Sigma).
Electron Microscopy.
Aliquotes of control cultures and cultures treated with vitamin at normal and high light were pelleted and cells resuspended in 6 mL of cold 20 mM Hepes at pH 7. Next, 1.5 mL of a cold 4% (vol/vol) glutaraldehyde solution in the same buffer was added dropwise to each, with intermittent swirling. After 30 min on ice, the fixed samples were washed twice with cold buffer and shipped on ice by express mail to the Deep Etch EM Facility (www.heuserlab.wustl.edu/services/index.shtml) of the Department of Cell Biology and Physiology, Washington University School of Medicine, where they were immediately snap-frozen at liquid-helium temperature, as described in ref. 43.
Room- and Low-Temperature (77 K) Fluorescence Measurement.
Room- and low-temperature (77 K) fluorescence emission spectra were recorded by a FluoroMax spectroluorometer (HORIBA Jobin-Yvon). The pH was decreased/increased by the addition of acetate/KOH buffer to the 2-mL cell culture in a cuvette. The excitation wavelength was 475 nm, and emission was detected in the 650–780-nm range. Excitation and emission slit widths were set to 3/3 nm. All RT fluorescence spectra were measured in 10-by-10-mm quartz cuvettes with magnetic stirring, using samples of OD 0.05 (Qy band intensity), and 77 K emission was measured with 10 times more concentrated samples in Pasteur pipettes with ∼1 mm diameter, which was kept in a home-built liquid nitrogen-cooled device during the measurement.
Pigment Composition.
The pigment composition was analyzed by fitting spectra of 80% acetone extracted cells with the spectra of the individual pigments, and HPLC was performed as described previously (44). The average of at least three independent measurements was used.
Time-Resolved Fluorescence.
Time-resolved fluorescence measurement were performed with a (sub) picoseconds streak-camera setup (details in refs. 45 and 46), which combines a femtosecond laser source (Coherent Vitesse Duo + a regenerative amplifier Coherent RegA 9000+ an optical parametric amplifier Coherent OPA 9400) with a streak camera detecting system (C5680). The repetition rate was set to 50 kHz, and the OPA output set to 475 nm for excitation. The laser power was adjusted to 15 μW, and the laser beam was focused to a spot with diameter ∼50 μm in the sample. Fluorescence emission was collected at right angles by a spectrograph (Chromex 250IS, 50 groves/mm ruling, blaze wavelength 600 nm, spectral width 260 nm), with central wavelength set at 720 nm. Scattered excitation light was removed with an optical long-pass filter. A 2-ns time window was used, and a high signal-to-noise ratio was achieved by averaging 15 single images, each obtained after analog integration of six exposures of 10 s. Images were corrected for background and shading and then sliced into traces of ∼2.6 nm width.
Cells were directly measured in a 10-by-10-mm quartz cuvette at room temperature or in Pasteur pipettes of ∼1 mm diameter at 77 K. Care was taken to minimize the path length (<1 mm) to allow measurements on high-concentration samples (OD750 nm = 3, mainly scattering) without significant self-absorption. A laser intensity-dependent study confirmed the absence of singlet-singlet annihilation for both temperatures, and strong magnetic stirring (∼25 Hz) was applied to the sample to avoid singlet-triplet (S-T) annihilation at room temperature. To make sure the S-T annihilation was also absent in the 77 K measurements, a lower pulse energy and a lower laser repetition rate ∼10 kHz were tested separately, and no visible changes of the kinetics were observed, which means the measurement is either S-T annihilation-free or saturated at a lower pulse energy/repetition rate; our conclusions are not affected by either possibility.
Global and Target Analysis.
Data obtained with the streak-camera setup were globally analyzed with the R package TIMP-based Glotaran (47). The data were first fitted as a sum of exponential decays convolved with an instrument response function, and the amplitudes of each decay component as a function of wavelength are called DAS. After the DAS was calculated with global analysis, target analysis was performed so that the direct quenching site and quenching rate could be visualized in a straightforward way, based on a compartmental model. See details of the methodology of both global and target analysis and their applications in ref. 48, and more details about the fitting results in Fig. S6.
Acknowledgments
We thank Dr. Jean-David Rochaix for providing the Chlamydomonas reinhardtii RR5 transformant. This work was supported by European Research Council (ERC) Consolidator Grant 281341 (to R.C.) and by the Netherlands Organization for Scientific Research via a Vici grant and a Foundation for Fundamental Research on Matter program (to R.C.).
Footnotes
The authors declare no conflict of interest.
This article is a PNAS Direct Submission.
This article contains supporting information online at www.pnas.org/lookup/suppl/doi:10.1073/pnas.1605380113/-/DCSupplemental.
References
- 1.Derks A, Schaven K, Bruce D. Diverse mechanisms for photoprotection in photosynthesis. Dynamic regulation of photosystem II excitation in response to rapid environmental change. Biochim Biophys Acta. 2015;1847(4-5):468–485. doi: 10.1016/j.bbabio.2015.02.008. [DOI] [PubMed] [Google Scholar]
- 2.Rochaix JD. Regulation and dynamics of the light-harvesting system. Annu Rev Plant Biol. 2014;65:287–309. doi: 10.1146/annurev-arplant-050213-040226. [DOI] [PubMed] [Google Scholar]
- 3.Büchel C. Evolution and function of light harvesting proteins. J Plant Physiol. 2015;172:62–75. doi: 10.1016/j.jplph.2014.04.018. [DOI] [PubMed] [Google Scholar]
- 4.Croce R, van Amerongen H. Natural strategies for photosynthetic light harvesting. Nat Chem Biol. 2014;10(7):492–501. doi: 10.1038/nchembio.1555. [DOI] [PubMed] [Google Scholar]
- 5.Niyogi KK, Truong TB. Evolution of flexible non-photochemical quenching mechanisms that regulate light harvesting in oxygenic photosynthesis. Curr Opin Plant Biol. 2013;16(3):307–314. doi: 10.1016/j.pbi.2013.03.011. [DOI] [PubMed] [Google Scholar]
- 6.Goss R, Lepetit B. Biodiversity of NPQ. J Plant Physiol. 2015;172:13–32. doi: 10.1016/j.jplph.2014.03.004. [DOI] [PubMed] [Google Scholar]
- 7.Ruban AV, et al. Identification of a mechanism of photoprotective energy dissipation in higher plants. Nature. 2007;450(7169):575–578. doi: 10.1038/nature06262. [DOI] [PubMed] [Google Scholar]
- 8.Ruban AV, Johnson MP, Duffy CDP. The photoprotective molecular switch in the photosystem II antenna. Biochim Biophys Acta. 2012;1817(1):167–181. doi: 10.1016/j.bbabio.2011.04.007. [DOI] [PubMed] [Google Scholar]
- 9.Li XP, et al. A pigment-binding protein essential for regulation of photosynthetic light harvesting. Nature. 2000;403(6768):391–395. doi: 10.1038/35000131. [DOI] [PubMed] [Google Scholar]
- 10.Alboresi A, Gerotto C, Giacometti GM, Bassi R, Morosinotto T. Physcomitrella patens mutants affected on heat dissipation clarify the evolution of photoprotection mechanisms upon land colonization. Proc Natl Acad Sci USA. 2010;107(24):11128–11133. doi: 10.1073/pnas.1002873107. [DOI] [PMC free article] [PubMed] [Google Scholar]
- 11.Peers G, et al. An ancient light-harvesting protein is critical for the regulation of algal photosynthesis. Nature. 2009;462(7272):518–521. doi: 10.1038/nature08587. [DOI] [PubMed] [Google Scholar]
- 12.Bailleul B, et al. An atypical member of the light-harvesting complex stress-related protein family modulates diatom responses to light. Proc Natl Acad Sci USA. 2010;107(42):18214–18219. doi: 10.1073/pnas.1007703107. [DOI] [PMC free article] [PubMed] [Google Scholar]
- 13.Ledford HK, et al. Comparative profiling of lipid-soluble antioxidants and transcripts reveals two phases of photo-oxidative stress in a xanthophyll-deficient mutant of Chlamydomonas reinhardtii. Mol Genet Genomics. 2004;272(4):470–479. doi: 10.1007/s00438-004-1078-5. [DOI] [PubMed] [Google Scholar]
- 14.Naumann B, et al. Comparative quantitative proteomics to investigate the remodeling of bioenergetic pathways under iron deficiency in Chlamydomonas reinhardtii. Proteomics. 2007;7(21):3964–3979. doi: 10.1002/pmic.200700407. [DOI] [PubMed] [Google Scholar]
- 15.Zhang Z, et al. Insights into the survival of Chlamydomonas reinhardtii during sulfur starvation based on microarray analysis of gene expression. Eukaryot Cell. 2004;3(5):1331–1348. doi: 10.1128/EC.3.5.1331-1348.2004. [DOI] [PMC free article] [PubMed] [Google Scholar]
- 16.Maruyama S, Tokutsu R, Minagawa J. Transcriptional regulation of the stress-responsive light harvesting complex genes in Chlamydomonas reinhardtii. Plant Cell Physiol. 2014;55(7):1304–1310. doi: 10.1093/pcp/pcu068. [DOI] [PubMed] [Google Scholar]
- 17.Bonente G, et al. Analysis of LhcSR3, a protein essential for feedback de-excitation in the green alga Chlamydomonas reinhardtii. PLoS Biol. 2011;9(1):e1000577. doi: 10.1371/journal.pbio.1000577. [DOI] [PMC free article] [PubMed] [Google Scholar]
- 18.Liguori N, Roy LM, Opacic M, Durand G, Croce R. Regulation of light harvesting in the green alga Chlamydomonas reinhardtii: The C-terminus of LHCSR is the knob of a dimmer switch. J Am Chem Soc. 2013;135(49):18339–18342. doi: 10.1021/ja4107463. [DOI] [PubMed] [Google Scholar]
- 19.Elrad D, Niyogi KK, Grossman AR. A major light-harvesting polypeptide of photosystem II functions in thermal dissipation. Plant Cell. 2002;14(8):1801–1816. doi: 10.1105/tpc.002154. [DOI] [PMC free article] [PubMed] [Google Scholar]
- 20.Demmig-Adams B. Carotenoids and photoprotection in plants - a role for the xanthophyll zeaxanthin. Biochim Biophys Acta. 1990;1020(1):1–24. [Google Scholar]
- 21.Johnson MP, et al. Photoprotective energy dissipation involves the reorganization of photosystem II light-harvesting complexes in the grana membranes of spinach chloroplasts. Plant Cell. 2011;23(4):1468–1479. doi: 10.1105/tpc.110.081646. [DOI] [PMC free article] [PubMed] [Google Scholar]
- 22.Niyogi KK, Björkman O, Grossman AR. The roles of specific xanthophylls in photoprotection. Proc Natl Acad Sci USA. 1997;94(25):14162–14167. doi: 10.1073/pnas.94.25.14162. [DOI] [PMC free article] [PubMed] [Google Scholar]
- 23.Ramundo S, Rahire M, Schaad O, Rochaix JD. Repression of essential chloroplast genes reveals new signaling pathways and regulatory feedback loops in chlamydomonas. Plant Cell. 2013;25(1):167–186. doi: 10.1105/tpc.112.103051. [DOI] [PMC free article] [PubMed] [Google Scholar]
- 24.Dinc E, Ramundo S, Croce R, Rochaix JD. Repressible chloroplast gene expression in Chlamydomonas: A new tool for the study of the photosynthetic apparatus. Biochim Biophys Acta. 2014;1837(9):1548–1552. doi: 10.1016/j.bbabio.2013.11.020. [DOI] [PubMed] [Google Scholar]
- 25.Tian L, Dinc E, Croce R. LHCII populations in different quenching states are present in the thylakoid membranes in a ratio that depends on the light conditions. J Phys Chem Lett. 2015;6(12):2339–2344. doi: 10.1021/acs.jpclett.5b00944. [DOI] [PubMed] [Google Scholar]
- 26.Natali A, Croce R. Characterization of the major light-harvesting complexes (LHCBM) of the green alga Chlamydomonas reinhardtii. PLoS One. 2015;10(2):e0119211. doi: 10.1371/journal.pone.0119211. [DOI] [PMC free article] [PubMed] [Google Scholar]
- 27.Gilmore AM, Hazlett TL, Govindjee Xanthophyll cycle-dependent quenching of photosystem II chlorophyll a fluorescence: Formation of a quenching complex with a short fluorescence lifetime. Proc Natl Acad Sci USA. 1995;92(6):2273–2277. doi: 10.1073/pnas.92.6.2273. [DOI] [PMC free article] [PubMed] [Google Scholar]
- 28.Allorent G, et al. A dual strategy to cope with high light in Chlamydomonas reinhardtii. Plant Cell. 2013;25(2):545–557. doi: 10.1105/tpc.112.108274. [DOI] [PMC free article] [PubMed] [Google Scholar]
- 29.Amarnath K, Zaks J, Park SD, Niyogi KK, Fleming GR. Fluorescence lifetime snapshots reveal two rapidly reversible mechanisms of photoprotection in live cells of Chlamydomonas reinhardtii. Proc Natl Acad Sci USA. 2012;109(22):8405–8410. doi: 10.1073/pnas.1205303109. [DOI] [PMC free article] [PubMed] [Google Scholar]
- 30.Goodenough UW, Levine RP. Chloroplast ultrastructure in mutant strains of Chlamydomonas reinhardi lacking components of photosynthetic apparatus. Plant Physiol. 1969;44(7):990–1000. doi: 10.1104/pp.44.7.990. [DOI] [PMC free article] [PubMed] [Google Scholar]
- 31.Mozzo M, et al. Functional analysis of Photosystem I light-harvesting complexes (Lhca) gene products of Chlamydomonas reinhardtii. Biochim Biophys Acta. 2010;1797(2):212–221. doi: 10.1016/j.bbabio.2009.10.005. [DOI] [PubMed] [Google Scholar]
- 32.Takahashi Y, Yasui TA, Stauber EJ, Hippler M. Comparison of the subunit compositions of the PSI-LHCI supercomplex and the LHCI in the green alga Chlamydomonas reinhardtii. Biochemistry. 2004;43(24):7816–7823. doi: 10.1021/bi035988z. [DOI] [PubMed] [Google Scholar]
- 33.Horton P, et al. Control of the light-harvesting function of chloroplast membranes by aggregation of the LHCII chlorophyll-protein complex. FEBS Lett. 1991;292(1-2):1–4. doi: 10.1016/0014-5793(91)80819-o. [DOI] [PubMed] [Google Scholar]
- 34.Ilioaia C, Johnson MP, Horton P, Ruban AV. Induction of efficient energy dissipation in the isolated light-harvesting complex of Photosystem II in the absence of protein aggregation. J Biol Chem. 2008;283(43):29505–29512. doi: 10.1074/jbc.M802438200. [DOI] [PMC free article] [PubMed] [Google Scholar]
- 35.Krüger TPJ, et al. Controlled disorder in plant light-harvesting complex II explains its photoprotective role. Biophys J. 2012;102(11):2669–2676. doi: 10.1016/j.bpj.2012.04.044. [DOI] [PMC free article] [PubMed] [Google Scholar]
- 36.Mullineaux CW, Pascal AA, Horton P, Holzwarth AR. Excitation-energy quenching in aggregates of the LHCII chlorophyll-protein complex - a time-resolved fluorescence study. Biochim Biophys Acta. 1993;1141(1):23–28. [Google Scholar]
- 37.Vasil’ev S, et al. Quenching of chlorophyll a fluorescence in the aggregates of LHCII: Steady state fluorescence and picosecond relaxation kinetics. Biochemistry. 1997;36(24):7503–7512. doi: 10.1021/bi9625253. [DOI] [PubMed] [Google Scholar]
- 38.Miloslavina Y, et al. Far-red fluorescence: A direct spectroscopic marker for LHCII oligomer formation in non-photochemical quenching. FEBS Lett. 2008;582(25-26):3625–3631. doi: 10.1016/j.febslet.2008.09.044. [DOI] [PubMed] [Google Scholar]
- 39.van Oort B, et al. Effect of antenna-depletion in Photosystem II on excitation energy transfer in Arabidopsis thaliana. Biophys J. 2010;98(5):922–931. doi: 10.1016/j.bpj.2009.11.012. [DOI] [PMC free article] [PubMed] [Google Scholar]
- 40.Chmeliov J, Trinkunas G, van Amerongen H, Valkunas L. Light harvesting in a fluctuating antenna. J Am Chem Soc. 2014;136(25):8963–8972. doi: 10.1021/ja5027858. [DOI] [PubMed] [Google Scholar]
- 41.Berteotti S, Ballottari M, Bassi R. Increased biomass productivity in green algae by tuning non-photochemical quenching. Sci Rep. 2016;6:21339. doi: 10.1038/srep21339. [DOI] [PMC free article] [PubMed] [Google Scholar] [Retracted]
- 42.Mozzo M, Passarini F, Bassi R, van Amerongen H, Croce R. Photoprotection in higher plants: The putative quenching site is conserved in all outer light-harvesting complexes of Photosystem II. Biochim Biophys Acta. 2008;1777(10):1263–1267. doi: 10.1016/j.bbabio.2008.04.036. [DOI] [PubMed] [Google Scholar]
- 43.Scholz MJ, et al. Ultrastructure and composition of the Nannochloropsis gaditana cell wall. Eukaryot Cell. 2014;13(11):1450–1464. doi: 10.1128/EC.00183-14. [DOI] [PMC free article] [PubMed] [Google Scholar]
- 44.Croce R, Canino G, Ros F, Bassi R. Chromophore organization in the higher-plant photosystem II antenna protein CP26. Biochemistry. 2002;41(23):7334–7343. doi: 10.1021/bi0257437. [DOI] [PubMed] [Google Scholar]
- 45.van Stokkum IHM, van Oort B, van Mourik F, Gobets B, van Amerongen H. (Sub)-picosecond spectral evolution of fluorescence studied with a synchroscan streak-camera system and target analysis. In: Aartsma TJ, Matysik J, editors. Biophysical techniques in photosynthesis. Springer; Dordrecht: 2008. pp. 223–240. [Google Scholar]
- 46.Gobets B, et al. Time-resolved fluorescence emission measurements of photosystem I particles of various cyanobacteria: A unified compartmental model. Biophys J. 2001;81(1):407–424. doi: 10.1016/S0006-3495(01)75709-8. [DOI] [PMC free article] [PubMed] [Google Scholar]
- 47.Snellenburg JJ, Laptenok S, Seger R, Mullen KM, van Stokkum IHM. Glotaran: A Java-based graphical user interface for the R package TIMP. J Stat Softw. 2012;49(3):22. [Google Scholar]
- 48.van Stokkum IHM, Larsen DS, van Grondelle R. Global and target analysis of time-resolved spectra. Biochim Biophys Acta. 2004;1657(2-3):82–104. doi: 10.1016/j.bbabio.2004.04.011. [DOI] [PubMed] [Google Scholar]


