

Summary
Hematopoietic stem/progenitor cells (HSPCs) are capable of supporting the lifelong production of blood cells exerting a wide spectrum of functions. Lentiviral vector HSPC gene therapy generates a human hematopoietic system stably marked at the clonal level by vector integration sites (ISs). Using IS analysis, we longitudinally tracked >89,000 clones from 15 distinct bone marrow and peripheral blood lineages purified up to 4 years after transplant in four Wiskott-Aldrich syndrome patients treated with HSPC gene therapy. We measured at the clonal level repopulating waves, populations' sizes and dynamics, activity of distinct HSPC subtypes, contribution of various progenitor classes during the early and late post-transplant phases, and hierarchical relationships among lineages. We discovered that in-vitro-manipulated HSPCs retain the ability to return to latency after transplant and can be physiologically reactivated, sustaining a stable hematopoietic output. This study constitutes in vivo comprehensive tracking in humans of hematopoietic clonal dynamics during the early and late post-transplant phases.
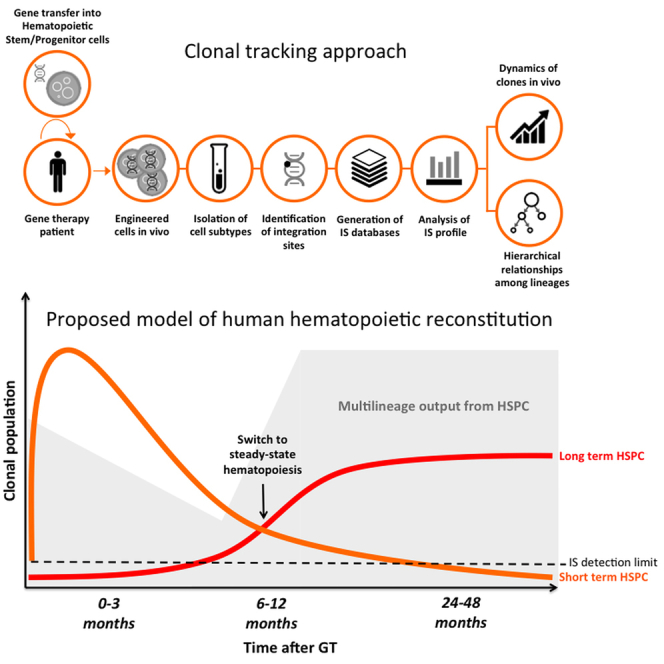
Graphical Abstract
Highlights
-
•
Hematopoietic reconstitution occurs in two distinct clonal waves
-
•
A few thousand HSPC clones stably sustain multilineage blood cell production
-
•
Steady-state hematopoiesis after transplant is maintained by both HSCs and MPPs
-
•
Natural killer clones have closer relationships to myeloid cells than to lymphoid cells
Biasco et al. report a clonal tracking study on the dynamics and nature of hematopoietic reconstitution in humans after transplant. Using integration sites as molecular tags, they measured, in gene therapy patients, repopulating waves, population size and dynamics, activity of progenitor subtypes during the early and late post-transplant phases, and hierarchical relationships among lineages.
Introduction
The hematopoietic system is a complex hierarchical structure that produces several different types of specialized blood cells, most of which are short-lived and thereby require continuous replenishment with hematopoietic stem/progenitor cells (HSPCs). Autologous or allogeneic transplantation of HSPCs is widely used to reconstitute functional hematopoiesis in patients with hematological diseases (Cavazzana-Calvo et al., 2013, Gschweng et al., 2014, Jenq and van den Brink, 2010, Mohty et al., 2014, Naldini, 2011, Williams, 2013). Despite the well-established clinical use of HSPCs, their short- and long-term fate after transplantation and the clonal dynamics of hematopoietic reconstitution in humans remain poorly understood. Over the past few years, a series of phenotypic and functional characterization studies have identified various HSPC subpopulations within cells expressing the CD34 antigen, including hematopoietic stem cells (HSCs), which are the most undifferentiated stem cell type, and multipotent progenitors (MPPs), which are downstream of the differentiation hierarchy but still capable of multilineage output (Doulatov et al., 2012). Different cell hierarchies of human hematopoiesis have been proposed, including the early branching of myeloid and lymphoid lineages (Akashi et al., 2000, Kondo et al., 1997) or the ontological proximity of lymphoid lineages to myeloid compartments due to the existence of a myeloid-primed lymphoid progenitor that is distinct from HSC (Ema et al., 2014, Kawamoto et al., 2010a). Data on HSPC activity have been collected mainly through in vitro assays or using humanized, wild-type animal models (Babovic and Eaves, 2014, Benveniste et al., 2010, Cheung et al., 2013, Nolta et al., 1996, Notta et al., 2011, Wright et al., 2001). Barcoded vector libraries and retroviral integration sites (ISs) have been used to track HSPCs upon transplantation in small animal models and in non-human primates (Dykstra and Bystrykh, 2014, Gerrits et al., 2010, Kim et al., 2014, Naik et al., 2013, Perié et al., 2014, Wu et al., 2014). Additionally, recent mouse studies marking HSPCs in vivo suggest that unperturbed hematopoiesis may be driven more substantially by MPPs rather than by HSCs (Sun et al., 2014). Ideally, hematopoietic clonal dynamics should be studied by tracking the fate of individual clones in humans, revealing the rate and extent of hematopoietic recovery after transplant, and evaluating the possibility of long-term exhaustion due to in vitro cell manipulation. Such a study would have highly relevant implications for the broad clinical use of HSPCs and the long-term prognosis of treated patients.
Ex vivo gene therapy (GT), based on the permanent gene correction of human HSPCs through the transfer of a therapeutic gene using retroviral (RV) or lentiviral (LV) vectors, has recently provided preliminary evidence of safety and efficacy for the treatment of various blood-borne genetic disorders (Aiuti et al., 2009, Aiuti et al., 2013, Biffi et al., 2013, Candotti et al., 2012, Gaspar et al., 2011, Hacein-Bey Abina et al., 2015, Hacein-Bey-Abina et al., 2010, Naldini, 2011, Naldini, 2015, Williams, 2013). Following GT, each vector-marked cell is univocally barcoded by a vector IS, providing an ideal setting for the study of human hematopoiesis (Naldini, 2015). We and others have already shown that IS-based tracking can be exploited to study the clonal composition of engineered cells and to assess the safety of gene transfer as well as the in vivo engraftment of marked HSPCs (Aiuti et al., 2007, Aiuti et al., 2013, Biasco et al., 2015, Hacein-Bey Abina et al., 2015, Tey and Brenner, 2007, Wang et al., 2010).
In the present study, we used IS-based clonal tracking on individually purified lineages to examine early and late human hematopoiesis up to 4 years after transplant in the context of LV GT for Wiskott-Aldrich syndrome (WAS), an inherited disorder characterized by thrombocytopenia, bleeding episodes, eczema, and immunodeficiency (Aiuti et al., 2013). We measured, at qualitative and quantitative levels, the contribution of progenitors to an extensively engineered hematopoietic system and assessed over time the in vivo clonal relationships among blood cells, providing crucial information on human hematopoietic dynamics.
Results
Tracking of Clonal Dynamics and Estimates of Population Size of Engineered Cells
During a 3- to 4-year follow-up period, we studied the clonal dynamics and relationships of gene-corrected cells in four WAS patients treated with LV HSPC GT (Aiuti et al., 2013, Castiello et al., 2015). The patients received an average cell dose of 10.8 million CD34+ cells/kg, with gene-correction efficiency ranging from 88% to 100%. All patients were alive and well after GT, with no reports of eczema or major bleeding episodes. Patients showed multilineage reconstitution of engineered cells, and no sign of severe adverse events related to treatment (Aiuti et al., 2013, Castiello et al., 2015).
We collected IS from eight distinct peripheral blood (PB) and seven distinct bone marrow (BM) lineages, as well as from whole PB, whole BM, and mononuclear cell samples using a combination of linear-amplification-mediated (LAM)-PCR and next-generation sequencing (NGS) technologies. This yielded 28,601,017 sequence reads, which were mapped to 89,594 individual ISs (Tables 1 and 2). Each clone was univocally identified by its integration locus and nearest gene. Sequence reads belonging to each IS were used as surrogate markers of relative clonal size.
Table 1.
Total Number of Unique Integration Sites and Relative Sequence Reads Retrieved from Four WAS Patients up to 48 Months after GT
| Patient | Number of ISs | Sequence Reads |
|---|---|---|
| Patient 1 | 27,489 | 5,773,290 |
| Patient 2 | 25,535 | 9,405,296 |
| Patient 3 | 24,779 | 6,539,976 |
| Patient 4 | 11,791 | 6,882,455 |
| Total | 89,594 | 28,601,017 |
Table 2.
Cumulative Number of Unique Integration Sites Retrieved on the Infused Cell Product and at Different Time Points after GT from Different Cell Types Purified from the BM or PB of 4 WAS Patients
| Samples | Patient 1 | Patient 2 | Patient 3 | Patient 4 |
|---|---|---|---|---|
| Pre-infusion | 1,228 | 938 | 619 | 622 |
| BM CD34 | 1,277 | 2,542 | 2,357 | 1,409 |
| BM CD14 | 1,205 | 778 | 2,925 | 2,481 |
| BM CD15 | 3,233 | 4,056 | 4,135 | 2,840 |
| BM CD19 | 2,332 | 5,158 | 5,083 | 2,084 |
| BM CD3 | 3,650 | 3,707 | 5,999 | 1,536 |
| BM CD56 | 1,217 | 3,335 | 3,849 | 1,746 |
| BM CD61 | 1,140 | 735 | 1,721 | 1,642 |
| BM GLYCO | 1,194 | 1,863 | 2,633 | 1,337 |
| PB CD14 | 8,691 | 5,881 | 7,402 | 2,764 |
| PB CD15 | 7,391 | 7,084 | 6,007 | 2,314 |
| PB CD19 | 8,804 | 8,558 | 11,351 | 3,358 |
| PB CD3 | 6,874 | 5,886 | 6,323 | 2,908 |
| PB CD4 | 10,839 | 7,490 | 6,993 | 2,798 |
| PB CD8 | 5,975 | 4,017 | 4,409 | 2,256 |
| PB CD56 | 6,953 | 7,977 | 3,203 | 2,194 |
GLYCO, glycophorin+ cells.
We first estimated the evolution of the clonal repertoire of gene-corrected cells over time by calculating the diversity index for each sample and time point on the basis of richness (number of unique ISs marking individual clones) and evenness (relative clonal contribution in terms of sequence reads associated to each IS). The diversity index of pre-infusion samples was consistent among patients, ranging between 5.6 and 6.2 (Figure 1A), and represented the highest average level of polyclonality observed, as expected from a heterogeneous population containing a large number of committed non-engrafting progenitors. After intravenous infusion in patients, we found that the diversity of the clonal repertoire of genetically engineered PB cells was lower in the early phases of hematopoietic reconstitution. It then stabilized in all patients after the first 6–9 months and remained steady until the last follow-up at 4 years after GT (diversity index ranging from 3.6 to 5.9; Figure 1A). In particular, when analyzing individual lineages, including BM samples, we observed fluctuation of the diversity index during the first 3 months after GT (Figures 1B and S1). Lymphoid cells displayed lower diversity in the early months after GT compared to myeloid lineages, in concordance with previously observed delayed lymphoid reconstitution (Aiuti et al., 2013). Conversely, myeloid cells better mirror the early clonal dynamics of BM CD34+ progenitors when compared to B and T lymphocytes (Figure S1).
Figure 1.

Tracking of Engineered Population Dynamics and Clonal Abundance over Time
(A) Diversity index calculated on number of ISs and relative sequence counts of pooled PB lineages purified from four patients over time. Black asterisk on the y axis indicates the average diversity index of pre-infusion samples.
(B) Diversity index of BM CD34+ cells (in red) and individual samples over time (in gray) from a representative patient (patient 2). Red asterisk shows the diversity index of BM CD34+ cells before infusion.
(C) Estimates of population clonal abundance of PB mature lineages from four WAS patients. Time intervals are reported as months after GT on the x axis of each graph.
(D) Overall clonal size estimates of BM CD34+ and PB mature populations at the last follow-up when both BM and PB were collected (36 months after GT for patients 1, 2, and 3 and 24 months for patient 4). FU, follow-up.
See also Figures S1 and S2.
Since the differences in diversity might be affected by an uneven collection of ISs over time, we compared diversity on randomized subsamples of identical amounts of ISs, confirming that in both myeloid and lymphoid lineages, the highest diversity in vivo was observed at the last time points, irrespective of the IS sample size (Supplemental Experimental Procedures). To evaluate whether clonal relationships among lineages and time points also changed over time, we calculated pairwise positive associations on the basis of the sharing of identical ISs between two cell types (Supplemental Experimental Procedures). Using unsupervised clustering, we distinguished two major phases of hematopoietic reconstitution. The most stable sharing of identical ISs was observed over a period ranging from 3–6 to 48 months post-GT (Figure S2). This outcome was not influenced by potential background detection of IS contaminants associated with a low number of sequence reads, as these results were confirmed even after stringent data filtering to progressively remove poorly represented ISs from the datasets (Supplemental Experimental Procedures).
Although population size estimates have been performed in animal clonal tracking studies (Kim et al., 2014), there is currently no information available on the number of clones that make up different cell compartments derived from transplanted HSPCs in humans in steady-state hematopoiesis. In order to comprehensively address this point, we first calculated the probability of recapturing identical ISs within the same lineages over time. We observed a general increase in the probability of recapturing identical clones over time, which reached a stable level at ∼12 months after GT (Supplemental Experimental Procedures).
On the basis of these results, we then estimated, using Markov processes enclosed on an open population estimator, the number of clones making up different PB lineages isolated after 12 months (Supplemental Experimental Procedures). As shown in Figure 1C, the estimated population size of differentiated PB gene-corrected clones was constant over a period of 2–3 years in all patients, ranging between 1,600 and 4,300 clones. The estimated total number of clones differed between lineages and was greater in the lymphoid compartment than in the myeloid one (Figure 1D). This result is consistent with the longer survival potential of lymphoid cells and with the early effects of selective advantage for gene-corrected lymphocytes expressing WAS protein (Aiuti et al., 2013, Scaramuzza et al., 2012). Within the BM CD34+ cell population, the number of clones was higher in the early post-GT phase and decreased over the following months to a smaller steady-state population composed of ∼1,200 clones (Supplemental Experimental Procedures).
Longitudinal Analysis of HSPC Activity in the Early and Late Phases of Hematopoietic Reconstitution
In order to study the clonal output of transduced progenitors to differentiated lineages, we evaluated the level of IS sharing between BM CD34+ and myeloid or lymphoid cells over time. As shown in Figure 2A, the percentage of ISs shared between CD34+ cells and myeloid or lymphoid lineages was much lower in early versus late time points, the lowest being at 3 months after GT. The nature of the output measured at later time points was predominantly bi-potent (myeloid and lymphoid), reflecting the activity of multipotent progenitors. Although we applied stringent filters before performing this analysis to account for potential cross-contamination, a similar trend was observed even when analyzing the entire dataset (Supplemental Experimental Procedures). This suggests that the observed increase in shared integrations reflects an underlying biological phenomenon and is not simply due to technical artifacts of potential contamination among purified subpopulations, which would not be expected to change owing to the time of collection.
Figure 2.

IS Sharing and Clonal Output of BM CD34+ Progenitors over Time
(A) Bar charts showing the percentage of IS from BM CD34+ cells shared with only myeloid (green), only lymphoid (blue), and both myeloid and lymphoid lineages (orange) from the same time point (months after GT). The fractions of ISs detected only in BM CD34+ cells at each given time are shown in gray. Data have been filtered for potential cross-contaminations as described in Supplemental Experimental Procedures.
(B) Circos plots showing the levels of CD34+ output measured as multilineage sharing of ISs from BM CD34+ cells over time (ordered in columns per months after GT). The rainbow area of the circle is composed of ribbons showing relative IS sharing toward different BM and PB lineages listed on the left. The red area comprises the total number of IS from CD34+ cells. The larger the rainbow area compared to the red area, the higher the CD34+ output. The more colored the rainbow area, the more diverse and multilineage the CD34+ output.
(C) Heatmap using blue-to-green color intensity to show the frequency of IS shared by each lineage (in rows) with BM CD34+ cells (in columns) over time as a measurement of clonal input received with BM CD34+ progenitors. Unsupervised clustering was performed as described in Supplemental Experimental Procedures.
See also Table S1 and Supplemental Experimental Procedures.
We then expanded the analysis of CD34+ cell output to all lineages isolated from the BM and PB of WAS patients over time. The “rainbow” area of the plots in Figure 2B shows the IS percentage shared between BM CD34+ cells and each of the purified cell subtypes. During the first 3 months, we observed a shrinkage in output toward all lineages analyzed for each patient. Starting at 6 months, the level of IS sharing increased, and progenitor output was highly distributed to all lineages. This substantial multipotent output was consistently maintained up to 3 years after GT.
To formally validate IS sharing as being representative of progenitor activity, we isolated ISs from colony-forming cells (CFCs) generated in vitro from the same CD34+ cells analyzed above at the last follow-up when patient hematopoiesis was steady state. These represented highly purified samples, in which at the end of clonogenic assay, contamination with mature cells from the original harvest was virtually absent. The average vector copy number (VCN) of vector-positive CFCs, at the latest follow-up available, ranged from 1.2 to 1.7. As shown in Table S1, we observed a substantial percentage of IS retrieved from CFCs in each patient analyzed, identical to those detected in myeloid and/or lymphoid cells isolated in vivo at the same time point.
To gain additional information on HSPC activity, we then studied the datasets from the opposite perspective, evaluating the input level that each lineage received from CD34+ cells at different time points. Figure 2C shows on a heatmap the proportion of ISs within each lineage and time point shared with CD34+ progenitors over time. In line with the data reported above, the greatest IS similarities between different cell types and BM CD34+ cells were observed at the last follow-up after GT. Unsupervised clustering for lineages and sources showed that PB lymphoid cells, myeloid cells, and megakaryocte-erythroid progenitors clustered separately from each other on the basis of their relationships with BM CD34+ precursors. CD56+ natural killer (NK) cells isolated from BM or PB were found to be co-clustered with myeloid cells purified from PB and not with lymphoid T cells that were rather grouped independently.
Assessment of HSC and MPP Contribution to Engineered Hematopoiesis over Time
Previous studies using xenotransplantation assays have identified the human Lin−/CD34+/CD38−/CD90+/CD45RA− fraction as being endowed with long-term repopulation potential (Doulatov et al., 2012, Laurenti and Dick, 2012, Laurenti et al., 2013, Majeti et al., 2007). Recent studies on mice have questioned, however, whether HSCs and/or MPPs are responsible for the steady-state maintenance of blood cell production in humans (Sun et al., 2014). To address this point, we used fluorescence-activated cell sorting (FACS)-sorted HSC (defined as Lin−/CD34+/CD38−/CD90+/CD45RA−) and MPP (defined as Lin−/CD34+/CD38−/CD90−/CD45RA−) progenitor subpopulations from CD34+ cells isolated from the BM of two WAS patients at 36 months after GT, and we collected ISs from each subtype (Supplemental Experimental Procedures). Using IS analysis, we backtracked the activity of 51 HSC and 10 MPP genetically engineered clones in the two patients. The heatmap in Figure 3A, at 36 months after GT, shows that 15 out of 51 and 8 out of 10 ISs isolated from HSCs or MPPs, respectively, were detected in at least one other lineage and time point. The majority of ISs collected from HSCs and MPPs could be traced back over multiple lineages isolated at different time points, but their activity appeared more consistent after the first 3–6 months following GT.
Figure 3.

Analysis of Purified HSC and MPP Output over Time
(A) Output of HSC and MPP progenitors over time isolated from patient 2 (Pt2) and Pt3 at 36 months after GT. Bar graphs on the left show the fraction of HSC or MPP ISs (in blue) detected in multiple lineages and time points. Heatmaps on the right show the detection of each shared IS (in rows) over time. Each column represents an individual lineage and time point. Blue color intensity is proportional to the level of multilineage and over-time detection of each shared IS. The number of clones (15 HSCs and 8 MPPs) mentioned in the text is the sum of the clones identified as sharing ISs with at least one other lineage in the two patients over time (HSC clones: 6 (heatmap above) + 9 (heatmap below) = 15; MPP clones: 4 (heatmap above) + 4 (heatmap below) = 8).
(B) Horizontal column graphs showing the real-time input of HSC or MPP shared ISs as relative abundance (percentage of sequence counts) within whole BM, whole PB, BM MNCs, or PBMCs isolated from the same patient at the same time point.
(C) Line plots showing the sharing scores (on y axis) of HSC or MPP ISs toward individual myeloid and lymphoid lineages over time (months after GT on the x axis). Sharing scores were calculated according to the rules reported in Supplemental Experimental Procedures.
To evaluate the real-time output of these clones on the BM and PB of WAS patients, we quantified the contribution in terms of the sequence reads of these IS on whole BM, whole PB, and mononuclear cell samples collected at 36 months after GT (Figure 3B). In line with their predicted biological behavior from xenotransplantation studies, only a fraction of the HSCs appeared to be actively contributing to the hematopoietic output at the time of sampling, while almost all MPPs were doing so. Nonetheless, HSC clones displayed a higher contribution to the PB and BM samples of the same time point compared to MPP clones. We also quantified the output of HSCs and MPPs over all time points by calculating “sharing scores,” i.e., the level of identical ISs detected in HSCs or MPPs and various myeloid and lymphoid lineages over time (Supplemental Experimental Procedures). As a result, we found that both HSC and MPP clones isolated at 36 months after GT had actively participated in myeloid and lymphoid production for a period of 2.5 years, starting from 3 to 6 months after infusion of gene-corrected CD34+ cells (Figure 3C).
Analysis of Clonal Relationship among Individual Lineages in Steady-State Hematopoiesis
The level of detail achieved by our IS-based clonal tracking might allow assessment of the hierarchical relationships among engineered blood cell types in humans. To test the validity of different models of hematopoietic hierarchy, we first evaluated the overall biological consistency of four different parameters of molecular tracking in steady-state hematopoiesis (Figure 4A). The percentage of shared integrations was higher in BM CD34+ cells, consistent with the hierarchical level of these precursors compared to other subtypes, while it was lower in the lymphoid compartment. Conversely, the number of unique ISs, the diversity index, and the VCN were generally higher in lymphoid cells, in agreement with the selective growth advantage effect of gene-corrected clones belonging to this lineage. In addition, the lower number of ISs and the lower diversity of BM- versus PB-derived myeloid progenitor and mature cells might reflect the effect of sampling from a localized tissue site versus the PB, which should more homogeneously represent overall output.
Figure 4.

Hierarchical Relationships among Hematopoietic Lineages
(A) Dot plots representing, from left to right, the frequency of ISs shared with at least one other cell type, number of unique ISs, diversity index, and vector copy number of different cell compartments isolated from four WAS patients at the last time point when both BM and PB were collected (Mann-Whitney U test: ∗p < 0.05, ∗∗p < 0.01, ∗∗∗p < 0.001, and ∗∗∗∗p < 0.0001).
(B) Schematic representation of two alternative models of hematopoietic hierarchies implying distinct myeloid-lymphoid (left top graph) or myeloid-based (right top graph) branching of hematopoietic differentiation. A Bayesian network approach was used to visualize, estimate, and compare complex dependence structures among lineages of the first three WAS patients at last time point after GT (Supplemental Experimental Procedures) starting from IS data. The corresponding two different model constraints used for the test, not allowing or allowing probability dependencies between ISs retrieved in myeloid precursors and lymphoid mature cells, are schematically shown respectively on the left and right panels. A measure of the strength of informativeness of each model is provided using the Bayesian information criterion (BIC) score, which allows the statistical comparison of different hierarchical structures. The resulting BIC scores are shown above each panel. The resulting best-fitting model is framed with a red square. Models of hematopoietic hierarchies are adapted from Kawamoto et al. (2010b). Differentiation potential are labeled as follows: E, erythroid; M, myeloid; B, lymphoid B; and T, lymphoid T. Common progenitors are labeled as follows: CMP, common myeloid progenitor; CLP, common lymphoid progenitor; CMEP, common myeloerythroid progenitor; CMLP, common myelolymphoid progenitor; MTP, myeloid-lymphoid T progenitor; and MBP, myeloid-lymphoid B progenitor.
(C) Dynamic model of lineage similarities designed on m-dimensional continuous-time stochastic Markov process, observed at fixed time points (schematic representation and calculation formulas of different rates are shown on the left). Principal-component analysis (PCA) performed on estimated death, duplication, and differentiation rates during the 12, 24 and 36 months after GT calculated on IS sharing and sequence reads belonging to each IS. (The first two principal components are shown on the PCA plot on the right.) Clustering of BM and PB lineages is shown as rounded areas colored in blue and orange, respectively. Similarities among lineages are shown by the relative distance or proximity of the boxes tagged with their relative cellular surface markers (Supplemental Experimental Procedures).
See also Figures S3 and S4.
On the basis of these results, we studied IS similarities among lineages purified from the first three WAS patients at the last BM and PB collection to infer and test hematopoietic cell hierarchies by combining conditional probability distributions and graphical models of dependencies (Figure 4B; Supplemental Experimental Procedures). In model 1, we assumed that the observation of a specific IS in a myeloid progenitor only conditions the probability for the same IS to be observed in a mature myeloid cell. These constraints were designed to recapitulate at best, with our given set of data, a model where myeloid and lymphoid cells are segregated early in the hematopoietic hierarchy and should be marked by a significantly distinct set of ISs. In model 2, we assumed that the observation of a specific IS in a myeloid progenitor conditions the probability for the same IS to be observed in both myeloid and lymphoid cells. This model was designed to test the existence of a higher clonal relationship between myeloid and lymphoid cells as compared to model 1, due to a late segregation of myeloid and lymphoid compartment downstream of the hematopoietic hierarchy. Given these underlining structures, we tested our IS data collected from WAS GT patients and measured which model best fit the observed distribution of shared ISs along the lineages by means of the Bayesian information criterion (BIC) (Supplemental Experimental Procedures). As a result, the best-scoring model, based on IS tracking data, was model 2, which suggests the existence of a significant clonal relationship between myeloid and lymphoid lineages, i.e., we found that the probability of detecting an IS in a PB lymphoid lineage was significantly dependent on having observed the same IS in a BM myeloid precursor.
We then added a dynamic component to the analysis of clonal relationships, making use of sequence reads as surrogate markers of clonal dimensions. This method is based on the assumption that at time 0, transduced BM CD34+ cells re-infused into patients have been unequivocally marked by IS coordinates. Each individual cell fate is determined by a stochastic sequence of events of three different types: duplication, death, and differentiation into more committed cell types. Rates governing this dynamic evolution are assumed to be constant over time, shared among cells belonging to the same lineage but different across them. The result is that each cell behaves independently, and the collections of observed clone dynamics correspond to trajectories of the same underlying stochastic process. On the basis of these assumptions, it is possible to simultaneously impose branching structures and make inferences about rates (Figure 4C, left schematic representation; Supplemental Experimental Procedures).
In an exploratory setting, we only constrained the differentiation process according to three levels of hierarchy, where we assumed that BM CD34+ cells can differentiate into any other cell type in the BM and PB, BM can be connected to any cell type at the BM and PB level, and PB lineages cannot differentiate. The output of the procedure was a matrix of rate estimates (Supplemental Experimental Procedures) on which we performed principal-component analysis (PCA) to calculate the clonal proximity of different lineages (Figure 4C, right PCA plot). In the resulting graph, the closer two or more lineages, the higher their similarity based on estimated duplication, death, and differentiation rates. In line with their differentiation potential and in concordance with the long-term preservation of engrafted progenitors, BM CD34+ cells (in green) were distinct from the other lineages and displayed positive duplication-death rates (Supplemental Experimental Procedures). Importantly, as expected from their different biological activity, the BM progenitors and PB mature cells were clustered separately according to the three estimated parameters of duplication, death, and differentiation used as input for the PCA analysis. Another important validation of the analysis relied on the observation that the duplication-death rates were negative in all PB lineages (Supplemental Experimental Procedures), confirming that these populations require a clonal supply from the upstream progenitors. The biological consistency of these results allowed interrogating the PCA analysis on more refined questions, as clustering PB populations according to similar population rates. Within the PB cells, the algorithm clustered together lymphoid T and B cells, most likely due to their common capacity of long-term survival and clonal supply from shared lymphoid progenitors. Notably, these estimates again revealed a proximity between NK and myeloid cells, suggesting a parallelism in population rates that might derive from a potential common origin of these two lineages.
This dynamic model also allowed the investigation of candidate branching structures to confirm the validity of those findings obtained with the Bayesian approach, as shown in Figure 4B. To achieve this, as reported in the Supplemental Experimental Procedures, we imposed a set of constraints to test which of the models proposed in Figure 4B was more supported by the experimental data. The results suggest again that the empirical data appear to support a structure implying late branching of myeloid and lymphoid lineages.
Assessment of Potential Unbalances in Clonal Contribution due to Insertional Mutagenesis
The permanent molecular marking achieved by vector integration has the inherent potential to induce clonal skewing in vivo due to insertional mutagenesis (Biasco et al., 2012). We thus assessed whether major clonal imbalances could be observed over time in the PB of our patients, which might affect the interpretation of our IS data. As reported in Figure S3, none of the four GT-treated patients showed overrepresented clones (composing >20% of analyzed whole blood), and we could not detect any evidence of IS-driven proto-oncogene perturbations leading to clonal dominance up to 48 months after GT. Moreover, the profile of genes neighboring vector ISs (Figure S4) was in line with known LV insertional preferences and was still comparable with that shown for the early follow-up of WAS GT patients (Aiuti et al., 2013).
Discussion
We herein described a detailed clonal tracking of hematopoietic reconstitution dynamics and HSPC activity in humans at the early and late stages after autologous transplantation. The number of tracked clones, homogeneously contributing to hematopoiesis in a highly polyclonal fashion, and the multiple cell types analyzed permitted comprehensive and detailed observation of the fate of human blood cells. Furthermore, as long-term monitoring using IS analyses, peripheral blood TCR Vbeta analyses, multiple BM evaluations, karyotypic analyses, and clinical observation continues to show a lack of evidence for genotoxicity (Naldini, 2015), we can consider LV genome marking to be mostly neutral, thus providing a reliable tool for studying human hematopoiesis in vivo.
To address all the potential limitations of our analytical methods, we used multiple approaches and stringent filtering criteria. We exploited the statistical methodologies used in ecology, which are specifically designed to account for sampling variability. We also introduced customized data filtering to reduce the confounding effects of sample impurity after sorting, and we assessed and limited the impact of cross-contamination during processing. To reinforce our results, we applied additional filters and modeling constraints to account for PCR-related biases affecting sequence reads and assessed the accuracy of IS identification and quantification using dedicated validation assays (see Supplemental Experimental Procedures).
We analyzed several parameters at the individual lineage level and unveiled the presence of two phases of human hematopoietic reconstitution, and we provide an estimate of the number of engrafted clones actively contributing to long-term hematopoiesis after transplantation. We showed that the reconstitution of human hematopoiesis early after autologous transplantation is characterized by fluctuating phases and that steady-state hematopoiesis is reached at ∼6–12 months. The clonal repertoire diversity of each population in vivo was consistent with the longer time needed to achieve lymphoid reconstitution and with the presence of unevenly active clones in the initial reconstitution phases after GT. Our clonal population estimates revealed that only a few thousand clones appear responsible for the maintenance of the whole engineered blood system in steady state. In our GT trial, we infused 80–230 million CD34+ HSPCs per patient (Aiuti et al., 2013, Castiello et al., 2015). Considering that the gene-correction frequency of infused CD34+ cells was above 88%, our estimates suggest that about 1 in 105–106 gene-corrected HSPCs had the potential to engraft long-term. Despite the fact that we could not measure the actual number of infused HSCs and the potential biases related to clones bearing more than one integrant, this estimate would fall in the upper range of our predictions, according to the marking level of vector-positive CD34+ cells before infusion, indicating that cell culture and transduction did not induce a substantial loss of harvested HSCs.
The estimated higher clonal abundance of BM CD34+ cells in early versus steady-state phases of hematopoietic reconstitution might suggest that the first wave of short-term precursors involves a larger population compared to that composed of long-term engrafting HSPCs, which takes over hematopoiesis only after 3–6 months. These results confirm and expand the information previously generated from clonal tracking in non-human HSPCs (Dykstra and Bystrykh, 2014, Gerrits et al., 2010, Naik et al., 2013, Perié et al., 2014, Wu et al., 2014).
Unlike previous studies, our clonal tracking was performed not only on PB mature populations but also on BM progenitors purified at different time points, allowing real-time analysis of progenitor output. Our data suggest that the first phases of hematopoietic reconstitution are most likely sustained by lineage-committed progenitors that are possibly primed during in vitro manipulation and are more numerous in the graft upon infusion. We were able to identify a switch ∼6 months after GT when we observed exhaustion of the first wave of clonal reconstitution, reduction in the total number of CD34+ clones, and progressive takeover of long-term HSCs, generating a stable output up to the last follow-up 3 years after GT. There was little evidence of lineage output from long-term HSCs during the first 6 months post-GT, indicating a sharp segregation of tasks among the engrafting progenitors, with cells contributing to early hematopoietic recovery being short-lived and mostly of restricted lineage potency, and long-term multi-potent HSCs apparently entering quiescence within this time. We considered that potential uneven distribution of early engrafting clones in the BM niches might affect the detection of HSCs active in early versus late phases. However, the tracking of PB cells, and in particular of PB myeloid populations (a recognized surrogate readout for progenitor activity), also confirmed the independent clustering of two distinct clonal waves in PB lineages that are, by definition, much less affected by sampling biases than topologically localized BM HSCs (Figure S2).
Our clonal characterization of bona fide HSCs and MPPs isolated from patients at 3 years after GT showed that at least a fraction of BM-resident HSCs actively contributes to the hematopoietic output in real time at the time of analysis (Figure 3B). The relative fraction of HSC clones involved in hematopoietic production was lower compared to MPPs (30% versus 80%), indicating that a substantial proportion of HSCs is dormant for a prolonged time. Nonetheless, we achieved formal proof of the ability of individual human HSC clones to constantly self-renew and differentiate in vivo over a period of up to 3 years. The absolute number of clones identifiable over time (15 versus 8) and the extent of overall multilineage output (Figure 3C) were greater for HSCs than for sampled MPPs. Intriguingly, these data appear to partially differ from what was reported in a recent work, where the authors suggest that native steady-state hematopoiesis might be more actively supported by MPPs than by HSCs (Sun et al., 2014). One remarkable result of our analysis was that both progenitor subtypes isolated at steady-state hematopoiesis contained clones whose activity could be tracked back to 3–6 months after GT, but not earlier. Although obviously present in the engrafted pool of HSPCs, these clones could not be identified as being active in the first months after GT. This suggests that HSC clones were, for the most part, maintained quiescent until the first active set of committed progenitors reached exhaustion and potentially made space in the BM for the activation and expansion of long-term HSC clones and their differentiation inside committed progenitor niches (Morrison and Scadden, 2014). In this context, one could postulate that the MPP clones isolated at 3 years, and showing peripheral output well before, had an HSC phenotype at previous time points. It is still possible, however, that MPPs, contained in the infused sample of transduced CD34+ cells, engrafted and preserved their phenotype and might thus be endowed with long-term self-renewing potential like HSCs. Additional investigations are underway based on the prospective tracking of different subsets of human HSPCs.
Our results on IS-based tracking were consistent with the current understanding of the biology of the hematopoietic system and showed important parallelisms with data derived from the tracking of normal hematopoiesis in animal studies. In particular, our proposed model of human hematopoietic reconstitution is in agreement with the nature of blood cell repopulation reported in wild-type rhesus macaques after transplant with genetically modified HSPCs (Kim et al., 2014). These similarities include (1) the observed timing of exhaustion of the first wave of short-term progenitors, (2) the stable contribution of multipotent progenitors with a balanced myelolymphoid potential at steady state, and (3) the estimated relative small fraction of stem cell clones actually contributing to the long-term clonal output. Our findings constitute a comparative platform to test the validity of animal studies in recapitulating human hematopoiesis and could be of significant help on refining and reducing the use of animals in future preclinical xeno-transplantation studies.
Importantly, these observations strongly suggest that although clonal tracking studies in humans can be conducted, by definition, only in the context of clinical trials based on the genetic correction of a diseased background, hematopoiesis in our WAS GT patients was, for the most part, restored with physiological reconstitution dynamics to normal levels. Indeed, hematological and clinical parameters of the patients (including BM and PB cell counts, immune phenotype, morphology, and karyotype as well as the number of CD34+ progenitor cells), with the exception of platelet counts, are all comparable to those of healthy untreated age-matched individuals (unpublished data). Given the initial lymphopenic environment and the fludarabine conditioning, the dynamics of lymphoid reconstitution observed in the peripheral blood of WAS patients during the early phases after GT could partially differ from other allogeneic HSPC transplantation settings (Alho et al., 2016, Moratto et al., 2011, Pai et al., 2006, Shin et al., 2012). Importantly, in WAS patients showing normalization of lymphocytes content after allogeneic HSPC transplantation, T cell counts reached a plateau at 12 months after transplant (Pai et al., 2006), a result in agreement with our data on lymphocyte recovery dynamics. It will be also important, in future studies, to compare the pattern of reconstitution in our patients with those observed in other GT trials using myeloablative conditioning and in disease contexts where no selective advantage for gene-corrected lymphocytes is expected (Biffi et al., 2013, Cartier et al., 2009). Still, the nature of hematopoietic reconstitution in WAS patients does not suggest that there is an original defect in the progenitor niches of the lymphoid compartment. Actually, most of the selective advantages for gene-corrected lymphocytes occur at later stages of maturation, indicating that, upon correction of the genetic defect, the normally engrafting progenitors became able to fully overcome the cell-intrinsic differentiation defect (Aiuti et al., 2013, Castiello et al., 2015).
As all patients reached a normal and stable hematopoietic output at ∼12 months after GT, we reasoned that this clinical setting represents a valid model to interrogate steady-state blood cell production in humans. With the application of model-driven statistical approaches, we showed that the probability of observing an IS in a mature lymphoid cell was statistically dependent on observing the same IS in a myeloid progenitor (Figure 4B; Supplemental Experimental Procedures). These data support the recently proposed myeloid-based model of hematopoiesis, envisaging the existence of common myelolymphoid progenitors distinct from the HSC (Kawamoto et al., 2010b). The dynamic framework developed for this study, employing individual clonal sizes to estimate death, duplication, and differentiation rates, was coherent with the accepted biology of the hematopoietic system and allowed unsupervised clustering of BM and PB lineages. Within the BM compartment, CD3+ and CD14+ cells were distinct from the other BM Lin+ cells. This might be due to the fact that some or most of these cells re-circulated from other sites to the BM at the time of collection, therefore being genealogically distinct from the locally sampled BM precursors. With regard to PB cell types, both our statistical model and the unsupervised clustering of clonal relationships with CD34+ cells shown in Figure 2C support the notion that NK CD56+ cells might have a distinct origin compared to other lymphoid cells and are possibly more closely related to the myeloid lineage. These results match the observations recently made in non-human-primate clonal tracking studies, on the basis of which Wu et al. propose an ontologically distinct origin of NK cells (Wu et al., 2014), and are in accordance with Grzywacz et al. model, in which human NK cells are able to differentiate from myeloid progenitors (Grzywacz et al., 2014). Overall, we believe that the statistical and mathematical models developed for this study represent valid instruments to investigate complex biological processes, such as the shape of hematopoietic differentiation in vivo in humans using IS analysis. Future refinement of these tools might increase the resolution and precision of the assessment of clonal relationship and behavior.
No progressive clonal expansion was detected in any of the studied patients, and we can reasonably assume that the proportion and impact of clones representing >5% of the population on our analysis of clonal dynamics is negligible (7 putative overrepresented clones out of 89,594 tracked clones, or 0.008% of the analyzed population; Figure S3). These data strongly suggest that our tracking system was not substantially affected by vector-related aberrant clonal skewing.
We herein provide a comprehensive clonal tracking of hematopoietic reconstitution after HSPC transplantation in humans. The information collected in our study validates some long-standing models regarding human hematopoiesis and sheds light on the clonal dynamics of blood cells in vivo at early and late stages, as well as on HSPC activity in steady-state hematopoiesis in humans. In addition, our results further establish the potential of the safe and extensive engineering of human hematopoiesis with ex vivo LV gene transfer. These data provide a crucial reference for the follow-up of ongoing HSPC GT clinical trials and will be critical in designing novel approaches for the treatment of a wide spectrum of hematological disorders.
Experimental Procedures
Patients
Four male WAS patients (age range, 1.1–5.9 years) for whom no human leukocyte antigen (HLA)-identical sibling donor or suitable matched unrelated donor was available, underwent LV GT at a median age of 2.75 years after a reduced-conditioning regimen protocol (Aiuti et al., 2013, Castiello et al., 2015, Cicalese and Aiuti, 2015) (http://www.clinicaltrials.gov, #NCT01515462). CD34+ cells were isolated from the BM of all patients (for patient 1, a proportion of CD34+ cells were also isolated from granulocyte colony-stimulating factor [G-CSF] mobilized PB), transduced ex vivo with the LV w1.6W vector, and reinfused at a similar dose ranging from 8.9 to 14.1 CD34+ cells/kg. Clinical protocol, CD34+ transduction conditions, methods to calculate transduction efficiency, VCN of infused cells, and measurement of clinical endpoints have been reported elsewhere (Aiuti et al., 2013). All patients treated with LV GT in this study are alive and clinically well at the time of submission of this report. Patients recovered from transient neutropenia following chemotherapy, showed gradual reduction in the frequency and severity of infection and bleeding, and became independent from platelet transfusion. No clinical manifestations of autoimmunity were observed after year 1 of follow-up, and no adverse event associated with vector integration has been reported to date (unpublished data). Biological samples were obtained from WAS patients, with the approval of the San Raffaele Scientific Institute’s ethics committee, together with consent from patients or parents.
Collection of Samples for IS Analysis
CD3+, CD4+, CD8+, CD14+, CD15+, CD19+, and CD56+ cells were purified from mononuclear cells (MNCs) from PB. CD3+, CD14+, CD15+, CD19+, CD34+, CD56+, CD61+, and glycophorin+ (GLYCO) cells were purified from BM-derived MNCs using positive selection with immunomagnetic beads (average purity, 94.2%) according to the manufacturer’s specifications (Miltenyi Biotec). Whole PB, peripheral blood mononuclear cells (PBMCs), whole BM, and BM MNCs were also collected. A CFC assay was performed on ex vivo BM CD34+ cells according to the manufacturer’s specifications in Methocult medium (STEMCELL Technologies). At day 14, colonies were collected and genomic DNA was extracted for IS retrieval. Bone marrow MNC from WAS-GT patients were isolated using Ficoll-Hypaque gradient separation (Lymphoprep, Fresenius), and enriched for CD34+ cells with the human anti-CD34 MicroBeads Isolation Kit (Miltenyi Biotec) according to the manufacturer’s specifications. To isolate HSCs and MPPs, CD34+ cells were labeled with anti-human Lin cocktail (anti-CD3/CD14/CD16/CD19/CD20/CD56), anti-CD15/CD34/CD38/CD45RA (BioLegend), and anti-CD90 (BD Biosciences) fluorescent antibodies and FACS purified with the MoFlo-XDP cell sorter (Beckman Coulter), achieving purity ranging between 92% and 99%. In total, we collected 3,150 HSCs and 2,300 MPPs from patient 2 and 600 HSCs and 155 MPPs from patient 3 (see Supplemental Experimental Procedures).
IS Retrieval
ISs were collected from bead-isolated or FACS-sorted blood cell types through LAM-PCR and high-throughput sequencing as previously described (Aiuti et al., 2013). Genomic DNA from isolated cell types was extracted (QIAamp DNA Blood Mini kit or Micro kit, QIAGEN), and whole-genome amplification was performed (Repli-G Mini Kit, QIAGEN) only on FACS-sorted HSC and MPP populations as previously described (Biasco et al., 2015). Raw IS datasets underwent a series of different filtering procedures, according to the type of analysis required (see Supplemental Experimental Procedures).
Analysis of ISs for Clonal Tracking
The methods, as well as the mathematical and statistical tools used for all analyses, are described in detail in Supplemental Experimental Procedures.
Author Contributions
L.B. designed and performed IS analyses, supervised the project, and wrote the manuscript; D.P. designed and applied dynamic mathematical models of hematopoiesis; S. Scala and L.B.R. performed HSPC progenitor purification and IS retrieval from HSCs and MPPs; F.D. and C.B. performed LAM-PCR for all BM and PB patient samples and additional molecular testing for VCN estimation; L.L. performed validation assays for IS contaminations and quantifications; S. Scaramuzza and S.G. performed isolation of patient cell lineages; F.F. and M.P.C provided WAS patients BM and PB samples and clinical data; V.N. and D.J.D. provided technical support for the IS collection from Pt1–3 at early time points after GT; M.S. and C.V.K. provided sequencing platform and technical support for Pt2 collection of IS at 4, 5, and 5.5 months after GT; M.G.R. and F.C. contributed as principal investigators (PIs) of the TIGET-WAS clinical trial by interpreting clinical data; P.V. designed and tested the networks of hematopoietic hierarchy; C.D.S. and E.W. supervised the model design and the statistical analyses; L.N. contributed to data interpretation and discussion; A.A. contributed as PI by interpreting clinical data, supervised the project, and wrote the manuscript.
Conflicts of Interest
C.V.K. and M.S. are co-founders of GeneWerk GmbH. D.J.D. and V.N. are employees and shareholders of GlaxoSmithKline (GSK). L.N. is the inventor of various patents on lentiviral vector technology that are owned by the Salk Institute and Cell Genesis and licensed to Lentigen. L.N. is entitled to receive royalties from one of these patents (US patent number 6,013,516 with Salk Institute). L.N. is a founder of, owns equity in, and chairs the scientific advisory board of Genenta Science, a biotechnology startup aiming to develop alpha-IFN gene therapy of certain tumor types using tumor-infiltrating monocytes. In 2010, Telethon and OSR, through TIGET, entered a strategic alliance with GSK for the development, up to marketing authorization, of hematopoietic stem cell gene therapy for various rare diseases. Whereas TIGET remains responsible for the pre-clinical development and early clinical testing of such therapies, GSK has option rights once clinical proof of concept is achieved. In 2014, the gene therapies of metachromatic leukodystrophy (MLD) and WAS were licensed to GSK, and GSK became the financial sponsor of the trials. A.A. is the principal investigator of the TIGET-WAS clinical trial.
Acknowledgments
This work was supported by Fondazione Telethon (TIGET Core Grant), the European Commission (CELL-PID HEALTH-F5-2010-261387), and Ministero della Salute (Ricerca Finalizzata, 005/RF-2009-1485896 to A.A.). We thank all medical and nursing staff of the TIGET Pediatric Clinical Research Unit and the Pediatric Immunohematology and Bone Marrow Transplant Unit; M. Casiraghi, M. Facchini, M. Bonopane, G. Tomaselli, and all TCTO personnel for clinical trial management and support; E. Montini and A. Calabria for providing the IS mapping platform; the GlaxoSmithKline (GSK) research and development (R&D) team for revising the manuscript; M. Gabaldo for support with project management; and P. Massariello and other MolMed staff for patient cell manipulation. We are grateful to A. Klein for the fruitful scientific discussions. We thank M. John, a native English speaker, for revising the manuscript. We are indebted to the patients and their families for their commitment.
Published: May 26, 2016
Footnotes
Supplemental Information includes Supplemental Experimental Procedures, four figures, and one table and can be found with this article online at http://dx.doi.org/10.1016/j.stem.2016.04.016.
Contributor Information
Luca Biasco, Email: biasco.luca@hsr.it.
Alessandro Aiuti, Email: aiuti.alessandro@hsr.it.
Supplemental Information
A PDF file containing additional details of the technical procedures and protocols employed for the analyses shown in the main manuscript is provided.
References
- Aiuti A., Cassani B., Andolfi G., Mirolo M., Biasco L., Recchia A., Urbinati F., Valacca C., Scaramuzza S., Aker M. Multilineage hematopoietic reconstitution without clonal selection in ADA-SCID patients treated with stem cell gene therapy. J. Clin. Invest. 2007;117:2233–2240. doi: 10.1172/JCI31666. [DOI] [PMC free article] [PubMed] [Google Scholar]
- Aiuti A., Cattaneo F., Galimberti S., Benninghoff U., Cassani B., Callegaro L., Scaramuzza S., Andolfi G., Mirolo M., Brigida I. Gene therapy for immunodeficiency due to adenosine deaminase deficiency. N. Engl. J. Med. 2009;360:447–458. doi: 10.1056/NEJMoa0805817. [DOI] [PubMed] [Google Scholar]
- Aiuti A., Biasco L., Scaramuzza S., Ferrua F., Cicalese M.P., Baricordi C., Dionisio F., Calabria A., Giannelli S., Castiello M.C. Lentiviral hematopoietic stem cell gene therapy in patients with Wiskott-Aldrich syndrome. Science. 2013;341:1233151. doi: 10.1126/science.1233151. [DOI] [PMC free article] [PubMed] [Google Scholar]
- Akashi K., Traver D., Miyamoto T. A clonogenic common myeloid progenitor that gives rise to all myeloid lineages. Nature. 2000;404:193–197. doi: 10.1038/35004599. [DOI] [PubMed] [Google Scholar]
- Alho A.C., Kim H.T., Chammas M.J., Reynolds C.G., Matos T.R., Forcade E., Whangbo J., Nikiforow S., Cutler C.S., Koreth J. Unbalanced recovery of regulatory and effector T cells after allogeneic stem cell transplantation contributes to chronic GVHD. Blood. 2016;127:646–657. doi: 10.1182/blood-2015-10-672345. [DOI] [PMC free article] [PubMed] [Google Scholar]
- Babovic S., Eaves C.J. Hierarchical organization of fetal and adult hematopoietic stem cells. Exp. Cell Res. 2014;329:185–191. doi: 10.1016/j.yexcr.2014.08.005. [DOI] [PubMed] [Google Scholar]
- Benveniste P., Frelin C., Janmohamed S., Barbara M., Herrington R., Hyam D., Iscove N.N. Intermediate-term hematopoietic stem cells with extended but time-limited reconstitution potential. Cell Stem Cell. 2010;6:48–58. doi: 10.1016/j.stem.2009.11.014. [DOI] [PubMed] [Google Scholar]
- Biasco L., Baricordi C., Aiuti A. Retroviral integrations in gene therapy trials. Mol. Ther. 2012;20:709–716. doi: 10.1038/mt.2011.289. [DOI] [PMC free article] [PubMed] [Google Scholar]
- Biasco L., Scala S., Basso Ricci L., Dionisio F., Baricordi C., Calabria A., Giannelli S., Cieri N., Barzaghi F., Pajno R. In vivo tracking of T cells in humans unveils decade-long survival and activity of genetically modified T memory stem cells. Sci. Transl. Med. 2015;7:273ra13. doi: 10.1126/scitranslmed.3010314. [DOI] [PubMed] [Google Scholar]
- Biffi A., Montini E., Lorioli L., Cesani M., Fumagalli F., Plati T., Baldoli C., Martino S., Calabria A., Canale S. Lentiviral hematopoietic stem cell gene therapy benefits metachromatic leukodystrophy. Science. 2013;341:1233158. doi: 10.1126/science.1233158. [DOI] [PubMed] [Google Scholar]
- Candotti F., Shaw K.L., Muul L., Carbonaro D., Sokolic R., Choi C., Schurman S.H., Garabedian E., Kesserwan C., Jagadeesh G.J. Gene therapy for adenosine deaminase-deficient severe combined immune deficiency: clinical comparison of retroviral vectors and treatment plans. Blood. 2012;120:3635–3646. doi: 10.1182/blood-2012-02-400937. [DOI] [PMC free article] [PubMed] [Google Scholar]
- Cartier N., Hacein-Bey-Abina S., Bartholomae C.C., Veres G., Schmidt M., Kutschera I., Vidaud M., Abel U., Dal-Cortivo L., Caccavelli L. Hematopoietic stem cell gene therapy with a lentiviral vector in X-linked adrenoleukodystrophy. Science. 2009;326:818–823. doi: 10.1126/science.1171242. [DOI] [PubMed] [Google Scholar]
- Castiello M.C., Scaramuzza S., Pala F., Ferrua F., Uva P., Brigida I., Sereni L., van der Burg M., Ottaviano G., Albert M.H. B-cell reconstitution after lentiviral vector-mediated gene therapy in patients with Wiskott-Aldrich syndrome. J. Allergy Clin. Immunol. 2015;136:692–702. doi: 10.1016/j.jaci.2015.01.035. [DOI] [PMC free article] [PubMed] [Google Scholar]
- Cavazzana-Calvo M., André-Schmutz I., Fischer A. Haematopoietic stem cell transplantation for SCID patients: where do we stand? Br. J. Haematol. 2013;160:146–152. doi: 10.1111/bjh.12119. [DOI] [PubMed] [Google Scholar]
- Cheung A.M.S., Nguyen L.V., Carles A., Beer P., Miller P.H., Knapp D.J.H.F., Dhillon K., Hirst M., Eaves C.J. Analysis of the clonal growth and differentiation dynamics of primitive barcoded human cord blood cells in NSG mice. Blood. 2013;122:3129–3138. doi: 10.1182/blood-2013-06-508432. [DOI] [PMC free article] [PubMed] [Google Scholar]
- Cicalese M.P., Aiuti A. Clinical applications of gene therapy for primary immunodeficiencies. Hum. Gene Ther. 2015;26:210–219. doi: 10.1089/hum.2015.047. [DOI] [PMC free article] [PubMed] [Google Scholar]
- Doulatov S., Notta F., Laurenti E., Dick J.E. Hematopoiesis: a human perspective. Cell Stem Cell. 2012;10:120–136. doi: 10.1016/j.stem.2012.01.006. [DOI] [PubMed] [Google Scholar]
- Dykstra B., Bystrykh L.V. No monkeying around: clonal tracking of stem cells and progenitors in the macaque. Cell Stem Cell. 2014;14:419–420. doi: 10.1016/j.stem.2014.03.006. [DOI] [PMC free article] [PubMed] [Google Scholar]
- Ema H., Morita Y., Suda T. Heterogeneity and hierarchy of hematopoietic stem cells. Exp. Hematol. 2014;42:74–82. doi: 10.1016/j.exphem.2013.11.004. [DOI] [PubMed] [Google Scholar]
- Gaspar H.B., Cooray S., Gilmour K.C., Parsley K.L., Zhang F., Adams S., Bjorkegren E., Bayford J., Brown L., Davies E.G. Hematopoietic stem cell gene therapy for adenosine deaminase-deficient severe combined immunodeficiency leads to long-term immunological recovery and metabolic correction. Sci. Transl. Med. 2011;3:97ra80. doi: 10.1126/scitranslmed.3002716. [DOI] [PubMed] [Google Scholar]
- Gerrits A., Dykstra B., Kalmykowa O.J., Klauke K., Verovskaya E., Broekhuis M.J.C., de Haan G., Bystrykh L.V. Cellular barcoding tool for clonal analysis in the hematopoietic system. Blood. 2010;115:2610–2618. doi: 10.1182/blood-2009-06-229757. [DOI] [PubMed] [Google Scholar]
- Grzywacz B., Kataria N., Kataria N., Blazar B.R., Miller J.S., Verneris M.R. Natural killer cell differentiation by myeloid progenitors. Blood. 2014;117:3548–3559. doi: 10.1182/blood-2010-04-281394. [DOI] [PMC free article] [PubMed] [Google Scholar]
- Gschweng E., De Oliveira S., Kohn D.B. Hematopoietic stem cells for cancer immunotherapy. Immunol. Rev. 2014;257:237–249. doi: 10.1111/imr.12128. [DOI] [PMC free article] [PubMed] [Google Scholar]
- Hacein-Bey-Abina S., Hauer J., Lim A., Picard C., Wang G.P., Berry C.C., Martinache C., Rieux-Laucat F., Latour S., Belohradsky B.H. Efficacy of gene therapy for X-linked severe combined immunodeficiency. N. Engl. J. Med. 2010;363:355–364. doi: 10.1056/NEJMoa1000164. [DOI] [PMC free article] [PubMed] [Google Scholar]
- Hacein-Bey Abina S., Gaspar H.B., Blondeau J., Caccavelli L., Charrier S., Buckland K., Picard C., Six E., Himoudi N., Gilmour K. Outcomes following gene therapy in patients with severe Wiskott-Aldrich syndrome. JAMA. 2015;313:1550–1563. doi: 10.1001/jama.2015.3253. [DOI] [PMC free article] [PubMed] [Google Scholar]
- Jenq R.R., van den Brink M.R.M. Allogeneic haematopoietic stem cell transplantation: individualized stem cell and immune therapy of cancer. Nat. Rev. Cancer. 2010;10:213–221. doi: 10.1038/nrc2804. [DOI] [PubMed] [Google Scholar]
- Kawamoto H., Ikawa T., Masuda K., Wada H., Katsura Y. A map for lineage restriction of progenitors during hematopoiesis: the essence of the myeloid-based model. Immunol. Rev. 2010;238:23–36. doi: 10.1111/j.1600-065X.2010.00959.x. [DOI] [PubMed] [Google Scholar]
- Kawamoto H., Wada H., Katsura Y. A revised scheme for developmental pathways of hematopoietic cells: the myeloid-based model. Int. Immunol. 2010;22:65–70. doi: 10.1093/intimm/dxp125. [DOI] [PubMed] [Google Scholar]
- Kim S., Kim N., Presson A.P., Metzger M.E., Bonifacino A.C., Sehl M., Chow S.A., Crooks G.M., Dunbar C.E., An D.S. Dynamics of HSPC repopulation in nonhuman primates revealed by a decade-long clonal-tracking study. Cell Stem Cell. 2014;14:473–485. doi: 10.1016/j.stem.2013.12.012. [DOI] [PMC free article] [PubMed] [Google Scholar]
- Kondo M., Weissman I.L., Akashi K. Identification of clonogenic common lymphoid progenitors in mouse bone marrow. Cell. 1997;91:661–672. doi: 10.1016/s0092-8674(00)80453-5. [DOI] [PubMed] [Google Scholar]
- Laurenti E., Dick J.E. Molecular and functional characterization of early human hematopoiesis. Ann. N Y Acad. Sci. 2012;1266:68–71. doi: 10.1111/j.1749-6632.2012.06577.x. [DOI] [PubMed] [Google Scholar]
- Laurenti E., Doulatov S., Zandi S., Plumb I., Chen J., April C., Fan J.-B., Dick J.E. The transcriptional architecture of early human hematopoiesis identifies multilevel control of lymphoid commitment. Nat. Immunol. 2013;14:756–763. doi: 10.1038/ni.2615. [DOI] [PMC free article] [PubMed] [Google Scholar]
- Majeti R., Park C.Y., Weissman I.L. Identification of a hierarchy of multipotent hematopoietic progenitors in human cord blood. Cell Stem Cell. 2007;1:635–645. doi: 10.1016/j.stem.2007.10.001. [DOI] [PMC free article] [PubMed] [Google Scholar]
- Mohty M., Hübel K., Kröger N., Aljurf M., Apperley J., Basak G.W., Bazarbachi A., Douglas K., Gabriel I., Garderet L. Autologous haematopoietic stem cell mobilisation in multiple myeloma and lymphoma patients: a position statement from the European Group for Blood and Marrow Transplantation. Bone Marrow Transplant. 2014;49:865–872. doi: 10.1038/bmt.2014.39. [DOI] [PubMed] [Google Scholar]
- Moratto D., Giliani S., Bonfim C., Mazzolari E., Fischer A., Ochs H.D., Cant A.J., Thrasher A.J., Cowan M.J., Albert M.H. Long-term outcome and lineage-specific chimerism in 194 patients with Wiskott-Aldrich syndrome treated by hematopoietic cell transplantation in the period 1980-2009: an international collaborative study. Blood. 2011;118:1675–1684. doi: 10.1182/blood-2010-11-319376. [DOI] [PMC free article] [PubMed] [Google Scholar]
- Morrison S.J., Scadden D.T. The bone marrow niche for haematopoietic stem cells. Nature. 2014;505:327–334. doi: 10.1038/nature12984. [DOI] [PMC free article] [PubMed] [Google Scholar]
- Naik S.H., Perié L., Swart E., Gerlach C., van Rooij N., de Boer R.J., Schumacher T.N. Diverse and heritable lineage imprinting of early haematopoietic progenitors. Nature. 2013;496:229–232. doi: 10.1038/nature12013. [DOI] [PubMed] [Google Scholar]
- Naldini L. Ex vivo gene transfer and correction for cell-based therapies. Nat. Rev. Genet. 2011;12:301–315. doi: 10.1038/nrg2985. [DOI] [PubMed] [Google Scholar]
- Naldini L. Gene therapy returns to centre stage. Nature. 2015;526:351–360. doi: 10.1038/nature15818. [DOI] [PubMed] [Google Scholar]
- Nolta J.A.N.A., Dao M.A., Wells S., Smogorzewska E.M., Kohn D.B. Transduction of pluripotent human hematopoietic stem demonstrated by clonal analysis after engraftment in immune-deficient mice. Proc. Natl. Acad. Sci. U S A. 1996;93:2414–2419. doi: 10.1073/pnas.93.6.2414. [DOI] [PMC free article] [PubMed] [Google Scholar]
- Notta F., Doulatov S., Laurenti E., Poeppl A., Jurisica I., Dick J.E. Isolation of single human hematopoietic stem cells capable of long-term multilineage engraftment. Science. 2011;333:218–221. doi: 10.1126/science.1201219. [DOI] [PubMed] [Google Scholar]
- Pai S.-Y., DeMartiis D., Forino C., Cavagnini S., Lanfranchi A., Giliani S., Moratto D., Mazza C., Porta F., Imberti L. Stem cell transplantation for the Wiskott-Aldrich syndrome: a single-center experience confirms efficacy of matched unrelated donor transplantation. Bone Marrow Transplant. 2006;38:671–679. doi: 10.1038/sj.bmt.1705512. [DOI] [PubMed] [Google Scholar]
- Perié L., Hodgkin P.D., Naik S.H., Schumacher T.N., de Boer R.J., Duffy K.R. Determining lineage pathways from cellular barcoding experiments. Cell Rep. 2014;6:617–624. doi: 10.1016/j.celrep.2014.01.016. [DOI] [PubMed] [Google Scholar]
- Scaramuzza S., Biasco L., Ripamonti A., Castiello M.C., Loperfido M., Draghici E., Hernandez R.J., Benedicenti F., Radrizzani M., Salomoni M. Preclinical safety and efficacy of human CD34(+) cells transduced with lentiviral vector for the treatment of Wiskott-Aldrich syndrome. Mol. Ther. 2012;21:175–184. doi: 10.1038/mt.2012.23. [DOI] [PMC free article] [PubMed] [Google Scholar]
- Shin C.R., Kim M.O., Li D., Bleesing J.J., Harris R., Mehta P., Jodele S., Jordan M.B., Marsh R.A., Davies S.M., Filipovich A.H. Outcomes following hematopoietic cell transplantation for Wiskott-Aldrich syndrome. Bone Marrow Transplant. 2012;47:1428–1435. doi: 10.1038/bmt.2012.31. [DOI] [PubMed] [Google Scholar]
- Sun J., Ramos A., Chapman B., Johnnidis J.B., Le L., Ho Y.-J., Klein A., Hofmann O., Camargo F.D. Clonal dynamics of native haematopoiesis. Nature. 2014;514:322–327. doi: 10.1038/nature13824. [DOI] [PMC free article] [PubMed] [Google Scholar]
- Tey S., Brenner M.K. The continuing contribution of gene marking to cell and gene therapy. Mol. Ther. 2007;15:666–676. doi: 10.1038/sj.mt.6300109. [DOI] [PubMed] [Google Scholar]
- Wang G.P., Berry C.C., Malani N., Leboulch P., Fischer A., Hacein-Bey-Abina S., Cavazzana-Calvo M., Bushman F.D. Dynamics of gene-modified progenitor cells analyzed by tracking retroviral integration sites in a human SCID-X1 gene therapy trial. Blood. 2010;115:4356–4366. doi: 10.1182/blood-2009-12-257352. [DOI] [PMC free article] [PubMed] [Google Scholar]
- Williams D.A. Broadening the indications for hematopoietic stem cell genetic therapies. Cell Stem Cell. 2013;13:263–264. doi: 10.1016/j.stem.2013.08.006. [DOI] [PubMed] [Google Scholar]
- Wright D.E., Wagers A.J., Gulati A.P., Johnson F.L., Weissman I.L. Physiological migration of hematopoietic stem and progenitor cells. Science. 2001;294:1933–1936. doi: 10.1126/science.1064081. [DOI] [PubMed] [Google Scholar]
- Wu C., Li B., Lu R., Koelle S.J., Yang Y., Jares A., Krouse A.E., Metzger M., Liang F., Loré K. Clonal tracking of rhesus macaque hematopoiesis highlights a distinct lineage origin for natural killer cells. Cell Stem Cell. 2014;14:486–499. doi: 10.1016/j.stem.2014.01.020. [DOI] [PMC free article] [PubMed] [Google Scholar]
Associated Data
This section collects any data citations, data availability statements, or supplementary materials included in this article.
Supplementary Materials
A PDF file containing additional details of the technical procedures and protocols employed for the analyses shown in the main manuscript is provided.