

Abstract
Background
Excess accumulation of abdominal subcutaneous (SAT) and visceral adipose tissue (VAT) is associated with adverse levels of adipokines and cardiovascular disease risk. Whether fat quality is associated with adipokines has not been firmly established. This study examined the association between abdominal SAT and VAT density, an indirect measure of fat quality, with a panel of metabolic regulatory biomarkers secreted by adipose tissue or the liver independently of absolute fat volumes.
Methods and Results
We evaluated 1829 Framingham Heart Study participants (44.9% women). Abdominal SAT and VAT density was estimated indirectly by adipose tissue attenuation using computed tomography. Adipokines included adiponectin, leptin receptor, leptin, fatty acid‐binding protein 4 (FABP‐4), retinol‐binding protein 4 (RBP‐4), and fetuin‐A. Fat density was associated with all the biomarkers evaluated, except fetuin‐A. Lower fat density (ie, more‐negative fat attenuation) was associated with lower adiponectin and leptin receptor, but higher leptin and FABP‐4 levels (all P<0.0001). SAT density was inversely associated with RPB‐4 in both sexes, whereas the association between VAT density and RPB‐4 was only observed in men (P<0.0001). In women, after additional adjustment for respective fat volume, SAT density retained the significant associations with adiponectin, leptin, FABP‐4, and RBP‐4; and VAT density with adiponectin only (all P<0.0001). In men, significant associations were maintained upon additional adjustment for respective fat volume (P<0.005).
Conclusions
Lower abdominal fat density was associated with a profile of biomarkers suggestive of greater cardiometabolic risk. These observations support that fat density may be a valid biomarker of cardiometabolic risk.
Keywords: adipokine, adipose tissue, computed tomography, epidemiology
Subject Categories: Epidemiology
Introduction
Prevalence of abdominal obesity has increased in the United States and currently affects more than 54% of US adults.1 Excess accumulation of abdominal adiposity increases the risks of type 2 diabetes, hypertension, dyslipidemia, and metabolic syndrome.2, 3, 4 Abdominal adipose tissue including subcutaneous (SAT) and visceral adipose tissue (VAT) has been widely recognized as a pathogenic phenotype.2, 5, 6 In addition, recent studies suggested that qualitative aspects of adipose tissue, such as adipocyte size,7 macrophage infiltration,8 angiogenesis,9 hypoxia,10 and fibrosis,11 are also associated with metabolic and cardiovascular disease (CVD).
Computed tomography (CT) imaging techniques allow for the indirect quantification of abdominal fat quality by assessing the density of adipose tissue by radiographic pixels that are denoted in Hounsfield units (HU) and referred to as attenuation.12 Our previous study utilized abdominal SAT and VAT density as an indirect measure of fat quality to explore the association with CVD risk factors. In that study, lower fat density (ie, more‐negative CT fat attenuation) was associated with adverse cardiometabolic risk, including higher blood pressure, insulin resistance, triglycerides, and lower high‐density lipoprotein levels cross‐sectionally.13
To further promote the mechanistic understanding of fat quality, we sought to explore the cross‐sectional associations between abdominal fat density with a panel of circulating biomarkers mainly released by adipose tissue (adiponectin, leptin receptor, leptin, and fatty acid‐binding protein 4 [FABP‐4]) and by both adipose tissue and the liver (retinol‐binding protein 4 [RBP‐4] and fetuin‐A). On the basis of our previous findings regarding the inverse association of abdominal adipose tissue density with cardiometabolic risk, we hypothesized that lower SAT and VAT density would be associated with adverse levels of adipokines, even after adjusting for generalized adiposity (body mass index [BMI]), central obesity (waist circumference), and respective abdominal adipose tissue volumes.
Methods
Study Sample
The Framingham Heart Study was initiated in 1948 as a community‐based observational study to explore the association between CVDs and related risk factors with lifestyle, environment, and inheritance.14 The present study drew participants from the multidetector CT substudy of the Third Generation Framingham cohort who underwent imaging from 2002 to 2005. Detailed information of the Third Generation cohort of the Framingham Heart Study has been previously described elsewhere.15 For the present investigation, we included participants who had data on (1) abdominal adipose tissue volume and attenuation evaluated by multidetector CT; (2) circulating biomarker levels, including adiponectin, leptin receptor, leptin, FABP‐4, RBP‐4, and fetuin‐A; and (3) covariates. Among 2117 participants from the initial recruitment of the multidetector CT cohort, 250 participants were excluded because of a lack of abdominal fat and biomarker values. An additional 38 participants were excluded because of missing covariates, resulting in a total of 1829 participants (86.4% of those eligible) in this investigation. The study protocol was approved by the institutional review boards of the Boston University Medical Center and Massachusetts General Hospital. All participants provided written informed consent.
Abdominal Subcutaneous and Visceral Adipose Tissue Volume and Density
A total of 25 consecutive slices of abdomen were obtained while participants lay in a supine position by an 8‐slice multidetector CT scanner (LightSpeed Ultra; General Electric, Milwaukee, WI) with a thickness of 5 mm, tube voltage of 120 kVp, and radiation dose of 3 to 5 mSv.12 The assessment of abdominal adipose tissue quantity and density was performed by evaluating the CT slides with a three‐dimensional (3D) workstation tool (Aquarius 3D Workstation; TeraRecon Inc, San Mateo, CA). The trained technicians designated the region of interest by manually outlining the abdominal muscular wall. Subsequently, the region of SAT and VAT compartments were automatically identified based on the radiographic pixel threshold between −195 and −45 HU with center attenuation of −120 HU. Mean SAT and VAT volumes in cm3 and attenuation in HU were recorded. Previously, high reproducibility of these abdominal CT measurements were confirmed, with inter‐ and intrareader reliability greater than 0.99.12
Adipokines
The group of circulating biomarkers produced by adipose tissue only (adiponectin, leptin receptor, leptin, and FABP‐4) and by both adipose tissue and the liver (RBP‐4 and fetuin‐A) were evaluated. Blood samples were collected after a minimum of 8 hours of overnight fasting and analyzed following standard protocols. Plasma levels of adiponectin, leptin receptor, leptin, and RBP‐4 levels were determined by the ELISA method (R&D Systems, Minneapolis, MN) with mean interassay coefficients of variation of 2.23% for adiponectin, 4.01% for leptin receptor, 4.97% for leptin, and 2.18% for RBP‐4. Plasma levels of FABP‐4 and fetuin‐A were assessed by the sandwich ELISA method (BioVendor Research and Diagnostic Products, Candler, NC) with mean interassay coefficients of variation of 2.38% for FABP‐4 and 2.52% for fetuin‐A.
Measurement of Covariates
BMI was computed as body weight in kilograms divided by height in meters squared. Waist circumference was assessed by a measuring tape at the horizontal level of the umbilicus to the closest 0.25 inch. A series of questionnaires were administered to document the clinical history and lifestyle patterns of the participants, including current use of hormone replacement therapy, current smoking, alcohol use, and physical activity level. Current smoking was specified as those who smoked at least 1 cigarette per day within the previous year. Participants were considered moderate‐to‐heavy drinkers based on the consumption of >7 drinks/week for women and >14 drinks/week for men. Physical activity was evaluated using a questionnaire‐derived physical activity score, which incorporated the time individuals participated in different levels of physical activity, taking into account the required oxygen consumption for each of the activities.16
Statistical Analysis
We conducted a sex‐specific analysis because of the differences in women and men regarding fat distribution and the circulating biomarker levels.13, 17 All the adipokines were natural logarithmically transformed to normalize their skewed distributions. Age‐adjusted partial Pearson correlation coefficients were computed to examine the association between abdominal CT fat density and natural log‐transformed biomarkers. Multivariable‐adjusted linear regressions were performed to assess the association between fat density (independent variable) and each of the natural log‐transformed biomarkers (dependent variable) with a separate model performed for each association tested. Multivariable adjustment included age, hormone replacement therapy (women only), current smoking, alcohol use, and physical activity score. We also examined whether the associations were independent of measures of obesity by additionally adjusting for BMI, waist circumference, or respective fat volumes. The β‐coefficients computed in these models describe the estimated association in the natural log‐transformed biomarkers for a 5‐unit (≈1‐SD) decrement in fat density.
Tests for sex interaction were also conducted using multivariable‐adjusted linear regression. As a secondary analysis, the multivariable‐adjusted least‐square means for each of the biomarker levels by sex‐specific tertiles of CT fat volume within tertiles of CT fat density were examined.
A 2‐tailed P value less than 0.05 was considered statistically significant. We did not further adjust for multiple testing because the purpose of this investigation was principal hypothesis generating (ie, to identify potential associations between abdominal fat density and a panel of adipokines). All statistical analysis was performed using SAS software (version 9.2; SAS Institute Inc., Cary, NC).
Results
Descriptive Characteristics
Clinical, adiposity, biomarker, and lifestyle characteristics of the 821 women and 1008 men (overall mean age, 45 years) included in the study are shown in Table 1. Median SAT and VAT attenuations were −103.3 and −91.5 HU in women and −100.7 and −91.5 HU in men, respectively.
Table 1.
Characteristics of Study Population
| Characteristics | Women (n=821) | Men (n=1008) |
|---|---|---|
| Age, y | 46.1 (5.7) | 44.1 (6.3) |
| Body mass index, kg/m2 | 26.5 (6.0) | 28.1 (4.4) |
| Waist circumference, cm | 90.3 (15.5) | 99.4 (11.8) |
| Subcutaneous adipose tissue, cm3 | 2985 (1565) | 2588 (1226) |
| Visceral adipose tissue, cm3 | 1127 (729) | 1986 (870) |
| Subcutaneous adipose tissue, HU | −101.9 (5.5) | −99.9 (4.5) |
| Visceral adipose tissue, HU | −92.0 (4.3) | −95.5 (4.5) |
| Adiponectina, μg/mL | 10.3 (6.6, 15.5) | 5.1 (3.4, 8.0) |
| Leptin receptora, ng/mL | 18.2 (11.8, 24.8) | 17.8 (11.7, 23.5) |
| Leptina, ng/mL | 13.5 (7.1, 26.6) | 4.5 (2.7, 7.8) |
| FABP‐4a, ng/mL | 0.02 (0.01, 0.03) | 0.02 (0.01, 0.02) |
| RBP‐4a μg/mL | 37.2 (30.8, 44.6) | 43.4 (37.2, 50.5) |
| Fetuin‐Aa, mg/L | 418.8 (314.7, 541.9) | 398.9 (312.8, 509.4) |
| Current hormone replacement therapy, % | 9.0% (74) | N/A |
| Postmenopausal, % | 24.7% (203) | N/A |
| Current smokingb, % | 14.1% (116) | 14.8% (149) |
| Moderate to heavy alcohol usec, % | 14.4% (118) | 16.0% (161) |
| Physical activity score | 36.4 (6.1) | 38.1 (8.9) |
Data on means (SDs) or proportions (counts) are shown. FABP‐4, fatty acid‐binding protein 4; RBP‐4, retinol‐binding protein 4; HU, Hounsfield unit.
Values are shown as medians (25th, 75th percentiles) because of the skewed distribution.
Defined as ≥1 cigarette per day within the previous year.
Defined as >7 drinks per week (women) or >14 drinks per week (men).
Age‐Adjusted Correlations With Abdominal Fat Density and Adipokines
Age‐adjusted, sex‐stratified Pearson correlation coefficients between abdominal fat density and natural log‐transformed biomarkers are given in Table 2. Higher (ie, more‐positive CT fat attenuation) SAT and VAT density was correlated with higher levels of adiponectin and leptin receptor (r values ranged from 0.18 to 0.41) and lower levels of leptin and FABP‐4 (r values ranged from −0.69 to −0.44) in both sexes (all P<0.001). In women, higher SAT density, but not VAT density, was correlated with lower RBP‐4 (r=−0.18; P<0.001). In men, higher SAT and VAT density were correlated with lower RBP‐4 (r=−0.14 for SAT, r=−0.18 for VAT; both P<0.001). In both women and men, higher VAT density, but not SAT density, was weakly correlated with a lower level of fetuin‐A (both sexes r=−0.07; P<0.05).
Table 2.
Age‐Adjusted Sex‐Specific Pearson Correlation Coefficients Between Abdominal Fat Density and Natural Log‐Transformed Adipokines
| ln (Adipokines) | Women | Men | ||
|---|---|---|---|---|
| SAT Density | VAT Density | SAT Density | VAT Density | |
| Adiponectin | 0.30† | 0.41† | 0.18† | 0.41† |
| Leptin receptor | 0.18† | 0.21† | 0.24† | 0.24† |
| Leptin | −0.64† | −0.50† | −0.69† | −0.59† |
| FABP‐4 | −0.44† | −0.48† | −0.46† | −0.49† |
| RBP‐4 | −0.18† | −0.02 | −0.14† | −0.18† |
| Fetuin‐A | −0.06 | −0.07* | −0.02 | −0.07* |
FABP‐4, fatty acid‐binding protein 4; RBP‐4, retinol‐binding protein 4; SAT, subcutaneous adipose tissue; VAT, visceral adipose tissue.
*P<0.05; † P<0.001.
Multivariable‐Adjusted Regression Models for Abdominal Fat Density and Adipokines
The association of natural log‐transformed biomarkers per 5‐HU (≈1‐SD) decrement in fat density is shown in Table 3 after covariate adjustment. Lower SAT and VAT density was associated with lower adiponectin and leptin receptor levels, but higher leptin and FABP‐4 levels in both sexes (all P<0.0001; Table 3). Lower SAT density was associated with higher RPB‐4 levels in both sexes; whereas lower VAT density was associated with higher RPB‐4 in men only (all P<0.0001).
Table 3.
Multivariable‐Adjusteda Linear Regression Models for Abdominal Fat Density and Natural Log‐Transformed Adipokines
| ln (Adipokines) | Models | Women | Men | ||||||
|---|---|---|---|---|---|---|---|---|---|
| SAT Density | P Value | VAT Density | P Value | SAT Density | P Value | VAT Density | P Value | ||
| Adiponectin | MV | −0.17 (−0.20, −0.13) | <0.0001 | −0.28 (−0.32, −0.24) | <0.0001 | −0.12 (−0.17, 0.08) | <0.0001 | −0.29 (−0.33, −0.25) | <0.0001 |
| MV+BMI | −0.11 (−0.15, −0.08) | <0.0001 | −0.22 (−0.27, −0.16) | <0.0001 | −0.05 (−0.10, −0.01) | 0.03 | −0.26 (−0.31, −0.21) | <0.0001 | |
| MV+WC | −0.11 (−0.15, −0.07) | <0.0001 | −0.21 (−0.26, −0.16) | <0.0001 | −0.05 (−0.10, 0.00) | 0.03 | −0.28 (−0.32, −0.23) | <0.0001 | |
| MV+Fat volumeb | −0.11 (−0.15, −0.07) | <0.0001 | −0.13 (−0.19, −0.07) | <0.0001 | −0.10 (−0.16, −0.05) | 0.0001 | −0.25 (−0.31, −0.19) | <0.0001 | |
| Leptin receptor | MV | −0.07 (−0.10, −0.04) | <0.0001 | −0.10 (−0.13, −0.06) | <0.0001 | −0.12 (−0.15, −0.09) | <0.0001 | −0.12 (−0.15, −0.09) | <0.0001 |
| MV+BMI | −0.04 (−0.07, −0.01) | 0.02 | −0.04 (−0.08, 0.00) | 0.06 | −0.10 (−0.13, −0.06) | <0.0001 | −0.09 (−0.13, −0.06) | <0.0001 | |
| MV+WC | −0.04 (−0.07, −0.01) | 0.02 | −0.05 (−0.09, −0.01) | 0.02 | −0.09 (−0.13, −0.06) | <0.0001 | −0.09 (−0.12, −0.05) | <0.0001 | |
| MV+Fat volumeb | −0.03 (−0.06, 0.00) | 0.07 | −0.03 (−0.08, 0.02) | 0.28 | −0.10 (−0.13, −0.06) | <0.0001 | −0.09 (−0.13, −0.04) | 0.0005 | |
| Leptin | MV | 0.53 (0.48, 0.57) | <0.0001 | 0.52 (0.46, 0.58) | <0.0001 | 0.63 (0.59, 0.67) | <0.0001 | 0.54 (0.50, 0.59) | <0.0001 |
| MV+BMI | 0.34 (0.30, 0.37) | <0.0001 | 0.12 (0.07, 0.18) | <0.0001 | 0.42 (0.39, 0.45) | <0.0001 | 0.28 (0.23, 0.32) | <0.0001 | |
| MV+WC | 0.32 (0.29, 0.36) | <0.0001 | 0.14 (0.08, 0.20) | <0.0001 | 0.37 (0.34, 0.41) | <0.0001 | 0.24 (0.20, 0.28) | <0.0001 | |
| MV+Fat volumeb | 0.25 (0.22, 0.29) | <0.0001 | −0.04 (−0.11, 0.04) | 0.34 | 0.32 (0.28, 0.36) | <0.0001 | 0.15 (0.09, 0.22) | <0.0001 | |
| FABP‐4 | MV | 0.19 (0.17, 0.22) | <0.0001 | 0.27 (0.23, 0.30) | <0.0001 | 0.23 (0.20, 0.26) | <0.0001 | 0.24 (0.21, 0.27) | <0.0001 |
| MV+BMI | 0.10 (0.08, 0.13) | <0.0001 | 0.10 (0.07, 0.14) | <0.0001 | 0.13 (0.11, 0.16) | <0.0001 | 0.14 (0.11, 0.16) | <0.0001 | |
| MV+WC | 0.09 (0.07, 0.12) | <0.0001 | 0.11 (0.07, 0.14) | <0.0001 | 0.11 (0.08, 0.14) | <0.0001 | 0.12 (0.09, 0.15) | <0.0001 | |
| MV+Fat volumeb | 0.07 (0.04, 0.09) | <0.0001 | 0.00 (−0.04, 0.05) | 0.84 | 0.10 (0.07, 0.13) | <0.0001 | 0.06 (0.02, 0.10) | 0.004 | |
| RBP‐4 | MV | 0.05 (0.03, 0.06) | <0.0001 | 0.02 (0.00, 0.04) | 0.09 | 0.04 (0.02, 0.05) | <0.0001 | 0.05 (0.03, 0.06) | <0.0001 |
| MV+BMI | 0.05 (0.03, 0.06) | <0.0001 | 0.01 (−0.01, 0.03) | 0.45 | 0.05 (0.03, 0.06) | <0.0001 | 0.06 (0.04, 0.08) | <0.0001 | |
| MV+WC | 0.04 (0.03, 0.06) | <0.0001 | 0.00 (−0.02, 0.03) | 0.82 | 0.05 (0.03, 0.06) | <0.0001 | 0.06 (0.04, 0.08) | <0.0001 | |
| MV+Fat volumeb | 0.05 (0.03, 0.07) | <0.0001 | −0.01 (−0.04, 0.02) | 0.51 | 0.06 (0.04, 0.08) | <0.0001 | 0.06 (0.03, 0.08) | <0.0001 | |
| Fetuin‐A | MV | 0.02 (−0.00, 0.05) | 0.12 | 0.03 (0.00, 0.07) | 0.04 | 0.01 (−0.02, 0.03) | 0.68 | 0.03 (0.00, 0.06) | 0.02 |
| MV+BMI | 0.00 (−0.02, 0.03) | 0.80 | 0.00 (−0.03, 0.04) | 0.83 | −0.01 (−0.04, 0.02) | 0.49 | 0.02 (−0.01, 0.05) | 0.21 | |
| MV+WC | 0.00 (−0.03, 0.03) | 0.87 | 0.01 (−0.03, 0.05) | 0.71 | −0.02 (−0.05, 0.01) | 0.26 | 0.02 (−0.01, 0.04) | 0.31 | |
| MV+Fat volumeb | 0.00 (−0.03, 0.03) | 0.97 | −0.01 (−0.05, 0.04) | 0.77 | −0.01 (−0.04, 0.02) | 0.54 | 0.00 (−0.04, 0.04) | 0.95 | |
Data are shown as estimated β‐coefficient (95% confidence intervals). The values of estimated β‐coefficient describe the association of natural log‐transformed biomarkers for a 1‐SD decrement (5 HU) in CT fat density. Sex interaction was tested based on the multivariable model. Significant sex interactions were identified between SAT density with leptin receptor (P=0.02) and leptin (P=0.001); and between VAT density and RBP‐4 (P=0.03) only. BMI, body mass index; CT, computed tomography; FABP‐4, fatty acid‐binding protein 4; HU, Hounsfield unit; MV, multivariable; RBP‐4, retinol‐binding protein 4; SAT, subcutaneous adipose tissue; VAT, visceral adipose tissue; WC, waist circumference.
Multivariable model (MV), adjusted for age, hormone replacement therapy (women only), current smoking, alcohol use, and physical activity score.
Regression model for SAT density is adjusted for SAT volume; regression model for VAT density is adjusted for VAT volume.
Next, the regression models were further adjusted for BMI, waist circumference, or respective abdominal fat volumes (SAT volume for SAT density model and VAT volume for VAT density model; Table 3). When we additionally adjusted for BMI or waist circumference, the association with fat density generally decreased, but remained statistically significant with adiponectin, leptin, and FABP‐4 in women; and with adiponectin, leptin receptor, leptin, FABP‐4, and RBP‐4 in men (all P<0.05). In women, after additional adjustment for the respective abdominal fat volume, SAT density maintained the associations with most of the biomarkers, as compared to VAT density. In men, further adjustment for the respective CT fat volume weakened the relationships between fat density and metabolic biomarkers; however, all of these associations remained statistically significant (all P<0.005).
Secondary Analyses
We further tested for sex interactions between abdominal fat density and metabolic biomarkers based on the multivariable model. In general, the magnitude of the estimated β‐coefficients between abdominal fat density and the given biomarkers were similar between women and men (Table 3). The only notable exceptions were SAT density with leptin receptor (P=0.02) and leptin (P=0.001); and VAT density with RBP‐4 (P=0.03), where the magnitude of associations were stronger in men, as compared to women.
Finally, we explored the association between abdominal fat density and the circulating biomarkers with the respective abdominal fat volumes. The multivariable‐adjusted means of each biomarker are presented in Figure and Figure S1 according to the sex‐specific tertiles of SAT and VAT volume by tertiles of SAT and VAT density. In general, higher tertiles of SAT and VAT HU (ie, lower fat density), within greater tertiles of respective fat volume (ie, greater fat volume), were associated with relatively lower levels of adiponectin and leptin receptor and higher levels of leptin, FABP‐4, and RBP‐4. However, for women with the lowest adipose tissue volume (SAT and VAT volume tertile 1), the inclusion of adipose tissue volume changed the direction of the association of fat density with leptin, leptin receptor, and RBP‐4 (Figure and Figure S1).
Figure 1.
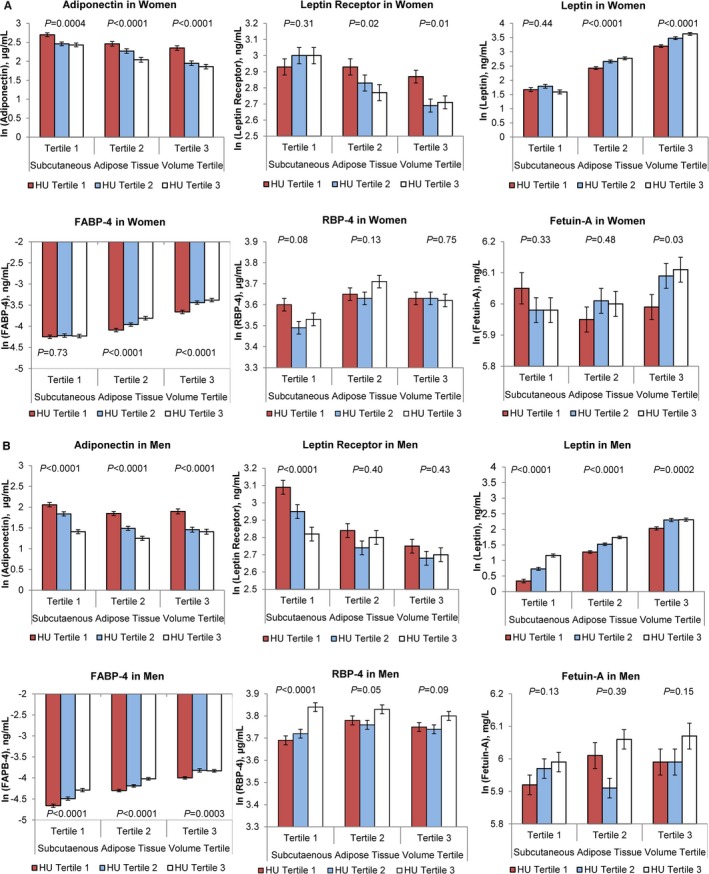
Multivariable‐adjusted least‐square means of adipokines according to the tertiles of subcutaneous adipose tissue volume and density (HU) in women (A) and men (B). The multivariable‐adjusted least‐square means for each biomarker are given according to the subcutaneous adipose tissue volume and density tertiles. P values for the linear trend are given for each of the fat volume tertiles. Tertile 3 corresponds to greater adipose tissue volumes and lower adipose tissue density (ie, more‐negative CT fat attenuations), as compared to tertile 1. Multivariable adjustment included age, hormone replacement therapy (women only), current smoking, alcohol use, and physical activity score. CT, computed tomography; FABP‐4, fatty acid‐binding protein 4; HU, Hounsfield unit; RBP‐4, retinol binding protein 4.
Discussion
Principle Findings
In this cross‐sectional, community‐based observational study, we related CT‐derived abdominal adipose tissue attenuation with a panel of circulating biomarkers released by adipose tissue or liver. Lower abdominal fat density was associated with adverse levels of circulating biomarkers; in particular, lower adiponectin and leptin receptor levels and higher leptin, FABP‐4, and RBP‐4 levels in both women and men. A majority of these associations remained statistically significant even after additional adjustment for generalized adiposity (BMI), central obesity (waist circumference), or respective abdominal adipose tissue volumes. Moreover, lower adipose tissue density with greater adipose tissue volumes was associated with adverse levels of circulating biomarkers consistent with greater cardiometabolic risk.
In the Context of the Current Literature
Greater accumulation of abdominal adipose tissue volumes is associated with adverse concentrations of the circulating biomarkers of metabolic regulation.18, 19, 20 Yet, the quality of abdominal adipose tissue assessed by radiographic imaging techniques is relatively new, because only a few human‐based studies have been reported in recent years.13, 17, 21, 22 To our knowledge, only 1 previous study explored the associations between SAT and VAT HU with a panel of adipose tissue‐derived biomarkers, referred to as adipokines, in an older population (ages 65 and older) and in nonhuman primates.17 In that report, lower attenuation of CT fat was associated with larger adipocyte size, as well as lower adiponectin and higher leptin levels.17 Our study observed similar findings, and we extend the literature to a more‐comprehensive panel of circulating biomarkers (including leptin receptor, FABP‐4, and RBP‐4) and a broader age range of individuals. In our study, a few significant sex interactions between abdominal fat density and metabolic biomarkers were detected. The most distinctive sex interactions were identified between SAT density with leptin receptors and leptin, where the associations were more pronounced in men.
Previous studies have explored differences in adipogenesis between women and men in the aspects of adipose tissue cellularity.23, 24, 25 Progression to obesity was associated with adipocyte hypertrophy in both women and men; and adipocyte hyperplasia only in women.23 These findings support the sexual dimorphism in the process of adipose tissue remodeling. In addition, the size of the adipocyte derived from SAT and VAT was larger in men than women, even after adjusting for BMI.26 In our study, CT attenuation of adipose tissue was implicated as a surrogate measure of fat quality because lower attenuation of adipose tissue assessed by CT corresponded to larger adipocyte size17 with highly vascularized tissue.27 Of note, larger adipocytes were associated with higher expression of leptin mRNA,26 which may explain our findings of a more pronounced association between fat density and leptin in men, as opposed to women. However, further studies are necessary to elucidate the differences in the mechanism in women and men linked with adipose tissue quality and a broad array of adipokines.
Potential Physiological Mechanisms
Consistent with our a priori hypothesis, lower abdominal fat density was associated with adverse concentrations of circulating biomarkers, although the underlying mechanisms, particularly the causal association between abdominal fat density and the panel of biomarkers, remain unclear. There are several potential mechanistic explanations for our findings. One potential explanation is that lower attenuation of CT fat is an indicator of adipose tissue with dense lipid content consisting of large adipocytes that are filled with enlarged lipid droplets.28, 29 Enlarged adipocytes may reflect the insufficient proliferation of adipocytes attributed to impaired adiopogenesis in the state of obesity.30, 31, 32, 33 Larger adipocyte size has been related to increased metabolic activity and greater secretion of adipocytokines, including adiponectin and leptin.34, 35, 36 Insulin‐stimulated glucose uptake and protein expressions that are essential for lipid, fatty acid, and glucose metabolism appear to differ between small and large adipocytes.37, 38 Collectively, dysfunctional secretion of adipokines induced by hypertrophied adipocytes may provide insight into the pathophysiological associations between hypertrophied adipocyte and adverse cardiometabolic risk factors.39, 40, 41, 42, 43
Second, the low attenuation of CT fat may reflect adipose tissue that is not affected by adipose tissue fibrosis, which allows the extracellular matrix remodeling of adipose tissues to accommodate adipocyte expansion.21, 44 This notion can be supported by the association between elevated urinary connective tissue growth factor (ie, a marker of systemic fibrosis) and higher CT fat attenuation.21 In line with this, a dose‐dependent reduction of collagen type VI α3 gene expression (ie, gene that encodes fibrotic extracellular matrix protein) by leptin support the regulatory effect of leptin on cellular fibrosis.45 Taken together, the higher secretion of leptin may suppress adipose tissue fibrosis and subsequently contribute to expandability of adipocytes.
Third, fat quality may be related to metabolic regulatory biomarkers by systemic inflammation. Obesity is associated with a chronic, low‐grade inflammatory response with up‐regulation of proinflammatory adipokines that promote systemic inflammation,46 such as leptin,47 FABP‐4, RBP‐4,47 and fetuin‐A48; and down‐regulation of anti‐inflammatory adipokines that reduce cellular inflammation,46 such as adiponectin.20, 47, 49 It is plausible that altered adipose tissue quality, in particular, adipocyte hypertrophy manifested by lipid overaccumulation,46, 50 may trigger abnormal production of pro‐ and anti‐inflammatory adipokines and subsequently leads to a generalized inflammatory state.51
In addition, there are other potential mechanisms that may elaborate our findings. Lower attenuation of CT fat as a marker of poor vascularity27 and cellular hypoxia13 may explain the association between fat quality and adverse levels of adipokines. More specifically, cellular hypoxia developed along with adipocyte hypertrophy may be one of the key factors given that secretion of adipose tissue‐derived biomarkers is considerably modified under hypoxic conditions.10 Importantly, reduced vascularity is accompanied by more adipose tissue hypoxia as a consequence of the progression to obesity.52 Taken globally, these aforementioned findings add to the growing body of the literature for the potent mechanistic explanations between fat quality and adipokines.
Implications
Our findings suggest that abdominal SAT and VAT density, an indirect measure of abdominal fat quality, may be a potential indicator of cardiometabolic risk associated with metabolic regulatory biomarkers. Accordingly, our data raise the possibility of using abdominal adipose tissue quality assessed by CT as an indicator to identify individuals at high risk for developing cardiometabolic disease. Further studies are necessary to explore the causal association between fat density and levels of circulating biomarkers, as well as whether the quality of abdominal adipose tissue has a pathogenic impact on metabolism through its relationship with metabolic regulatory biomarkers.
Strengths and Limitations
The strengths of this study include the use of a highly reproducible and noninvasive measurement of abdominal CT fat quality in a large, community‐based sample. Limitations include the cross‐sectional and observational design that precludes the temporal and causal inferences between abdominal adipose tissue density and circulating adipokine levels. The majority of the participants were white; our findings cannot be generalized to other ethnicities. Serum fatty acids and triacylglycerol were not measured. Finally, we have used fat attenuation assessed by CT as a proxy for fat quality. Mechanistic studies are necessary to better understand the underlying cellular and histological characteristics of this novel imaging measurement.
Conclusions
Low abdominal SAT and VAT density is associated with adverse levels of circulating adipokines, suggestive of greater cardiometabolic risk independent of generalized adiposity (BMI), central obesity (waist circumference), and respective abdominal SAT and VAT quantity.
Sources of Funding
This work was supported by the National Heart, Lung and Blood Institute's Framingham Heart Study (contract N01‐HC‐25195) and by R01DK080739 (Vasan).
Disclosures
Alison Pedley is an employee of Merck & Company, Inc.
Supporting information
Figure S1. Multivariable‐adjusted least‐square means of adipokines according to the tertiles of visceral adipose tissue volume and density (HU) in women (A) and men (B). The multivariable‐adjusted least‐square means for each biomarker are given according to the visceral adipose tissue volume and density tertiles. P values for the linear trend are given for each of the visceral adipose tissue volume tertiles. Tertile 3 corresponds to greater adipose tissue volumes and lower adipose tissue density (ie, more‐negative CT fat attenuations), as compared to tertile 1. Multivariable adjustment included age, hormone replacement therapy (women only), current smoking, alcohol use, and physical activity score. CT, computed tomography; FABP‐4, fatty acid‐binding protein 4; HU, Hounsfield unit; RBP‐4, retinol‐binding protein 4.
(J Am Heart Assoc. 2016;5:e002545 doi: 10.1161/JAHA.115.002545)
An accompanying Figure S1 is available at http://jaha.ahajournals.org/content/5/3/e002545/suppl/DC1
References
- 1. Ford ES, Maynard LM, Li C. Trends in mean waist circumference and abdominal obesity among US adults, 1999–2012. JAMA. 2014;312:1151–1153. [DOI] [PMC free article] [PubMed] [Google Scholar]
- 2. Fox CS, Massaro JM, Hoffmann U, Pou KM, Maurovich‐Horvat P, Liu CY, Vasan RS, Murabito JM, Meigs JB, Cupples LA, D'Agostino RB Sr, O'Donnell CJ. Abdominal visceral and subcutaneous adipose tissue compartments: association with metabolic risk factors in the Framingham Heart Study. Circulation. 2007;116:39–48. [DOI] [PubMed] [Google Scholar]
- 3. Despres JP, Lemieux I, Bergeron J, Pibarot P, Mathieu P, Larose E, Rodes‐Cabau J, Bertrand OF, Poirier P. Abdominal obesity and the metabolic syndrome: contribution to global cardiometabolic risk. Arterioscler Thromb Vasc Biol. 2008;28:1039–1049. [DOI] [PubMed] [Google Scholar]
- 4. Lim S, Meigs JB. Ectopic fat and cardiometabolic and vascular risk. Int J Cardiol. 2013;169:166–176. [DOI] [PubMed] [Google Scholar]
- 5. Tchernof A, Despres JP. Pathophysiology of human visceral obesity: an update. Physiol Rev. 2013;93:359–404. [DOI] [PubMed] [Google Scholar]
- 6. Preis SR, Massaro JM, Robins SJ, Hoffmann U, Vasan RS, Irlbeck T, Meigs JB, Sutherland P, D'Agostino RB Sr, O'Donnell CJ, Fox CS. Subcutaneous and visceral adipose tissue and insulin resistance in the Framingham Heart Study. Obesity (Silver Spring). 2010;18:2191–2198. [DOI] [PMC free article] [PubMed] [Google Scholar]
- 7. Weyer C, Foley JE, Bogardus C, Tataranni PA, Pratley RE. Enlarged subcutaneous abdominal adipocyte size, but not obesity itself, predicts type II diabetes independent of insulin resistance. Diabetologia. 2000;43:1498–1506. [DOI] [PubMed] [Google Scholar]
- 8. Apovian CM, Bigornia S, Mott M, Meyers MR, Ulloor J, Gagua M, McDonnell M, Hess D, Joseph L, Gokce N. Adipose macrophage infiltration is associated with insulin resistance and vascular endothelial dysfunction in obese subjects. Arterioscler Thromb Vasc Biol. 2008;28:1654–1659. [DOI] [PMC free article] [PubMed] [Google Scholar]
- 9. Hausman GJ, Richardson RL. Adipose tissue angiogenesis. J Anim Sci. 2004;82:925–934. [DOI] [PubMed] [Google Scholar]
- 10. Trayhurn P. Hypoxia and adipose tissue function and dysfunction in obesity. Physiol Rev. 2013;93:1–21. [DOI] [PubMed] [Google Scholar]
- 11. Spencer M, Unal R, Zhu B, Rasouli N, McGehee RE Jr, Peterson CA, Kern PA. Adipose tissue extracellular matrix and vascular abnormalities in obesity and insulin resistance. J Clin Endocrinol Metab. 2011;96:1990–1998. [DOI] [PMC free article] [PubMed] [Google Scholar]
- 12. Maurovich‐Horvat P, Massaro J, Fox CS, Moselewski F, O'Donnell CJ, Hoffmann U. Comparison of anthropometric, area‐ and volume‐based assessment of abdominal subcutaneous and visceral adipose tissue volumes using multi‐detector computed tomography. Int J Obes (Lond). 2007;31:500–506. [DOI] [PubMed] [Google Scholar]
- 13. Rosenquist KJ, Pedley A, Massaro JM, Therkelsen KE, Murabito JM, Hoffmann U, Fox CS. Visceral and subcutaneous fat quality and cardiometabolic risk. JACC Cardiovasc Imaging. 2013;6:762–771. [DOI] [PMC free article] [PubMed] [Google Scholar]
- 14. Dawber TR, Kannel WB, Lyell LP. An approach to longitudinal studies in a community: the Framingham Study. Ann N Y Acad Sci. 1963;107:539–556. [DOI] [PubMed] [Google Scholar]
- 15. Splansky GL, Corey D, Yang Q, Atwood LD, Cupples LA, Benjamin EJ, D'Agostino RB Sr, Fox CS, Larson MG, Murabito JM, O'Donnell CJ, Vasan RS, Wolf PA, Levy D. The Third Generation Cohort of the National Heart, Lung, and Blood Institute's Framingham Heart Study: design, recruitment, and initial examination. Am J Epidemiol. 2007;165:1328–1335. [DOI] [PubMed] [Google Scholar]
- 16. Kannel WB, Sorlie P. Some health benefits of physical activity. The Framingham Study. Arch Intern Med. 1979;139:857–861. [PubMed] [Google Scholar]
- 17. Murphy RA, Register TC, Shively CA, Carr JJ, Ge Y, Heilbrun ME, Cummings SR, Koster A, Nevitt MC, Satterfield S, Tylvasky FA, Strotmeyer ES, Newman AB, Simonsick EM, Scherzinger A, Goodpaster BH, Launer LJ, Eiriksdottir G, Sigurdsson S, Sigurdsson G, Gudnason V, Lang TF, Kritchevsky SB, Harris TB. Adipose tissue density, a novel biomarker predicting mortality risk in older adults. J Gerontol A Biol Sci Med Sci. 2014;69:109–117. [DOI] [PMC free article] [PubMed] [Google Scholar]
- 18. Fontana L, Eagon JC, Trujillo ME, Scherer PE, Klein S. Visceral fat adipokine secretion is associated with systemic inflammation in obese humans. Diabetes. 2007;56:1010–1013. [DOI] [PubMed] [Google Scholar]
- 19. Park KG, Park KS, Kim MJ, Kim HS, Suh YS, Ahn JD, Park KK, Chang YC, Lee IK. Relationship between serum adiponectin and leptin concentrations and body fat distribution. Diabetes Res Clin Pract. 2004;63:135–142. [DOI] [PubMed] [Google Scholar]
- 20. Ryo M, Nakamura T, Kihara S, Kumada M, Shibazaki S, Takahashi M, Nagai M, Matsuzawa Y, Funahashi T. Adiponectin as a biomarker of the metabolic syndrome. Circ J. 2004;68:975–981. [DOI] [PubMed] [Google Scholar]
- 21. Rosenquist KJ, Massaro JM, Pedley A, Long MT, Kreger BE, Vasan RS, Murabito JM, Hoffmann U, Fox CS. Fat quality and incident cardiovascular disease, all‐cause mortality and cancer mortality. J Clin Endocrinol Metab. 2015;100:227–234. [DOI] [PMC free article] [PubMed] [Google Scholar]
- 22. Alvey NJ, Pedley A, Rosenquist KJ, Massaro JM, O'Donnell CJ, Hoffmann U, Fox CS. Association of fat density with subclinical atherosclerosis. J Am Heart Assoc. 2014;3:e000788 doi: 10.1161/JAHA.114.000788. [DOI] [PMC free article] [PubMed] [Google Scholar]
- 23. Tchoukalova YD, Koutsari C, Karpyak MV, Votruba SB, Wendland E, Jensen MD. Subcutaneous adipocyte size and body fat distribution. Am J Clin Nutr. 2008;87:56–63. [DOI] [PubMed] [Google Scholar]
- 24. Sjostrom L, Smith U, Krotkiewski M, Bjorntorp P. Cellularity in different regions of adipose tissue in young men and women. Metabolism. 1972;21:1143–1153. [DOI] [PubMed] [Google Scholar]
- 25. Fried SK, Kral JG. Sex differences in regional distribution of fat cell size and lipoprotein lipase activity in morbidly obese patients. Int J Obes. 1987;11:129–140. [PubMed] [Google Scholar]
- 26. Zhang Y, Zitsman JL, Hou J, Fennoy I, Guo K, Feinberg J, Leibel RL. Fat cell size and adipokine expression in relation to gender, depot, and metabolic risk factors in morbidly obese adolescents. Obesity (Silver Spring). 2014;22:691–697. [DOI] [PMC free article] [PubMed] [Google Scholar]
- 27. Furlan A, Fakhran S, Federle MP. Spontaneous abdominal hemorrhage: causes, CT findings, and clinical implications. AJR Am J Roentgenol. 2009;193:1077–1087. [DOI] [PubMed] [Google Scholar]
- 28. Baba S, Jacene HA, Engles JM, Honda H, Wahl RL. CT Hounsfield units of brown adipose tissue increase with activation: preclinical and clinical studies. J Nucl Med. 2010;51:246–250. [DOI] [PubMed] [Google Scholar]
- 29. Ohsaki Y, Cheng J, Suzuki M, Shinohara Y, Fujita A, Fujimoto T. Biogenesis of cytoplasmic lipid droplets: from the lipid ester globule in the membrane to the visible structure. Biochim Biophys Acta. 2009;1791:399–407. [DOI] [PubMed] [Google Scholar]
- 30. Bays H, Blonde L, Rosenson R. Adiposopathy: how do diet, exercise and weight loss drug therapies improve metabolic disease in overweight patients? Expert Rev Cardiovasc Ther. 2006;4:871–895. [DOI] [PubMed] [Google Scholar]
- 31. Bays HE, Gonzalez‐Campoy JM, Bray GA, Kitabchi AE, Bergman DA, Schorr AB, Rodbard HW, Henry RR. Pathogenic potential of adipose tissue and metabolic consequences of adipocyte hypertrophy and increased visceral adiposity. Expert Rev Cardiovasc Ther. 2008;6:343–368. [DOI] [PubMed] [Google Scholar]
- 32. Heilbronn L, Smith SR, Ravussin E. Failure of fat cell proliferation, mitochondrial function and fat oxidation results in ectopic fat storage, insulin resistance and type II diabetes mellitus. Int J Obes Relat Metab Disord. 2004;28:S12–S21. [DOI] [PubMed] [Google Scholar]
- 33. Danforth E Jr. Failure of adipocyte differentiation causes type II diabetes mellitus? Nat Genet. 2000;26:13. [DOI] [PubMed] [Google Scholar]
- 34. Skurk T, Alberti‐Huber C, Herder C, Hauner H. Relationship between adipocyte size and adipokine expression and secretion. J Clin Endocrinol Metab. 2007;92:1023–1033. [DOI] [PubMed] [Google Scholar]
- 35. Wronska A, Kmiec Z. Structural and biochemical characteristics of various white adipose tissue depots. Acta Physiol (Oxf). 2012;205:194–208. [DOI] [PubMed] [Google Scholar]
- 36. Couillard C, Mauriege P, Imbeault P, Prud'homme D, Nadeau A, Tremblay A, Bouchard C, Després JP. Hyperleptinemia is more closely associated with adipose cell hypertrophy than with adipose tissue hyperplasia. Int J Obes Relat Metab Disord. 2000;24:782–788. [DOI] [PubMed] [Google Scholar]
- 37. Bluher M, Wilson‐Fritch L, Leszyk J, Laustsen PG, Corvera S, Kahn CR. Role of insulin action and cell size on protein expression patterns in adipocytes. J Biol Chem. 2004;279:31902–31909. [DOI] [PubMed] [Google Scholar]
- 38. Bluher M, Michael MD, Peroni OD, Ueki K, Carter N, Kahn BB, Kahn CR. Adipose tissue selective insulin receptor knockout protects against obesity and obesity‐related glucose intolerance. Dev Cell. 2002;3:25–38. [DOI] [PubMed] [Google Scholar]
- 39. Bray GA, Glennon JA, Salans LB, Horton ES, Danforth E Jr, Sims EA. Spontaneous and experimental human obesity: effects of diet and adipose cell size on lipolysis and lipogenesis. Metabolism. 1977;26:739–747. [DOI] [PubMed] [Google Scholar]
- 40. Bays HE, Gonzalez‐Campoy JM, Henry RR, Bergman DA, Kitabchi AE, Schorr AB, Rodbard HW. Is adiposopathy (sick fat) an endocrine disease? Int J Clin Pract. 2008;62:1474–1483. [DOI] [PMC free article] [PubMed] [Google Scholar]
- 41. Laforest S, Labrecque J, Michaud A, Cianflone K, Tchernof A. Adipocyte size as a determinant of metabolic disease and adipose tissue dysfunction. Crit Rev Clin Lab Sci. 2015;52:301–313. [DOI] [PubMed] [Google Scholar]
- 42. Lonn M, Mehlig K, Bengtsson C, Lissner L. Adipocyte size predicts incidence of type 2 diabetes in women. FASEB J. 2010;24:326–331. [DOI] [PubMed] [Google Scholar]
- 43. Faria G, Pestana D, Aral M, Preto J, Norberto S, Calhau C, Guimarães JT, Taveira‐Gomes A. Metabolic score: insights on the development and prediction of remission of metabolic syndrome after gastric bypass. Ann Surg. 2014;260:279–286. [DOI] [PubMed] [Google Scholar]
- 44. Yeoh AJ, Pedley A, Rosenquist KJ, Hoffmann U, Fox CS. The association between subcutaneous fat density and the propensity to store fat viscerally. J Clin Endocrinol Metab. 2015;100:1056–1064. [DOI] [PMC free article] [PubMed] [Google Scholar]
- 45. McCulloch LJ, Rawling TJ, Sjoholm K, Franck N, Dankel SN, Price EJ, Knight B, Liversedge NH, Mellgren G, Nystrom F, Carlsson LM, Kos K. COL6A3 is regulated by leptin in human adipose tissue and reduced in obesity. Endocrinology. 2015;156:134–146. [DOI] [PubMed] [Google Scholar]
- 46. Ouchi N, Parker JL, Lugus JJ, Walsh K. Adipokines in inflammation and metabolic disease. Nat Rev Immunol. 2011;11:85–97. [DOI] [PMC free article] [PubMed] [Google Scholar]
- 47. Ouchi N, Walsh K. Adiponectin as an anti‐inflammatory factor. Clin Chim Acta. 2007;380:24–30. [DOI] [PMC free article] [PubMed] [Google Scholar]
- 48. Brix JM, Stingl H, Hollerl F, Schernthaner GH, Kopp HP, Schernthaner G. Elevated Fetuin‐A concentrations in morbid obesity decrease after dramatic weight loss. J Clin Endocrinol Metab. 2010;95:4877–4881. [DOI] [PubMed] [Google Scholar]
- 49. Kern PA, Di Gregorio GB, Lu T, Rassouli N, Ranganathan G. Adiponectin expression from human adipose tissue: relation to obesity, insulin resistance, and tumor necrosis factor‐alpha expression. Diabetes. 2003;52:1779–1785. [DOI] [PubMed] [Google Scholar]
- 50. Makki K, Froguel P, Wolowczuk I. Adipose tissue in obesity‐related inflammation and insulin resistance: cells, cytokines, and chemokines. ISRN Inflamm. 2013;2013:139239. [DOI] [PMC free article] [PubMed] [Google Scholar]
- 51. Tilg H, Moschen AR. Adipocytokines: mediators linking adipose tissue, inflammation and immunity. Nat Rev Immunol. 2006;6:772–783. [DOI] [PubMed] [Google Scholar]
- 52. Suganami T, Ogawa Y. Adipose tissue macrophages: their role in adipose tissue remodeling. J Leukoc Biol. 2010;88:33–39. [DOI] [PubMed] [Google Scholar]
Associated Data
This section collects any data citations, data availability statements, or supplementary materials included in this article.
Supplementary Materials
Figure S1. Multivariable‐adjusted least‐square means of adipokines according to the tertiles of visceral adipose tissue volume and density (HU) in women (A) and men (B). The multivariable‐adjusted least‐square means for each biomarker are given according to the visceral adipose tissue volume and density tertiles. P values for the linear trend are given for each of the visceral adipose tissue volume tertiles. Tertile 3 corresponds to greater adipose tissue volumes and lower adipose tissue density (ie, more‐negative CT fat attenuations), as compared to tertile 1. Multivariable adjustment included age, hormone replacement therapy (women only), current smoking, alcohol use, and physical activity score. CT, computed tomography; FABP‐4, fatty acid‐binding protein 4; HU, Hounsfield unit; RBP‐4, retinol‐binding protein 4.