

Abstract
Cefadroxil is a broad-spectrum β-lactam antibiotic that is widely used in the treatment of various infectious diseases. Currently, poor understanding of the drug’s pharmacokinetic profiles and disposition mechanism(s) prevents determining optimal dosage regimens and achieving ideal antibacterial responses in patients. In the present retrospective study, we developed a population pharmacokinetic model of cefadroxil in wildtype and Pept2 knockout mice using the NONMEM approach.
Cefadroxil pharmacokinetics were best described by a two-compartment model, with both saturable and nonsaturable elimination processes to/from the central compartment. Through this modeling approach, pharmacokinetic parameters in wildtype and Pept2 knockout mice were well estimated, respectively, as: volume of central compartment V1 (3.43 vs. 4.23 mL), volume of peripheral compartment V2 (5.98 vs. 8.61 mL), inter-compartment clearance Q (0.599 vs. 0.586 mL/min), and linear elimination rate constant K10 (0.111 vs. 0.070 min−1). Moreover, the secretion kinetics (i.e., Vm1 = 17.6 nmoL/min and Km1 = 37.1 μM) and reabsorption kinetics (i.e., Vm2 = 15.0 nmoL/min and Km2 = 27.1 μM) of cefadroxil were quantified in kidney, for the first time, under in vivo conditions.
Our model provides a unique tool to quantitatively predict the dose-dependent nonlinear disposition of cefadroxil, as well as the potential for transporter-mediated drug interactions.
Keywords: Disposition, kidney, mice, pharmacokinetics, transporters
Introduction
Cefadroxil is a β-lactam compound with a broad spectrum of antibacterial activity (Buck and Price, 1977). This semisynthetic and first-generation aminocephalosporin was shown more effective and resistant to β-lactamases than cephalexin against certain bacteria (Ripa and Prenna, 1979). It has been commonly used in the treatment of different kinds of infections including skin, respiratory and urinary tract infections (Tanrisever and Santella, 1986). Due to its wide application for infectious diseases, a better understanding of cefadroxil pharmacokinetics would be of significant value for appropriate dose adjustment in patient subpopulations. Clinical studies showed that, after oral administration, cefadroxil was rapidly and almost completely absorbed in the gastrointestinal tract (Tanrisever and Santella, 1986; Barbhaiya 1996). Cefadroxil was minimally metabolized, at best, in the body and excreted primarily by the kidney with over 90% of the administered dose being recovered in the urine intact within 24 hours (Nightingale 1980; Lode et al., 1979). Experimental results have demonstrated that cefadroxil was a substrate of the peptide transporters PEPT1 and PEPT2, and several organic anion transporters (i.e., OATs) (Ganapathy et al., 1995; Shitara et al., 2005). The renal elimination of cefadroxil is governed by glomerular filtration, OAT-mediated renal secretion, and PEPT2-mediated renal reabsorption. The collective contributions (or balance) between these processes determine the net renal clearance of cefadroxil.
PEPT2 (SLC15A2) belongs to the proton-coupled oligopeptide transporter (POT) family in which the primary function is to translocate various di-/tri-peptides and peptidomimetics across biological membranes (Smith et al., 2013; Daniel and Kottra, 2004). To date, four members of the POT family have been identified in mammals (i.e., PEPT1, PEPT2, PHT1 and PHT2). Among the four transporter members, PEPT2 is recognized as a high-affinity, low-capacity transporter when compared to PEPT1. PEPT2 is predominantly localized at the apical membrane of proximal tubule epithelial cells and is the major peptide transporter involved in the renal tubular reabsorption of many peptide-like drugs (e.g., bestatin, valacyclovir, 5-amino-levulinic acid) (Hu et al., 2007; Rodriguez et al., 2006; Inui et al., 1992; Ganapathy et al., 1998). Previous findings by our laboratory (Shen et al., 2007) showed that deletion of the Pept2 gene in mice caused a marked increase in the in vivo renal and total clearances of cefadroxil, with a concomitant decrease in systemic exposure. Moreover, significant dose-dependent pharmacokinetics was observed in Pept2 knockout mice whereas a more modest dose-dependency was observed in wildtype mice. In this analysis, the authors (Shen et al., 2007) proposed that wildtype mice were more influenced by capacity-limited tubular reabsorption and that Pept2 knockout mice were more influenced by capacity-limited secretion. In reality, the analysis is more complex in which varying degrees of saturation occurred for each carrier-mediated process (i.e., OATs for secretion and PEPT2 for reabsorption), depending upon the plasma (and tubular) concentrations achieved relative to transport affinity. Thus, a model that could accommodate the contributions of glomerular filtration and transporter-mediated secretory/reabsorptive processes, along with their in vivo Km values, would provide a powerful tool in predicting cefadroxil drug levels over a wide dose range.
Characterization of transporter-mediated nonlinear pharmacokinetics is of importance in understanding and predicting the pharmacologic actions of drugs, and is sometimes difficult to achieve via traditional pharmacokinetic analyses. Thus, a nonlinear mixed effect modeling (NONMEM) approach can be utilized to address different sources of variability and allow the estimation of all the kinetic parameters of interest (i.e., nonlinear and/or linear pharmacokinetic parameters) (Beal and Sheiner, 1984). This method has been employed to analyze transporter-mediated nonlinear pharmacokinetics of several compounds including cefuroxime, glycylsarcosine and levofloxacin (Ruiz-Carretero et al., 2004; Huh et al., 2013; Hurtado et al., 2014). Hence, the purpose of this study was to develop a population pharmacokinetic model of cefadroxil in wildtype and Pept2 knockout mice using the NONMEM approach. With this pharmacokinetic model, we were able to describe the nonlinear pharmacokinetics of cefadroxil with emphasis on quantifying the importance and contribution of transporters during in vivo saturable renal tubular secretion and reabsorption processes.
Materials and methods
Animals
All animal studies were performed in accordance with the Guide for the Care and Use of laboratory Animals as adopted and promulgated by the U.S. National Institutes of Health.
Experimental Design
The pharmacokinetic profiles of cefadroxil were assessed retrospectively in wildtype and Pept2 knockout mice using NONMEM, based on data generated previously by our laboratory (Shen et al., 2007). In brief, gender-matched mice (6–8 weeks) were fasted overnight before the onset of each experiment. After anesthesia with sodium pentobarbital, mice were administered [3H]cefadroxil (5 μL/g and 0.5 Ci/g body weight) intravenously by tail vein injection. Blood samples (approximately 15 μL) were collected into heparinized tubes via tail nicks at pre-determined times (i.e., 0.25, 1, 2, 5, 15, 30, 45, 60, 90 and 120 min) after drug administration. Plasma samples were harvested immediately after centrifuging the blood at 2000 g for 10 min. The radioactivity of plasma samples was measured by a dual-channel liquid scintillation counter (Beckman LS 3801; Beckman Coulter, Inc., Fullerton, CA). To investigate the dose dependency of cefadroxil pharmacokinetics, ascending doses of [3H] cefadroxil were administered separately to both genotypes (1, 12.5, 50 and 100 nmoL/g body weight) (n=4–7 mice per dose group).
Population Pharmacokinetic Modeling of Cefadroxil
Population pharmacokinetic analyses were conducted using NONMEM software (Version 7.2, Icon Development Solutions, MD, USA). The first-order conditional estimates (FOCE) method, with an interaction option implemented in NONMEM, was used for estimation. All models were parameterized as a system of differential equations using the ADVAN 6 TRANS 1 subroutine in NONMEM. Model diagnostic plots were performed using R software (version 2.15.0) with the Xpose package.
For the modeling development strategy, a sequential compartmental model building approach was adopted. Different compartmental models, including one-, two- and three-compartments, were tested on the cefadroxil pharmacokinetic profiles after intravenous administration. The analyses revealed that a two-compartment model best described the structural model of cefadroxil. After that, different population pharmacokinetic models, with linear elimination and/or nonlinear Michaelis-Menten kinetics for renal tubular secretion from the central compartment, were tested in Pept2 knockout mice. The final pharmacokinetic model (Fig. 1A) was described by the following equations:
| (1) |
| (2) |
where A(1) was the amount of cefadroxil in central compartment, A(2) was the amount of cefadroxil in peripheral compartment, C was the concentration of cefadroxil in central compartment, Vm1 was the maximum rate of saturable renal elimination from central compartment, Km1 was the Michaelis-Menten constant for saturable renal elimination from central compartment, K12 and K21 were the inter-compartment rate constants describing cefadroxil transport between the two compartments, and K10 was the linear elimination rate constant from central compartment.
Figure 1.

Schematic two-compartment models of cefadroxil after intravenous bolus administration in Pept2 knockout (A) and wildtype (B) mice.
Once the pharmacokinetic model for Pept2 knockout mice was established, the model was extended to include nonlinear Michaelis-Menten kinetics for the renal tubular reabsorption of cefadroxil in wildtype mice. The final pharmacokinetic model for wildtype mice (Fig. 1B) was described by the following equations:
| (3) |
| (4) |
where Vm2 was the maximum rate of saturable renal reabsorption and Km2 was the Michaelis-Menten constant for saturable renal reabsorption. Inter-individual variability (IIV or η) for the pharmacokinetic parameters was described by an exponential model as shown below:
| (5) |
where θi was the pharmacokinetic parameter of the ith individual, θ was the typical population parameter estimate, and ηi was the IIV which was assumed to follow a normal distribution with mean of zero and variance of ω2. The residual variability was tested by different error models and best described by exponential error model.
Model selection was based upon visual inspection of diagnostic goodness-of-fit plots, precision of parameter estimates, and numerical comparison of the objective function value by decreasing at least 6.63 (log-likelihood ratio test; p < 0.01).
Nonparametric Bootstrap Analysis
To check stability of the final population pharmacokinetic model and obtain confidence intervals (CI) for the model parameters, nonparametric bootstrap analyses (n=1,000) were performed using Perl-speaks-NONMEM (PsN) 3.6.2 (http://psn.sourceforge.net) (Lindbom et al., 2004; Keizer et al., 2013). Specifically, 1,000 replicate bootstrap data sets using subjects as sampling units were generated by random resampling with replacement from the original data set. Stratification by dose during the random resampling process was implemented to ensure that the bootstrap data sets adequately represented the original data. Each new sample set was fitted to the final population pharmacokinetic model to obtain parameter estimates. The empirical 90% CI were constructed by obtaining the 5th and 95th percentiles of parameter distributions from the successful bootstrap runs. Final model parameter estimates were compared with bootstrap median parameter estimates to evaluate the final model performance.
Visual Predictive Check
To assess predictive performance of the final population pharmacokinetic model, a prediction-corrected visual predictive check (pcVPC) (Bergstrand et al., 2011) with 1,000 data sets simulation was performed. The median, 5th and 95th percentiles of the simulated concentrations were calculated at each time point, and checked by visual inspection to see how the simulated intervals overlapped with the observed data.
Results
Population Pharmacokinetic Modeling
To sequentially build a population pharmacokinetic model for cefadroxil in mice, the plasma concentration versus time profiles of drug over the dose range studied were first fitted by NONMEM in Pept2 knockout mice. A two-compartment model, comprised of both saturable and nonsaturable efflux processes from the central compartment, was selected as the final model. The system of differential equations for the final model was given in Equations 1 and 2. Estimated pharmacokinetic parameters of cefadroxil in the final model of Pept2 knockout mice are listed in Table 1. In this model, the nonlinear kinetics of renal tubular secretion are well characterized by the Michaelis-Menten parameters Vm1 and Km1 which reflect the OAT-mediated vectorial secretion of cefadroxil across renal epithelial cells.
Table 1.
Parameter estimates of the final population pharmacokinetic model of cefadroxil in Pept2 knockout (KO) and wildtype mice after intravenous bolus administration
| Pept2 KO | Estimate | RSE (%) |
|---|---|---|
| Primary parameters (units) | ||
| Vm1 (nmoL/min) | 17.6 | 17.2 |
| Km1 (μM) | 37.1 | 35.8 |
| V1 (mL) | 4.23 | 12.2 |
| Q (mL/min)a | 0.586 | 20.5 |
| V2 (mL) | 8.61 | 16.7 |
| K10 (min−1) | 0.070 | 28.1 |
| Intersubject variability (% CV) | ||
| Vm1 | 24.7 | 26.8 |
| V1 | 42.7 | 15.1 |
| Residual variability (% CV) | ||
| Proportional error | 41.1 | 8.3 |
|
| ||
| Wildtype | Estimate | RSE (%) |
|
| ||
| Primary parameters (units)b | ||
| Vm2 (nmoL/min) | 15.0 | 23.5 |
| Km2 (μM) | 27.1 | 24.0 |
| V1 (mL) | 3.43 | 7.2 |
| Q (mL/min)a | 0.599 | 21.2 |
| V2 (mL) | 5.98 | 14.4 |
| K10 (min−1) | 0.111 | 13.0 |
| Intersubject variability (% CV) | ||
| V1 | 23.6 | 23.5 |
| V2 | 42.5 | 26.5 |
| Residual variability (% CV) | ||
| Proportional error | 26.4 | 8.7 |
Q = V1K12 = V2K21
In determining the estimates in wildtype mice, Vm1 = 17.6 nmol/min and Km1 = 37.1 μM, as determined previously in Pept2 knockout mice.
The population pharmacokinetic model for wildtype mice was developed subsequently by adding a saturable component for the cellular influx of cefadroxil from tubular fluid into the central compartment, to describe the transporter-mediated uptake of drug. The system of differential equations for this final model was shown as Equations 3 and 4. The pharmacokinetic parameter estimates of cefadroxil in this final model are shown in Table 1 for wildtype mice. It should be noted that the values of Vm1 and Km1, as determined previously in Pept2 knockout mice, were fixed in this pharmacokinetic model of wildtype mice. All parameters were estimated with high precision. In particular, the Michaelis-Menten kinetics were well characterized, as judged by the low values of RSE (< 25%) for Vm2 and Km2, which reflect the PEPT2-mediated vectorial reabsorption of cefadroxil across renal epithelial cells.
Final Model Validation
Basic goodness-of-fit plots of the final pharmacokinetic models are displayed in Figure 2. As observed, the individual and population predictions were in good agreement with observed plasma concentrations in both wildtype and Pept2 knockout mice. Moreover, the conditional weighted residuals (CWRES) scatter plots did not show any significant trend with respect to time or individual prediction. Overall, the results suggested there was no misspecification of the final pharmacokinetic models in both genotypes.
Figure 2.


Goodness-of-fit plots for the final pharmacokinetic model of cefadroxil in Pept2 knockout (A) and wildtype (B) mice after intravenous bolus administrations of 1 (grey symbols), 12.5 (red symbols), 50 (green symbols) and 100 nmoL/g (blue symbols) (n=4–7 per dose group). The solid black lines represent the line of identity and the dashed red lines represent the Loess smoothing lines.
The final models were further evaluated using a nonparametric bootstrap analysis. The empirical 90% CI was constructed by obtaining the 5th and 95th percentiles of the parameter distributions from the successful bootstrap runs. As shown in Table 2, pharmacokinetic parameter estimates from the original data were very similar to median values obtained from the bootstrap estimates, and were within the bootstrap confidence intervals indicating there was no significant bias in the final model parameters.
Table 2.
Comparison of parameter estimates of the final population pharmacokinetic model of cefadroxil in Pept2 knockout (KO) and wildtype mice based on the original data set and from 1,000 bootstrap replicates
| Parameters | Estimate | Nonparametric Bootstrap
|
|
|---|---|---|---|
| Median | 90% Confidence Interval | ||
| Pept2 KO | |||
| Vm1 (nmoL/min) | 17.6 | 17.5 | 8.1 – 49.0 |
| Km1 (μM) | 37.1 | 40.7 | 21.2 – 76.2 |
| V1 (mL) | 4.23 | 4.27 | 3.57 – 4.90 |
| Q (mL/min)a | 0.586 | 0.589 | 0.394 – 0.757 |
| V2 (mL) | 8.61 | 8.52 | 6.98 – 10.70 |
| K10 (min−1) | 0.070 | 0.073 | 0.063 – 0.100 |
| ETA (Vm1) | 0.061 | 0.048 | 0.011 – 0.082 |
| ETA (V1) | 0.182 | 0.181 | 0.102 – 0.274 |
| Proportional error | 0.169 | 0.162 | 0.126 – 0.197 |
| OFV | 404.7 | 399.5 | 336.9 – 451.7 |
|
| |||
| Wildtypeb | |||
| Vm2 (nmoL/min) | 15.0 | 15.3 | 8.6 – 28.3 |
| Km2 (μM) | 27.1 | 28.0 | 16.8 – 46.9 |
| V1 (mL) | 3.43 | 3.44 | 3.05 – 3.82 |
| Q (mL/min)a | 0.599 | 0.608 | 0.429 – 0.807 |
| V2 (mL) | 5.98 | 5.89 | 4.65 – 7.58 |
| K10 (min−1) | 0.111 | 0.110 | 0.089 – 0.163 |
| ETA (V1) | 0.056 | 0.054 | 0.024 – 0.087 |
| ETA (V2) | 0.181 | 0.178 | 0.121 – 0.233 |
| Proportional error | 0.070 | 0.069 | 0.126 – 0.197 |
| OFV | 516.6 | 520.4 | 498.9 – 541.5 |
Q = V1K12 = V2K21
In determining the estimates in wildtype mice, Vm1 = 17.6 nmol/min and Km1 = 37.1 μM, as determined previously in Pept2 knockout mice.
To assess predictive performance of the final pharmacokinetic model, a prediction-corrected visual predictive check of cefadroxil plasma concentration-time profiles was performed using 1,000 data set simulations (Fig. 3). The median, 5th and 95th percentiles of simulated concentrations were calculated at each time point and then checked by visual inspection to compare how the simulated results overlap with the observed data. As shown, approximately 90% of observed data fall into the region covered by 5th and 95th percentiles of simulated data, thus, indicating that the final models adequately predict the observed plasma concentrations of cefadroxil with respect to the average (median) and the spread of the data (prediction interval).
Figure 3.

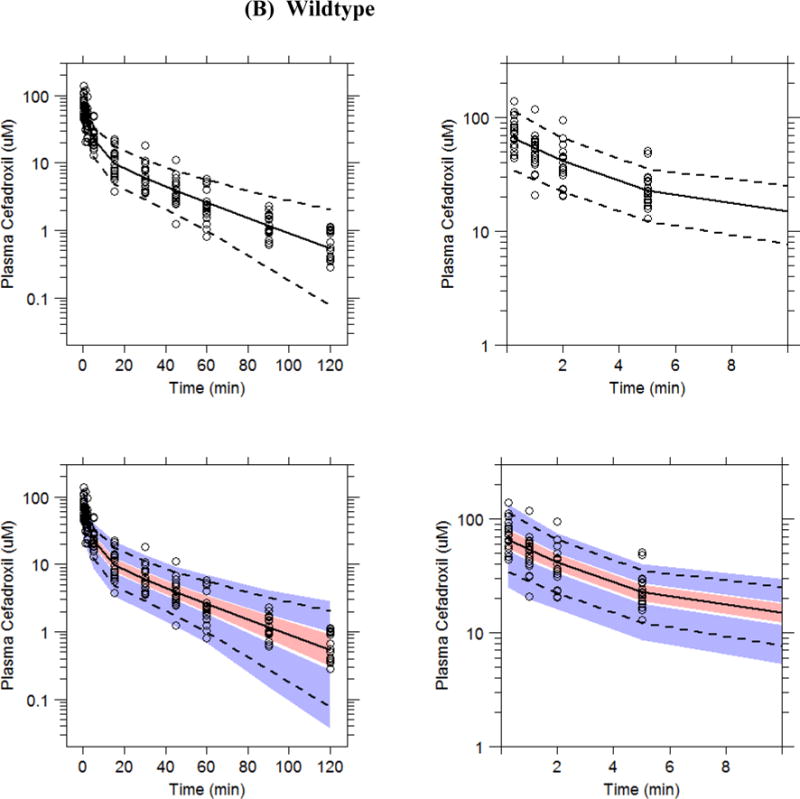
Prediction-corrected visual predictive check plots of cefadroxil in Pept2 knockout (A) and wildtype (B) mice in which the x-axis is shown over 120 min (left-sided panels) and over 10 min (right-sided panels). Plasma concentration-time profiles (normalized for dose according to Bergstrand et al., 2011) are displayed in which the circles represent prediction corrected observed data. Dashed lines represent the 5th and 95th percentiles and solid lines the median values of 1,000 simulated data sets. Pink fields represent a simulation-based 90% confidence interval for the median and blue fields a simulation-based 90% confidence interval for the 5th and 95th percentiles of the simulated datasets. Refer to Figure 2 for the actual intravenous bolus doses of drug.
Discussion
The pharmacodynamic response to an antibacterial agent is largely determined by the antibacterial activity of the drug, which depends on its exposure at pharmacological target sites and pharmacokinetic profiles. Therefore, in-depth understanding of the pharmacokinetic profiles and its disposition mechanism(s) is crucial to determine optimal dosage regimens for achieving ideal antibacterial effects in patients. It is of interest that several contradictory studies on cefadroxil pharmacokinetics have been reported in humans and animals (Garcia-Carbonell et al., 1993; Marino and Domingurz-Gil, 1980; Santella and Henness, 1982; Garrigues et al., 1991; La Rosa et al., 1982; Posada and Smith, 2013). Some studies described a dose-linearity in pharmacokinetics, whereas others found dose-dependent changes in pharmacokinetic profiles. Regardless, the molecular mechanisms that affected the pharmacokinetics and tissue distribution of cefadroxil were lacking until our recent studies in genetically modified mice (Shen et al., 2007; Kamal et al., 2008; Shen et al., 2003). Due to the availability of Pept2 knockout mice, we were able to elucidate the role and relevance of this oligopeptide transporter in the renal and systemic disposition of cefadroxil in wildtype mice and during PEPT2 ablation (Shen et al., 2007). Our experimental data clearly demonstrated that PEPT2, as opposed to PEPT1, had a predominant role in the renal tubular reabsorption of cefadroxil, accounting for 95% of the drug’s reabsorption in kidney. Moreover, even though the disposition kinetics of cefadroxil were clearly nonlinear over the dose range studied, the degree of nonlinearity observed in wildtype mice was difficult to discern due to the opposing effects of renal tubular secretion and reabsorption on plasma concentrations of drug. In fact, because the transport kinetics (i.e., Vm and Km) of cefadroxil were not characterized, for either secretory or reabsorptive transport, predictability of dose-response relationships was not possible.
In the present report, several new findings were revealed. In particular, this was the first study to examine a semi-mechanistic population pharmacokinetic model of cefadroxil transport in kidney. We also quantified the secretion kinetics (i.e., Vm1 = 17.6 nmoL/min and Km1 = 37.1 μM) and reabsorption kinetics (i.e., Vm2 = 15.0 nmoL/min and Km2 = 27.1 μM) of cefadroxil in kidney under in vivo conditions. In doing so, the potential for capacity-limited transport of cefadroxil can be better predicted and, thus, result in an optimized host response to invading bacteria. For example, plasma concentrations produced at the 1 nmoL/g intravenous dose of cefadroxil were approximately 0.01–10 μM, values that fall into the range of minimal inhibitory concentrations for most, but not all, bacteria (Harstein et al., 1977; Courtieu and Drugeon, 1983). By defining the entire pharmacokinetic profile of cefadroxil, relevant concentrations in plasma (and urine) can now be determined across a wide range of doses, a priori, and compared to bacterial susceptibility for a more favorable drug response.
The renal clearance of cefadroxil is governed by three processes, which are glomerular filtration, renal tubular secretion, and renal tubular reabsorption. Since renal clearance, glomerular filtration and fraction unbound in plasma can be determined, and given the (almost) exclusive reabsorption of drug by PEPT2 in kidney (Shen et al., 2007), it was possible to estimate the OAT-mediated nonlinear and linear contributions (i.e., 62% and 38%, respectively) to cefadroxil renal excretion in Pept2 knockout mice. In the present study, we found the Km1 for OAT vectorial secretion to equal 37.1 μM, a value much lower than the millimolar values of IC50 and/or Ki reported previously for cefadroxil in renal proximal tubule cells expressing rat OAT1-3 (Jung et al., 2002; Khamdang et al., 2003) and human OAT1-4 (Khamdang et al., 2003; Takeda et al., 2002). Although speculative, this disparity may result from the different species and experimental systems being employed. Moreover, IC50 and Ki values obtained from the in vitro inhibition of a model substrate by cefadroxil do not necessarily represent the Km values of cefadroxil obtained under in vivo physiological conditions. On the other hand, the Km2 value of 27.1 μM for vectorial reabsorption of cefadroxil was in good agreement with other investigators, who reported Km values for cefadroxil of 9 μM in rat kidney brush border membrane vesicles (Ries et al., 1994), 17 μM (Shen et al., 2005) and 27 μM (Ocheltree et al., 2004) in rat isolated choroid plexus, 39 μM in rat choroid plexus primary cell cultures (Shen et al., 2005) and 32 μM in rabbit PEPT2-expressing Xenopus oocytes (Boll et al., 1996). It should be appreciated that cefadroxil is reabsorbed from luminal fluid by PEPT2 localized on the apical membrane of renal proximal tubule cells. Therefore, the estimated Km2 is an apparent value in which plasma concentrations were used as surrogate values for drug concentrations in luminal fluid at the transport membrane site in order to fit the model. Notwithstanding this uncertainty, these two biological fluids are likely close in value since cefadroxil is 80% unbound in plasma (Shen et al., 2007).
Many studies have shown transporters to be major determinants of the pharmacokinetic, safety and efficacy profiles of drugs. In this regard, the proton-coupled oligopeptide transporter PEPT2 had significant effects on peptide-like drug disposition as well as drug action and toxicity (Hu et al., 2007; Kamal et al., 2008). On the other hand, these potential effects could be affected by a variety of endogenous and exogenous regulation factors on PEPT2 (e.g., drug-drug interactions, hormones, diet and nutritional status, and genetic polymorphism) (Smith et al., 2013). Among these factors, single nucleotide polymorphisms of drug transporters, identified by advanced sequencing technology, appear to be responsible for the variation in drug responses among individuals (Evans and Relling, 1999; Evans and McLeod, 2003). Genetic variants of the PEPT2 gene have been reported in humans with functional polymorphisms (Pinsonneault et al., 2004; Terada et al., 2004; Liu et al., 2011). For example, Terada et al. (2004) found that the genetic variant R57H of PEPT2 completely lost its transport activity of glycylsarcosine, a substrate of PEPT2, in transfected HEK293 cells and Xenopus oocytes. In addition, the renal clearance of cephalexin (another PEPT2 substrate) was higher in healthy male Asian subjects after ammonium chloride treatment than after sodium bicarbonate treatment, a finding that was statistically significant for the PEPT2*2/*2 but not PEPT2*1/*1 haplotype (Liu et al., 2011). Based on our modeling results, we confirmed that PEPT2 played an overwhelmingly predominant role in the tubular reabsorption of cefadroxil, an aminocephalosporin peptide-like drug. Thus, it is conceivable that patients with PEPT2 deficiency may experience a substantial reduction in the reabsorption of certain drugs in kidney, thus, influencing efficacy due to decreased renal and systemic exposure.
Conclusions
The semi-mechanistic population pharmacokinetic model presented in this study in mice provides a unique tool to quantitatively predict the transporter-mediated nonlinear disposition of cefadroxil. Specifically, this was the first study to quantify the secretion kinetics (i.e., Vm1 = 17.6 nmoL/min and Km1 = 37.1 μM) and reabsorption kinetics (i.e., Vm2 = 15.0 nmoL/min and Km2 = 27.1 μM) of cefadroxil in kidney under in vivo conditions. Further studies will be focused on extrapolating this model to humans once more information is gathered regarding relevant transporter expression profiles and other interspecies differences. In doing so, a physiologically based pharmacokinetic model may provide mechanistic insight and better predictability of cefadroxil pharmacokinetics, as well as the potential for transporter-mediated drug interactions.
Footnotes
Declaration of interest
Authors declare no competing interest.
References
- Barbhaiya RH. A pharacokinetic comparison of cefadroxil and cephalexin after administration of 250, 500 and 1000 mg solution doses. Biopharm Drug Dispos. 1996;17:319–30. doi: 10.1002/(SICI)1099-081X(199605)17:4<319::AID-BDD957>3.0.CO;2-W. [DOI] [PubMed] [Google Scholar]
- Beal SL, Sheiner LB. NONMEM Users Guide: users basic guide April 1980. University of California Press; 1984. [Google Scholar]
- Bergstrand M, Hooker AC, Wallin JE, Karlsson MO. Prediction-corrected visual predictive checks for diagnosing nonlinear mixed-effects models. AAPS J. 2011;13:143–51. doi: 10.1208/s12248-011-9255-z. [DOI] [PMC free article] [PubMed] [Google Scholar]
- Boll M, Herget M, Wagener M, Weber WM, Markovich D, Biber J, Clauss W, Murer H, Daniel H. Expression cloning and functional characterization of the kidney cortex high-affinity proton-coupled peptide transporter. Proc Natl Acad Sci U S A. 1996;93:284–9. doi: 10.1073/pnas.93.1.284. [DOI] [PMC free article] [PubMed] [Google Scholar]
- Buck RE, Price KE. Cefadroxil, a new broad-spectrum cephalosporin. Antimicrob Agents Chemother. 1977;11:324–30. doi: 10.1128/aac.11.2.324. [DOI] [PMC free article] [PubMed] [Google Scholar]
- Courtieu AL, Drugeon H. Compared sensitivities of 532 bacterial strains to six cephalosporins. Int J Clin Pharmacol Res. 1983;3:195–201. [PubMed] [Google Scholar]
- Daniel H, Kottra G. The proton oligopeptide cotransporter family SLC15 in physiology and pharmacology. Pflugers Arch. 2004;447:610–8. doi: 10.1007/s00424-003-1101-4. [DOI] [PubMed] [Google Scholar]
- Evans WE, Relling MV. Pharmacogenomics: translating functional genomics into rational therapeutics. Science. 1999;286:487–91. doi: 10.1126/science.286.5439.487. [DOI] [PubMed] [Google Scholar]
- Evans WE, McLeod HL. Pharmacogenomics–drug disposition, drug targets, and side effects. N Engl J Med. 2003;348:538–49. doi: 10.1056/NEJMra020526. [DOI] [PubMed] [Google Scholar]
- Ganapathy ME, Brandsch M, Prasad PD, Ganapathy V, Leibach FH. Differential recognition of beta -lactam antibiotics by intestinal and renal peptide transporters, PEPT 1 and PEPT 2. J Biol Chem. 1995;270:25672–7. doi: 10.1074/jbc.270.43.25672. [DOI] [PubMed] [Google Scholar]
- Ganapathy ME, Huang W, Wang H, Ganapathy V, Leibach FH. Valacyclovir: a substrate for the intestinal and renal peptide transporters PEPT1 and PEPT2. Biochem Biophys Res Commun. 1998;246:470–5. doi: 10.1006/bbrc.1998.8628. [DOI] [PubMed] [Google Scholar]
- Garcia-Carbonell MC, Granero L, Torres-Molina F, Aristorena JC, Chesa-Jimenez J, Pla-Delfina JM, Peris-Ribera JE. Nonlinear pharmacokinetics of cefadroxil in the rat. Drug Metab Dispos. 1993;21:215–7. [PubMed] [Google Scholar]
- Garrigues TM, Martin U, Peris-Ribera JE, Prescott LF. Dose-dependent absorption and elimination of cefadroxil in man. Eur J Clin Pharmacol. 1991;41:179–83. doi: 10.1007/BF00265914. [DOI] [PubMed] [Google Scholar]
- Hartstein AI, Patrick KE, Jones SR, Miller MJ, Bryant RE. Comparison of pharmacological and antimicrobial properties of cefadroxil and cephalexin. Antimicrob Agents Chemother. 1977;12:93–7. doi: 10.1128/aac.12.1.93. [DOI] [PMC free article] [PubMed] [Google Scholar]
- Hu Y, Shen H, Keep RF, Smith DE. Peptide transporter 2 (PEPT2) expression in brain protects against 5-aminolevulinic acid neurotoxicity. J Neurochem. 2007;103:2058–2065. doi: 10.1111/j.1471-4159.2007.04905.x. [DOI] [PubMed] [Google Scholar]
- Huh Y, Hynes SM, Smith DE, Feng MR. Importance of peptide transporter 2 on the cerebrospinal fluid efflux kinetics of glycylsarcosine characterized by nonlinear mixed effects modeling. Pharm Res. 2013;30:1423–34. doi: 10.1007/s11095-013-0980-0. [DOI] [PMC free article] [PubMed] [Google Scholar]
- Hurtado FK, Weber B, Derendorf H, Hochhaus G, Dalla Costa T. Population pharmacokinetic modeling of the unbound levofloxacin concentrations in rat plasma and prostate tissue measured by microdialysis. Antimicrob Agents Chemother. 2014;58:678–86. doi: 10.1128/AAC.01884-13. [DOI] [PMC free article] [PubMed] [Google Scholar]
- Inui K, Tomita Y, Katsura T, Okano T, Takano M, Hori R. H+ coupled active transport of bestatin via the dipeptide transport system in rabbit intestinal brush-border membranes. J Pharmacol Exp Ther. 1992;260:482–6. [PubMed] [Google Scholar]
- Jung KY, Takeda M, Shimoda M, Narikawa S, Tojo A, Kim DK, Chairoungdua A, Choi BK, Kusuhara H, Sugiyama Y, Sekine T, Endou H. Involvement of rat organic anion transporter 3 (rOAT3) in cephaloridine-induced nephrotoxicity: in comparison with rOAT1. Life Sci. 2002;70:1861–74. doi: 10.1016/s0024-3205(02)01500-x. [DOI] [PubMed] [Google Scholar]
- Kamal MA, Keep RF, Smith DE. Role and relevance of PEPT2 in drug disposition, dynamics, and toxicity. Drug Metab Pharmacokinet. 2008;23:236–42. doi: 10.2133/dmpk.23.236. [DOI] [PMC free article] [PubMed] [Google Scholar]
- Keizer RJ, Karlsson MO, Hooker A. Modeling and Simulation Workbench for NONMEM: Tutorial on Pirana, PsN, and Xpose. CPT Pharmacometrics Syst Pharmacol. 2013;2:e50. doi: 10.1038/psp.2013.24. [DOI] [PMC free article] [PubMed] [Google Scholar]
- Khamdang S, Takeda M, Babu E, Noshiro R, Onozato ML, Tojo A, Enomoto A, Huang XL, Narikawa S, Anzai N, Piyachaturawat P, Endou H. Interaction of human and rat organic anion transporter 2 with various cephalosporin antibiotics. Eur J Pharmacol. 2003;465:1–7. doi: 10.1016/s0014-2999(03)01381-5. [DOI] [PubMed] [Google Scholar]
- La Rosa F, Ripa S, Prenna M, Ghezzi A, Pfeffer M. Pharmacokinetics of cefadroxil after oral administration in humans. Antimicrob Agents Chemother. 1982;21:320–2. doi: 10.1128/aac.21.2.320. [DOI] [PMC free article] [PubMed] [Google Scholar]
- Lindbom L, Ribbing J, Jonsson EN. Perl-speaks-NONMEM (PsN)–a Perl module for NONMEM related programming. Comput Methods Programs Biomed. 2004;75:85–94. doi: 10.1016/j.cmpb.2003.11.003. [DOI] [PubMed] [Google Scholar]
- Liu R, Tang AM, Tan YL, Limenta LM, Lee EJ. Effects of sodium bicarbonate and ammonium chloride pre-treatments on PEPT2 (SLC15A2) mediated renal clearance of cephalexin in healthy subjects. Drug Metab Pharmacokinet. 2011;26:87–93. doi: 10.2133/dmpk.dmpk-10-rg-039. [DOI] [PubMed] [Google Scholar]
- Lode H, Stahlmann R, Koeppe P. Comparative pharmacokinetics of cephalexin, cefaclor, cefadroxil, and CGP 9000. Antimicrob Agents Chemother. 1979;16:1–6. doi: 10.1128/aac.16.1.1. [DOI] [PMC free article] [PubMed] [Google Scholar]
- Marino EL, Dominguez-Gil A. Influence of dose on the pharmacokinetics of cefadroxil. Eur J Clin Pharmacol. 1980;18:505–9. doi: 10.1007/BF00874664. [DOI] [PubMed] [Google Scholar]
- Nightingale C. Pharmacokinetics of the oral cephalosporins in adults. J Int Med Res. 1980;8:2–8. [PubMed] [Google Scholar]
- Ocheltree SM, Shen H, Hu Y, Xiang J, Keep RF, Smith DE. Mechanisms of cefadroxil uptake in the choroid plexus: studies in wild-type and PEPT2 knockout mice. J Pharmacol Exp Ther. 2004;308:462–7. doi: 10.1124/jpet.103.060400. [DOI] [PubMed] [Google Scholar]
- Pinsonneault J, Nielsen CU, Sadee W. Genetic variants of the human H+/dipeptide transporter PEPT2: analysis of haplotype functions. J Pharmacol Exp Ther. 2004;311:1088–96. doi: 10.1124/jpet.104.073098. [DOI] [PubMed] [Google Scholar]
- Posada MM, Smith DE. In vivo absorption and disposition of cefadroxil after escalating oral doses in wild-type and PepT1 knockout mice. Pharm Res. 2013;30:2931–9. doi: 10.1007/s11095-013-1168-3. [DOI] [PMC free article] [PubMed] [Google Scholar]
- Ries M, Wenzel U, Daniel H. Transport of cefadroxil in rat kidney brush-border membranes is mediated by two electrogenic H+-coupled systems. J Pharmacol Exp Ther. 1994;271:1327–33. [PubMed] [Google Scholar]
- Ripa S, Prenna M. Laboratory studies with BL-S 578 (Cefadroxil) a new broad-spectrum orally active cephalosporin. Chemotherapy. 1979;25:9–13. doi: 10.1159/000237816. [DOI] [PubMed] [Google Scholar]
- Rodriguez L, Batlle A, Di Venosa G, MacRobert AJ, Battah S, Daniel H, Casas A. Study of the mechanisms of uptake of 5-aminolevulinic acid derivatives by PEPT1 and PEPT2 transporters as a tool to improve photodynamic therapy of tumours. Int J Biochem Cell Biol. 2006;38:1530–9. doi: 10.1016/j.biocel.2006.03.002. [DOI] [PubMed] [Google Scholar]
- Ruiz-Carretero P, Merino-Sanjuan M, Nacher A, Casabo VG. Pharmacokinetic models for the saturable absorption of cefuroxime axetil and saturable elimination of cefuroxime. Eur J Pharm Sci. 2004;21:217–23. doi: 10.1016/j.ejps.2003.10.006. [DOI] [PubMed] [Google Scholar]
- Santella PJ, Henness D. A review of the bioavailability of cefadroxil. J Antimicrob Chemother. 1982;10(Suppl B):17–25. doi: 10.1093/jac/10.suppl_b.17. [DOI] [PubMed] [Google Scholar]
- Shen H, Keep RF, Hu Y, Smith DE. PEPT2 (Slc15a2)-mediated unidirectional transport of cefadroxil from cerebrospinal fluid into choroid plexus. J Pharmacol Exp Ther. 2005;315:1101–8. doi: 10.1124/jpet.105.090654. [DOI] [PubMed] [Google Scholar]
- Shen H, Ocheltree SM, Hu Y, Keep RF, Smith DE. Impact of genetic knockout of PEPT2 on cefadroxil pharmacokinetics, renal tubular reabsorption, and brain penetration in mice. Drug Metab Dispos. 2007;35:1209–16. doi: 10.1124/dmd.107.015263. [DOI] [PubMed] [Google Scholar]
- Shen H, Smith DE, Keep RF, Xiang J, Brosius FC., 3rd Targeted disruption of the PEPT2 gene markedly reduces dipeptide uptake in choroid plexus. J Biol Chem. 2003;278:4786–91. doi: 10.1074/jbc.M207397200. [DOI] [PubMed] [Google Scholar]
- Shitara Y, Sato H, Sugiyama Y. Evaluation of drug-drug interaction in the hepatobiliary and renal transport of drugs. Annu Rev Pharmacol Toxicol. 2005;45:689–723. doi: 10.1146/annurev.pharmtox.44.101802.121444. [DOI] [PubMed] [Google Scholar]
- Smith DE, Clemencon B, Hediger MA. Proton-coupled oligopeptide transporter family SLC15: physiological, pharmacological and pathological implications. Mol Aspects Med. 2013;34:323–36. doi: 10.1016/j.mam.2012.11.003. [DOI] [PMC free article] [PubMed] [Google Scholar]
- Takeda M, Babu E, Narikawa S, Endou H. Interaction of human organic anion transporters with various cephalosporin antibiotics. Eur J Pharmacol. 2002;438:137–42. doi: 10.1016/s0014-2999(02)01306-7. [DOI] [PubMed] [Google Scholar]
- Tanrisever B, Santella PJ. Cefadroxil. A review of its antibacterial, pharmacokinetic and therapeutic properties in comparison with cephalexin and cephradine. Drugs. 1986;32(Suppl 3):1–16. doi: 10.2165/00003495-198600323-00003. [DOI] [PubMed] [Google Scholar]
- Terada T, Irie M, Okuda M, Inui K. Genetic variant Arg57His in human H+/peptide cotransporter 2 causes a complete loss of transport function. Biochem Biophys Res Commun. 2004;316:416–20. doi: 10.1016/j.bbrc.2004.02.063. [DOI] [PubMed] [Google Scholar]